Abstract
Developments in mountain areas prone to natural hazards produce undesired impacts and damages. Thus, disaster assessment is mandatory to understand the physics of dangerous events and to make decisions to prevent hazardous situations. This work focusses on the practical implementation of methods and tools to assess a snow avalanche that affected a road at the Coll de Pal in 2018 (SE Pyrenees). This is a quite common situation in mountain roads and the assessment has to focus specially in the avalanche–road interaction, on the return periods considered and on the dynamics of the phenomena. This assessment presents the field recognition, snow and weather characterization and numerical modelling of the avalanche. Field campaigns revealed evidences of the avalanche triggering, runout trajectory and general behavior. An unstable situation of the snowpack due to a relatively large snowfall fallen some days before over a previous snowpack with weak layers, caused the avalanche triggering when an additional load was added by a strong wind-drift episode. A medium size (<2500 m3) soft slab avalanche, corresponding to a return period of 15–20 years, occurred and crossed the road of the Coll de Pal pass. The event was reproduced numerically by means of the 2D-SWE based numerical tool Iber aiming to analyze the avalanche behavior. Results of the simulation corresponded with the observations (runout trajectory and snow deposit); thus, relevant information about the avalanche dynamics could be obtained. Identified differences probably come from the terrain elevation data, which represent “snow free” topography and do not consider the snowpack on the terrain.
1. Introduction
The majority of the recorded natural disasters worldwide (90%) during the period 1995–2015 were weather-related [1]. According to the Emergency Events Database, EM-DAT [2], snowfall and snow avalanches are considered natural hazard belonging to hydro-meteorological events. Snow avalanches have caused, and cause, important damages, especially in mountain areas; thus, hazard assessment and prevention to reduce the associated risk become mandatory [3,4,5,6,7,8,9,10,11,12,13,14].
Snow avalanche recording started at the end of the 19th century in the Swiss (1888) and French Alps (1899) [11], and later in other regions worldwide, such as the southern side of the Pyrenees [15]. Since that, several national and regional databases and guidelines for practitioners have been developed. This recording consists of collecting evidence of the avalanches that occurred from the starting zone to the deposit, besides other relevant information of the runout zone. These tasks are often difficult due to accessibility and adverse weather conditions during and after the event, which can hide these evidences. When possible, the avalanche is mapped, measured and characterized [4].
From the viewpoint of their dynamics, snow avalanches have been traditionally classified as dense-type or powder-type [16]. However, dry-snow avalanches are often not purely any of the previous types, as they consist of a powder cloud but with a dense core below (mixed-motion avalanches). This fact makes an additional difficulty on assessing its hazard because they behave differently and, thus, different approaches must be required.
In general, hazard assessment of a particular avalanche path requires several steps. First, the characterization of inherent terrain factors (e.g., slope, elevation, orientation, roughness, and morphology of the path, etc.). Then, instability and the avalanche triggering factors must be considered and evaluated considering the snowpack properties and weather condition evolution. To do this, winter surveying and snow avalanche mapping and characterization are essential works. They provide the probability of occurrence of the event and basic data that allow improving the tools used for avalanche hazard mapping and forecasting in mountainous areas, such as numerical modelling. Additionally, a survey is advisable in summer time, when there is over, to map avalanche effects on trees or infrastructures if any.
Avalanche events recording and characterizing, together with other information sources (historical and witness information, dendrogeomorphology analysis, statistical treatment of snow and weather data), allow hazard mapping. Additionally, it provides relevant information to feed and calibrate numerical models, which allow not only diagnose past events but also prognose hypothetic or future ones [12,13,17,18,19,20,21,22].
The growing concerns about natural hazards, in particular snow avalanches, have led to the development of ad hoc numerical models as support tools for their analysis [13,14,19,23,24]. Depending on the avalanche type and the kind of spatial discretization used, different numerical approaches are more appropriate than others. Currently there is a wide range of numerical tools: from the simplest one-dimensional model (1D) firstly developed in [25,26]; to complex three-dimensional (3D) smooth particle hydrodynamics-based models [27,28] recently applied to snow avalanches [29].
Particularly for dense snow avalanches, two-dimensional (2D) models are suitable solutions in most cases. They discretize more accurately the spatial domain with a mesh of elements (instead of cross-sections in the 1D approach), which represents the topography in a 3D space. Thus, the 2D approach improves not only the representation of the avalanche dynamics but also its final position [30,31] and, thanks to the current computational techniques, with a reasonable computation effort.
This work is a contribution dealing with the practical implementation and validation of methods commonly used in snow avalanche characterization and hazard assessment, through the reconstruction of the snow avalanche at the Coll de Pal (SE Pyrenees) that occurred on 10th February 2018 and that affected a road. To do this, field campaigns were carried out a few days after the event. However, the event was mapped only partially due to difficulties to access and evidence concealment caused by adverse meteorological conditions the days after. For this reason, hazard mapping was completed by summer fieldwork and using numerical modelling techniques. A numerical model was forced with the results of the fieldwork allowing to evaluate the avalanche dynamics behavior. Small differences were found between the simulation and the observations, both being different from the expected deposition area based on the existing snow avalanche database.
2. Materials and Methods
2.1. Coll de Pall Snow Avalanche
Coll de Pal is a mountain pass (2106 m.a.s.l.) located at the southeast part of the Pyrenees range (Figure 1a). The road BV-4024 that crosses the pass is usually exposed to snow avalanches during the winter season. This road accesses to the ski resort of the Coll de Pal and it is also the southern access of the La Molina ski resort.
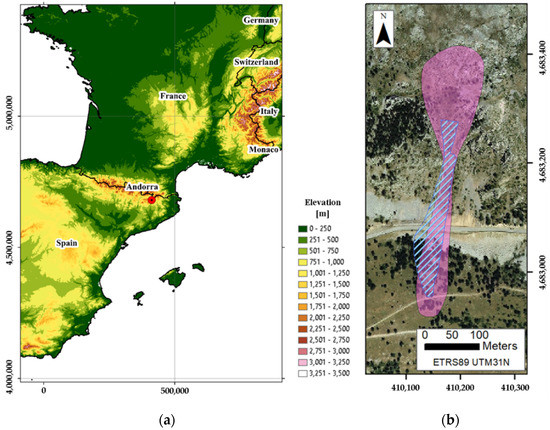
Figure 1.
General location (red point) of the Coll de Pal pass (background image source: ESRI) (a). Representation of the potential release, runout and deposition area RIT051 (magenta polygon) where avalanches generally occur (as it was stored in the BDAC [32,33,34]), and recorded runout and deposition area of the event (blue stripped polygon) (background image source: Institut Cartogràfic i Geològic de Catalunya (CC by 4.0)) (b).
On 10th February 2018, an avalanche occurred at the area known as Rocs de la Bòfia, between 1900 and 2200 m.a.s.l. The avalanche flowed from a triggering area placed above the road and then stopped several meters below the road. Fortunately, the avalanche did not cause damages because the road was previously closed by the road manager, Diputació de Barcelona (DIBA), based on the local forecast that this institution carries out.
2.2. Event Characterization
Two days after the event, a field survey was carried out by the road avalanche forecasting service to map and characterize the event. In spring-summer 2019, another field survey was performed to compile other information not identified in winter and to look for avalanche evidence on trees. Results of both campaigns are presented in the following sections.
2.2.1. Avalanche Path
The area where the avalanche occurred belongs to the so-called RIT051 avalanche path (Figure 1b, magenta polygon), which is included in the Avalanche Database of Catalonia, BDAC [32,33,34], that was originally mapped at 1:25,000 scale. It is a slope oriented towards the south. Potential triggering zones are located between 2075 and 2200 m.a.s.l. with a mean slope of 37°. Land use is characterized by regular rocky slope limited by rocky ridges, with sparse small pines and herbaceous vegetation.
The avalanche path narrows due to the Rocs of la Bòfia gully and widens again on a scree slope with a mean slope angle of 34° until the road at 1970 m.a.s.l. At this place, the hill side suddenly becomes almost flat for 8 to 12 m (road) and it is the place where small avalanches usually stop. Avalanches that have enough energy to cross the road reach again the natural grassy slope with forest composed of pines of a mature age. The mean angle of this area is 18°, decreasing to 12° below 1900 m.a.s.l., at the end of the slope. Before the February 2018 event, avalanches crossed the road twice since the decade of 1980 but detailed information about these events is not available.
2.2.2. Snow and Meteorological Conditions
The event took place after a wind episode preceded by a snowfall in a context of relatively low temperatures. Preceding the snowfall, the snowpack was very thin and non-continuous at the elevations where the avalanche occurred. It had a maximum depth of around 0.5 m and was composed of a base layer with faceted grains and a hard crust of some centimeters on top, not fully developed at the elevation of the starting zone of the avalanche (around 2200 m.a.s.l.). Daily air temperatures were below zero, reaching minimum values around −15 °C.
Two snowfall days, 5th February and 6th February, accumulated 0.6 m and 0.3 m of snow, respectively. The air temperature was similar than the days before but there was a southeast wind with gusts reaching 70 km/h. When it stopped snowing, a small avalanche deposit was observed on the road, at the place where the larger avalanche analyzed occurred. After that, there were three calm, sunny days and weak wind from the north, and maximum and minimum daily temperatures around −8 °C and −15 °C, respectively. This fact favored the snow transformation to non-cohesive grains, particularly on the snowpack surface.
On 8th February, a snow profile was completed on the potential triggering zone of the avalanche path RIT051, at 2200 m.a.s.l., in a slope facing SW (see Appendix A). The profile shows a typical unstable structure with a 0.3 m thick slab at the top and faceted non-cohesive layers below with a significant temperature gradient (0.26 °C/cm). Stability tests provided positive results in the faceted layers (applying the Extended Column Test, ECT [35], the failure traveled across the entire column on the tap 14).
During 9th and 10th February, another wind episode from the north took place with gusts that reached 100 km/h. The large amount of new snow fallen during February 5th and 6th, which remained dry and non-cohesive due to the low temperatures, had drifted by the wind to the south. The triggering zone of the avalanche, facing south, was probably overloaded with a new amount of snow. As it is well known, the most common trigger for natural dry slab avalanches is addition of weight [36]. In this case, the addition of load by the snowfall and the snowdrift most likely broke the equilibrium of the snowpack with a precarious stability, shown two days before by the stability tests, and caused the avalanche release.
2.2.3. Avalanche Characteristics and Behavior
The avalanche forecasting team was able to inspect the avalanche two days after the event. Evidence of the avalanche was not entirely visible since the wind kept blowing some hours after the avalanche occurrence and covered partially with snow part of the crown and the deposit. At the release area, the right flank of the slab was still visible below the scattered pines (Figure 2).
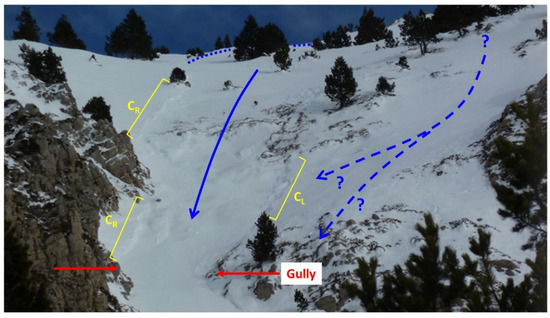
Figure 2.
Photography of the release area taken two days after the event. Solid yellow lines remark the observable left (CL) and right (CR) flanks; whereas the dotted blue line estimates the approximate crown location of the release area. The continuous blue arrow indicates the main trajectory of the avalanche and the hatched blue arrows indicate possible (but not likely considering the summer field survey) adjacent avalanche trajectories. Red arrows signal the starting zone of the gully area.
On the slope just below the release area, the hard-crusted layer previous to the snowfall was exposed. Part of the avalanche was deposited on the road (Figure 3), spreading over an around 10 m long and 45 m wide area. The deposit surface was smooth with several ridges parallel to the flow direction like levees, probably modified by the wind.
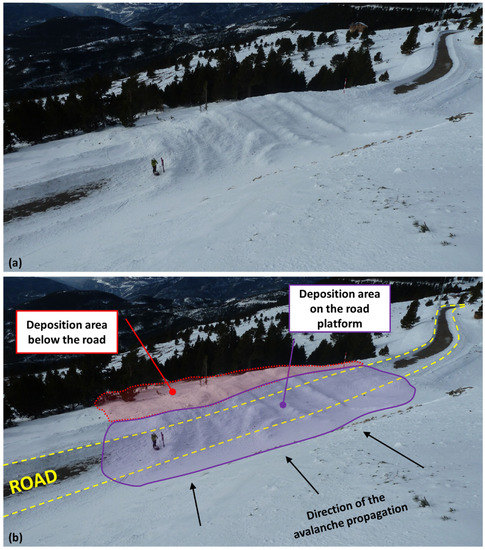
Figure 3.
Photography of the deposition area taken from the track zone downwards to the runout zone two days after the event from the left side of the runout area, in the upper hill slope of the road (a). Same image in which some aspects of the avalanche have been highlighted (b).
Below the road, the deposit covered 120 m downslope. Here, the depth of the deposit decreased from the top of the slope to the bottom, but, in general, it was not more than 0.5 m. The surface of the deposited snow was rough, with lumps and small fragments of pine branches (centimetric to decimetric, Figure 4) and some entire branches that were transported from the upper part of the deposit. No branch fragments were found outside the deposit. Damages on trees below the road were mainly produced by the dense flow.
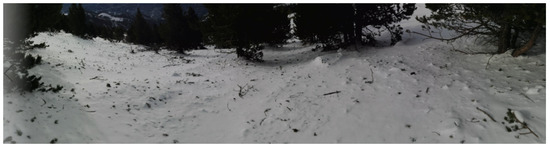
Figure 4.
Down-slope view detail of the surface of the avalanche deposit below the road.
Inspection revealed that the avalanche was potentially triggered at an elevation of around 2145 m.a.s.l., and stopped several meters below the road, at 1930 m.a.s.l. Only the runout and deposit areas were mapped (Figure 1b, blue polygon) because of the difficulties with accessing the release area. Some snow depth proofs were performed on the road revealing a mean depth of 1.5 m and a maximum of 2.5 m at the west side. The affected length was estimated in 370 m with vertical drop of 215 m. The avalanche volume was not larger than 2500 m3. According to the European Avalanche Warning Services classification [37], this is an avalanche size 2+ (medium plus).
The avalanche of 10 February 2018 can be considered as a soft slab avalanche [38], sliding as a dense flow due to: the meteorological conditions before and during the event, the properties and structure of the snowpack, the release of a slab, the quite clear delimitation of the avalanche deposit, the existence of a layer of small branch fragments covering homogeneously the deposit below the road but not outside the deposit, and the thickness and structure of the deposit over the road. Even though the snow entrainment had to occur in this avalanche event because of the cold, light snow, it does not seem meaningful because the track zone is quite short, steep and narrow. These characteristics do not favor large or significant entrainment and, consequently, it has not been considered hereinafter.
A particularity of this event was the sudden slope change caused by the existence of the road, but also the presence of road fences at the outer border of the road. When the snow avalanche reached the road and the road fences, a large part stopped there. However, the rest of the flowing avalanche crossed the road and partially generated a powder cloud because of the impact on the road fences and the abrupt slope break, which forced the avalanche to jump and compelled the snow to go into suspension. Cold conditions (−11 °C) and light snow probably made this change of behavior possible. For this reason, the deposit below the road was more irregular, with lumps and small pine branches broken by the dense component and transported by the powder cloud. A video taken at the Port de la Bonaigua pass [39], in the Central Pyrenees, is an example of the explained behavior change, which most likely occurred in the Coll de Pal in 2018.
2.2.4. Estimation of the Return Period
The return period of the 2018 snow avalanche of the Coll de Pal has been estimated through the evidence registered during the field campaigns and historical data.
According to Burkard and Salm [40], the so-called DH3dd parameter is the snow depth susceptible to generate avalanches, and that is defined as the difference between the mean snow depth of a given day and the mean snow depth of the three previous days. To that end, the meteorological gauge station “Cadí Nord”, located 16.5 km to the west, was considered as representative for the snow and weather characteristics of the Coll de Pal area. This gauge station belongs to the Meteorological Survey of Catalonia, registering data since 2003. The highest snow depth was selected for each one of the 16 winters (from 2003 to 2019). A Gumbel probabilistic distribution [41] was applied to associate the snow depth that is susceptible to generate avalanches to a particular return period.
Considering that the DH3dd at the “Cadi Nord” gauge station was 0.84 m on 6th February, the return period of the three-day snowfall was of 15–20 years. Contrasting this information with the road maintenance service, despite the information is unclear, it seems that a similar avalanche occurred before 2000. Thus, the return period for this avalanche was estimated in 15–20 years.
2.3. Numerical Modelling
The numerical tool Iber [42] was used aiming to reproduce and to complete hazard mapping of the event. Iber is a free surface hydraulic numerical model [43,44,45,46,47,48] recently enhanced to simulate non-Newtonian flows, such as muds [49], wood-laden flows [50], but also dense-snow avalanches [51,52].
Iber solves the two-dimensional depth-averaged Shallow Water Equations (2D-SWE) through a conservative finite volume scheme [53] and on unstructured meshes of triangles and/or quadrilaterals [44]. It uses a first-order Godunov-type upwind scheme for convective fluxes and the geometric slope source term, in particular the Roe scheme [54], and a centered scheme for the turbulent diffusion friction source term [55]. Therefore, the scheme achieves balancing of the bottom slope source term with the flow vector, thereby avoiding spurious oscillations of the free surface and retaining quiescent water even when working with complex irregular geometries [56].
2.3.1. Rheological Model
In the SWE for water flows the shear stress terms due to the bottom friction are expressed by means of the friction slope, which are usually represented with the Manning formula. However, for snow, other specific models are required. For such cases, Iber groups the shear stresses () as the sum of two different rheological models working together or separately: one due to frictional terms () and the other due to cohesion ().
On the one hand, the friction model proposed by Voellmy [57] is used to define the friction terms, a common model used in snow avalanches modelling [24,31,58,59,60]. This model integrates the total flow resistance as the addition of a solid phase and a turbulent friction resistance, which are associated to the dry-Coulomb friction and the flow velocity, respectively. This model, expressed as a friction slope, is:
where is the Coulomb friction coefficient, is the flow velocity, is the turbulent friction coefficient, and is flow depth.
On the other hand, the cohesion forces, a snow property that acts as an additional flow resistance, are considered through the cohesion model proposed by Bartelt et al. [61]. This model considers the effect of the cohesion as an additional shear stress linear dependent on and that multiplies a negative exponential factor, which depends on the flow depth (), density () and cohesion ():
2.3.2. Discretization and Conditions
The study area was defined as a 50 m wide offset of the RIT051 region defined in Figure 1b (magenta polygon). The spatial domain was discretized throughout an unstructured calculation mesh of irregular triangles with a mean side length of 2 m. The model had almost 60,000 elements, which is equivalent to 6,400 calculation points per ha. The most recent digital terrain model (DTM) of 2 × 2 m cell-size [62] was used as topographical data in the model (Figure 5). Certain smoothing is intrinsically applied when the calculation mesh is uploaded with topographical data. This effect may approach the smoothing generated by the snowpack, even though it does not truly reproduce the real conditions.
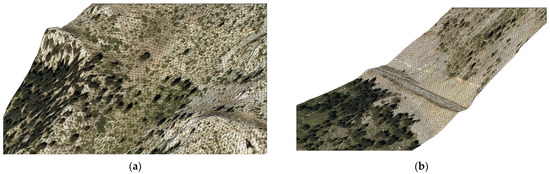
Figure 5.
Three-dimensional view of the calculation mesh of the numerical model: (a) release area; (b) slope change due to the road (background image source: Institut Cartogràfic i Geològic de Catalunya (CC by 4.0)).
The starting zone of the avalanche was determined taking into account the slope map, the terrain roughness, and the evidence from the summer field survey: trees with or without broken branches and resin excretion that indicate the avalanche impact. An initial condition of 0.84 m of snow, which is equivalent to an initial volume of 2431 m3, was imposed on the release area (Figure 6c, yellow polygon). A density of 300 kg/m3 was assumed for the fluid density because no data were available.
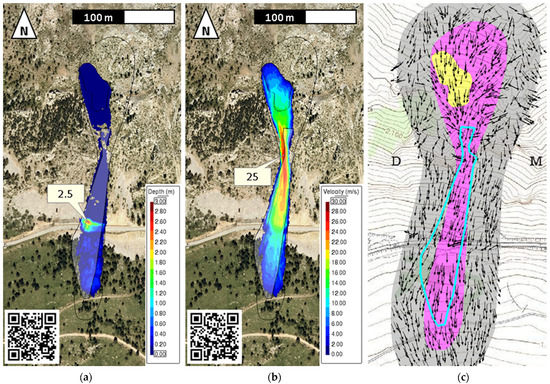
Figure 6.
Results of the avalanche numerical reconstruction (scan the QR code to see the video): (a) snow depth at the end of the simulation; (b) map of maximum velocity achieved during the avalanche. (c) Representation of the main directions of the terrain slope on the study area. The grey region is the model domain, the magenta region is the RIT051 path (BDAC), the yellow region is the release area, and the blue polygon is the observed avalanche perimeter. In (a,b), the black line represents the RIT051 region and, within it, the release area of the numerical model; the transparent-white region is the observed runout (background image source: Institut Cartogràfic i Geològic de Catalunya (CC by 4.0)).
2.3.3. Treatment of Wet-Dry Fronts
Interfaces between mesh elements that belong to the flow itself and adjacent dry ones must be properly treated numerically. Iber uses a combination of the algorithms for the wet-dry front presented by Brufau [63] and Cea [64]. To that end, an parameter defines the fluid depth threshold below which a finite volume (mesh element) is considered to be dry. Additionally, another criterion has been implemented to ensure mass conservation: when the fluid depth () in an element is lower than the threshold (), the finite volume is considered to be dry.
In this case, a depth threshold limit of 0.01 m was chosen. With this method and criteria, it is possible to ensure zero mass conservation errors due to the discretization of wet-dry fronts.
3. Results
The simulation was carried out assuming a 20-year return period. According to the recommendations of Bartelt et al. [65], the involved parameters for the rheological model were 0.34 for , 1250 m/s2 for , and 100 Pa for . Simulated results were compared to the observations.
Figure 6a shows the avalanche extend at the end of the simulation. Results agreed with the observed data (Figure 6a, white transparent polygon) with a maximum runout distance and width of 370 m and 55 m, respectively. The road had a significant effect on the avalanche trajectory and behavior due to the sudden change of slope and, to a lesser extent, due to the slope orientation. Snow was accumulated on its inner side, where a maximum simulated depth of 2.5 m was achieved on the western part. Despite the runout distance was well captured, the deposition area shifted around 15 m to the east. The snow depth on the deposition area was in general below 0.5 m, with a very few areas slightly above 0.6 m. On the transition zone, from the gully to the road, the results were within the observed perimeter (Figure 6c, blue polygon). Small differences (<5 m) were observed at the downstream half of this zone.
The numerical model also provided results of the flow velocity. Maximum velocities were obtained in the gully area, a few meters downstream of the release area, being estimated as approximately 25 m/s (Figure 6b). These velocities are within the range of this kind of avalanches [66,67,68]. A significant velocity change was produced when the flow passes over the road, from 20 to 12 m/s. This sudden slope variation (slope-flat-slope), besides changes on the main slope (from 37° to 18°), generated a loss of the avalanche energy, decreasing the velocity rapidly (the avalanche was only able to break a few tree branches under the road), and tending to stop without considering other additional criteria.
4. Discussion
The consideration of the cohesion effect in the simulation generates, besides an additional flow resistance, a long avalanche tail. This fact is clearly observed at the release area, where small amounts of snow were not mobilized, but also in the 150 m just above the road (Figure 6a). Additionally, the consideration of a very low wet-dry threshold (0.01 m) enhances not only the front propagation but also the definition of the rear and the front part of the avalanche.
The identified differences between the simulations and the observations can be attributed to the assumptions about the release area (shape, extension, and depth), but also about the topography used. The terrain elevation data used correspond to the “snow free” topography; this may differ in some areas from the one existed during the event and, thus, it could modify the avalanche bulk dynamics.
As observed during the field campaigns (see Section 2.2), the snow avalanche of the Coll de Pal was not a “full-depth avalanche”, reaching and traveling just above the ground. The terrain elevation data, although slightly smoothed (see Section 2.3.2), did not consider the slope surface modification produced by the snowpack accumulation when the avalanche occurred; this fact could condition the flow propagation because the topography can be smoother or sharper depending on the previous meteorological and snow conditions. In this sense, Figure 6c shows the slope main directions of the terrain (vectors), which are in concordance with the RIT051 area (magenta polygon) based on the “snow free” topography, and the avalanche extension observed after the event (light blue polygon) does not seem to perfectly fit with these slope directions.
Maggioni et al. [69] correlated the effect of the DTM on the results of the numerical models, especially when simulations are performed with the so called “snow free” topography instead of “not snow free” topography. Indeed, the “snow free” topography, despite being widely used because it is usually the only one available, applies only to full-depth avalanches.
5. Conclusions
This work presents the recognition and reproduction of the snow avalanche of the Coll de Pal 2018. Field campaigns allowed to determine the causes and the type of avalanche, while numerical modelling made it possible to analyze and reproduce the avalanche dynamics.
Meteorological evidence before the event revealed that the fallen snow on the starting zone of the avalanche path, which was still non-cohesive and had a precarious stability, was overloaded with a new amount of snow. This fact probably was the cause of the avalanche release.
The medium avalanche size (size 2+) that occurred on 10th February 2018 in the avalanche path RIT051 was a soft slab avalanche, sliding as a dense flow around 370 m and crossing a road, which probably modified the avalanche dynamics.
The avalanche path, deposition area and amount of retained snow on the road and on the deposition area obtained by the numerical model were adjusted to the observations. The numerical model achieved stable and consistent solutions and, furthermore, the flow stopped without considering additional criteria.
The identified differences between the observed evidence and the avalanche simulation were probably due to the terrain elevation data used in the numerical model that corresponded to the available topography, which did not consider the snowpack. Meteorology data collected before the event demonstrated that the topography could have been considerably modified. This fact is put in relevance because the simulated avalanche shifted to the east, in accordance to the observations, but in contrast to the path of the available avalanche database (RIT051). This fact highlights the necessity of updating the snow avalanche database with all the known events, which indirectly reflect the existence of a local snow-modified topography.
In summary, field campaign recognition is crucial to understand not only the whole physical process of the avalanche, including the causes of its triggering, but also to provide essential information to feed numerical models. In this case, it allowed evaluating the probability of occurrence of the event and made evident that adverse weather conditions before the event motivated the triggering of a slab avalanche. These data make it possible to reproduce numerically the event with enough confidence to analyze the bulk dynamics and also to assess its hazard.
Author Contributions
Conceptualization, M.S.-R. and P.O.; methodology, P.O., G.F. and E.B.; software and validation, M.S.-R., E.B. and C.A.A.; resources and data curation; P.O., C.A.A. and G.F.; writing—original draft preparation, M.S.-R., E.B., P.O. and E.M.-G.; writing—review and editing, M.S.-R., G.F., P.O. and E.M.-G. All authors have read and agreed to the published version of the manuscript.
Funding
This research received no external funding.
Institutional Review Board Statement
Not applicable.
Informed Consent Statement
Not applicable.
Data Availability Statement
Data available in a publicly accessible repository that does not issue DOIs.
Conflicts of Interest
The authors declare no conflict of interest.
Appendix A
This section depicts snow and meteorological data collected days before the event. Figure A1 shows the snow profile carried out 2 days before the avalanche at 2200 m.a.s.l., at the place where the avalanche was triggered.

Figure A1.
Snow profile recorded at 2200 m.a.s.l., in a SW slope beside the starting zone of the avalanche path RIT051.
Figure A2 depicts snow and meteorological conditions of the “Tosa d’Alt” gauge station that belongs to the Catalan Meteorological Service (SMC).

Figure A2.
Snow and meteorological data of the “Tosa d’Alp” gauge station. Data registered from 26th January to 12th February: maximum (continuous line) and minimum (dashed line) air temperature (a); maximum wind speed and direction (b); cumulated of new snow (black bars) and evolution of the snowpack depth (continuous line) (c).
References
- UNISDR. The Human Cost of Weather Related Disasters (1995–2015); United Nations Office for Disaster Risk Reduction (UNISDR): Geneva, Switzerland, 2015. [Google Scholar]
- CRED EM-DAT. The International Disaster Database. Available online: https://www.emdat.be (accessed on 14 February 2021).
- Ferreira, T.M.; Lu, Z. GeoHazards: A New Interdisciplinary Journal Devoted to the Study of Geomorphological Hazards. GeoHazards 2018, 1, 1–2. [Google Scholar] [CrossRef]
- Oller, P.; Muntán, E.; García-Sellés, C.; Furdada, G.; Baeza, C.; Angulo, C. Characterizing major avalanche episodes in space and time in the twentieth and early twenty-first centuries in the Catalan Pyrenees. Cold Reg. Sci. Technol. 2015, 110, 129–148. [Google Scholar] [CrossRef][Green Version]
- Muntán, E.; Garcia, C.; Oller, P.; Marti, G.; Garcia, A.; Gutiérrez, E. Reconstructing snow avalanches in the Southeastern Pyrenees. Nat. Hazards Earth Syst. Sci. 2009, 9, 1599–1612. [Google Scholar] [CrossRef]
- Semakova, E.; Myagkov, S.; Armstrong, R.L. The current state of avalanche risk analysis and hazard mapping in Uzbekistan. In Proceedings of the ISSW 09—International Snow Science Workshop, Davos, Switzerland, 27 September–2 October 2009; pp. 509–513. [Google Scholar]
- Bonsoms, J.; Salvador-Franch, F.; Oliva, M. Snowfall and snow cover evolution in the Eastern Pre-Pyrenees (NE Iberian Peninsula). Cuad. Investig. Geográfica 2021, 47. [Google Scholar]
- Stoffel, M.; Bollschweiler, M.; Butler, D.R.; Luckman, B.H. Tree Rings and Natural Hazards; Stoffel, M., Bollschweiler, M., Butler, D.R., Luckman, B.H., Eds.; Advances in Global Change Research; Springer: Dordrecht, The Netherlands, 2010; Volume 41, ISBN 978-90-481-8735-5. [Google Scholar]
- Aydin, A.; Eker, R. GIS-Based snow avalanche hazard mapping: Bayburt-Aşağı Dere catchment case. J. Environ. Biol. 2017, 38, 937–943. [Google Scholar] [CrossRef]
- Bocchiola, D.; Galizzi, M.; Bombelli, G.M.; Soncini, A. Mapping snow avalanches hazard in poorly monitored areas. The case of Rigopiano avalanche, Apennines of Italy. Nat. Hazards Earth Syst. Sci. Discuss. 2018, 1–31. [Google Scholar] [CrossRef]
- Bonnefoy-Demongeot, M.; Robinet, J.; Bouilloux, J.; Bourova, E.; Richard, D. How to improve snow avalanche observation quality? In Proceedings of the International Snow Science Workshop, Banff, AB, Canada, 29 September–3 October 2014. [Google Scholar]
- Fischer, J.T. A novel approach to evaluate and compare computational snow avalanche simulation. Nat. Hazards Earth Syst. Sci. 2013, 13, 1655–1667. [Google Scholar] [CrossRef]
- Jamieson, B.; Margreth, S.; Jones, A. Application and Limitations of Dynamic Models for Snow Avalanche Hazard Mapping. In Proceedings of the International Snow Science Workshop, Whistler, BC, Canada, 21–27 September 2008; pp. 730–739. [Google Scholar]
- Margreth, S.; Funk, M. Hazard mapping for ice and combined snow/ice avalanches—Two case studies from the Swiss and Italian Alps. Cold Reg. Sci. Technol. 1999, 30, 159–173. [Google Scholar] [CrossRef]
- Bosch, J.; Furdada, G.; Vilaplana, J.M. Estudi del mantell nival i programa de predicció del risc d’allaus al Pirineu de Catalunya. Rev. Dep. Política Territ. Obres Públiques 1991, 28, 34–44. [Google Scholar]
- Gauer, P.; Issler, D.; Lied, K.; Kristensen, K.; Sandersen, F. On snow avalanche flow regimes: Inferences from observations and measurements. In Proceedings of the International Snow Science Workshop, Whistler, BC, Canada, 21–27 September, 2008; pp. 717–723. [Google Scholar]
- Dreier, L.; Bühler, Y.; Steinkogler, W.; Feistl, T.; Christen, M.; Bartelt, P. Modelling Small and Frequent Avalanches. In Proceedings of the International Snow Science Workshop, Banff, AB, Canada, 29 September–3 October 2014; p. 8. [Google Scholar]
- Gubler, H. Measurements and modelling of snow avalanche speeds. Avalanche formation, movement and effects. In Proceedings of the Davos Symposium, September 1986; IAHS Publ.: Oxfordshire, UK, 1987; Volume 162, pp. 405–420. [Google Scholar]
- Gruber, U.; Bartelt, P. Snow avalanche hazard modelling of large areas using shallow water numerical methods and GIS. Environ. Model. Softw. 2007, 22, 1472–1481. [Google Scholar] [CrossRef]
- Stefania, S.; Zugliani, D.; Rosatti, G. Dense snow avalanche modelling with Voellmy rheology: TRENT2D vs. RAMMS2D. In Proceedings of the Vistual Snow Science Workshop—VSSW 2020, Fernie, BC, Canada, 4–6 October 2020. [Google Scholar]
- Sampl, P.; Zwinger, T. Avalanche simulation with SAMOS. Ann. Glaciol. 2004, 38, 393–398. [Google Scholar] [CrossRef]
- Mergili, M.; Fischer, J.T.; Krenn, J.; Pudasaini, S.P.R. avaflow v1, an advanced open-source computational framework for the propagation and interaction of two-phase mass flows. Geosci. Model Dev. 2017, 10, 553–569. [Google Scholar] [CrossRef]
- Maggioni, M.; Barbero, M.; Barpi, F.; Borri-Brunetto, M.; De Biagi, V.; Freppaz, M.; Frigo, B.; Pallara, O.; Chiaia, B. Snow Avalanche Impact Measurements at the Seehore Test Site in Aosta Valley (NW Italian Alps). Geosciences 2019, 9, 471. [Google Scholar] [CrossRef]
- Keylock, C.J.; Barbolini, M. Snow avalanche impact pressure - vulnerability relations for use in risk assessment. Can. Geotech. J. 2011, 38, 227–238. [Google Scholar] [CrossRef]
- Christen, M.; Bartelt, P.; Gruber, U. AVAL-1D: An avalanche dynamics program for the practice. In Proceedings of the International Congress Interpraevent, Pacific Rim, Matsumoto, Japan, 14–18 October 2002; pp. 715–725. [Google Scholar]
- Podolskiy, E.A.; Chambon, G.; Naaim, M.; Gaume, J. A review of finite-element modelling in snow mechanics. J. Glaciol. 2013, 59, 1189–1201. [Google Scholar] [CrossRef]
- López, D.; Cuellar Moro, V.; Díaz Martínez, R. Corrección termodinámica de la difusión numérica del método W-SPH. Ing. del agua 2015, 19, 1. [Google Scholar] [CrossRef]
- López, D.; Marivela, R.; Garrote, L. Smoothed particle hydrodynamics model applied to hydraulic structures: A hydraulic jump test case. J. Hydraul. Res. 2010, 48, 142–158. [Google Scholar] [CrossRef]
- Schraml, K.; Thomschitz, B.; Mcardell, B.W.; Graf, C.; Kaitna, R. Modeling debris-flow runout patterns on two alpine fans with different dynamic simulation models. Nat. Hazards Earth Syst. Sci. 2015, 15, 1483–1492. [Google Scholar] [CrossRef]
- Issler, D.; Harbitz, C.B.; Kristensen, K.; Lied, K.; Moe, A.S.; Barbolini, M.; De Blasio, F.V.; Khazaradze, G.; McElwaine, J.N.; Mears, A.I.; et al. A comparison of avalanche models with data from dry-snow avalanches at Ryggfonn, Norway. In Proceedings of the 11th International Conference and Field Trip on Landslides, Trondheim, Norway, 1–10 September 2005; pp. 173–179. [Google Scholar]
- Christen, M.; Kowalski, J.; Bartelt, P. RAMMS: Numerical simulation of dense snow avalanches in three-dimensional terrain. Cold Reg. Sci. Technol. 2010, 63, 1–14. [Google Scholar] [CrossRef]
- ICGC Database of avalanches in Catalonia (BDAC). Available online: https://www.icgc.cat/en/Public-Administration-and-Enterprises/Tools/Databases-and-catalogues/Database-of-avalanches-in-Catalonia-BDAC (accessed on 9 September 2020).
- Oller, P.; Marturià, J.; Martí, G.; González, J.C.; Martínez, P. Avalanche mapping in the Catalan Pyrenees. Balance and future perspectives. In Proceedings of the 4th ICA Workshop on Mountain Cartography; International Cartographic Association (ICA), Vall de Núria, Spain, 30 September–2 October 2004; pp. 13–22. [Google Scholar]
- Oller, P.; Muntán, E.; Marturià, J.; García, C.; García, A.; Martínez, P. The Avalanche Data in the Catalan Pyrenees, 20 Years of Avalanche Mapping. In Proceedings of the 2006 International Snow Science Workshop, Telluride, CO, USA, 1–6 October 2006; pp. 305–313. [Google Scholar]
- Winkler, K.; Schweizer, J. Comparison of snow stability tests: Extended column test, rutschblock test and compression test. Cold Reg. Sci. Technol. 2009, 59, 217–226. [Google Scholar] [CrossRef]
- McClung, D.; Schaerer, P.A. The Avalanche Handbook; Mountaineers: Seattle, WA, USA, 1993; ISBN 0898863643. [Google Scholar]
- EAWS European Avalanche Warning Services. Available online: https://www.avalanches.org/standards/avalanche-size/ (accessed on 27 April 2021).
- AAA. Snow, Weather, and Avalanches: Observation Guidelines for Avalanche Programs in the United States, 3rd ed.; American Avalanche Association (AAA): Victor, ID, USA, 2016. [Google Scholar]
- Centre de lauegi d’Aran Desencadenament artificial amb Daisybell. Bonaigua 15/01/2010. Available online: https://www.youtube.com/watch?v=5yO-PSTKxCY (accessed on 9 February 2021).
- Burkard, A.A.; Salm, B. Die Bestimmung der Mittleren Anrissmächtigkeit do zur Berechnung von Fliesslawinen; Eidgenössisches Institut für Schnee- und Lawinenforschung: Davos, Switzerland, 1992. [Google Scholar]
- Andrade-Fuentes, C.A. Reconstrucción del alud de Febrero de 2018 en la Carretera BV-4024, Coll de Pal, y Definición y Caracterización del Correspondiente Escenario de Referencia de T100; Universitat de Barcelona—Universitat Autònoma de Barcelona: Bellaterra, Barcelona, 2019. [Google Scholar]
- Bladé, E.; Cea, L.; Corestein, G.; Escolano, E.; Puertas, J.; Vázquez-Cendón, E.; Dolz, J.; Coll, A. Iber: Herramienta de simulación numérica del flujo en ríos. Rev. Int. Métodos Numéricos para Cálculo Diseño Ing. 2014, 30, 1–10. [Google Scholar] [CrossRef]
- Anta Álvarez, J.; Bermúdez, M.; Cea, L.; Suárez, J.; Ures, P.; Puertas, J. Modelización de los impactos por DSU en el río Miño (Lugo). Ing. Agua 2015, 19, 105. [Google Scholar] [CrossRef]
- Bladé, E.; Cea, L.; Corestein, G. Numerical modelling of river inundations. Ing. Agua 2014, 18, 68. [Google Scholar] [CrossRef]
- Sopelana, J.; Cea, L.; Ruano, S. Determinación de la inundación en tramos de ríos afectados por marea basada en la simulación continúa de nivel. Ing. Agua 2017, 21, 231. [Google Scholar] [CrossRef]
- Sopelana, J.; Cea, L.; Ruano, S. A continuous simulation approach for the estimation of extreme flood inundation in coastal river reaches affected by meso- and macrotides. Nat. Hazards 2018, 93, 1337–1358. [Google Scholar] [CrossRef]
- Sanz-Ramos, M.; Olivares Cerpa, G.; Bladé i Castellet, E. Metodología para el análisis de rotura de presas con aterramiento mediante simulación con fondo móvil. Ribagua 2020, 7, 1–10. [Google Scholar] [CrossRef]
- Sanz-Ramos, M.; Bladé, E.; Escolano, E. Optimización del cálculo de la Vía de Intenso Desagüe con criterios hidráulicos. Ing. Agua 2020, 24, 203. [Google Scholar] [CrossRef]
- Sanz-Ramos, M.; Bladé, E.; Dolz, J. Reconstructing the Aznalcóllar mine accident 20 year later. Numerical modelling of the flood. In Proceedings of the River Flow 2020: The 10th Conference on Fluvial Hydraulics, Delft, The Netherlands, 7–10 July 2020; CRC Press: Boca Raton, FL, USA, 2020; pp. 1222–1230, ISBN 9781000294361. [Google Scholar]
- Ruiz-Villanueva, V.; Mazzorana, B.; Bladé, E.; Bürkli, L.; Iribarren-Anacona, P.; Mao, L.; Nakamura, F.; Ravazzolo, D.; Rickenmann, D.; Sanz-Ramos, M.; et al. Characterization of wood-laden flows in rivers. Earth Surf. Process. Landf. 2019, 44, 1694–1709. [Google Scholar] [CrossRef]
- Torralba, A.; Bladé, E.; Oller, P. Implementació d’un model bidimensional per a simulació d’allaus de neu densa. In Proceedings of the V Jornades Tècniques de Neu i Allaus: Pyrenean Symposium on Snow and Avalanches, Ordino, Andorra, 9–11 October 2017. [Google Scholar]
- Sanz-Ramos, M.; Bladé, E.; Torralba, A.; Oller, P. Las ecuaciones de Saint Venant para la modelización de avalanchas de nieve densa. Ing. Agua 2020, 24, 65–79. [Google Scholar] [CrossRef]
- Toro, E.F. Riemann Solvers and Numerical Methods for Fluid Dynamics; Springer: Berlin/Heidelberg, Gernamy, 2009; Volume 40, ISBN 978-3-540-25202-3. [Google Scholar]
- Roe, P.L. A basis for the upwind differencing of the two-dimensional unsteady Euler equations. Numer. Methods Fluid Dyn. 1986, 55–80. [Google Scholar]
- Bladé, E.; Gómez-Valentín, M.; Sánchez-Juny, M.; Dolz, J. Source term treatment of SWEs using the surface gradient upwind method. J. Hydraul. Res. 2012, 50, 447–448. [Google Scholar] [CrossRef]
- Bermúdez, A.; Dervieux, A.; Desideri, J.-A.; Vázquez, M.E. Upwind schemes for the two-dimensional shallow water equations with variable depth using unstructured meshes. Comput. Methods Appl. Mech. Eng. 1998, 155, 49–72. [Google Scholar] [CrossRef]
- Voellmy, A. Über die Zerstörungskraft von Lawinen. Schweiz. Bauztg. 1955, 73, 15. [Google Scholar]
- Bartelt, P.; Salm, B.; Gruber, U. Calculating dense-snow avalanche runout using a Voellmy-fluid model with active/passive longitudinal straining. J. Glaciol. 1999, 45, 242–254. [Google Scholar] [CrossRef]
- Naaim, M.; Durand, Y.; Eckert, N.; Chambon, G. Dense avalanche friction coefficients: Influence of physical properties of snow. J. Glaciol. 2013, 59, 771–782. [Google Scholar] [CrossRef]
- Pudasaini, S.P.; Krautblatter, M. A two-phase mechanical model for rock-ice avalanches. J. Geophys. Res. Earth Surf. 2014, 119, 2272–2290. [Google Scholar] [CrossRef]
- Bartelt, P.; Valero, C.V.; Feistl, T.; Christen, M.; Bühler, Y.; Buser, O. Modelling cohesion in snow avalanche flow. J. Glaciol. 2015, 61, 837–850. [Google Scholar] [CrossRef]
- ICGC Descàrregues. Available online: https://www.icgc.cat/Descarregues (accessed on 25 May 2020).
- Brufau, P.; García-Navarro, P.; Vázquez-Cendón, M.E. Zero mass error using unsteady wetting–drying conditions in shallow flows over dry irregular topography. Int. J. Numer. Methods Fluids 2004, 45, 1047–1082. [Google Scholar] [CrossRef]
- Cea, L.; Puertas, J.; Vázquez-Cendón, M.-E. Depth averaged modelling of turbulent shallow water flow with wet-dry fronts. Arch. Comput. Methods Eng. 2007, 14, 303–341. [Google Scholar] [CrossRef]
- Bartelt, P.; Bühler, Y.; Christen, M.; Deubelbeiss, Y.; Salz, M.; Schneider, M.; Schumacher, L. RAMMS: Avalanche User Manual; WSL Institute for Snow and Avalanche Research SLF: Davos, Switzerland, 2017. [Google Scholar]
- Gauer, P. Comparison of avalanche front velocity measurements and implications for avalanche models. Cold Reg. Sci. Technol. 2014, 97, 132–150. [Google Scholar] [CrossRef]
- Thibert, E.; Bellot, H.; Ravanat, X.; Ousset, F.; Pulfer, G.; Naaim, M.; Hagenmuller, P.; Naaim-Bouvet, F.; Faug, T.; Nishimura, K.; et al. The full-scale avalanche test-site at Lautaret Pass (French Alps). Cold Reg. Sci. Technol. 2015, 115, 30–41. [Google Scholar] [CrossRef]
- Blagovechshenskiy, V.; Eglit, M.; Naaim, M. The calibration of an avalanche mathematical model using field data. Nat. Hazards Earth Syst. Sci. 2002, 2, 217–220. [Google Scholar] [CrossRef]
- Maggioni, M.; Bovet, E.; Dreier, L.; Buehler, Y.; Godone, D.; Bartelt, P.; Freppaz, M.; Chiaia, B.; Segor, V. Influence of summer and winter surface topography on numerical avalanche simulations. In Proceedings of the International Snow Science Workshop; International Snow Science Workshop ISSW 2013At, Grenoble Chamonix-Mont-Blanc: Grenoble, France, 2013; pp. 591–598. [Google Scholar]
Publisher’s Note: MDPI stays neutral with regard to jurisdictional claims in published maps and institutional affiliations. |
© 2021 by the authors. Licensee MDPI, Basel, Switzerland. This article is an open access article distributed under the terms and conditions of the Creative Commons Attribution (CC BY) license (https://creativecommons.org/licenses/by/4.0/).