
A Robust Ensemble Model for Plant Disease Detection Using Deep Learning Architectures


Abstract
1. Introduction
- Perform a detailed analysis and comparison of deep learning models applied to plant disease detection, focusing on their performance, scalability, and suitability for deployment in real-world agricultural settings. This includes analyzing how well different models handle challenges such as class imbalance and complex disease symptoms across multiple plant species.
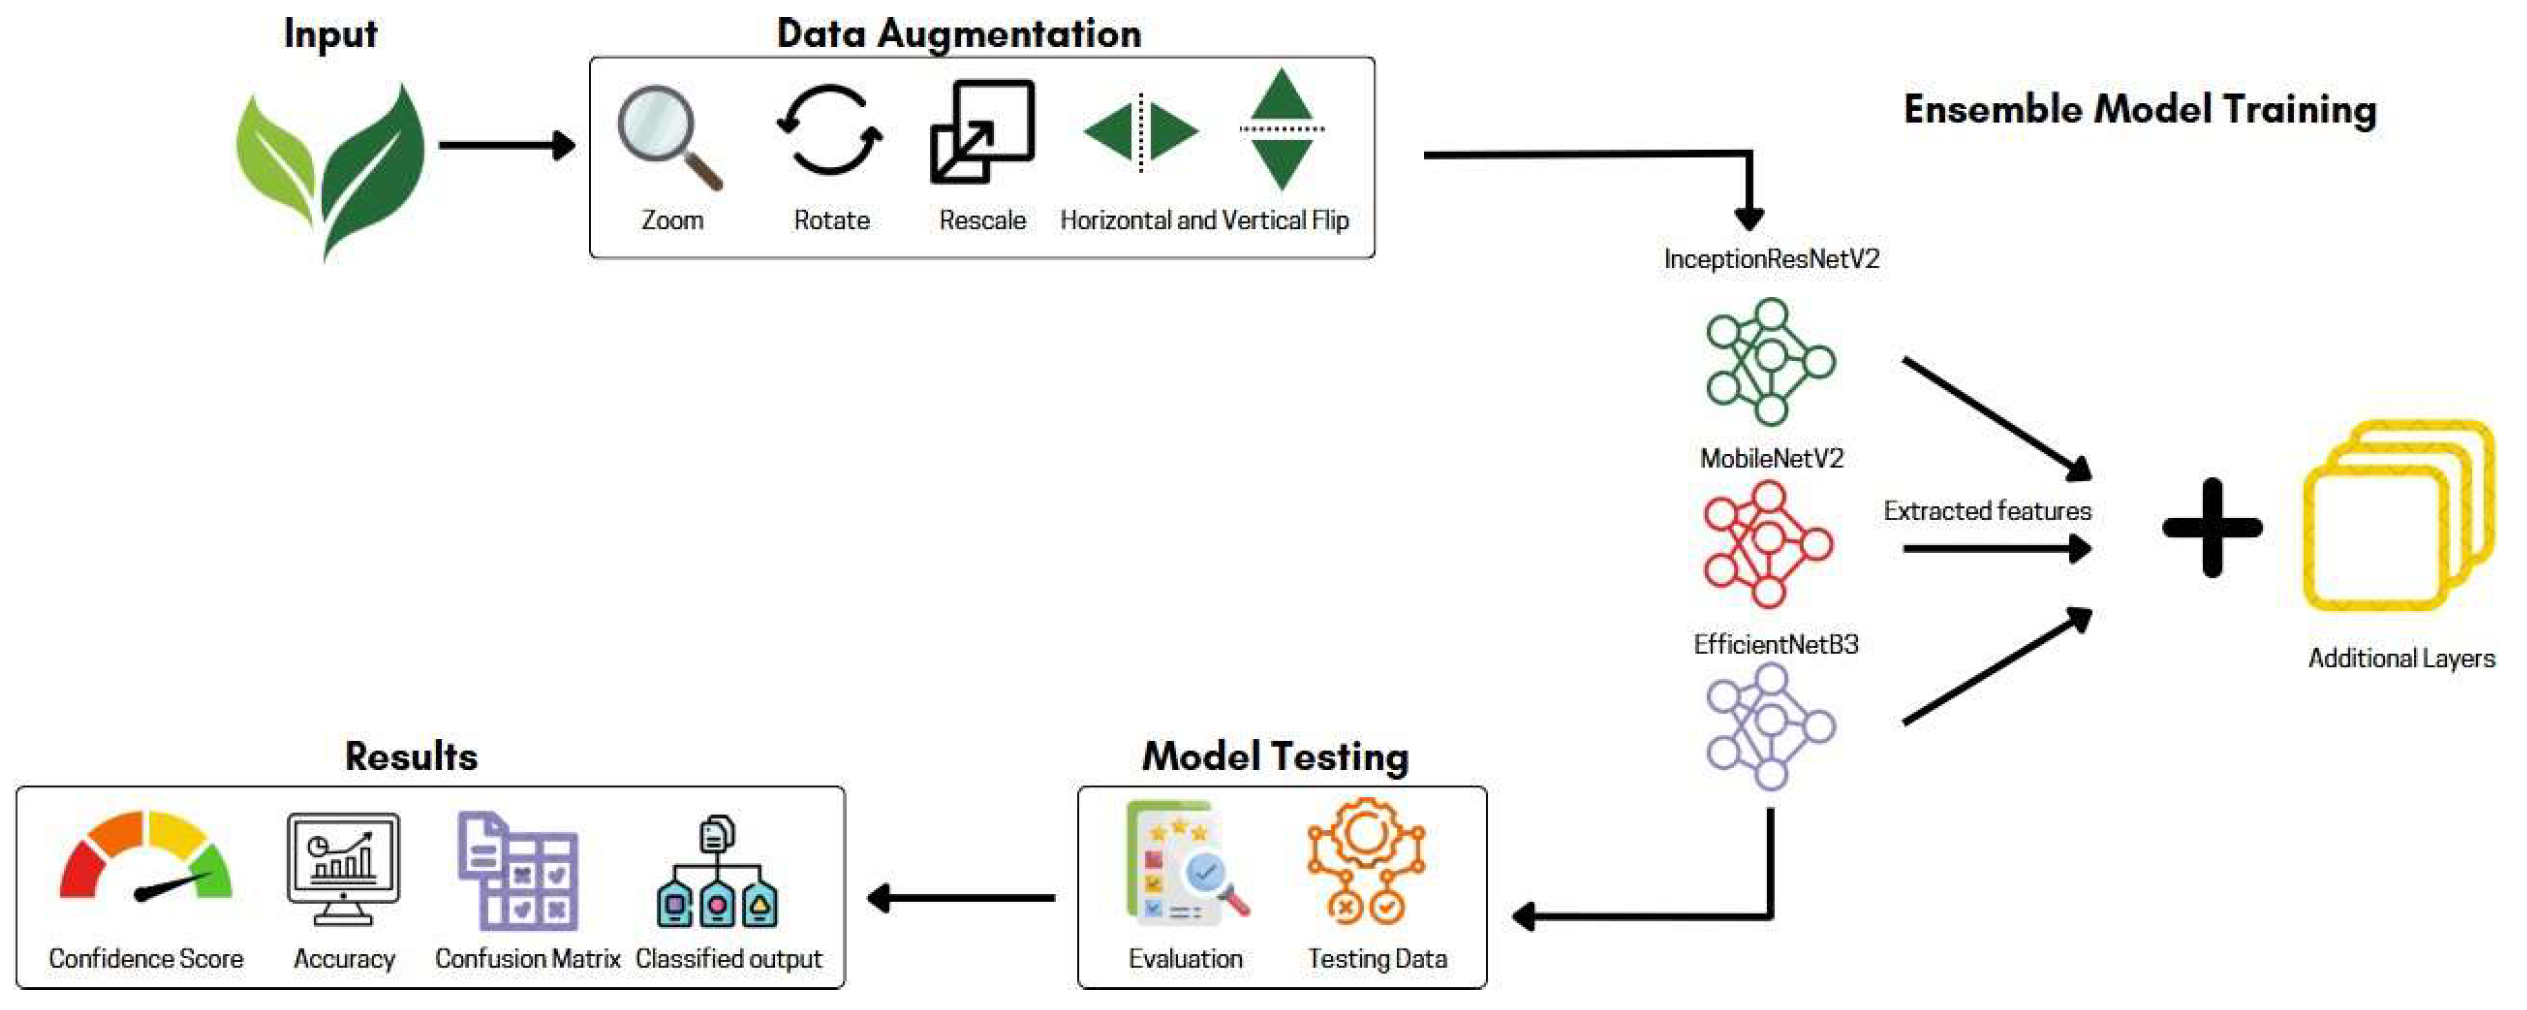
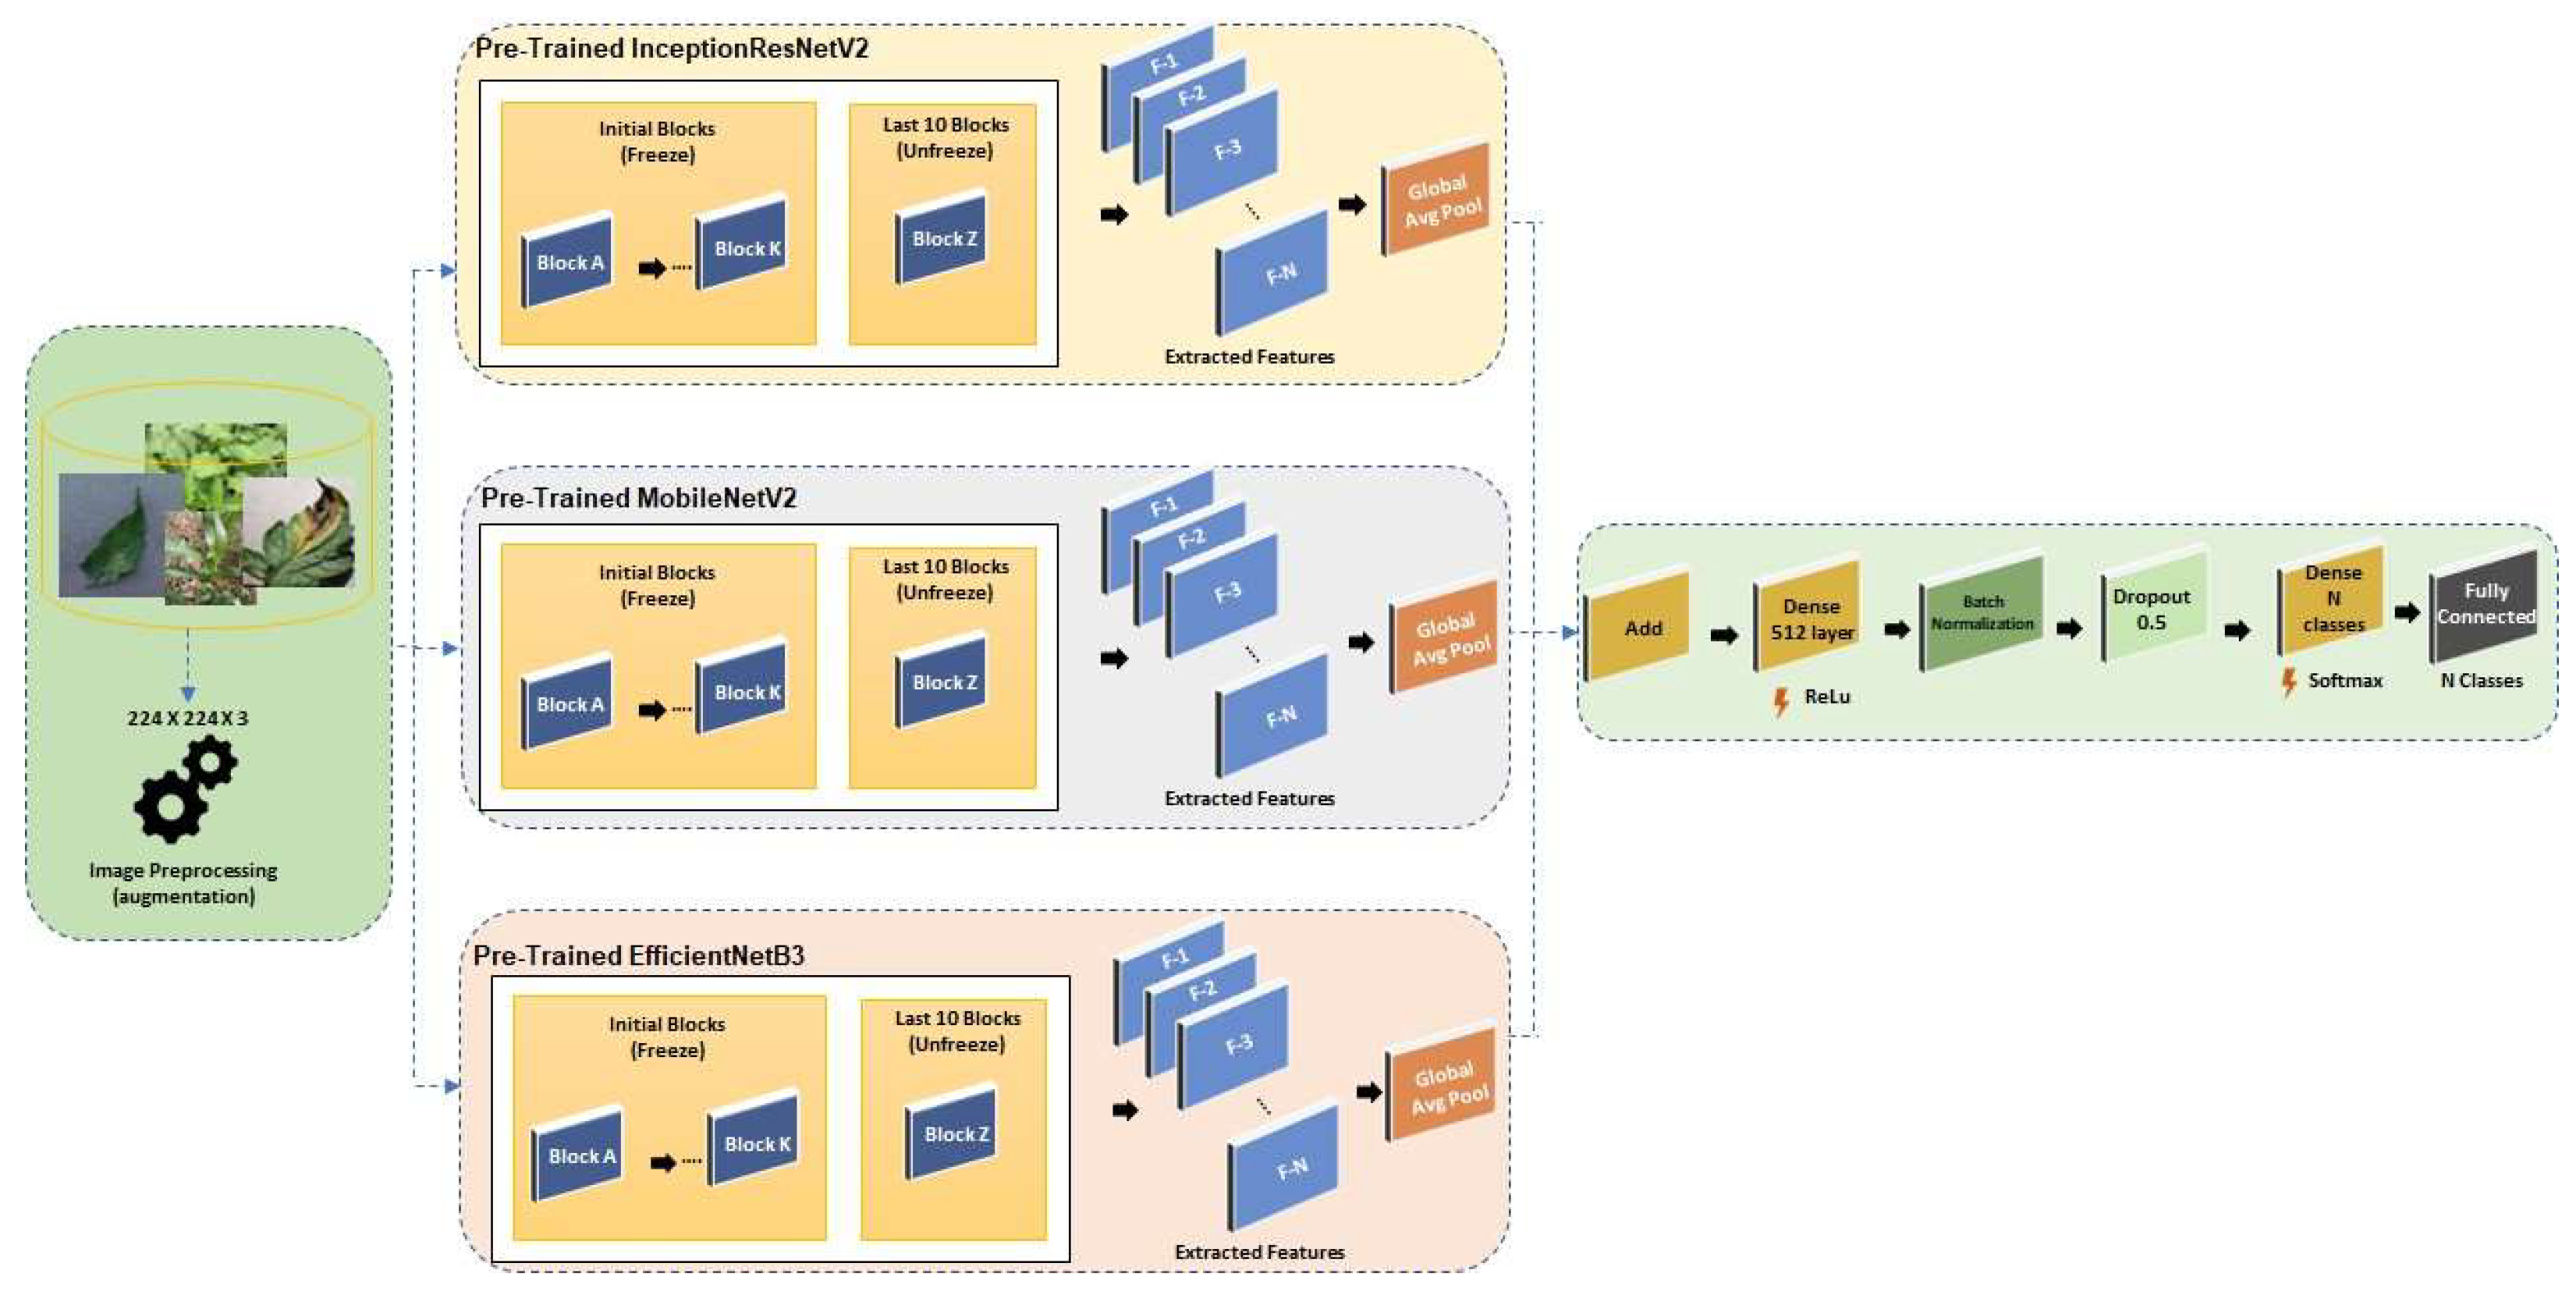
- Design and develop a robust ensemble framework by integrating three state-of-the-art convolutional neural network architectures—InceptionResNetV2, MobileNetV2, and EfficientNetB3. The goal is to create a unified model that utilizes the detailed feature extraction of InceptionResNetV2, the computational efficiency of MobileNetV2, and the scalability of EfficientNetB3, resulting in improved accuracy and robustness in both controlled and real-world environments.
- Improve the model’s ability to generalize across unseen data by applying sophisticated data augmentation techniques. These include random rotations, zooming, horizontal and vertical flips, and rescaling, all of which introduce greater variability into the training process and simulate real-world image capture conditions. This helps ensure that the model performs well even in challenging or unfamiliar scenarios.
- Validate the effectiveness and adaptability of the proposed ensemble model using three diverse datasets—PlantVillage, PlantDoc, and FieldPlant—each offering different characteristics ranging from clean laboratory images to complex, real-world field conditions. Evaluation is carried out through multiple performance metrics, including accuracy, precision, recall, F1-score, and confusion matrices, along with comparative analysis against individual base models and existing approaches in the literature.
2. Literature Review
3. Datasets
4. Proposed Approach
4.1. Data Augmentation
4.2. Model Architecture
4.3. Parameter Settings
4.4. Evaluation Measures
5. Results and Discussion
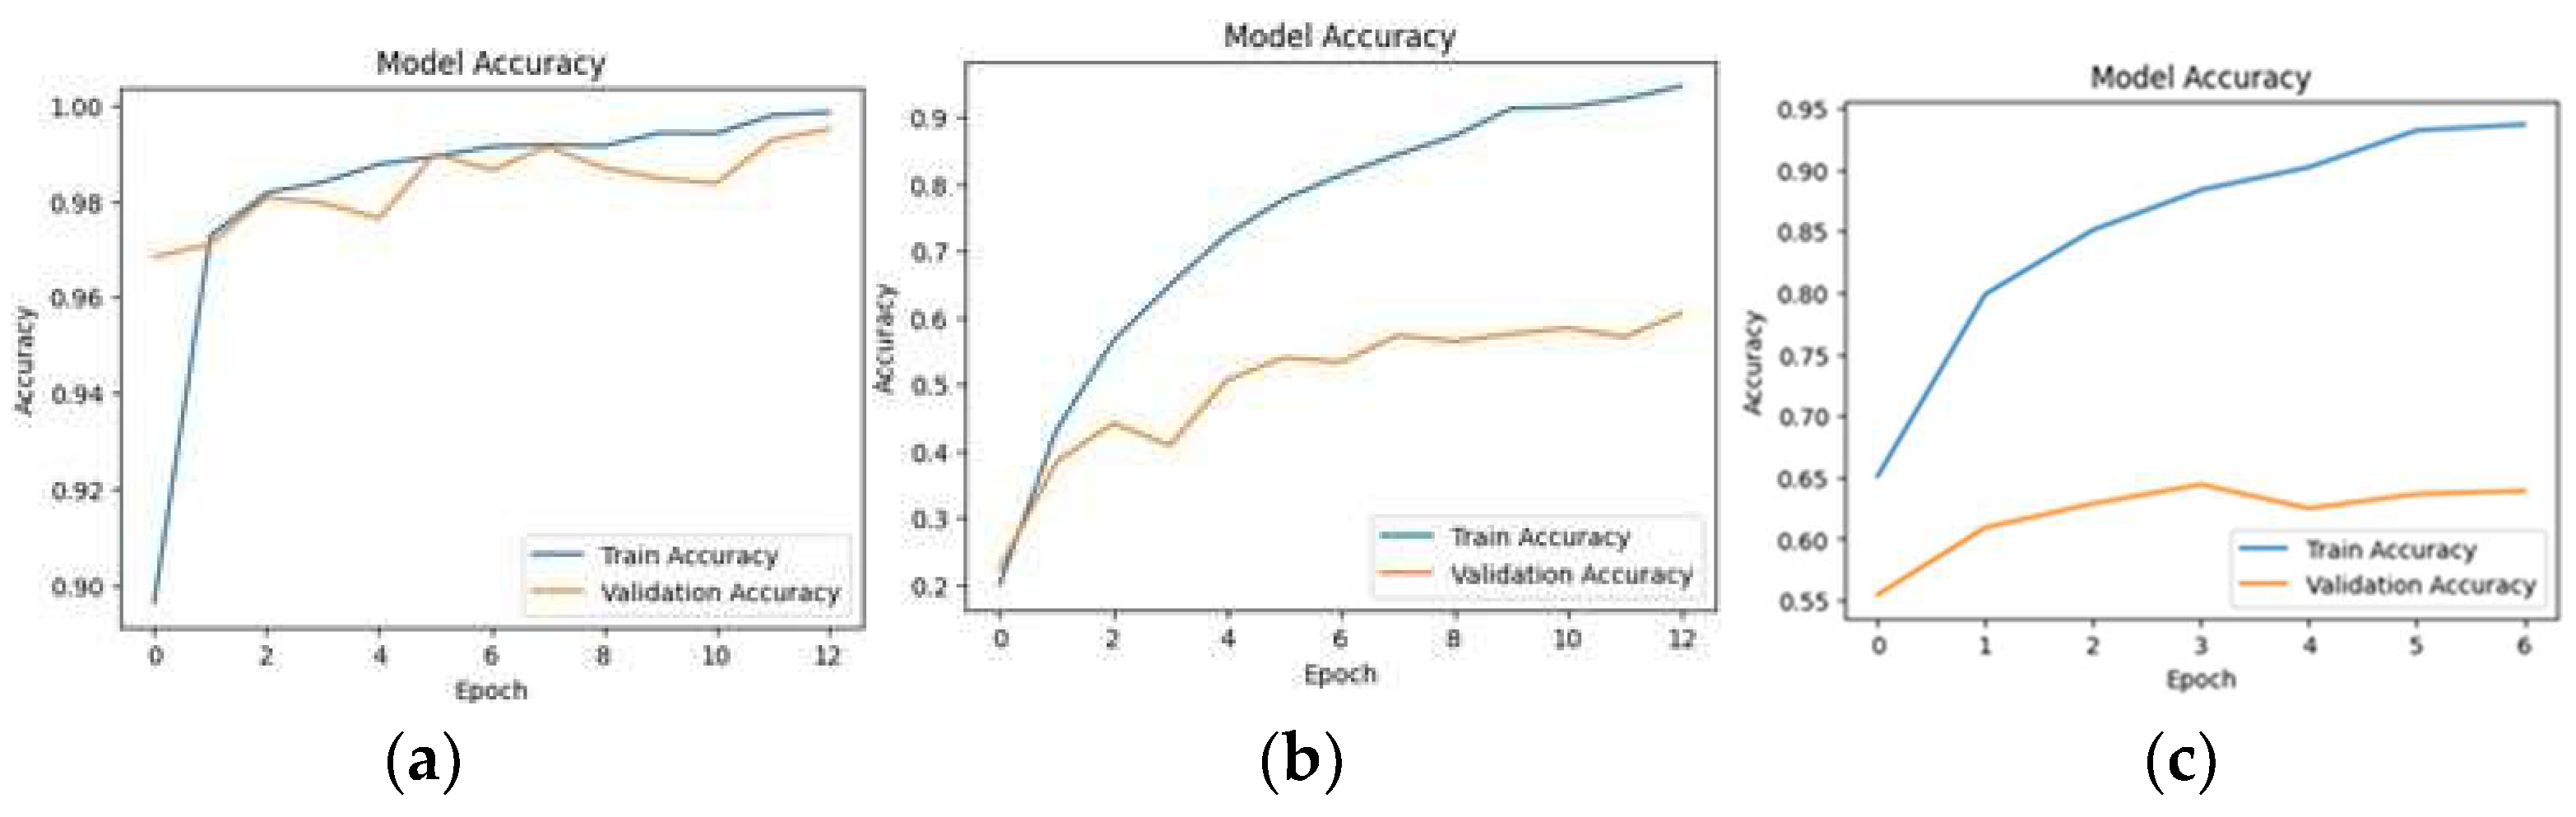
5.1. Loss and Accuracy
5.2. Precision, Recall, and F1 Score Analysis
5.3. Evaluation Measures for Each Class
5.4. Ablation Study
6. Conclusions
Author Contributions
Funding
Institutional Review Board Statement
Informed Consent Statement
Data Availability Statement
Conflicts of Interest
References
- Chen, J.; Chen, J.; Zhang, D.; Nanehkaran, Y.A.; Sun, Y. A cognitive vision method for the detection of plant disease images. Mach. Vis. Appl. 2021, 32, 31. [Google Scholar] [CrossRef]
- Fan, X.; Luo, P.; Mu, Y.; Zhou, R.; Tjahjadi, T.; Ren, Y. Leaf image based plant disease identification using transfer learning and feature fusion. Comput. Electron. Agric. 2022, 196, 106892. [Google Scholar] [CrossRef]
- Tiwari, V.; Joshi, R.C.; Dutta, M.K. Dense convolutional neural networks based multiclass plant disease detection and classification using leaf images. Ecol. Inform. 2021, 63, 101289. [Google Scholar] [CrossRef]
- Faisal, S.; Javed, K.; Ali, S.; Alasiry, A.; Marzougui, M.; Khan, M.A.; Cha, J.H. Deep transfer learning based detection and classification of citrus plant diseases. Comput. Mater. Contin. 2023, 76, 895–914. [Google Scholar] [CrossRef]
- Sachdeva, G.; Singh, P.; Kaur, P. Plant leaf disease classification using deep Convolutional neural network with Bayesian learning. Mater. Today Proc. 2021, 45, 5584–5590. [Google Scholar] [CrossRef]
- Shoaib, M.; Sadeghi-Niaraki, A.; Ali, F.; Hussain, I.; Khalid, S. Leveraging deep learning for plant disease and pest detection: Acomprehensive review and future directions. Front. Plant Sci. 2025, 16, 1538163. [Google Scholar] [CrossRef] [PubMed]
- Ahmed, N.; Asif, H.M.S.; Saleem, G.; Younus, M.U. Image quality assessment for foliar disease identification (AgroPath). arXiv 2022, arXiv:2209.12443. [Google Scholar]
- Hong, H.; Lin, J.; Huang, F. Tomato disease detection and classification by deep learning. In Proceedings of the 2020 International Conference on Big Data, Artificial Intelligence and Internet of Things Engineering (ICBAIE), Fuzhou, China, 12–14 June 2020; pp. 25–29. [Google Scholar]
- Sahu, S.K.; Pandey, M. An optimal hybrid multiclass SVM for plant leaf disease detection using spatial Fuzzy C-Means model. Expert Syst. Appl. 2023, 214, 118989. [Google Scholar] [CrossRef]
- Hughes, D.; Salathé, M. An open access repository of images on plant health to enable the development of mobile disease diagnostics. arXiv 2015, arXiv:1511.08060. [Google Scholar]
- Singh, D.; Jain, N.; Jain, P.; Kayal, P.; Kumawat, S.; Batra, N. PlantDoc: A dataset for visual plant disease detection. In Proceedings of the 7th ACM IKDD CoDS and 25th COMAD, Hyderabad, India, 5–7 January 2020; pp. 249–253. [Google Scholar]
- Moupojou, E.; Tagne, A.; Retraint, F.; Tadonkemwa, A.; Wilfried, D.; Tapamo, H.; Nkenlifack, M. FieldPlant: A dataset of field plant images for plant disease detection and classification with deep learning. IEEE Access 2023, 11, 35398–35410. [Google Scholar] [CrossRef]
- Islam, M.M.; Adil, M.A.A.; Talukder, M.A.; Ahamed, M.K.U.; Uddin, M.A.; Hasan, M.K.; Sharmin, S.; Rahman, M.M.; Debnath, S.K. DeepCrop: Deep learning-based crop disease prediction with web application. J. Agric. Food Res. 2023, 14, 100764. [Google Scholar] [CrossRef]
- Karki, S.; Basak, J.K.; Tamrakar, N.; Deb, N.C.; Paudel, B.; Kook, J.H.; Kang, M.Y.; Kang, D.Y.; Kim, H.T. Strawberry disease detection using transfer learning of deep convolutional neural networks. Sci. Hortic. 2024, 332, 113241. [Google Scholar] [CrossRef]
- Khan, I.; Sohail, S.S.; Madsen, D.Ø.; Khare, B.K. Deep transfer learning for fine-grained maize leaf disease classification. J. Agric. Food Res. 2024, 16, 101148. [Google Scholar] [CrossRef]
- Ullah, N.; Khan, J.A.; Almakdi, S.; Alshehri, M.S.; Al Qathrady, M.; El-Rashidy, N.; El-Sappagh, S.; Ali, F. An effective approach for plant leaf diseases classification based on a novel DeepPlantNet deep learning model. Front. Plant Sci. 2023, 14, 1212747. [Google Scholar] [CrossRef] [PubMed]
- Anandhakrishnan, T.; Jaisakthi, S. Deep Convolutional Neural Networks for image based tomato leaf disease detection. Sustain. Chem. Pharm. 2022, 30, 100793. [Google Scholar] [CrossRef]
- Abbas, A.; Jain, S.; Gour, M.; Vankudothu, S. Tomato plant disease detection using transfer learning with C-GAN synthetic images. Comput. Electron. Agric. 2021, 187, 106279. [Google Scholar] [CrossRef]
- Anim-Ayeko, A.O.; Schillaci, C.; Lipani, A. Automatic blight disease detection in potato (Solanum tuberosum L.) and tomato (Solanum lycopersicum, L. 1753) plants using deep learning. Smart Agric. Technol. 2023, 4, 100178. [Google Scholar] [CrossRef]
- Bansal, A.; Sharma, R.; Sharma, V.; Jain, A.K.; Kukreja, V. Detecting Severity Levels of Cucumber Leaf Spot Disease using ResNext Deep Learning Model: A Digital Image Analysis Approach. In Proceedings of the 2023 4th International Conference for Emerging Technology (INCET), Belgaum, India, 26–28 May 2023; pp. 1–6. [Google Scholar]
- Harakannanavar, S.S.; Rudagi, J.M.; Puranikmath, V.I.; Siddiqua, A.; Pramodhini, R. Plant leaf disease detection using computer vision and machine learning algorithms. Glob. Transit. Proc. 2022, 3, 305–310. [Google Scholar] [CrossRef]
- Pallathadka, H.; Ravipati, P.; Sajja, G.S.; Phasinam, K.; Kassanuk, T.; Sanchez, D.T.; Prabhu, P. Application of machine learning techniques in rice leaf disease detection. Mater. Today Proc. 2022, 51, 2277–2280. [Google Scholar] [CrossRef]
- Alessandrini, M.; Rivera, R.C.F.; Falaschetti, L.; Pau, D.; Tomaselli, V.; Turchetti, C. A grapevine leaves dataset for early detection and classification of esca disease in vineyards through machine learning. Data Brief 2021, 35, 106809. [Google Scholar] [CrossRef]
- Hemalatha, A.; Vijayakumar, J. Automatic tomato leaf diseases classification and recognition using transfer learning model with image processing techniques. In Proceedings of the 2021 Smart Technologies, Communication and Robotics (STCR), Sathyamangalam, India, 9–10 October 2021; pp. 1–5. [Google Scholar]
- Agarwal, M.; Singh, A.; Arjaria, S.; Sinha, A.; Gupta, S. ToLeD: Tomato leaf disease detection using convolution neural network. Procedia Comput. Sci. 2020, 167, 293–301. [Google Scholar] [CrossRef]
- Rizvee, R.A.; Orpa, T.H.; Ahnaf, A.; Kabir, M.A.; Rashid, M.R.A.; Islam, M.M.; Islam, M.; Jabid, T.; Ali, M.S. LeafNet: A proficient convolutional neural network for detecting seven prominent mango leaf diseases. J. Agric. Food Res. 2023, 14, 100787. [Google Scholar] [CrossRef]
- Prathiksha, B.; Kumar, V.; Krishnamoorthi, M.; Poovizhi, P.; Sowmiya, D.; Thrishaa, B. Early Accurate Identification of Grape leaf Disease Detection using CNN based VGG-19 model. In Proceedings of the 2024 International Conference on Cognitive Robotics and Intelligent Systems (ICC-ROBINS), Coimbatore, India, 17–19 April 2024; pp. 263–269. [Google Scholar]
- Paymode, A.S.; Malode, V.B. Transfer learning for multi-crop leaf disease image classification using convolutional neural network VGG. Artif. Intell. Agric. 2022, 6, 23–33. [Google Scholar] [CrossRef]
- Szegedy, C.; Ioffe, S.; Vanhoucke, V.; Alemi, A. Inception-v4, inception-resnet and the impact of residual connections on learning. In Proceedings of the AAAI Conference on Artificial Intelligence, San Francisco, CA, USA, 4–9 February 2017; Volume 31. [Google Scholar]
- Hassan, S.M.; Maji, A.K.; Jasin´ski, M.; Leonowicz, Z.; Jasin´ska, E. Identification of plant-leaf diseases using CNN and transfer-learning approach. Electronics 2021, 10, 1388. [Google Scholar] [CrossRef]
- Chellapandi, B.; Vijayalakshmi, M.; Chopra, S. Comparison of pre-trained models using transfer learning for detecting plant disease. In Proceedings of the 2021 International Conference on Computing, Communication, and Intelligent Systems (ICCCIS), Greater Noida, India, 19–20 February 2021; pp. 383–387. [Google Scholar]
- Krishnamoorthy, N.; Prasad, L.N.; Kumar, C.P.; Subedi, B.; Abraha, H.B.; Sathishkumar, V. Rice leaf diseases prediction using deep neural networks with transfer learning. Environ. Res. 2021, 198, 111275. [Google Scholar]
- Naveenkumar, M.; Srithar, S.; Kumar, B.R.; Alagumuthukrishnan, S.; Baskaran, P. InceptionResNetV2 for plant leaf disease classification. In Proceedings of the 2021 Fifth International Conference on I-SMAC (IoT in Social, Mobile, Analytics and Cloud) (I-SMAC), Palladam, India, 11–13 November 2021; pp. 1161–1167. [Google Scholar]
- Islam, M.A.; Shuvo, M.N.R.; Shamsojjaman, M.; Hasan, S.; Hossain, M.S.; Khatun, T. An automated convolutional neural network based approach for paddy leaf disease detection. Int. J. Adv. Comput. Sci. Appl. 2021, 12. [Google Scholar] [CrossRef]
- Hridoy, R.H.; Afroz, M.; Ferdowsy, F. An Early Recognition Approach for Okra Plant Diseases and Pests Classification Based on Deep Convolutional Neural Networks. In Proceedings of the 2021 Innovations in Intelligent Systems and Applications Conference (ASYU), Elazig, Turkey, 6–8 October 2021; pp. 1–6. [Google Scholar]
- Sharma, M.; Kumar, C.J.; Deka, A. Early diagnosis of rice plant disease using machine learning techniques. Arch. Phytopathol. Plant Prot. 2022, 55, 259–283. [Google Scholar] [CrossRef]
- Sandler, M.; Howard, A.; Zhu, M.; Zhmoginov, A.; Chen, L.C. Mobilenetv2: Inverted residuals and linear bottlenecks. In Proceedings of the IEEE Conference on Computer Vision and Pattern Recognition, Salt Lake City, UT, USA, 18–22 June 2018; pp. 4510–4520. [Google Scholar]
- Bir, P.; Kumar, R.; Singh, G. Transfer learning based tomato leaf disease detection for mobile applications. In Proceedings of the 2020 IEEE International Conference on Computing, Power and Communication Technologies (GUCON), Greater Noida, India, 2–4 October 2020; pp. 34–39. [Google Scholar]
- Elfatimi, E.; Eryigit, R.; Elfatimi, L. Beans leaf diseases classification using mobilenet models. IEEE Access 2022, 10, 9471–9482. [Google Scholar] [CrossRef]
- Mehedi, M.H.K.; Hosain, A.S.; Ahmed, S.; Promita, S.T.; Muna, R.K.; Hasan, M.; Reza, M.T. Plant leaf disease detection using transfer learning and explainable ai. In Proceedings of the 2022 IEEE 13th Annual Information Technology, Electronics and Mobile Communication Conference (IEMCON), Vancouver, BC, Canada, 12–15 October 2022; pp. 166–170. [Google Scholar]
- Tambe, U.Y.; Shanthini, A.; Hsiung, P.A. Integrated Leaf Disease Recognition Across Diverse Crops through Transfer Learning. Procedia Comput. Sci. 2024, 233, 22–34. [Google Scholar] [CrossRef]
- Tan, M.; Le, Q.E. Rethinking model scaling for convolutional neural networks. arXiv 2019, arXiv:1905.11946. [Google Scholar]
- Yasid, A.; Wahyuningrum, R.T.; Ni’Mah, A.T.; Ayani, I.H. Rice Leaf Diseases Classification using Deep Learning Based onEfficientNetB3 Architecture with Transfer Learning. In Proceedings of the 2023 International Conference on Technology, Engineering, and Computing Applications (ICTECA), Semarang, Indonesia, 20–22 December 2023; pp. 1–6. [Google Scholar]
- Adnan, F.; Awan, M.J.; Mahmoud, A.; Nobanee, H.; Yasin, A.; Zain, A.M. EfficientNetB3-adaptive augmented deep learning (AADL) for multi-class plant disease classification. IEEE Access 2023, 11, 85426–85440. [Google Scholar] [CrossRef]
- Yaswanth, D.; Manoj, S.S.; Yadav, M.S.; Chowdary, E.D. Plant Leaf Disease Detection Using Transfer Learning Approach. In Proceedings of the 2024 IEEE International Students’ Conference on Electrical, Electronics and Computer Science (SCEECS), Bhopal, India, 24–25 February 2024; pp. 1–6. [Google Scholar]
- Saleem, M.H.; Potgieter, J.; Arif, K.M. Plant disease classification: A comparative evaluation of convolutional neural networks and deep learning optimizers. Plants 2020, 9, 1319. [Google Scholar] [CrossRef] [PubMed]
- Singh, P.P.; Kaushik, R.; Singh, H.; Kumar, N.; Rana, P.S. Convolutional neural networks based plant leaf diseases detection scheme. In Proceedings of the 2019 IEEE Globecom Workshops (GC Wkshps), Waikoloa, HI, USA, 9–13 December 2019; pp. 1–7. [Google Scholar]
- Goodfellow, I.; Pouget-Abadie, J.; Mirza, M.; Xu, B.; Warde-Farley, D.; Ozair, S.; Courville, A.; Bengio, Y. Generative adversarial networks. Commun. ACM 2020, 63, 139–144. [Google Scholar] [CrossRef]
- Kumar, D.; Ishak, M.K.; Maruzuki, M.I.F. EfficientNet based Convolutional Neural Network for Visual Plant Disease Detection. In Proceedings of the 2022 19th International Conference on Electrical Engineering/Electronics, Computer, Telecommunications and Information Technology (ECTI-CON), Prachuap Khiri Khan, Thailand, 24–27 May 2022; pp. 1–4. [Google Scholar]


| Reference | Dataset | Classifier | Accuracy (%) |
|---|---|---|---|
| [21] | Village database of tomato leaf—6 disorders | SVM, CNN, KNN | 88, 97, 99.6 |
| [22] | PlantVillage—color and gray-scale | SVM, CNN, Naïve Bayes | 96.2, 91.3, 78.8 |
| [23] | Grapevine images from three cameras | CNN (1280 × 720), CNN (320 × 180), CNN (80 × 45) | 99, 99, 96 |
| [8] | Leaf pictures of 9 tomato diseases (13,112 images) | DenseNet_Xception, Xception, ResNet50, MobileNet, ShuffleNet | 97.10, 93.17, 86.56, 80.11, 83.68 |
| [24] | 400 tomato images | DenseNet | 99.688 |
| [1] | 4062 grape leaf images from PlantVillage | SegCNN | 93.75 |
| [5] | 20,639 images of tomato, potato, and bell pepper | Deep CNN | 98.9 |
| [17] | 18,160 images of tomato leaves from PlantVillage | Deep CNN | 98.4 |
| [16] | PlantVillage | Deep CNN | 94 |
| [20] | 50,000 cucumber leaf images | ResNeXt-50 | 97.81 |
| [9] | 54,303 images of various crops | Hybrid random forest, multiclass SVM | 98.9 |
| [18] | 16,012 images of tomato plants | DenseNet121 (5 classes, 7 classes, 10 classes) | 99.5, 98.65, 97.11 |
| [25] | 50,000 images of 14 crops—PlantVillage | CNN | 91.2 |
| [19] | PlantVillage | ResNet-9 | 99.25 |
| [15] | PlantVillage | VGGNet, InceptionV3, ResNet50, InceptionResNetv2 | 88.65, 96.25, 98.13, 91.06 |
| [26] | MangoleafBD | LeafNet, AlexNet | 98.55, 98.25 |
| [13] | PlantVillage | CNN, VGG-16, VGG-19, ResNet-50 | 98.60, 92.39, 96.15, 98.98 |
| [27] | Grape disease dataset from Kaggle | VGG19 | 98 |
| [14] | Strawberry dataset | ResNet50, DenseNet121 (Fine-tuned) | 93.9, 93.5, 94.4, 94.1 |
| [28] | PlantVillage | VGG16 | 95.71 |
| [18] | PlantVillage (with C-GAN augmentation) | DenseNet121 | 99.51 |
| Reference | Dataset | Accuracy (%) | Model Modification |
|---|---|---|---|
| [30] | PlantVillage dataset—54,205 images | 99.11 | Standard convolution in InceptionResNet-A block replaced with depthwise convolution. |
| [31] | PlantVillage dataset—54,205 images | 98 | InceptionResNet-C replaced by 3 × 1 and 1 × 3 structure Global average pooling layer, batch normalization layer, and a denser layer with weight 38 |
| [32] | Rice leaf images from Kaggle—5200 images | 95.67 | Global average pooling layer, dropout (0.3), and softmax activation |
| [33] | 1540 field images from Nilgiris and images from image data repository | 95 | Original architecture |
| [34] | 984 paddy leaf images from Kaggle and machine learning repository | 92.68 | Original architecture |
| [35] | 124,760 images of Okra dataset | 98.16 | 2 convolution layers, 3 dense layers, 2 dropout layers, max pooling, and softmax activation |
| [36] | 1108 images of rice leaves (3 classes) | 98.9 | Original architecture |
| Reference | Dataset | Accuracy (%) | Model Modification |
|---|---|---|---|
| [39] | 1296 field images from iBean | 97 | Original architecture |
| [4] | Citrus plant dataset | Unaugmented dataset: 93.81, Augmented dataset: 97.91 | Fully connected layer replaced with five nodes based on the number of classes in the dataset and added softmax activation function |
| [40] | New plant diseases dataset: 38 diseases of 14 different plants | 98.86 | Flattening layer and softmax activation function |
| [30] | PlantVillage dataset | 97.02 | Activation layer, batch-normalization layer, and dropout layer (different values) |
| [41] | New Plant diseases dataset | 91.98 | Original architecture |
| Reference | Dataset | Accuracy (%) | Model Modification |
|---|---|---|---|
| [4] | Citrus plant dataset | Unaugmented dataset: 92.78, Augmented dataset: 99.58 | Fully connected layer replaced with five nodes based on the number of classes in the dataset, and added softmax activation function |
| [44] | 59,809 images—58 classes of healthy and unhealthy plants (Kaggle) | 98.71 | A convolutional layer, max pooling, replacing the final layers, and incorporating batch normalization, regularization, and a dense layer |
| [45] | New plant diseases dataset (augmented) | 99.9 | Batch normalization layer, denser layer with 256 neurons, dropout layer (0.45), and a final dense layer with softmax activation |
| [43] | Rice leaf dataset from Kaggle | 79.43 | Original architecture |
| Data Augmentation Methods | Values |
|---|---|
| Image Size | 224 × 224 × 3 |
| Zoom Range | 0.2 |
| Rotation Range | 40 |
| Horizontal Flip | True |
| Vertical Flip | True |
| Rescaling Factor | 1/255 |
| Validation Split | 0.2 |
| Parameters | Values |
|---|---|
| Optimizer | Adam |
| Epochs | 15 |
| Initial learning rate | 0.0001 |
| Loss function | Categorical cross-entropy |
| Batch size | 16 |
| Activation function | Softmax and ReLU |
| Dropout | 0.5 |
| Early stopping | Monitor metric = validation loss, patience = 5 |
| Reduce LR on plateau | Monitor metric = validation loss, patience = 2, factor = 0.2, minimum learning rate = 1 × 10⁻²² |
| Datasets | References | Model | Accuracy |
|---|---|---|---|
| FieldPlant | [12] | MobileNet | 82.9% |
| VGG16 | 80.54% | ||
| InceptionResNetV2 | 81.81% | ||
| InceptionV3 | 82.54% | ||
| Proposed Approach | 83.00% | ||
| PlantDoc | [49] | MobileNetV2 | 40.00%—Validation accuracy |
| EfficientNetV2 | 28.00% | ||
| Xception | 81.53% | ||
| Proposed Approach | 60% | ||
| PlantVillage | [19] | ResNet-9 | 99.25% |
| [15] | VGGNet | 88.65% | |
| InceptionV3 | 96.25% | ||
| ResNet50 | 98.13% | ||
| InceptionResNetV2 | 91.06% | ||
| [30] | MobileNetV2 | 97.02% | |
| [18] | DenseNet121 with C-GAN augmentation | 99.51% | |
| Proposed Approach | 99.69% |
| Class | Precision | Recall | F1 Score |
|---|---|---|---|
| Apple apple_scab | 100.00 | 100.00 | 100.00 |
| Apple black_rot | 100.00 | 100.00 | 100.00 |
| Apple cedar_apple_rust | 100.00 | 100.00 | 100.00 |
| Apple healthy | 100.00 | 99.70 | 99.85 |
| Blueberry healthy | 99.34 | 100.00 | 99.67 |
| Cherry_(including_sour) powdery_mildew | 100.00 | 100.00 | 100.00 |
| Cherry_(including_sour) healthy | 100.00 | 99.41 | 99.70 |
| Corn_(maize) Cercospora_leaf_spot_gray_leaf_spot | 93.33 | 95.15 | 94.23 |
| Corn_(maize) common_rust_ | 99.58 | 100.00 | 99.79 |
| Corn_(maize) northern_leaf_blight | 97.42 | 95.94 | 96.68 |
| Corn_(maize) healthy | 99.57 | 99.14 | 99.35 |
| Grape black_rot | 100.00 | 99.58 | 99.79 |
| Grape esca_(black_measles) | 99.64 | 100.00 | 99.82 |
| Grape leaf_blight_(isariopsis_leaf_spot) | 100.00 | 100.00 | 100.00 |
| Grape healthy | 100.00 | 100.00 | 100.00 |
| Orange Haunglongbing_(citrus_greening) | 100.00 | 100.00 | 100.00 |
| Peach bacterial_spot | 100.00 | 100.00 | 100.00 |
| Peach healthy | 100.00 | 100.00 | 100.00 |
| Pepper_bell bacterial_spot | 100.00 | 100.00 | 100.00 |
| Pepper_bell healthy | 100.00 | 100.00 | 100.00 |
| Potato early_blight | 100.00 | 100.00 | 100.00 |
| Potato late_blight | 100.00 | 100.00 | 100.00 |
| Potato healthy | 96.88 | 100.00 | 98.41 |
| Raspberry healthy | 100.00 | 100.00 | 100.00 |
| Soybean healthy | 100.00 | 99.90 | 99.95 |
| Squash powdery_mildew | 100.00 | 100.00 | 100.00 |
| Strawberry leaf_scorch | 100.00 | 100.00 | 100.00 |
| Strawberry healthy | 100.00 | 100.00 | 100.00 |
| Tomato bacterial_spot | 99.53 | 100.00 | 99.77 |
| Tomato early_blight | 98.03 | 99.50 | 98.76 |
| Tomato late_blight | 100.00 | 98.95 | 99.47 |
| Tomato leaf_Mold | 100.00 | 100.00 | 100.00 |
| Tomato septoria_leaf_spot | 100.00 | 99.43 | 99.72 |
| Tomato spider_mites_two-spotted_spider_mite | 100.00 | 98.51 | 99.25 |
| Tomato target_Spot | 98.94 | 100.00 | 99.47 |
| Tomato tomato_yellow_leaf_curl_virus | 99.44 | 99.81 | 99.63 |
| Tomato tomato_mosaic_virus | 100.00 | 100.00 | 100.00 |
| Tomato healthy | 100.00 | 100.00 | 100.00 |
| Class | Precision | Recall | F1 Score |
|---|---|---|---|
| Apple Scab Leaf | 62.50 | 100.00 | 76.92 |
| Apple Leaf | 42.11 | 88.89 | 57.14 |
| Apple Rust Leaf | 100.00 | 50.00 | 66.67 |
| Bell Pepper Leaf | 75.00 | 75.00 | 75.00 |
| Bell Pepper Leaf Spot | 44.44 | 44.44 | 44.44 |
| Blueberry Leaf | 50.00 | 36.36 | 42.11 |
| Cherry Leaf | 57.14 | 40.00 | 47.06 |
| Corn Gray Leaf Spot | 12.50 | 25.00 | 16.67 |
| Corn Leaf Blight | 53.85 | 58.33 | 56.00 |
| Corn Rust Leaf | 100.00 | 60.00 | 75.00 |
| Peach Leaf | 85.71 | 66.67 | 75.00 |
| Potato Leaf Early Blight | 30.77 | 50.00 | 38.10 |
| Potato Leaf Late Blight | 25.00 | 25.00 | 25.00 |
| Raspberry Leaf | 87.50 | 100.00 | 93.33 |
| Soybean Leaf | 80.00 | 50.00 | 61.54 |
| Squash Powdery Mildew Leaf | 100.00 | 100.00 | 100.00 |
| Strawberry Leaf | 100.00 | 100.00 | 100.00 |
| Tomato Early Blight Leaf | 50.00 | 22.22 | 30.77 |
| Tomato Septoria Leaf Spot | 43.75 | 63.64 | 51.85 |
| Tomato Leaf | 100.00 | 37.50 | 54.55 |
| Tomato Leaf Bacterial Spot | 20.00 | 22.22 | 21.05 |
| Tomato Leaf Late Blight | 66.67 | 80.00 | 72.73 |
| Tomato Leaf Mosaic Virus | - | 0.00 | - |
| Tomato Leaf Yellow Virus | 100.00 | 83.33 | 90.91 |
| Tomato Mold Leaf | 36.36 | 66.67 | 47.06 |
| Grape Leaf | 85.71 | 100.00 | 92.31 |
| Grape Leaf Black Rot | 100.00 | 87.50 | 93.33 |
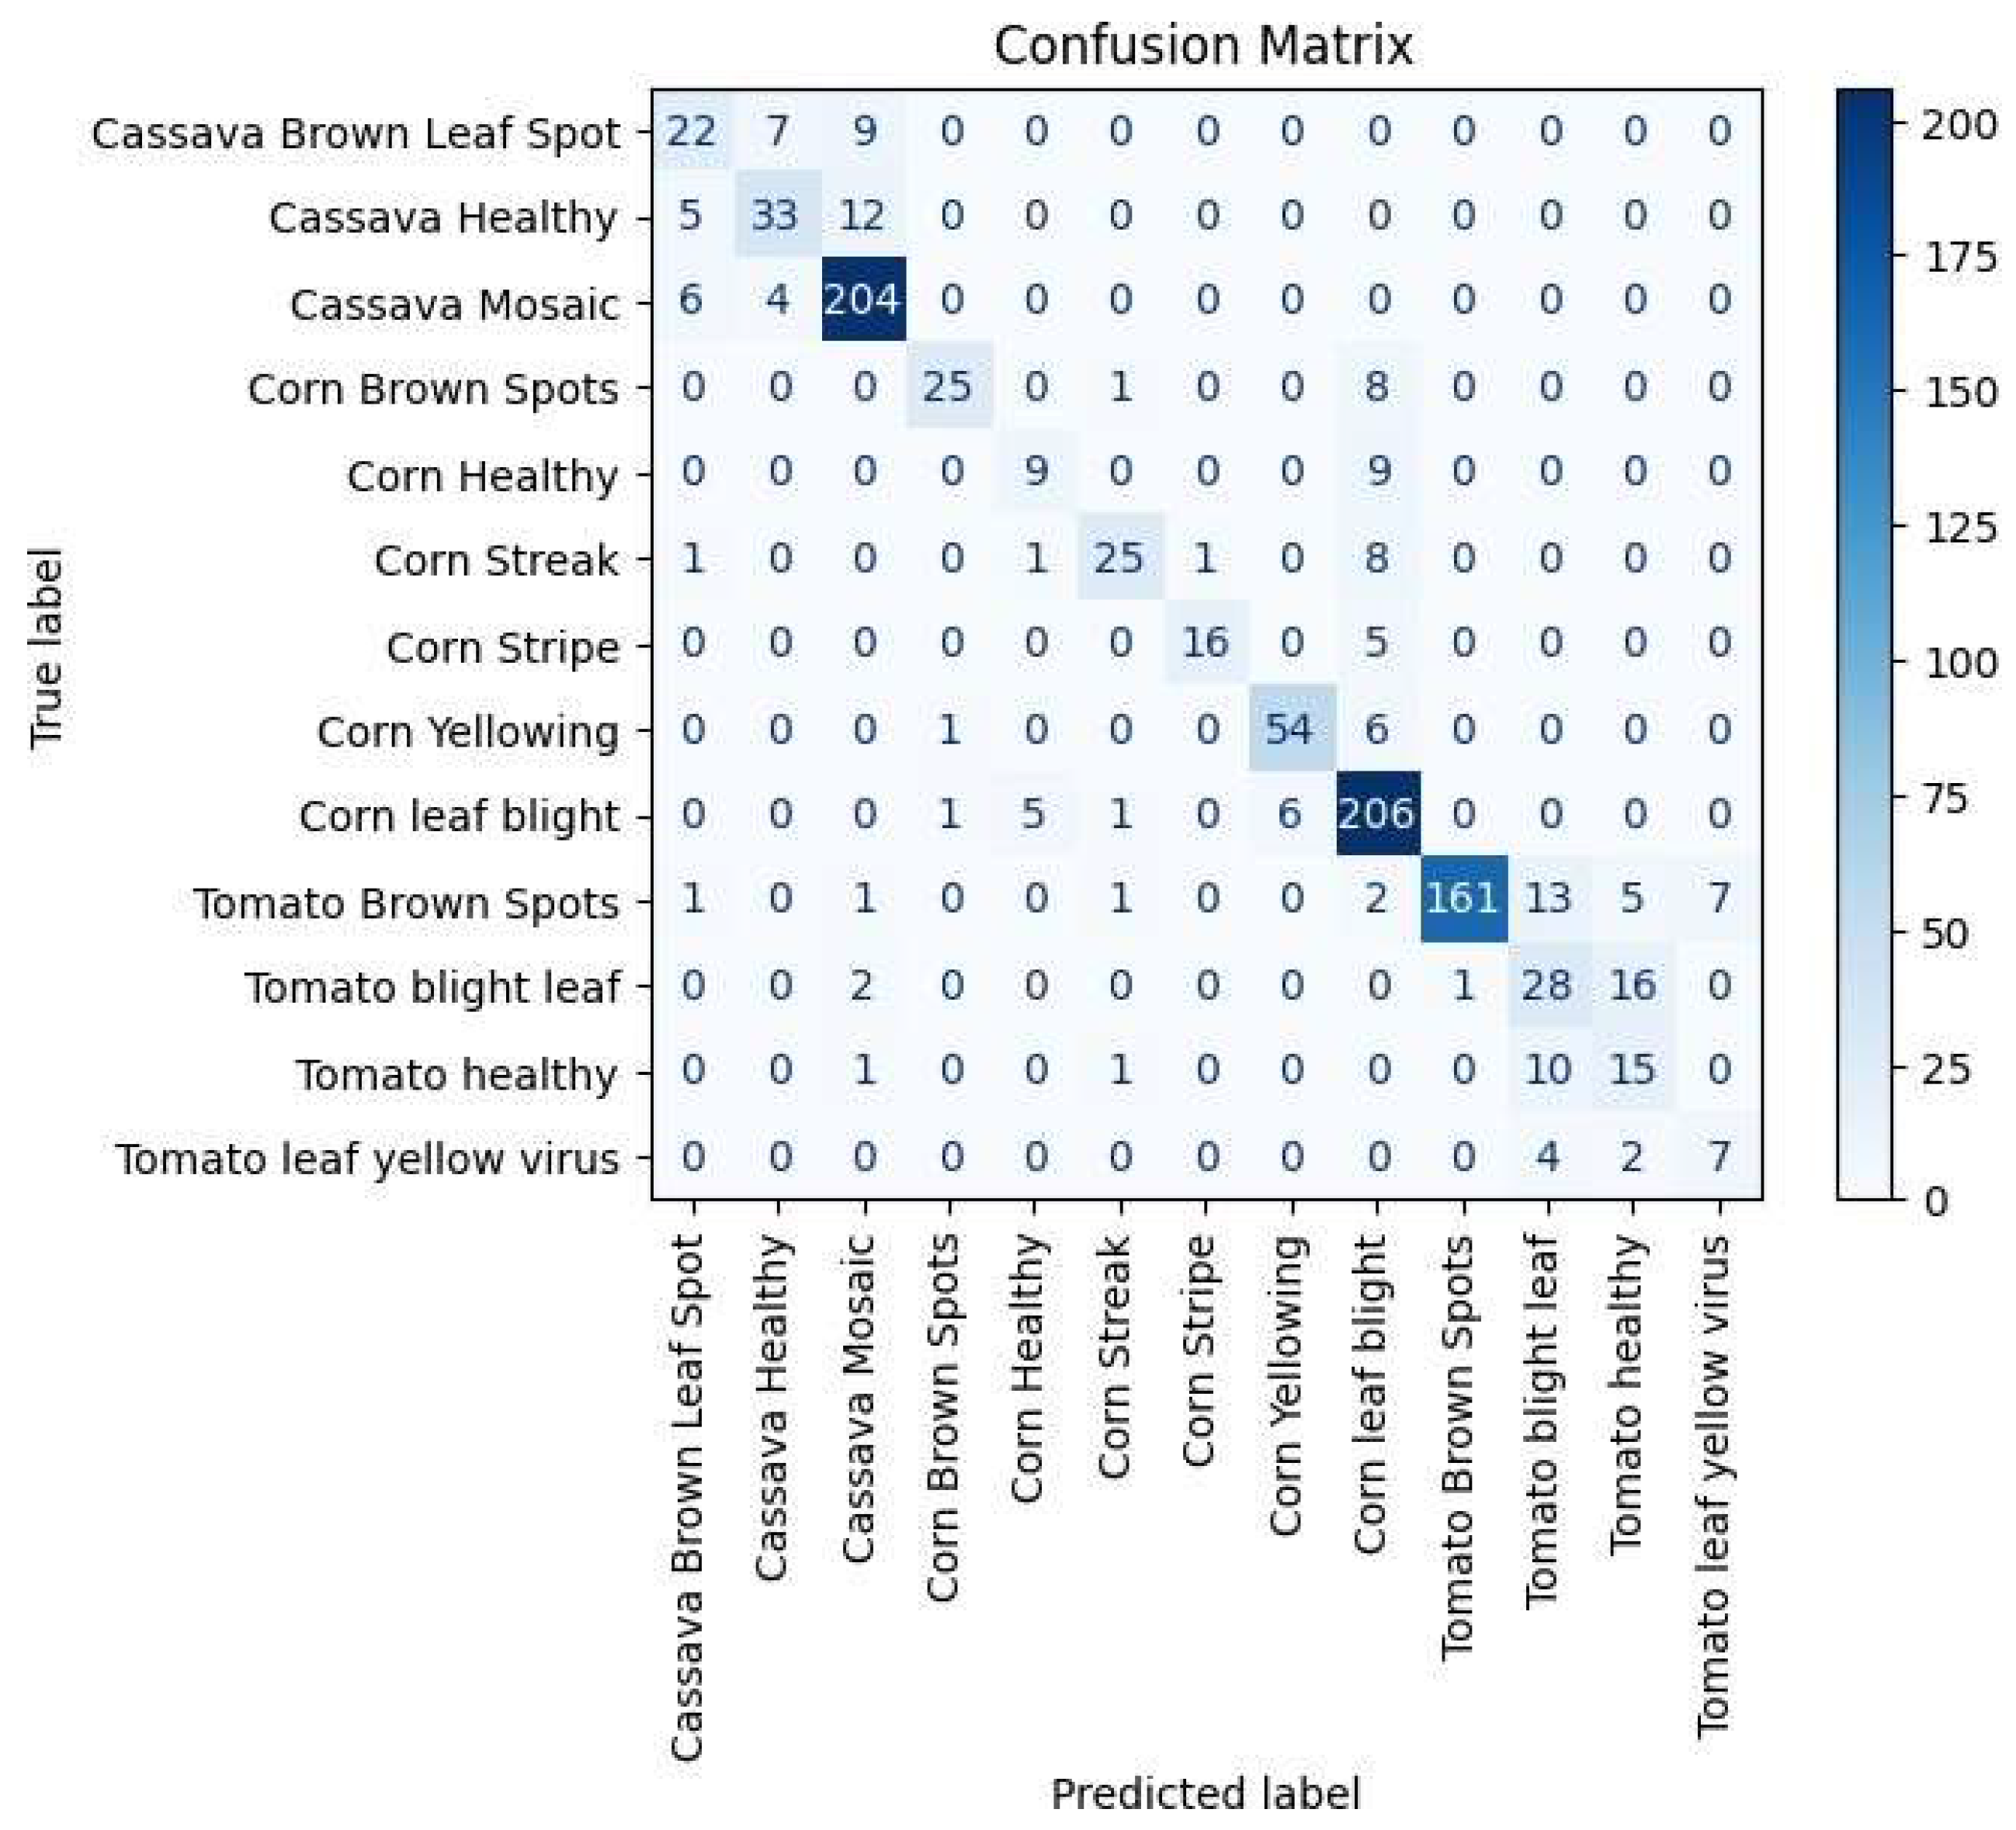
| Class | Precision | Recall | F1 Score |
|---|---|---|---|
| Cassava Brown Leaf Spot Cassava Healthy | 62.86 75.00 | 57.89 66.00 | 60.27 70.21 |
| Cassava Mosaic | 89.08 | 95.33 | 92.10 |
| Corn Brown Spots | 92.59 | 73.53 | 81.97 |
| Corn Healthy | 60.00 | 50.00 | 54.55 |
| Corn Streak | 86.21 | 69.44 | 76.92 |
| Corn Stripe | 94.12 | 76.19 | 84.21 |
| Corn Yellowing | 90.00 | 88.52 | 89.26 |
| Corn Leaf Blight Tomato Brown | 84.43 | 94.06 | 88.98 |
| Spots Tomato Blight Leaf | 99.38 50.91 | 84.29 59.57 | 91.22 54.90 |
| Tomato Healthy | 39.47 | 55.56 | 46.15 |
| Tomato Leaf Yellow | 50.00 | 53.85 | 51.85 |
| Layers Included in the Model | Accuracy |
|---|---|
| No additional layer | 58.4% |
| One layer—dense layer | 56.7% |
| Two layers—dense layer and batch normalization | 58.8% |
| Three layers—dense layer, batch normalization, and dropout | 60.1% |
| Model | Accuracy |
|---|---|
| InceptionResNetV2 | 57.6% |
| MobileNetV2 | 43.2% |
| EfficientNetB3 | 12.2% |
| InceptionResNetV2 and MobileNetV2 | 58% |
| MobileNetV2 and EfficientNetB3 | 52.5% |
| InceptionResNetV2 and EfficientNetB3 | 54.2% |
| All three models | 60.1% |
Disclaimer/Publisher’s Note: The statements, opinions and data contained in all publications are solely those of the individual author(s) and contributor(s) and not of MDPI and/or the editor(s). MDPI and/or the editor(s) disclaim responsibility for any injury to people or property resulting from any ideas, methods, instructions or products referred to in the content. |
© 2025 by the authors. Licensee MDPI, Basel, Switzerland. This article is an open access article distributed under the terms and conditions of the Creative Commons Attribution (CC BY) license (https://creativecommons.org/licenses/by/4.0/).
Share and Cite
Zubair, F.; Saleh, M.; Akbari, Y.; Al Maadeed, S. A Robust Ensemble Model for Plant Disease Detection Using Deep Learning Architectures. AgriEngineering 2025, 7, 159. https://doi.org/10.3390/agriengineering7050159
Zubair F, Saleh M, Akbari Y, Al Maadeed S. A Robust Ensemble Model for Plant Disease Detection Using Deep Learning Architectures. AgriEngineering. 2025; 7(5):159. https://doi.org/10.3390/agriengineering7050159
Chicago/Turabian StyleZubair, Fida, Moutaz Saleh, Younes Akbari, and Somaya Al Maadeed. 2025. "A Robust Ensemble Model for Plant Disease Detection Using Deep Learning Architectures" AgriEngineering 7, no. 5: 159. https://doi.org/10.3390/agriengineering7050159
APA StyleZubair, F., Saleh, M., Akbari, Y., & Al Maadeed, S. (2025). A Robust Ensemble Model for Plant Disease Detection Using Deep Learning Architectures. AgriEngineering, 7(5), 159. https://doi.org/10.3390/agriengineering7050159