Article

Durum Wheat (Triticum durum Desf.) Grain Yield and Protein Estimation by Multispectral UAV Monitoring and Machine Learning Under Mediterranean Conditions

1
Dipartimento di Agraria, Università degli Studi “Mediterranea” di Reggio Calabria, Località Feo di Vito s.n.c., I-89122 Reggio Calabria, Italy
2
Dipartimento di Scienze Veterinarie, Università degli Studi di Messina, Viale G. Palatucci s.n.c., I-98168 Messina, Italy
*
Author to whom correspondence should be addressed.
AgriEngineering 2025, 7(4), 99; https://doi.org/10.3390/agriengineering7040099
Submission received: 30 January 2025 / Revised: 16 March 2025 / Accepted: 26 March 2025 / Published: 1 April 2025
(This article belongs to the Section Sensors Technology and Precision Agriculture)

Abstract

:
Durum wheat (Triticum durum Desf.), among the herbaceous crops, is one of the most extensively grown in the Mediterranean area due to its fundamental role in supporting typical food productions like bread, pasta, and couscous. Among the environmental and technical aspects, nitrogen (N) fertilization is crucial to shaping plant development and that of kernels by also affecting their protein concentration. Today, new techniques for monitoring fields using uncrewed aerial vehicles (UAVs) can detect crop multispectral (MS) responses, while advanced machine learning (ML) models can enable accurate predictions. However, to date, there is still little research related to the prediction of the N nutritional status and its effects on the productivity of durum wheat grown in the Mediterranean environment through the application of these techniques. The present research aimed to monitor the MS responses of two different wheat varieties, one ancient (Timilia) and one modern (Ciclope), grown under three different N fertilization regimens (0, 60, and 120 kg N ha−1), and to estimate their quantitative and qualitative production (i.e., grain yield and protein concentration) through the Pearson’s correlations and five different ML approaches. The results showed the difficulty of obtaining good predictive results with Pearson’s correlation for both varieties of data merged together and for the Timilia variety. In contrast, for Ciclope, several vegetation indices (VIs) (i.e., CVI, GNDRE, and SRRE) performed well (r-value > 0.7) in estimating both productive parameters. The implementation of ML approaches, particularly random forest (RF) regression, neural network (NN), and support vector machine (SVM), overcame the limitations of correlation in estimating the grain yield (R2 > 0.6, RMSE = 0.56 t ha−1, MAE = 0.43 t ha−1) and protein (R2 > 0.7, RMSE = 1.2%, MAE 0.47%) in Timilia, whereas for Ciclope, the RF approach outperformed the other predictive methods (R2 = 0.79, RMSE = 0.56 t ha−1, MAE = 0.44 t ha−1).

1. Introduction

Among the crops grown on arable land, durum wheat (Triticum durum Desf.) is a niche crop cultivated on about 13.7 million ha, producing 34.3 million tons of grain globally [1]. One of its main production areas is the Mediterranean basin, including European (Italy, Spain, France, Greece), northern African (Tunisia, Algeria, Morocco) and south-west Asian (Syria, Turkey) countries, where this plant is one of the most cultivated in crop rotations and represents the main raw product for typical staple foods like pasta, couscous, bulgur and bread [1]. In addition, durum wheat products significantly contribute to the commercial exports of some of these nations, like Italy [2]. Unfortunately, in recent years, due to several different causes, like conflicts and the increasingly pronounced effects of climate change (i.e., extreme storms and drought periods), the supply of the global market with this product has been erratic, causing, as a consequence, considerable price volatility [3,4]. Even more difficult has been the grain procurement of typical ancient wheat varieties, characterized by higher nutritional value and extrinsic quality, used for the manufacture of high-quality pasta and bakery products [5,6]. This scenario brought out the demand for strategic instruments to plan the purchasing of durum wheat, such as supply chain agreements with farmers [5].
Among the wheat grain parameters, the protein concentration represents the most important property for product qualification in view of its importance for industrial manufacturing and especially for pasta production. As is well known, nitrogen (N) fertilization management plays a key role in determining this parameter among farming practices [6,7,8]. Hence, N fertilizers are a significant expense in durum wheat cultivation and quality grain production, with the costs increasing over time due to the surge in international market prices, primarily influenced by escalating energy costs [9]. In addition, non-carefully planned application can cause uncontrolled and dangerous release of N into agroecosystems through various mechanisms, like nitrate leaching and gaseous emissions of NH3 and N2O [10].
Uncertainty in food production due to climate change and the reduction of chemical inputs to cut environmental impacts are the two main challenges that agriculture of the third millennium will have to face [11]. To overcome these challenges, it is necessary for agriculture to equip itself with advanced systems for crop management and yield forecasting, based on the principles of precision farming, that permit extensive and precise control over the fields to monitor the plant’s nutritional status and growth [12]. Remote sensing (RS) methods offer various solutions for assessing plant conditions and estimating production [13]. Among these technologies, the use of uncrewed aerial vehicles (UAVs) with multispectral (MS) sensors could provide valuable and reliable crop information with high spatial and temporal resolutions quickly and at a cost that even medium-sized farms can afford [14,15]. The spectral response to different bands can be combined to obtain vegetation indices (VIs) capable of surveying and discriminating vegetation cover and its conditions, as widely used to predict plant growth and yields in several different crops [16,17,18,19,20]. However, finding reliable, simple linear relationships between plant VI responses and their productivity is not always easy or obvious, and a direct application of indices may reveal itself to be simplistic and unreliable, especially for more complex variables or management guidance [21]. Therefore, a more advanced approach to using VIs involves them being used in implementing machine learning (ML) techniques, alone or in combination with other data, to obtain effective interpretation of biological processes and achieve more robust estimations [22,23]. The ML applications have increased due to the augmented availability of programs and scripts for their execution and several models have been successfully tested on agricultural data; among them, neural networks, k-nearest neighbours, random forest regressions, support vector machines, stochastic gradient boosting and deep learning models are the most applied [22,24,25,26,27]. In this regard, several studies have highlighted the potential of ML models to predict the plant status and yield in different crops, like common wheat [28,29], barley [30,31], oat [18,32], tomato [19,33], potato [34,35], etc. Despite the considerable potential benefits of the application of VI data and ML algorithms for yield and quality predictions, as well as crop management support, limited studies have been carried out on durum wheat, especially in the Mediterranean area where this crop has strategic importance (e.g., [22,36,37,38,39,40,41]), as stated above. In one of these studies, Badagliacca et al. [38], comparing the performance of five different models—LM, RF, SVM, k-NN, and NN—fed with VIs obtained by UAV flights, highlighted that the RF, SVM, and k-NN models provided the best predictions of the durum wheat yield. The same study, conducted under uniform fertilization conditions, also revealed that not all wheat varieties exhibit a linear relationship between the yield and VIs, indicating their varying suitability for remote sensing. Therefore, within this context, the cultivar response to VIs under different fertilization management and the performance of ML approaches fed with VI data need to be assessed. Thus, the current experiment aimed to (i) assess the spectral behaviour of two different durum wheat cultivars, an ancient (Timilia) and a modern (Ciclope) one, cultivated under three N fertilization regimens (0, 60, and 120 kg ha−1); (ii) examine the relationships between the observed VIs and cultivar quantitative and qualitative production data; and (iii) assess the possibility of using ML models for durum wheat productivity forecasting.

2. Materials and Methods

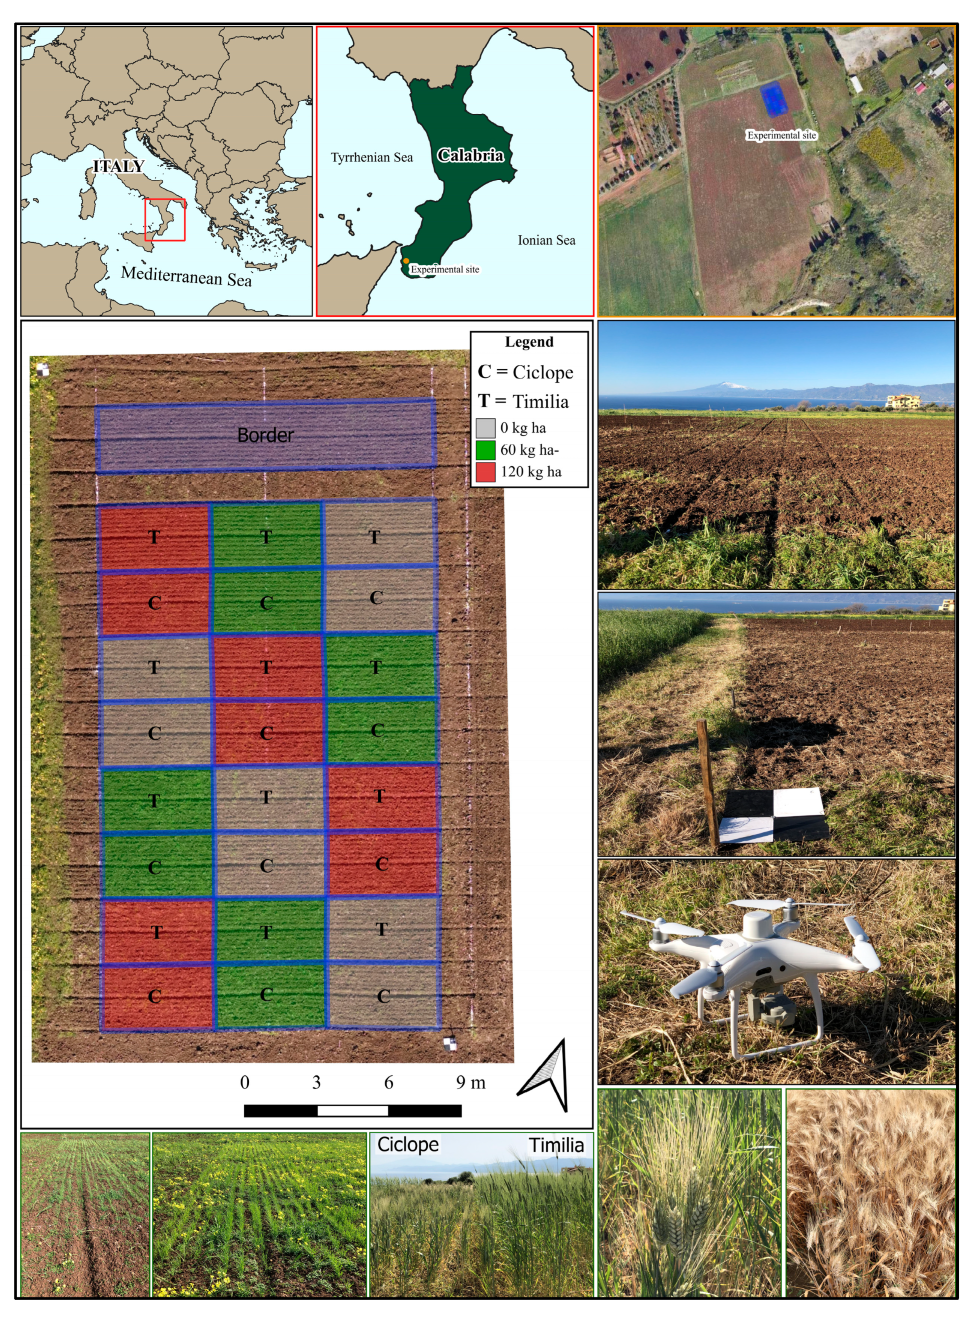
2.1. Experimental Site

The experimental field was located within the Mediterranea University of Reggio Calabria’s experimental farm, sited in Gallina of Reggio Calabria, Calabria, Italy (38°10′ N, 15°45′ E, 232 m a.s.l.) (Figure 1). The soil at the experimental site is a Typic Haploxeralf [42] and its properties are as follows (Ap horizon): clay 35%, silt 25% and sand 40%, the texture is clay loam, pH 7.05 (1:2.5H2O), electrical conductivity (EC) 0.165 dS m−1 (1:2), cation exchange capacity (CEC) 17.2 cmol+ kg−1, total carbonates 8.4 g kg−1, total organic C 19.3 g kg−1, total nitrogen (N) 1.8 g kg−1, and available phosphorus (P) 9.30 mg kg−1. The climate of the site is classified as semiarid Mediterranean, featuring mild, rainy winters and warm, dry summers. The mean annual rainfall is 617 mm (20-years average), primarily concentrated in autumn–winter (77%) and spring (22%). The mean yearly air temperature is 17.2 °C (20-years average), with mean values of 19.5 °C in autumn, 12.0 °C in winter, 15.9 °C in spring, and 25.1 °C in summer. The average minimum and maximum annual temperatures, respectively, are 11.6 °C and 27.5 °C.

2.2. Experimental Design and Crop Management

The field experiment was set up according to a strip plot design with four replications (n = 4). The tested treatments were two different and contrasting wheat (Triticum durum Desf.) varieties, a modern, dwarf/small size, less N efficient and with low spike glaucescence cultivar called Ciclope and an ancient, tall size, more N efficient and with high spike glaucescence cultivar called Timilia, and three N fertilization regimens, an unfertilized control (N0), fertilization with 60 kg ha−1 of N and fertilization with 120 kg ha−1 of N. The two tested wheat varieties acted as vertical treatments (Var) while the three fertilization regimes as horizontal treatments (Fert), and both were randomly assigned to the plots; each plot covered the surface of ~14 m2 (Figure 1). The experimental field succeeded to a bur clover (Medicago polymorpha L.)/oat (Avena sativa L.) pasture. The soil was tilled to a depth of 30 cm in late summer, followed by two rounds of harrowing in the autumn. The wheat was sown on 12 December, at the density of 400 viable seeds per square meter in rows spaced 0.19 m apart. In the fertilized plots, the N dose was administered half at sowing (BBCH 00 phase) and half at the end of the tillering (BBCH 29 phase) by using urea (46% N). During the cropping season, the plots were manually weeded. Any treatment against diseases and insects was provided to the crop.
At the heading phase (BBCH 59 phase), the plant height, using a wood ruler, and the chlorophyll concentration index (CCI), using a chlorophyll concentration meter (MC-100 Apogee Instruments, North Logan, UT, USA), were measured. Upon reaching complete maturity on the 8th of June (full ripe stage, 89 BBCH stage), the total aboveground plant biomass of each plot was sampled. The total biomass was determined after drying at 60 °C in the oven. The harvested biomass was threshed and separated into grains and straw, then the grain was weighed in order to calculate the related yield. The grain was milled using a laboratory mill equipped with a 1 mm sieve and then analyzed for the N concentration following the Kjeldahl method [43] using a Foss Tecator digester and a Foss Kjeltec 8400 distillation unit (Foss Italia, Padova, Italia). The grain N concentration was converted into the protein percentage by applying a transformation factor of 5.81 [44].

2.3. UAV Surveys and Image Processing

A multirotor DJI Phantom 4 Multispectral UAV (DJI Ltd., Shenzhen, China) was used to carry out the MS survey. This UAV is equipped with a camera that produces images in 1600 × 1300 pixels (2 MP resolution) in five bands in addition to RGB (blue, green, red, red edge, and near-infrared—NIR). The UAV surveys were performed on the 20th of May (wheat heading phase, 55 BBCH-scale phase) at a speed of 2 m−s and a flight height of 20 m a.g.l.
Five geo-referenced ground control points (Figure 1) were positioned in the field using a Leica RTK global navigation satellite system (GNSS) with an accuracy of ±0.03 m. Each ground control point was made of a white polypropylene panel with the dimensions of 50 cm × 50 cm and two quadrants were covered using black cardboard to locate the center point. The MS images were processed through aerial image triangulation with the geo-tagged flight log and geographic tags using the software Agisoft Metashape (Agisoft LCC, version 2.1.0, St. Petersburg, Russia). Figure 2 synthesizes the survey and image processing workflow.
A reflectance orthomosaic for each band with a spatial resolution of 1 cm of ground sample distance was generated. The orthomosaic image was calibrated, converting the digital numerical values into the reflectance, using a field spectroradiometer and a grey polypropylene calibration panel placed in the field during the flight. Further information on the photogrammetric process can be found in previously published research [15,16,23]. The reflectance orthomosaics were combined to generate a set of VIs selected according to previous research [16,38] (Table 1).

2.4. Statistical and Machine Learning (ML) Approaches

The experimental data were gathered and organized in MS Excel(TM). The statistical and ML analyses were carried out in the RStudio 2024. 12.0 environment [56]. The chlorophyll concentration index (CCI), plant height, wheat grain yield, and protein concentration data were analyzed by a two-way ANOVA (Var × Fert) followed by Tukey’s HSD test at the 5% probability level (p < 0.05) for the mean comparisons.
Pearson’s correlations and five different ML approaches were used to investigate the relationships between the wheat yield, protein concentration, and VIs for both varieties together and separately. The Pearson’s correlations were executed using the function “cor()” [57]. The prediction models were developed and assessed by the “Caret” package [58]. Five distinct models, frequently employed in agricultural studies [23,38,59,60], were tested: (1) linear model (LM), (2) random forest (RF) regression, (3) linear support vector machines (SVM), (4) k-nearest neighbours (k-NN), and (5) neural networks (NNs). The experimental data (i.e., yield/protein and VI values) were split into two datasets, one for training (70%) and one for validation (30%), to develop and validate the models’ performances. This process was repeated 100 times using bootstrap sampling to ensure a thorough and consistent model evaluation capable of capturing the widest variability in the training and validation data. The ML models were set with the standard hyperparameters applied by the “Caret” package as follows: RF: mtry p/3; ntree 500; nodesize 5; importance FALSE; SVM: preprocess SCALE; C 1; sigma median of Euclidean distances; k-NN: preprocess SCALE; k 3; distance Euclidean; NN: size 1; decay 0; maxit 100; linout FALSE. The model’s performance was assessed by comparing the calculated dataset with the validation dataset using the coefficient of determination (R2), root mean square error (RMSE), and mean absolute error (MAE) observed in 50% of the repetitions (50th percentile).

3. Results and Discussion

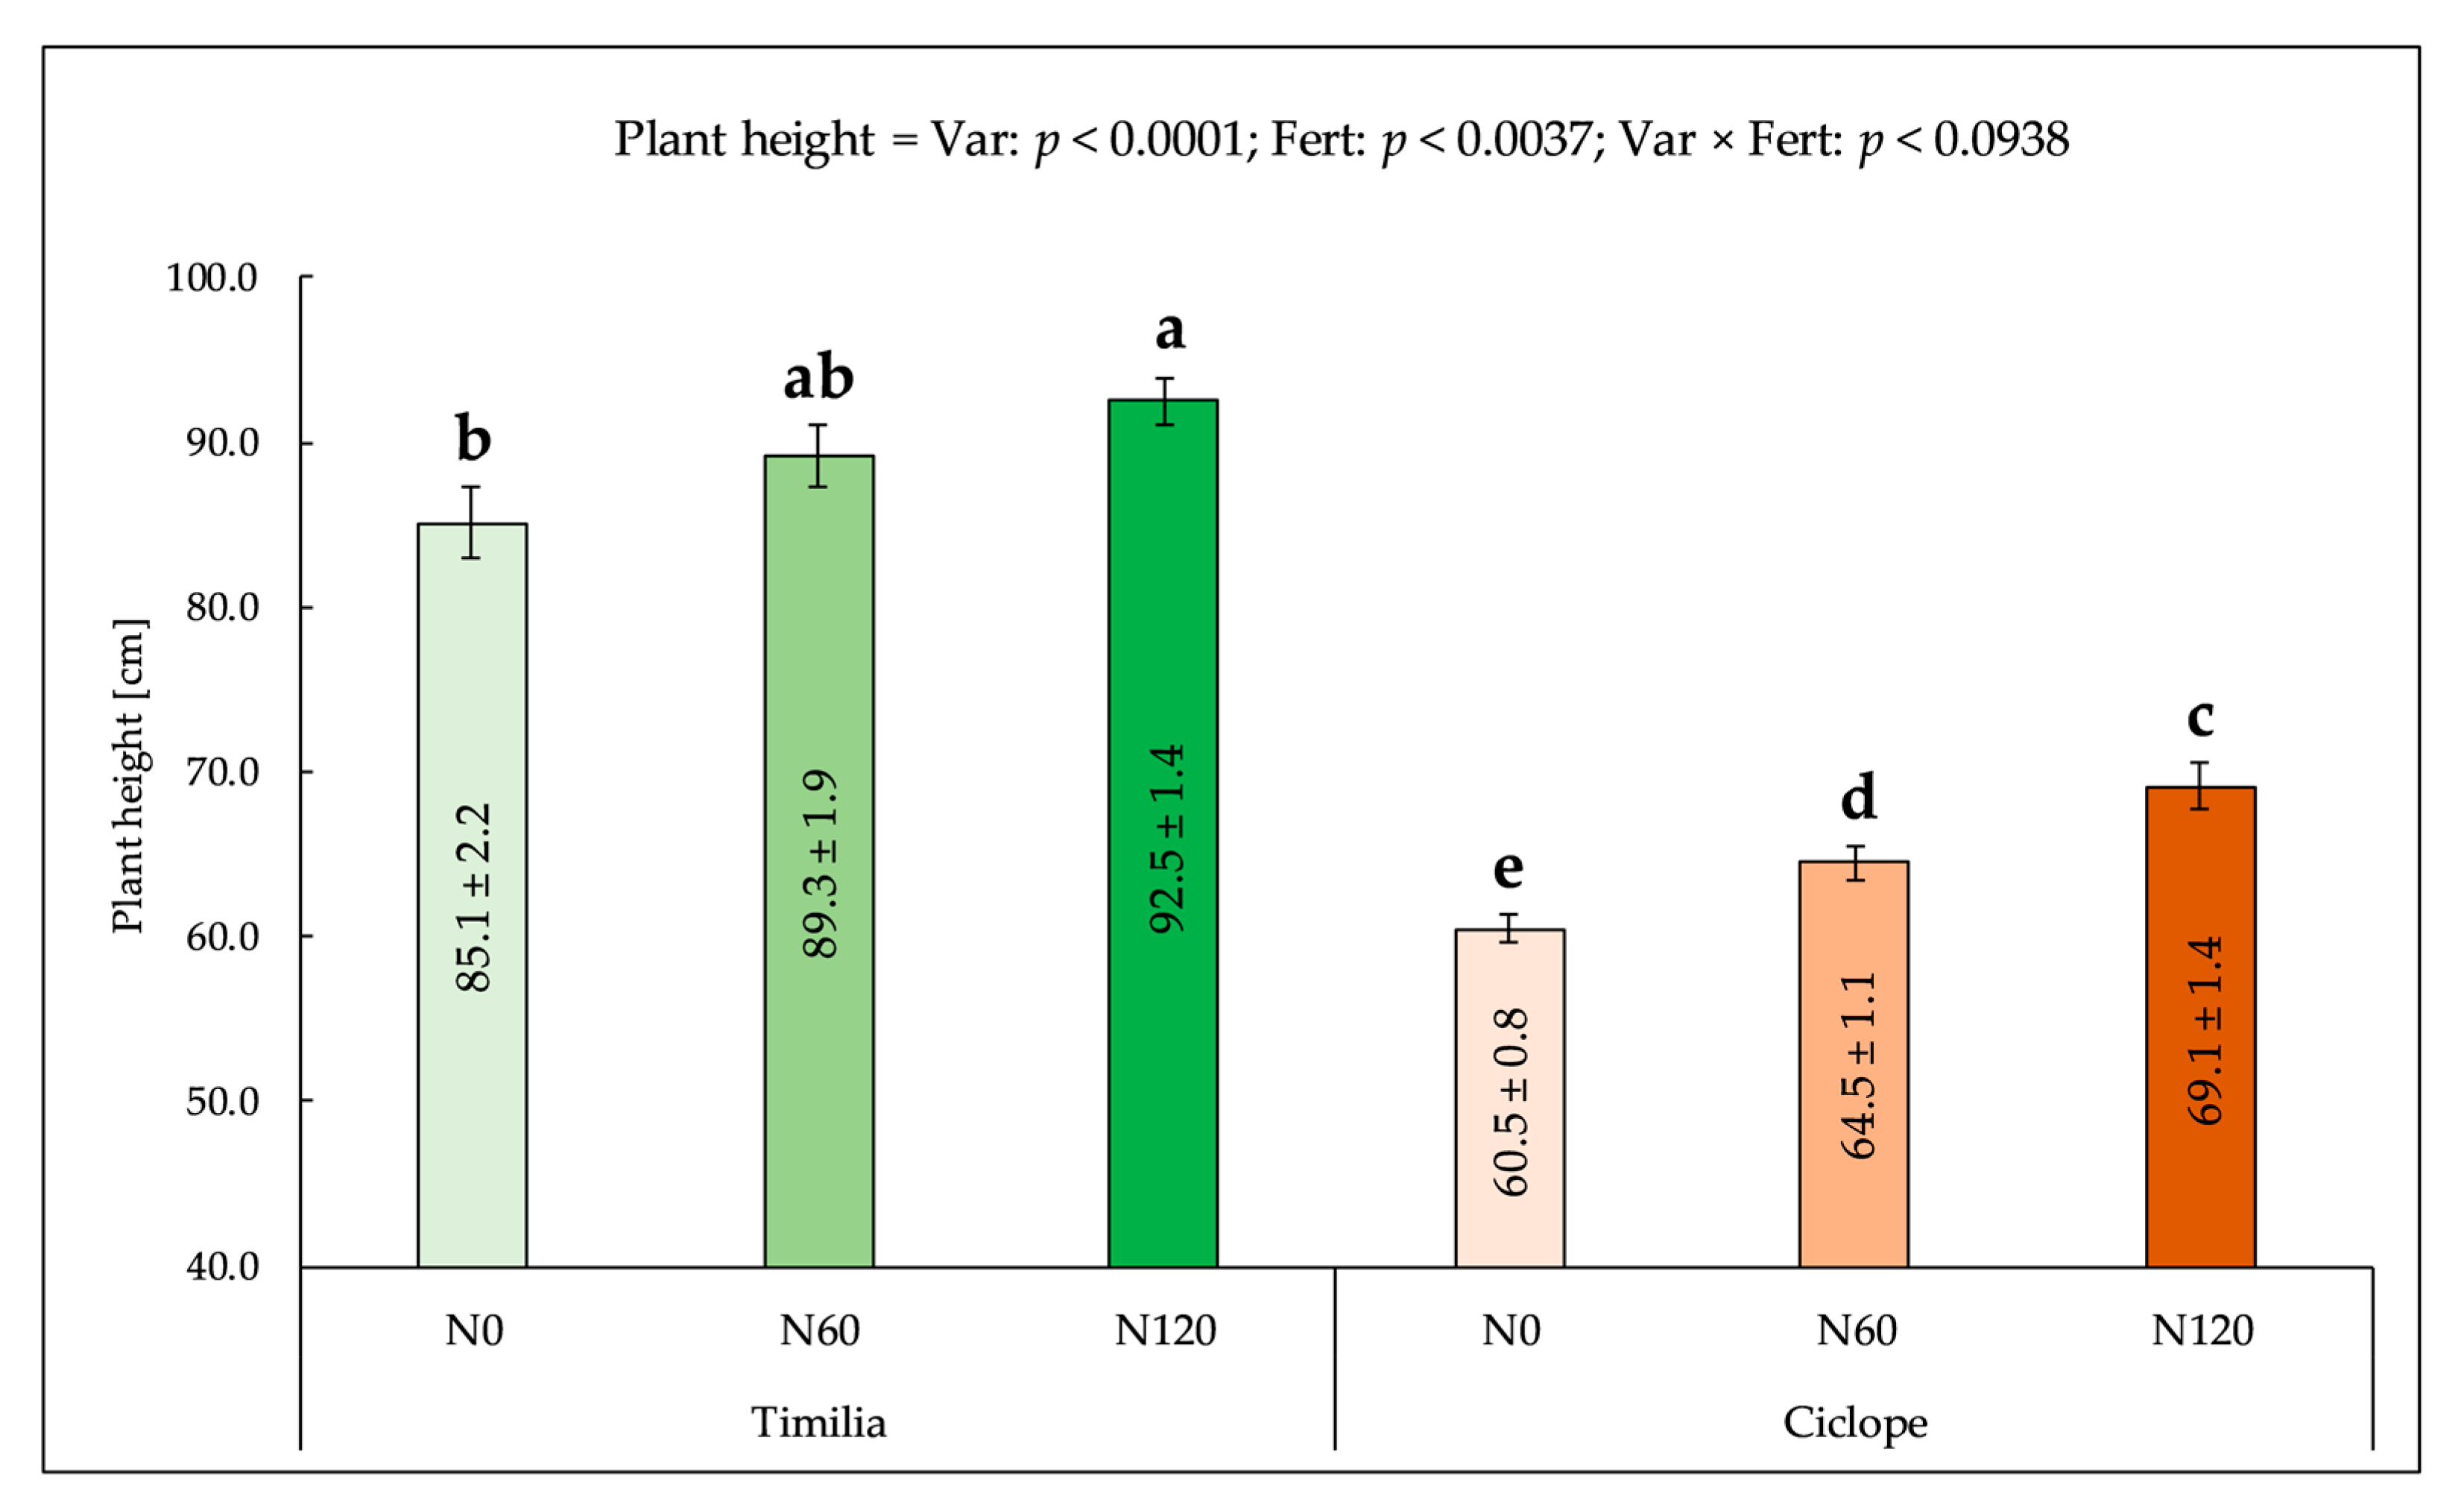
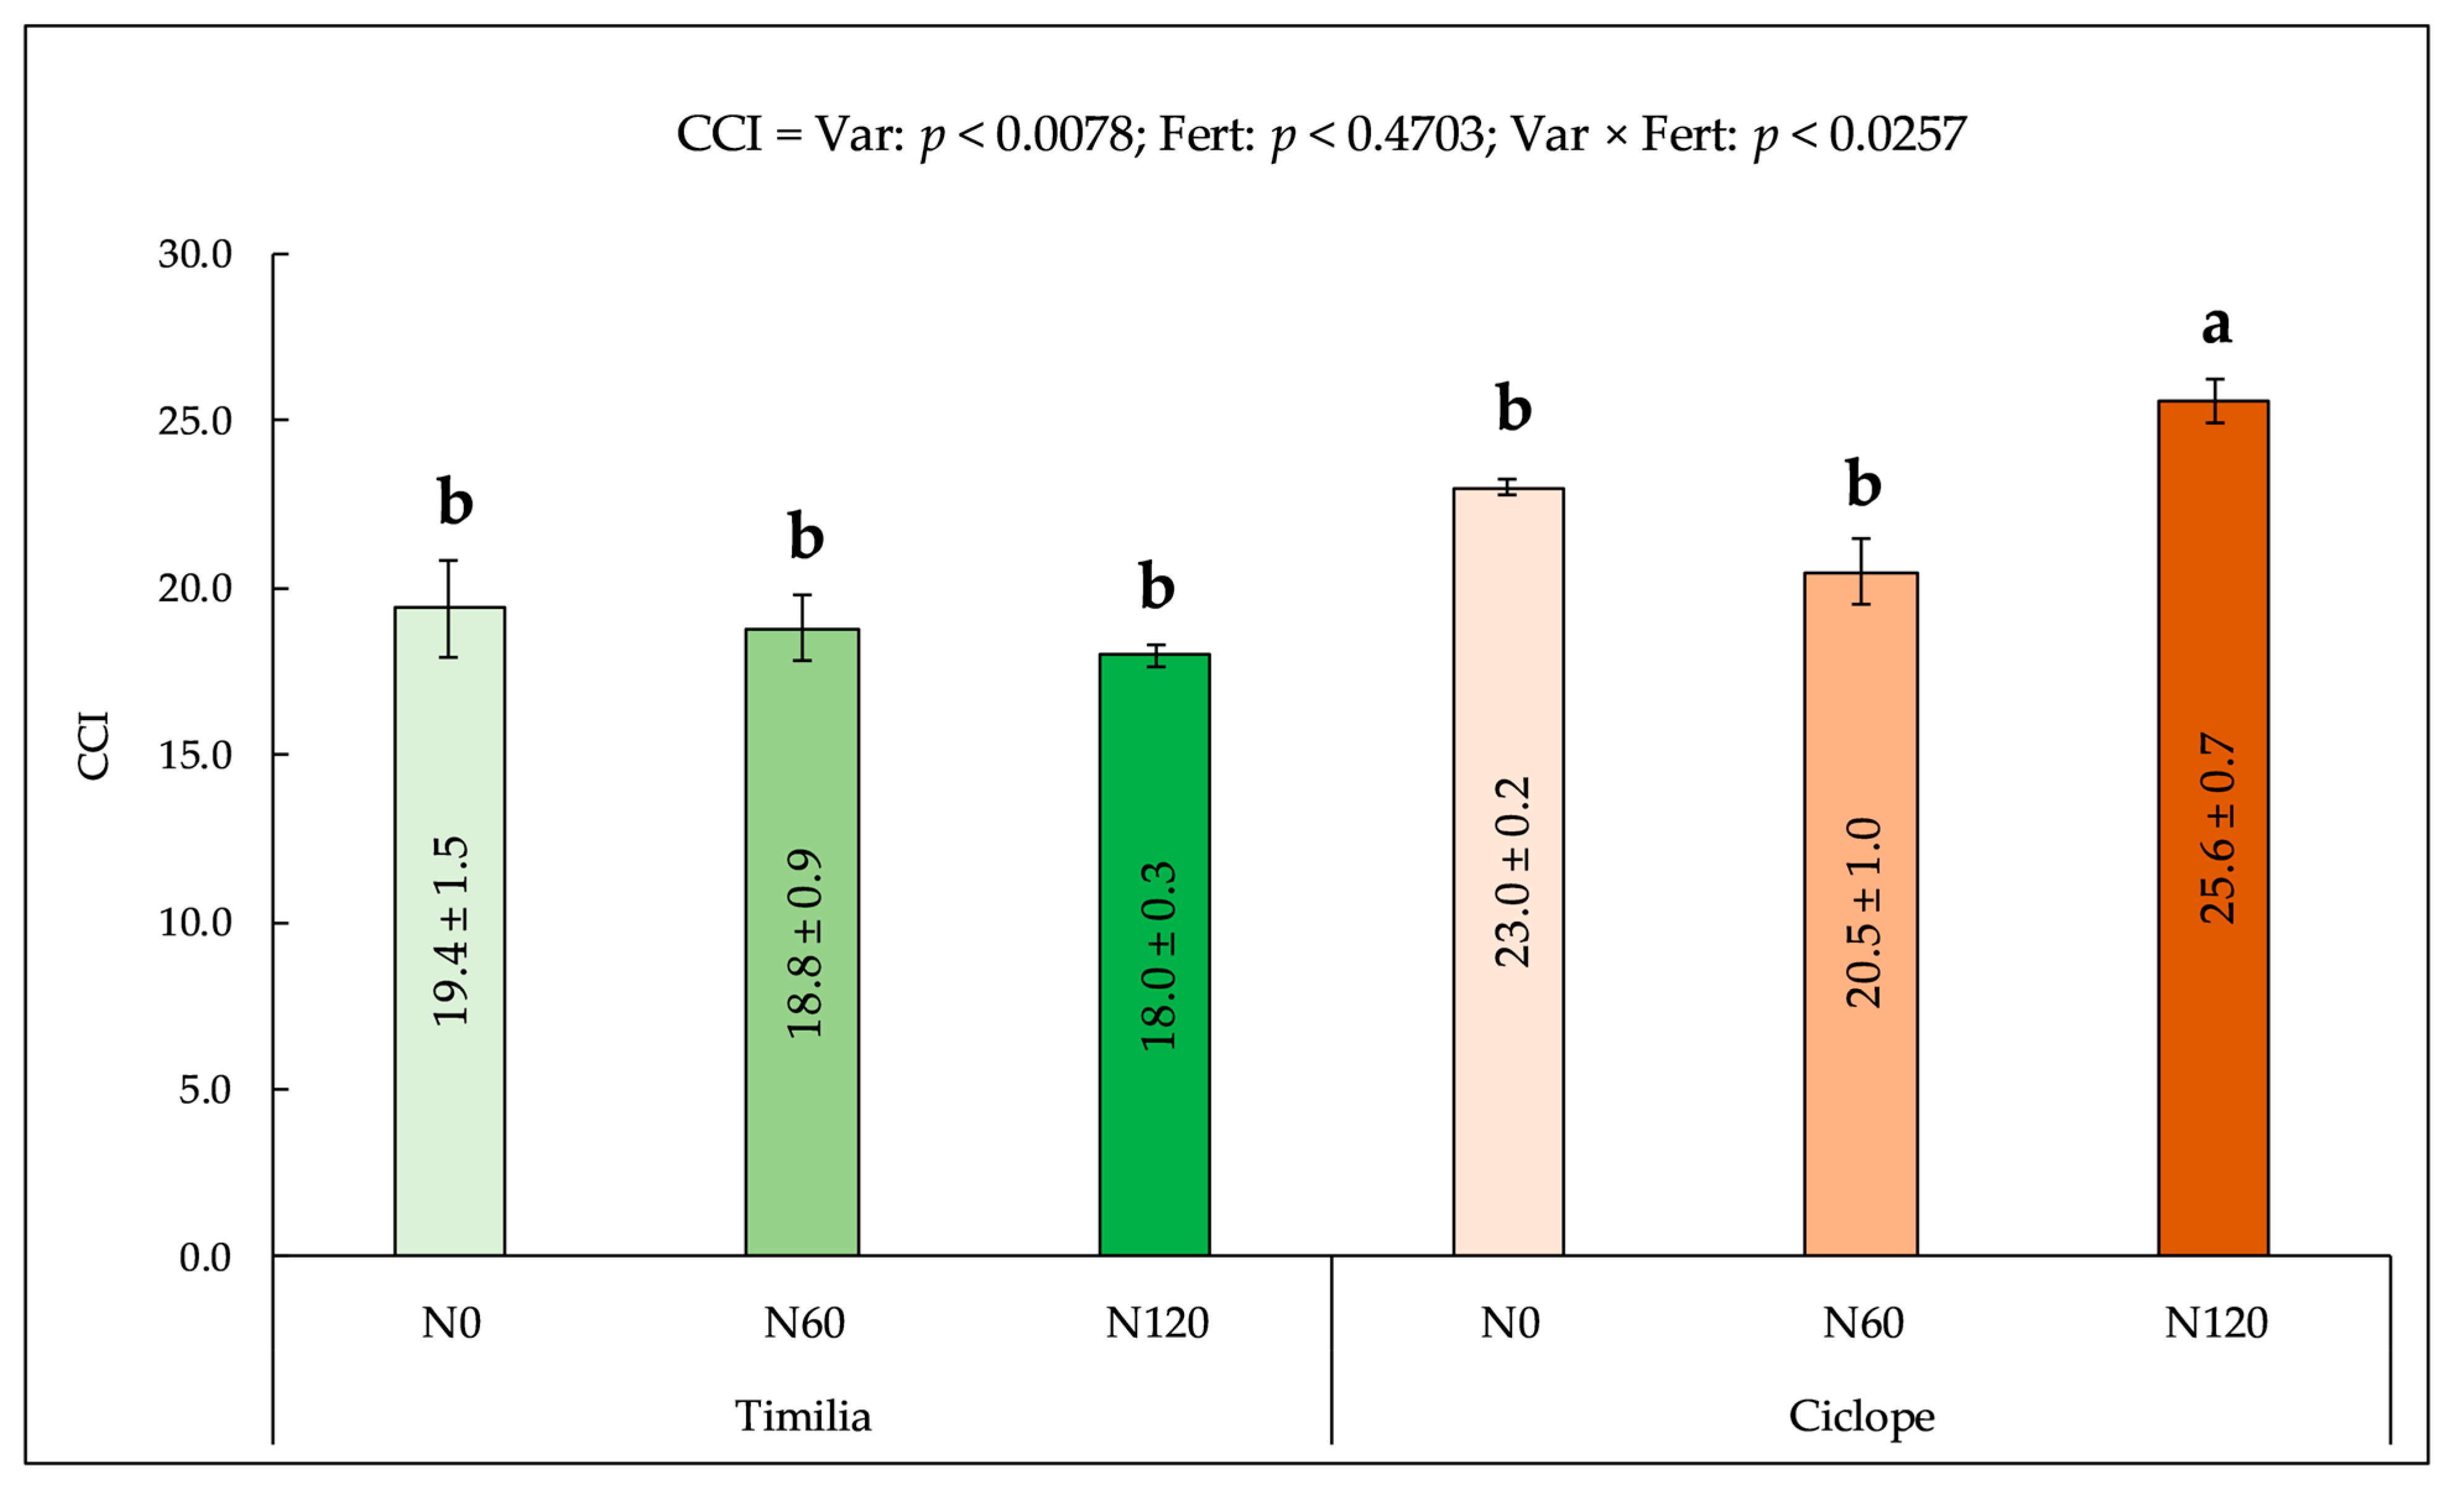
3.1. Plant Height and Chlorophyll Concentration Index

The plant height data showed the statistically significant effect of the variety and fertilization (p < 0.05) but not from their interaction (p > 0.05) (Figure 3). Timilia showed a significantly higher size than Ciclope (an average of 88.9 ± 3.7 cm vs. 64.7 ± 4.3 cm). For both varieties, the plant height increased as the N dosage administered increased, with an increment from N0 to N120, equal to +7.4 cm for Timilia and +8.6 cm for Ciclope (Figure 3).
The plant height reflects the genetic attitude of the variety to vertical growth and its nutritional/health status linked to the crop yield [61]. Timilia showed the characteristic great height of ancient varieties [7,62], which often makes them susceptible to the phenomenon of lodging, whose risk increases with increasing N doses [63], as also revealed in the present experiment. By the way, the effect of N fertilization was also observed in Ciclope, slightly higher than in Timilia, in accordance with other studies [8,64].
The CCI was affected by the variety and the interaction variety × fertilization. Ciclope showed, on average, among the different fertilization treatments, higher CCI values than Timilia (23.0 vs. 18.7). Moreover, if for Timilia no differences were recorded among the fertilization treatments, Ciclope N120 highlighted higher values (+18%; 25.6 vs. 21.7) than N0 and N60 (Figure 4).
The data retrieved confirm the differences between the tested cultivars also concerning the response to the CCI meter, with higher values in Ciclope than in Timilia. This difference, then, seems to determine the CCI values’ response to the different N fertilization regimens applied. As a result, the CCI appears to be unable to be used for Timilia, whereas for Ciclope it is only capable of discriminating high differences in N fertilization doses. Thus, the present results confirm, according to Ravier et al. [65], the different CCI behaviour of wheat varieties and the reliability of the CCI in describing higher N concentration differences.

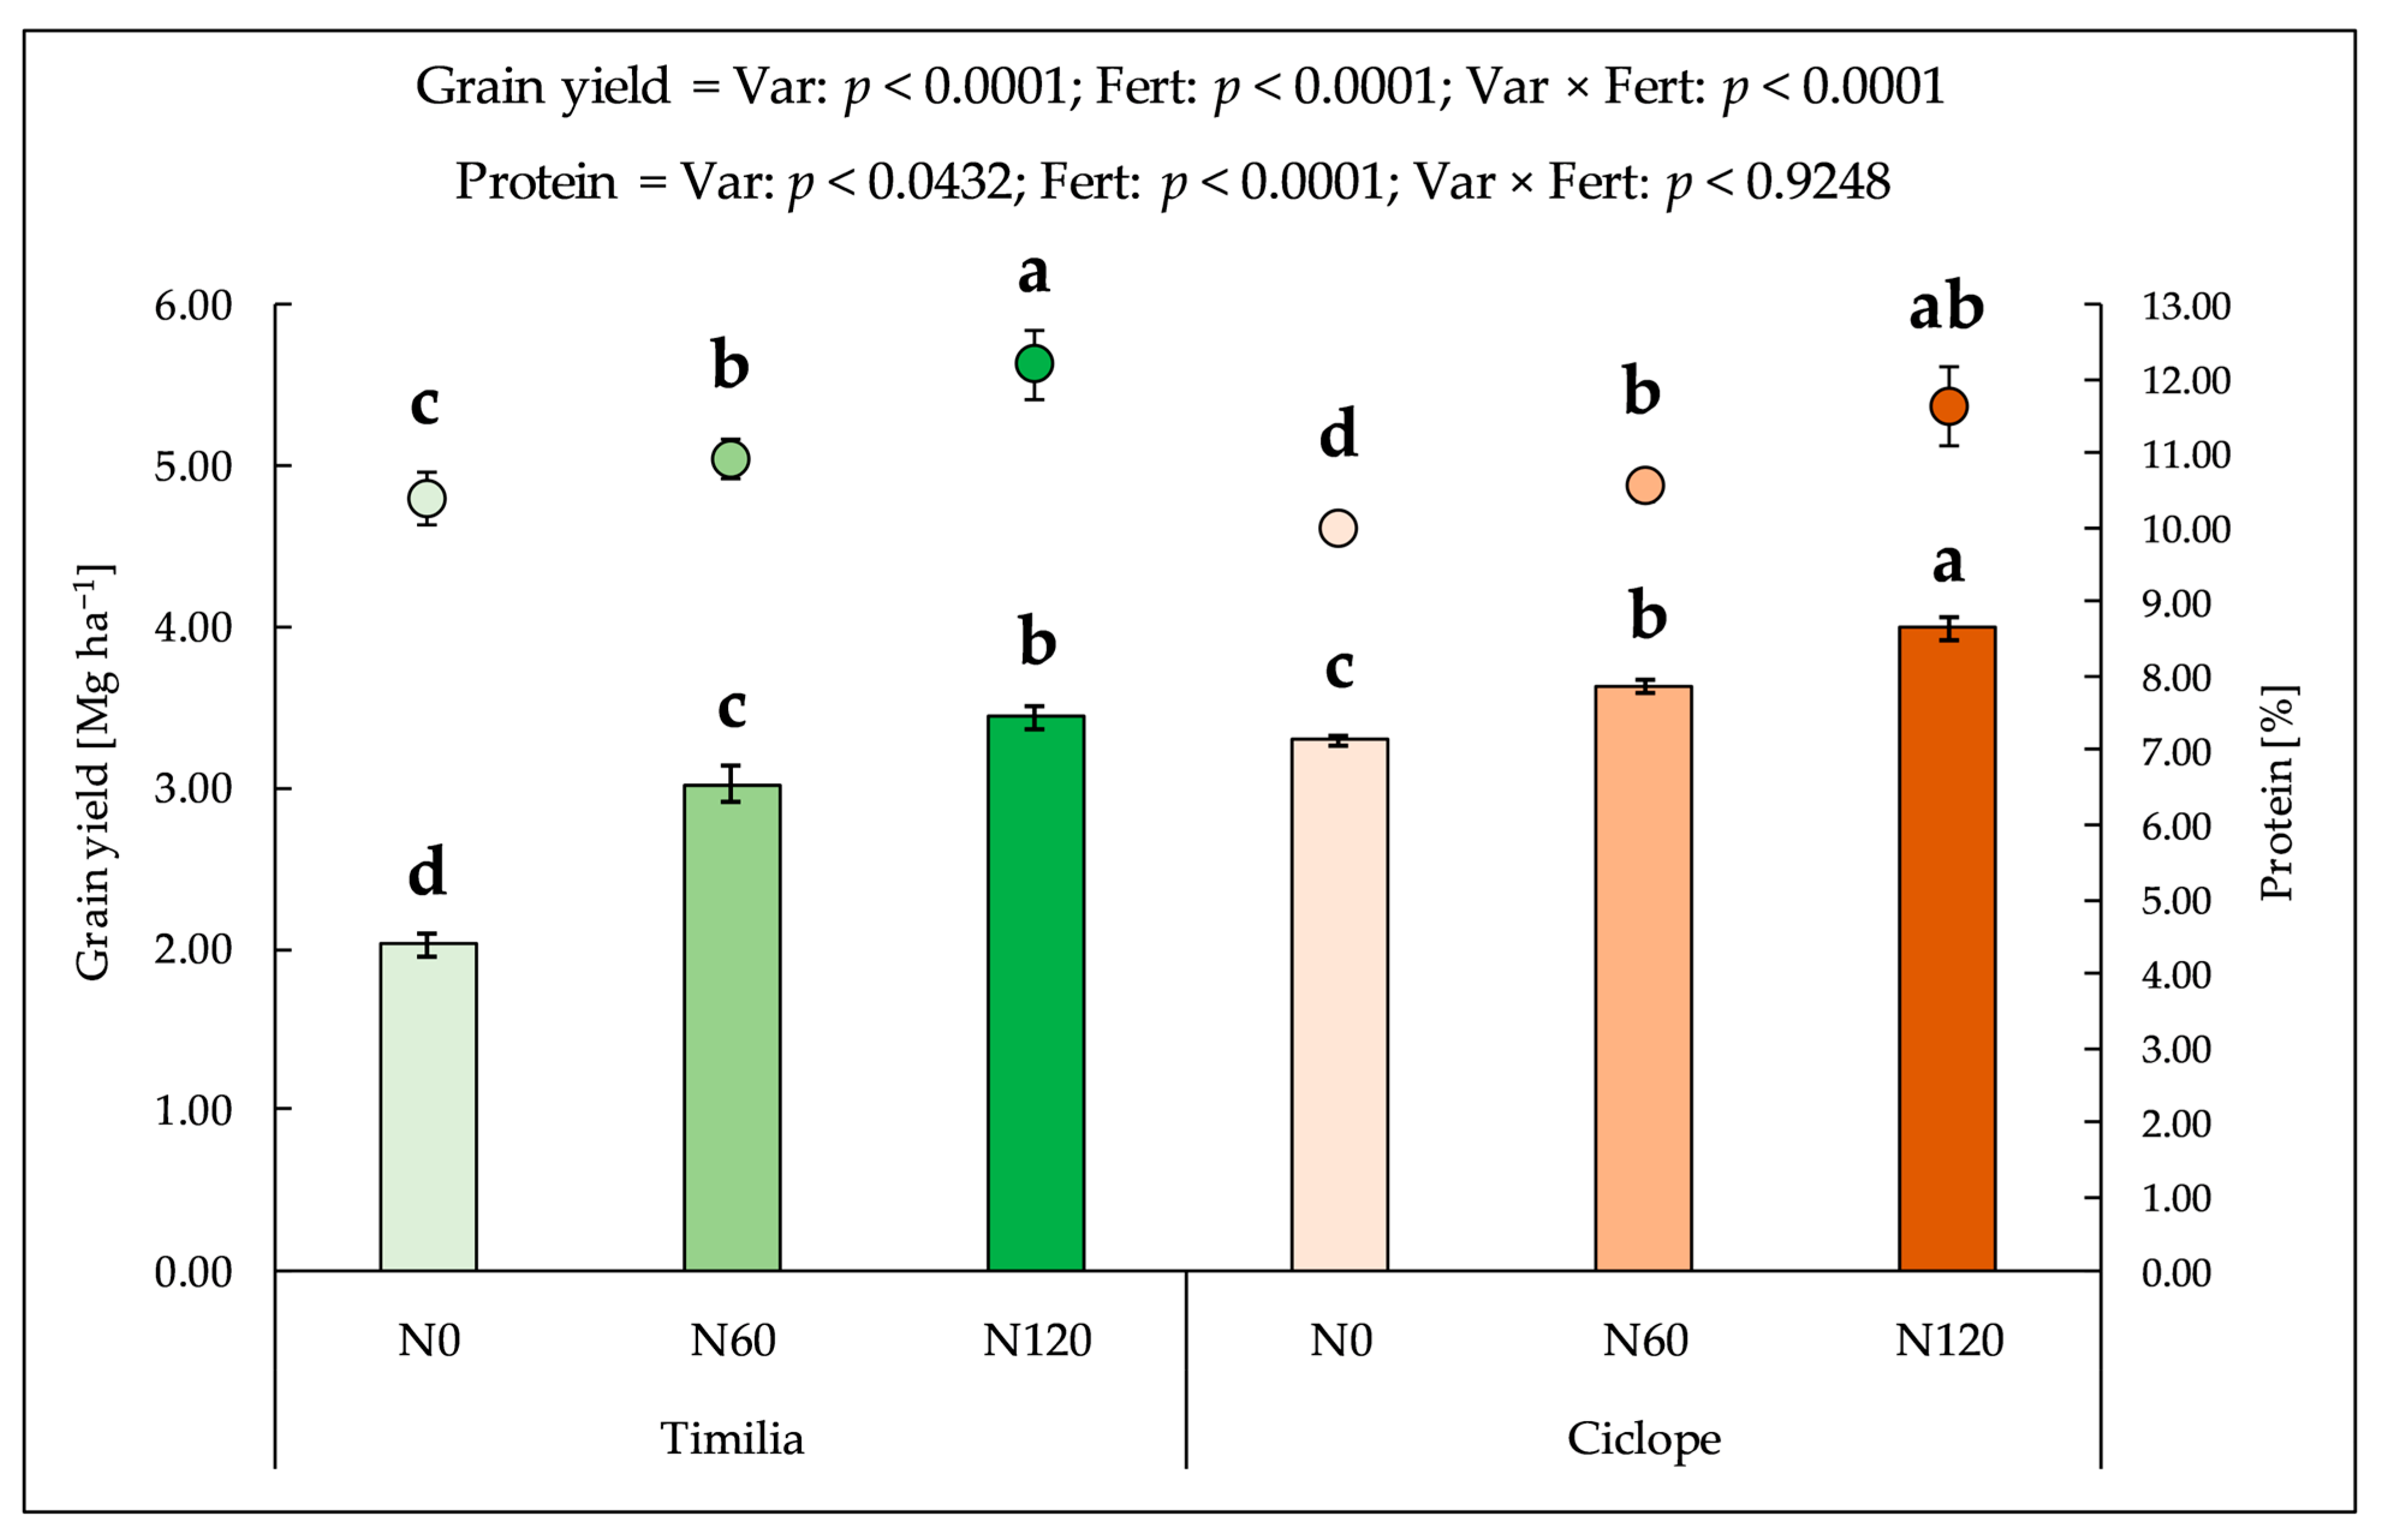
3.2. Grain Yield and Protein Concentration

The wheat grain yield was significantly influenced by the variety, fertilization and their interaction (p < 0.05). On average, a higher grain yield was observed in Ciclope (+22%) than in Timilia, and for both tested varieties, the grain yield copied the N fertilization doses. Indeed, from N0 to N120, the yield increased by +70% in Timilia, from 2.02 Mg ha−1 to 3.44 Mg ha−1, and +21% in Ciclope, from 3.30 Mg ha−1 to 3.99 Mg ha−1 (Figure 5).
The wheat protein concentration was affected by both the variety and fertilization (p < 0.05) but not by their interaction (p > 0.05). Timilia showed higher average protein concentrations (+5%; 11.2 vs. 10.7%) than Ciclope. In both tested varieties, the N fertilizer application caused a proportional increase in the grain protein, with more pronounced effects in Timilia (+1.82% of protein vs. +1.66% of protein) than in Ciclope, and higher differences between N120 and N60 (+1.18% of protein, on average) than between N60 and N0 (+0.57% of protein, on average) (Figure 5).
The grain yields were generally higher in the Ciclope than in the Timilia variety, and especially when no N fertilization was provided, according to several studies that have proven the highest productivity of modern varieties in the Mediterranean environment [7,66]. On the contrary, at the same dose of N fertilizer applied, higher protein concentrations were observed in Timilia vs. Ciclope, in accordance with other studies that found higher protein levels in ancient Italian durum wheat than in modern ones [67,68,69]. In addition, the old wheat variety Timilia showed a more significant increase in the grain yield and protein as the dose of N applied increased, indicating greater N use efficiency, as observed in other studies [68,70].

3.3. Pearson’s Correlation Analysis

The results of the Pearson’s correlation analysis between the VIs and the productive traits, grain yield and protein concentration, of both wheat varieties tested together and separately are presented in Table 2.
In general, the best correlations achieved ranged between moderate (r > 0.6), in the majority of cases, and strong (r > 0.7) relationship levels. Concerning the whole dataset (global), only CVI and MTVI2 reached a sufficient prediction level for grain yield, while for the protein content, the majority of VIs showed r-values higher than 0.6 level, with the only exception being MTVI, NDRE, RTVI, and SR. The specific variety correlations, in the case of grain yield prediction, showed weak correlations for Timilia, whereas moderate (GNDVI, MCARI2, MTVI2, and NDVI) and strong correlations (CVI, GNDRE, and SRre) were observed in seven out of the thirteen indices studied for Ciclope. In the case of protein estimation, for both tested varieties, several moderate correlations were observed, with a higher number of effective VIs for Timilia (10) than for Ciclope (7); the best predictive VIs were GNDRE, MCARI2, MTVI2, and SRRE.
According to various authors [36,71,72], MS VIs can be used for wheat monitoring during the growing season in order to predict the grain yield through the implementation of linear regressions using simple calculation software. Our results, however, showed the poor performance of the VI linear relationships for the grain yield prediction when the data of the two varieties were merged. Analyzing the results obtained from the two tested varieties separately, it becomes clear that the poor results obtained from the global dataset can be attributed to Timilia’s poor predictive VI ability, where no index reached sufficient values. This behaviour follows what has been observed with regard to the CCI, which was not able to discriminate different fertilization levels for this variety. It is likely that both the near and remote-sensed reflectance in this variety are weakly interpreted by these two instruments in relation to the grain yield. In contrast, the results observed for the other variety, Ciclope, were better, with about half of the indices showing r-values greater than 0.6. These findings highlighted how the sensitivity and ability of VIs to predict the behaviour of wheat plants varies significantly by variety. This evidence, already observed in other studies [36,73,74,75], indicates that the application of precision farming tools is only possible for certain varieties that are better suited than others. Thus, our findings partially confirm the reliability of the MS VIs in predicting wheat crop productivity in fields under different inputs [76].
With regard to the predictions for Ciclope, among the studied VIs, CVI, GNDRE, and SRre showed the highest performance, with values of r ≥ 0.7. The other VIs that also achieved good correlations were GNDVI, MCARI2, MTVI2, and NDVI, according to other studies [36,71,77,78,79]. In general, our finding confirms the importance of the red-edge, green and NIR data bands, compared to the red band, in achieving improved estimation of the grain yield and even more so for the protein content along the N fertilization gradient, according to Hatfield et al. [80], Li et al. [81], Fu et al. [82], Yang et al. [77], Gordillo-Salinas et al. [83], and Piikki et al. [84]. Red-edge radiation, thanks to its ability to penetrate the plant cover and interact with chlorophyll, can offer dependable insights into the plant’s status [85,86], which can be increased by its combination with NIR, especially in detecting the N uptake [87,88]. On the other hand, all the VIs that included the red band showed poor performance, especially NDVI, which is often mentioned in various studies as a good indicator of crop development and condition (e.g., [36,71,89,90]). In addition, some of the VIs’ lowest results could be attributed to reaching saturation along plant growth [88,91].
Compared with the grain yield estimation, the protein-related one showed better performances, showing significant results for the global dataset and also for the Timilia variety. The VI survey at the middle of plant growth directly reflects and is closely related to the protein content, a productivity aspect that is determined in the advanced stages of the crop cycle compared to the grain production before the N will be transferred from leaves and stems to grains [92]. Therefore, the spectral responses of the two tested varieties allowed a good interpretation of this productive aspect, a fundamental parameter for judging the quality of durum wheat products.
Lastly, the evidence retrieved confirmed the superiority of the VIs compared to the CCI in predicting durum wheat production and quality [21,93].

3.4. Machine Learning (ML)

The results of the validation process for the five different ML approaches tested, observed in 50% of the 100 repetitions performed, are presented in Table 3. A selective ability of the ML approaches was observed, and they performed better on specific variety predictions than on global ones. Indeed, the R2 of the global predictions has never been higher than 0.59 for the grain yield and 0.48 for the protein concentration. RF, SVM, and NN best predicted the grain yield and protein concentration for the Timilia variety. Better performances were retrieved for protein than for the grain yield prediction, and among the different ML approaches tested, RF was the best, showing a value of R2 equal to 0.67 for the grain yield (RMSE 0.50 t ha−1) and even higher (R2 = 0.72 and RMSE = 0.53%) for protein.
The validation results of the ML approaches applied to the Ciclope data were better than those of Timilia and all the models, except for LM, which was inaccurate, showing an R2 > 0.6. Also, in this case, the models applied to the protein data were shown to work better than on the grain yield. RF was the best model for both crop variables, showing performances equal to R2 = 0.76 (RMSE = 0.22 t ha−1) and R2 = 0.79 (RMSE = 0.56%), respectively, for the grain yield and protein estimation. Among the other models, good results were also observed by SVM (R2 = 0.70; RMSE = 0.25 t ha−1) for the grain yield and by NN (R2 = 0.72; RMSE = 0.57 t ha−1) for the protein concentration.
The application of the ML approaches failed to achieve good estimations for the global dataset obtained from the sum of the data of the two varieties tested under different N fertilization levels. Therefore, the tested approaches have been shown to lack the plasticity to adapt to contrasting varieties and management conditions. This circumstance, however, is purely experimental and difficult to encounter in ordinary wheat cultivation, where fields are sown with only one variety of plants.
In contrast, the different ML approaches, apart from LM, achieved good performances when estimating the yield and protein concentration separately for the two varieties. In particular, three of the five tested algorithms showed good estimates (R2 > 0.6) for the Timilia variety and, thus, better performances than Pearson’s correlations. In addition, for Ciclope, generally higher ML performances were also retrieved for both yield and protein. These findings confirm the reliability of ML techniques for predicting wheat grain yield and quality across a gradient of nutritional statuses by interpreting the non-linear relationships, according to several authors [82,91,94,95]. Given that the ML algorithms were validated using a different dataset (with distinct training and validation sets) in comparison to Pearson’s correlations, which were assessed on the entire dataset, this additionally emphasizes the predictive strength of the ML models. For the two tested varieties and the productive parameters, the RF approach showed the best statistics calculated (R2, RMSE, and MAE), as observed by other authors [22,87,96,97,98,99], and was followed by the performance of NN and SVM [100]. Therefore, our results confirm the studies carried out by Bebie et al. [101], which observed the best predictive performance by the RF model for the grain yield of durum wheat within the Mediterranean area. In accordance, Yue et al. [102] and Zhou et al. [91] observed good wheat biomass estimation performance from the RF and SVM models. These findings can be related to the present study by considering that wheat biomass is a variable closely related to the grain yield. The results observed in the present research demonstrate that RF, SVM, and NN permit the achievement of reliable predictions of the wheat yield and protein concentration in different varieties and with nutritional N gradients, overcoming the limitations observed in the linear relationships and issues due to noise, outliers, and complex interactions among input like collinearity and overfitting, which are typical of raw MS data obtained from drone survey images. In addition, the higher performance of RF may be related to its generalization ability, conjugated with fewer settings, while the lower ones of NN may be due to overtraining in the learning datasets that caused their ability to generalize and predict on the validation dataset to be reduced [99,103,104]. Therefore, the results obtained may encourage rapid and direct use of the detected MS index values for estimates to support farmers and decision-support systems (DSS). The slightly lower performance of the k-NN approach may be due to the more considerable sensitivity of this algorithm to unbalanced data with the presence of noise and/or outliers [105]. Then, the worst performance observed for LM is in accordance with several other studies [106,107].
The results collected also highlighted the good ability of ML approaches to predict the protein content of wheat, especially those of RF, in agreement with Zhou et al. [91], Ding et al. [108], Chen et al. [109], and Li et al. [110]. The more remarkable ability to predict the protein concentration compared to the grain yield, also in the case of ML, can be recognized for the same reasons described above for the correlations. As stated above, the detection of the VIs in the advanced stages of growth makes it possible to interpret the availability of accumulated N in the epigeal biomass that is capable of being transferred to the grain well. On the contrary, the ability to predict the grain yield seems more concretely attributable to the assessment of the total plant biomass [111].
It should be pointed out that the present experiment was carried out on a limited number (n = 4) of small plots (~10 m2) testing two wheat varieties and three doses of N and, therefore, in order to confirm and generalize the results obtained, future studies over a larger area, with greater variability in terms of soil N and crop response, should be carried out.

4. Conclusions

The optimization of crop nutritional management has a fundamental role in determining their sustainability by combining good crop nutrition with respect for the environment. This aspect emerges prominently in the case of N nutrition, which, on the one hand, is the main nutritional determinant of quantitative and qualitative production and, on the other hand, can be a strong polluting factor for the environment. Novel approaches in the framework of the agricultural digital transition can guide farmers in N application using VI data from UAVs.
The objective of the present study was to assess the performance of Pearson’s correlations and five different ML approaches based on the MS VIs surveyed by UAV to predict the yield and protein concentration in two contrasting durum wheat varieties: an ancient variety and a modern one, cultivated with increasing doses of N fertilization. The experimental results highlighted the difficulty of obtaining good results from Pearson’s correlation for both varieties together and for the ancient variety Timilia. In contrast, for Ciclope, CVI, GNDRE, and SRRE achieved good results when estimating the grain yield and protein concentration.
The implementation of ML approaches, particularly RF, NN, and SVM, permitted us to overcome the limitations of Pearson’s correlation when estimating the grain yield and protein in the Timilia variety. For Ciclope, the RF approach achieved better performance compared to the other ML approaches and Pearson’s correlations.
The present study highlights that the application of ML with VIs permits reliable prediction of wheat productivity, even for difficult and ancient varieties where simple linear correlations fail. Moreover, their implementation is also possible, with success, by directly using raw VI data from UAV surveys to obtain good quantitative and qualitative yield prediction under different N availability conditions.
It is worth pointing out that the UAV surveys were carried out using a drone considered to be an entry-level model, although widely used, and equipped with a low spatial and spectral resolution multispectral camera. Further studies should be carried out to test higher spatial and spectral resolution cameras and better-performing UAVs to evaluate how VI monitoring and ML can guide N fertilization throughout the production cycle, also with high soil N variability.
The results of the present work highlight that the application of RF, NN and SVM ML models directly fed with data obtained from UAV flights can be a valid method for farmers to predict wheat yield and quality in order to be able to devise strategies for N fertilization, saving money and averting environment damage, and electing in the field the final destination of the product.
Future research should focus on field experiments that incorporate additional soil and climate data to generate precise estimates, effectively addressing the variability within fields and across different cultivation environments.

Author Contributions

Conceptualization, G.B., G.M. (Gaetano Messina), G.P., M.M., G.M. (Giuseppe Modica) and S.P.; methodology, G.B., G.M. (Gaetano Messina), G.P., G.M. (Giuseppe Modica) and S.P.; investigation, G.B., E.L.P., G.M. (Gaetano Messina) and S.P.; resources, G.P., S.D.F., M.M. and G.M. (Giuseppe Modica); data curation, G.B., E.L.P., G.P., G.M. (Gaetano Messina) and S.P.; writing—original draft preparation, G.B., G.M. (Gaetano Messina) and S.P.; writing—review and editing, G.B., E.L.P., G.P., S.D.F., M.M., G.M. (Gaetano Messina) and S.P.; supervision, G.P., S.D.F., M.M. and G.M. (Giuseppe Modica); project administration, M.M. and G.M. (Giuseppe Modica); funding acquisition, M.M., G.M. (Giuseppe Modica), and S.P. All authors have read and agreed to the published version of the manuscript.

Funding

The research activity of Giuseppe Badagliacca and Salvatore Praticò was funded by the project “PON Research and Innovation 2014–2020—European Social Fund, Action I.2 Attraction and International Mobility of Researchers—AIM-1832342-1”. The research activity of Gaetano Messina was funded by the Next Generation EU-Tech4You-“Technologies for climate change adaptation and quality of life improvement—Tech4You”, Goal 3.1 “Agriculture and livestock smart farming”, CUP C33C22000290006.

Data Availability Statement

The raw data supporting the conclusions of this article will be made available by the authors on request.

Acknowledgments

We thank V. Barreca and F. Cogliandro for their support in the management of the field experiment and M. Romeo for their technical advice and collaboration during the samplings and laboratory analysis.

Conflicts of Interest

The authors declare no conflicts of interest.

References

  1. Blanco, A. Structure and trends of worldwide research on durum wheat by bibliographic mapping. Int. J. Plant Biol. 2024, 15, 132–160. [Google Scholar] [CrossRef]
  2. Carbone, A.; Henke, R. Recent trends in agri-food Made in Italy exports. Agric. Food Econ. 2023, 11, 32. [Google Scholar]
  3. Grosse-Heilmann, M.; Cristiano, E.; Deidda, R.; Viola, F. Durum wheat productivity today and tomorrow: A review of influencing factors and climate change effects. Resour. Environ. Sustain. 2024, 17, 100170. [Google Scholar]
  4. FAO. Land & Water: Wheat. Available online: https://www.fao.org/land-water/databases-and-software/crop-information/wheat/en/ (accessed on 12 January 2024).
  5. Ciliberti, S.; Stanco, M.; Frascarelli, A.; Marotta, G.; Martino, G.; Nazzaro, C. Sustainability strategies and contractual arrangements in the italian pasta supply chain: An analysis under the neo institutional economics lens. Sustainability 2022, 14, 8542. [Google Scholar] [CrossRef]
  6. Raun, W.R.; Johnson, G.V. Improving nitrogen use efficiency for cereal production. Agron. J. 1999, 91, 357–363. [Google Scholar]
  7. Lupini, A.; Preiti, G.; Badagliacca, G.; Abenavoli, M.R.; Sunseri, F.; Monti, M.; Bacchi, M. Nitrogen use efficiency in durum wheat under different nitrogen and water regimes in the mediterranean basin. Front. Plant Sci. 2021, 11, 607226. [Google Scholar]
  8. Kubar, M.S.; Alshallash, K.S.; Asghar, M.A.; Feng, M.; Raza, A.; Wang, C.; Saleem, K.; Ullah, A.; Yang, W.; Kubar, K.A.; et al. Improving winter wheat photosynthesis, nitrogen use efficiency, and yield by optimizing nitrogen fertilization. Life 2022, 12, 1478. [Google Scholar] [CrossRef]
  9. European Commission. Ensuring Availability and Affordability of Fertilisers. Available online: https://agriculture.ec.europa.eu/common-agricultural-policy/agri-food-supply-chain/ensuring-availability-and-affordability-fertilisers_en#documents (accessed on 21 February 2024).
  10. Mahmud, K.; Panday, D.; Mergoum, A.; Missaoui, A. Nitrogen losses and potential mitigation strategies for a sustainable agroecosystem. Sustainability 2021, 13, 2400. [Google Scholar] [CrossRef]
  11. Durán-Sandoval, D.; Uleri, F.; Durán-Romero, G.; López, A.M. Food, climate change, and the challenge of innovation. Encyclopedia 2023, 3, 839–852. [Google Scholar] [CrossRef]
  12. Toselli, M.; Baldi, E.; Ferro, F.; Rossi, S.; Cillis, D. Smart farming tool for monitoring nutrients in soil and plants for precise fertilization. Horticulturae 2023, 9, 1011. [Google Scholar] [CrossRef]
  13. Santaga, F.S.; Agnelli, A.; Leccese, A.; Vizzari, M. Using Sentinel-2 for simplifying soil sampling and mapping: Two case studies in Umbria, Italy. Remote Sens. 2021, 13, 3379. [Google Scholar] [CrossRef]
  14. Raeva, P.L.; Šedina, J.; Dlesk, A. Monitoring of crop fields using multispectral and thermal imagery from UAV. Eur. J. Remote Sens. 2019, 52, 192–201. [Google Scholar]
  15. Modica, G.; Messina, G.; De Luca, G.; Fiozzo, V.; Praticò, S. Monitoring the vegetation vigor in heterogeneous citrus and olive orchards. A multiscale object-based approach to extract trees’ crowns from UAV multispectral imagery. Comput. Electron. Agric. 2020, 175, 105500. [Google Scholar]
  16. Messina, G.; Praticò, S.; Badagliacca, G.; Di Fazio, S.; Monti, M.; Modica, G. Monitoring onion crop “Cipolla rossa di Tropea Calabria IGP” growth and yield response to varying nitrogen fertilizer application rates using UAV imagery. Drones 2021, 5, 61. [Google Scholar] [CrossRef]
  17. Marti, J.; Bort, J.; Slafer, G.A.; Araus, J.L. Can wheat yield be assessed by early measurements of Normalized Difference Vegetation Index? Ann. Appl. Biol. 2007, 150, 253–257. [Google Scholar]
  18. Sharma, P.; Leigh, L.; Chang, J.; Maimaitijiang, M.; Caffé, M. Above-ground biomass estimation in oats using UAV remote sensing and machine learning. Sensors 2022, 22, 601. [Google Scholar] [CrossRef]
  19. Tatsumi, K.; Igarashi, N.; Mengxue, X. Prediction of plant-level tomato biomass and yield using machine learning with unmanned aerial vehicle imagery. Plant Methods 2021, 17, 77. [Google Scholar]
  20. Messina, G.; Badagliacca, G.; Praticò, S.; Preiti, G.; Monti, M.; Modica, G. Multispectral UAV-based monitoring of behavior of different wheat and barley varieties. In Biosystems Engineering Towards the Green Deal. AIIA 2022. Lecture Notes in Civil Engineering; Ferro, V., Giordano, G., Orlando, S., Vallone, M., Cascone, G., Porto, S.M.C., Eds.; Springer: Amsterdam, The Netherlands, 2023; pp. 1173–1181. [Google Scholar]
  21. Kyratzis, A.C.; Skarlatos, D.P.; Menexes, G.C.; Vamvakousis, V.F.; Katsiotis, A. Assessment of vegetation indices derived by UAV imagery for durum wheat phenotyping under a water limited and heat stressed Mediterranean environment. Front. Plant Sci. 2017, 8, 1–14. [Google Scholar]
  22. Fiorentini, M.; Schillaci, C.; Denora, M.; Zenobi, S.; Deligios, P.; Orsini, R.; Santilocchi, R.; Perniola, M.; Montanarella, L.; Ledda, L. A machine learning modeling framework for Triticum turgidum subsp. durum Desf. yield forecasting in Italy. Agron. J. 2022, 116, 1050–1070. [Google Scholar]
  23. Modica, G.; De Luca, G.; Messina, G.; Praticò, S. Comparison and assessment of different object-based classifications using machine learning algorithms and UAVs multispectral imagery: A case study in a citrus orchard and an onion crop. Eur. J. Remote Sens. 2021, 54, 431–460. [Google Scholar]
  24. Li, J.; He, Z.; Zhou, G.; Yan, S.; Zhang, J. DeepAT: A deep learning wheat phenotype prediction model based on genotype data. Agronomy 2024, 14, 2756. [Google Scholar] [CrossRef]
  25. Peng, D.; Cheng, E.; Feng, X.; Hu, J.; Lou, Z.; Zhang, H.; Zhao, B.; Lv, Y.; Peng, H.; Zhang, B. A deep–learning network for wheat yield prediction combining weather forecasts and remote sensing data. Remote Sens. 2024, 16, 3613. [Google Scholar] [CrossRef]
  26. Iqbal, N.; Shahzad, M.U.; Sherif, E.-S.M.; Tariq, M.U.; Rashid, J.; Le, T.-V.; Ghani, A. Analysis of wheat-yield prediction using machine learning models under climate change scenarios. Sustainability 2024, 16, 6976. [Google Scholar] [CrossRef]
  27. Wang, C.; Song, X.; Pan, W.; Yu, H.; Li, X.; Liu, P. Determination of wheat growth stages using image sequences and deep learning. Agronomy 2024, 15, 13. [Google Scholar] [CrossRef]
  28. Cheng, E.; Zhang, B.; Peng, D.; Zhong, L.; Yu, L.; Liu, Y.; Xiao, C.; Li, C.; Li, X.; Chen, Y.; et al. Wheat yield estimation using remote sensing data based on machine learning approaches. Front. Plant Sci. 2022, 13, 1090970. [Google Scholar]
  29. Pantazi, X.E.; Moshou, D.; Alexandridis, T.; Whetton, R.L.; Mouazen, A.M. Wheat yield prediction using machine learning and advanced sensing techniques. Comput. Electron. Agric. 2016, 121, 57–65. [Google Scholar]
  30. Escalante, H.J.; Rodríguez-Sánchez, S.; Jiménez-Lizárraga, M.; Morales-Reyes, A.; De La Calleja, J.; Vazquez, R. Barley yield and fertilization analysis from UAV imagery: A deep learning approach. Int. J. Remote Sens. 2019, 40, 2493–2516. [Google Scholar]
  31. Petersen, C.T.; Langgaard, M.K.; Petersen, S.D. Yield prediction in spring barley from spectral reflectance and weather data using machine learning. Soil Use Manag. 2023, 39, 975–987. [Google Scholar]
  32. Zhang, P.; Lu, B.; Shang, J.; Wang, X.; Hou, Z.; Jin, S.; Yang, Y.; Zang, H.; Ge, J.; Zeng, Z. Ensemble learning for oat yield prediction using multi-growth stage UAV images. Remote Sens. 2024, 16, 4575. [Google Scholar] [CrossRef]
  33. Ashapure, A.; Oh, S.; Marconi, T.G.; Chang, A.; Jung, J.; Landivar, J.; Enciso, J. Unmanned aerial system based tomato yield estimation using machine learning. In Proceedings of the Autonomous Air and Ground Sensing Systems for Agricultural Optimization and Phenotyping IV; Thomasson, J.A., McKee, M., Moorhead, R.J., Eds.; SPIE: Baltimore, MD, USA, 2019; Volume 11008. [Google Scholar]
  34. El-Kenawy, E.-S.M.; Alhussan, A.A.; Khodadadi, N.; Mirjalili, S.; Eid, M.M. Predicting potato crop yield with machine learning and deep learning for sustainable agriculture. Potato Res. 2024. [Google Scholar] [CrossRef]
  35. Kuradusenge, M.; Hitimana, E.; Hanyurwimfura, D.; Rukundo, P.; Mtonga, K.; Mukasine, A.; Uwitonze, C.; Ngabonziza, J.; Uwamahoro, A. Crop yield prediction using machine learning models: Case of irish potato and maize. Agriculture 2023, 13, 225. [Google Scholar] [CrossRef]
  36. Marino, S.; Alvino, A. Agronomic traits analysis of ten winter wheat cultivars clustered by UAV-derived vegetation indices. Remote Sens. 2020, 12, 249. [Google Scholar] [CrossRef]
  37. Marino, S.; Alvino, A. Detection of homogeneous wheat areas using multi-temporal UAS images and ground truth data analyzed by cluster analysis. Eur. J. Remote Sens. 2018, 51, 266–275. [Google Scholar]
  38. Badagliacca, G.; Messina, G.; Praticò, S.; Lo Presti, E.; Preiti, G.; Monti, M.; Modica, G. Multispectral vegetation indices and machine learning approaches for durum wheat (Triticum durum Desf.) yield prediction across different varieties. AgriEngineering 2023, 5, 2032–2048. [Google Scholar] [CrossRef]
  39. Mancini, A.; Solfanelli, F.; Coviello, L.; Martini, F.M.; Mandolesi, S.; Zanoli, R. Time series from Sentinel-2 for organic durum wheat yield prediction using functional data analysis and deep learning. Agronomy 2024, 14, 109. [Google Scholar] [CrossRef]
  40. Vatter, T.; Gracia-Romero, A.; Kefauver, S.C.; Nieto-Taladriz, M.T.; Aparicio, N.; Araus, J.L. Preharvest phenotypic prediction of grain quality and yield of durum wheat using multispectral imaging. Plant J. 2022, 109, 1507–1518. [Google Scholar]
  41. Romano, E.; Bergonzoli, S.; Pecorella, I.; Bisaglia, C.; De Vita, P. Methodology for the definition of durum wheat yield homogeneous zones by using satellite spectral indices. Remote Sens. 2021, 13, 2036. [Google Scholar] [CrossRef]
  42. Smith, D.W. Soil Survey Staff Keys to soil taxonomy. Soil Conserv. Serv. 2014, 12, 410. [Google Scholar]
  43. International, A. Official Methods of Analysis, 15th ed.; AOAC International: Arlington, VA, USA, 2016. [Google Scholar]
  44. Fujihara, S.; Sasaki, H.; Aoyagi, Y.; Sugahara, T. Nitrogen-to-protein conversion factors for some cereal products in Japan. J. Food Sci. 2008, 73, 204–209. [Google Scholar]
  45. Vincini, M.; Frazzi, E. Comparing narrow and broad-band vegetation indices to estimate leaf chlorophyll content in planophile crop canopies. Precis. Agric. 2011, 12, 334–344. [Google Scholar]
  46. Cao, X.; Liu, Y.; Yu, R.; Han, D.; Su, B. A Comparison of UAV RGB and Multispectral Imaging in Phenotyping for Stay Green of Wheat Population. Remote Sens. 2021, 13, 5173. [Google Scholar] [CrossRef]
  47. Gitelson, A.A.; Kaufman, Y.J.; Merzlyak, M.N. Use of a green channel in remote sensing of global vegetation from EOS-MODIS. Remote Sens. Environ. 1996, 58, 289–298. [Google Scholar] [CrossRef]
  48. Haboudane, D.; Miller, J.R.; Pattey, E.; Zarco-Tejada, P.J.; Strachan, I.B. Hyperspectral vegetation indices and novel algorithms for predicting green LAI of crop canopies: Modeling and validation in the context of precision agriculture. Remote Sens. Environ. 2004, 90, 337–352. [Google Scholar]
  49. Barnes, E.M.; Clarke, T.R.; Richards, S.E.; Colaizzi, P.D.; Haberland, J.; Kostrzewski, M.; Waller, P.; Choi, R.E.C.; Thompson, T.; Lascano, R.J.; et al. Coincident detection of crop water stress, nitrogen status and canopy density using ground based multispectral data. In Proceedings of the 5th International Conference on Precision Agriculture, Bloomington, MN, USA, 16 July 2000; CABI: Bloomington, MN, USA, 2000; Volume 1619, pp. 1–15. [Google Scholar]
  50. Rouse, J.W.; Haas, R.H.; Schell, J.A.; Deering, D.W. Monitoring vegetation systems in the Great Plains with ERTS. NASA Spec. Publ 1974, 351, 309. [Google Scholar]
  51. Yue, J.; Yang, G.; Tian, Q.; Feng, H.; Xu, K.; Zhou, C. Estimate of winter-wheat above-ground biomass based on UAV ultrahigh-ground-resolution image textures and vegetation indices. ISPRS J. Photogramm. Remote Sens. 2019, 150, 226–244. [Google Scholar]
  52. Roujean, J.-L.; Breon, F.-M. Estimating PAR absorbed by vegetation from bidirectional reflectance measurements. Remote Sens. Environ. 1995, 51, 375–384. [Google Scholar]
  53. Chen, P.-F.; Nicolas, T.; Wang, J.-H.; Philippe, V.; Huang, W.-J.; Li, B.-G. New index for crop canopy fresh biomass estimation. Spectrosc. Spectr. Anal. 2010, 30, 512–517. [Google Scholar]
  54. Jordan, C.F. Derivation of Leaf-Area Index from Quality of Light on the Forest Floor. Ecology 1969, 50, 663–666. [Google Scholar] [CrossRef]
  55. Vogelmann, J.E.; Rock, B.N.; Moss, D.M. Red edge spectral measurements from sugar maple leaves. Int. J. Remote Sens. 1993, 14, 1563–1575. [Google Scholar]
  56. R CoreTeam. R: A Language and Environment for Statistical Computing; R Foundation for Statistical Computing: Vienna, Austria, 2021. [Google Scholar]
  57. Correlation Coefficient and Correlation Test in R. Available online: https://statsandr.com/blog/correlation-coefficient-and-correlation-test-in-r/ (accessed on 15 February 2024).
  58. Kuhn, M.; Wing, J.; Weston, S.; Williams, A. The caret package. J. Stat. Softw. 2008, 28, 1–26. [Google Scholar]
  59. Araújo, S.O.; Peres, R.S.; Ramalho, J.C.; Lidon, F.; Barata, J. machine learning applications in agriculture: Current trends, challenges, and future perspectives. Agronomy 2023, 13, 2976. [Google Scholar] [CrossRef]
  60. Meshram, V.; Patil, K.; Meshram, V.; Hanchate, D.; Ramkteke, S.D. Machine learning in agriculture domain: A state-of-art survey. Artif. Intell. Life Sci. 2021, 1, 100010. [Google Scholar] [CrossRef]
  61. Tao, H.; Feng, H.; Xu, L.; Miao, M.; Yang, G.; Yang, X.; Fan, L. Estimation of the yield and plant height of winter wheat using UAV-based hyperspectral images. Sensors 2020, 20, 1231. [Google Scholar] [CrossRef] [PubMed]
  62. Abenavoli, L.; Milanovic, M.; Procopio, A.C.; Spampinato, G.; Maruca, G.; Perrino, E.V.; Mannino, G.C.; Fagoonee, S.; Luzza, F.; Musarella, C.M. Ancient wheats: Beneficial effects on insulin resistance. Minerva Med. 2021, 112, 641–650. [Google Scholar] [CrossRef]
  63. Zhang, M.; Wang, H.; Yi, Y.; Ding, J.; Zhu, M.; Li, C.; Guo, W.; Feng, C.; Zhu, X. Effect of nitrogen levels and nitrogen ratios on lodging resistance and yield potential of winter wheat (Triticum aestivum L.). PLoS ONE 2017, 12, e0187543. [Google Scholar] [CrossRef]
  64. Li, W.; Han, M.; Pang, D.; Chen, J.; Wang, Y.; Dong, H.; Chang, Y.; Jin, M.; Luo, Y.; Li, Y.; et al. Characteristics of lodging resistance of high-yield winter wheat as affected by nitrogen rate and irrigation managements. J. Integr. Agric. 2022, 21, 1290–1309. [Google Scholar] [CrossRef]
  65. Ravier, C.; Quemada, M.; Jeuffroy, M.-H. Use of a chlorophyll meter to assess nitrogen nutrition index during the growth cycle in winter wheat. Field Crops Res. 2017, 214, 73–82. [Google Scholar] [CrossRef]
  66. Careddu, M.L.; Giunta, F.; Motzo, R. Lessons from the varietal evolution of durum wheat in italy. Agronomy 2023, 14, 87. [Google Scholar] [CrossRef]
  67. De Santis, M.A.; Giuliani, M.M.; Giuzio, L.; De Vita, P.; Flagella, Z. Assessment of grain protein composition in old and modern Italian durum wheat genotypes. Ital. J. Agron. 2018, 13, 40–43. [Google Scholar] [CrossRef]
  68. Giambalvo, D.; Ruisi, P.; Di Miceli, G.; Frenda, A.S.; Amato, G. Nitrogen use efficiency and nitrogen fertilizer recovery of durum wheat genotypes as affected by interspecific competition. Agron. J. 2010, 102, 707. [Google Scholar] [CrossRef]
  69. Fu, Z.; Zhang, J.; Jiang, J.; Zhang, Z.; Cao, Q.; Tian, Y.; Zhu, Y.; Cao, W.; Liu, X. Using the time series nitrogen diagnosis curve for precise nitrogen management in wheat and rice. Field Crops Res. 2024, 307, 109259. [Google Scholar]
  70. Ingraffia, R.; Lo Porto, A.; Ruisi, P.; Amato, G.; Giambalvo, D.; Frenda, A.S. Conventional tillage versus no-tillage: Nitrogen use efficiency component analysis of contrasting durum wheat genotypes grown in a Mediterranean environment. Field Crops Res. 2023, 296, 108904. [Google Scholar]
  71. Hassan, M.A.; Yang, M.; Rasheed, A.; Yang, G.; Reynolds, M.; Xia, X.; Xiao, Y.; He, Z. A rapid monitoring of NDVI across the wheat growth cycle for grain yield prediction using a multi-spectral UAV platform. Plant Sci. 2019, 282, 95–103. [Google Scholar] [PubMed]
  72. Duan, T.; Chapman, S.C.; Guo, Y.; Zheng, B. Dynamic monitoring of NDVI in wheat agronomy and breeding trials using an unmanned aerial vehicle. Field Crops Res. 2017, 210, 71–80. [Google Scholar] [CrossRef]
  73. Babar, M.A.; Reynolds, M.P.; van Ginkel, M.; Klatt, A.R.; Raun, W.R.; Stone, M.L. Spectral reflectance indices as a potential indirect selection criteria for wheat yield under irrigation. Crop Sci. 2006, 46, 578–588. [Google Scholar]
  74. Gutierrez, M.; Reynolds, M.P.; Raun, W.R.; Stone, M.L.; Klatt, A.R. Spectral water indices for assessing yield in elite bread wheat genotypes under well-irrigated, water-stressed, and high-temperature conditions. Crop Sci. 2010, 50, 197–214. [Google Scholar]
  75. Xue, J.; Su, B. Significant remote sensing vegetation indices: A review of developments and applications. J. Sens. 2017, 2017, 1353691. [Google Scholar]
  76. Latif, M.A.; Cheema, M.J.; Saleem, M.F.; Maqsood, M. mapping wheat response to variations in N, P, Zn, and irrigation using an unmanned aerial vehicle. Int. J. Remote Sens. 2018, 39, 7172–7188. [Google Scholar]
  77. Yang, M.; Hassan, M.A.; Xu, K.; Zheng, C.; Rasheed, A.; Zhang, Y.; Jin, X.; Xia, X.; Xiao, Y.; He, Z. Assessment of water and nitrogen use efficiencies through UAV-based multispectral phenotyping in winter wheat. Front. Plant Sci. 2020, 11, 927. [Google Scholar]
  78. Potgieter, A.B.; George-Jaeggli, B.; Chapman, S.C.; Laws, K.; Suárez Cadavid, L.A.; Wixted, J.; Watson, J.; Eldridge, M.; Jordan, D.R.; Hammer, G.L. Multi-spectral imaging from an unmanned aerial vehicle enables the assessment of seasonal leaf area dynamics of sorghum breeding lines. Front. Plant Sci. 2017, 8, 1532. [Google Scholar]
  79. Volpato, L.; Pinto, F.; González-Pérez, L.; Thompson, I.G.; Borém, A.; Reynolds, M.; Gérard, B.; Molero, G.; Rodrigues, F.A. High throughput field phenotyping for plant height using UAV-based rgb imagery in wheat breeding lines: Feasibility and validation. Front. Plant Sci. 2021, 12, 591587. [Google Scholar] [CrossRef] [PubMed]
  80. Hatfield, J.L.; Gitelson, A.A.; Schepers, J.S.; Walthall, C.L. Application of Spectral Remote Sensing for Agronomic Decisions. Agron. J. 2008, 100, 117. [Google Scholar] [CrossRef]
  81. Li, J.; Shi, Y.; Veeranampalayam-Sivakumar, A.-N.; Schachtman, D.P. Elucidating sorghum biomass, nitrogen and chlorophyll contents with spectral and morphological traits derived from unmanned aircraft system. Front. Plant Sci. 2018, 9, 1406. [Google Scholar] [CrossRef]
  82. Fu, Z.; Jiang, J.; Gao, Y.; Krienke, B.; Wang, M.; Zhong, K.; Cao, Q.; Tian, Y.; Zhu, Y.; Cao, W.; et al. Wheat growth monitoring and yield estimation based on multi-rotor unmanned aerial vehicle. Remote Sens. 2020, 12, 508. [Google Scholar] [CrossRef]
  83. Gordillo-Salinas, V.M.; Flores-Magdaleno, H.; Ortiz-Solorio, C.A.; Arteaga-Ramírez, R. Evaluation of nitrogen status in a wheat crop using unmanned aerial vehicle images. Chil. J. Agric. Res. 2021, 81, 408–419. [Google Scholar] [CrossRef]
  84. Piikki, K.; Söderström, M.; Stadig, H.; Wolters, S. Remote sensing and on-farm experiments for determining in-season nitrogen rates in winter wheat—Options for implementation, model accuracy and remaining challenges. Field Crops Res. 2022, 289, 108742. [Google Scholar] [CrossRef]
  85. Jiang, J.; Atkinson, P.M.; Zhang, J.; Lu, R.; Zhou, Y.; Cao, Q.; Tian, Y.; Zhu, Y.; Cao, W.; Liu, X. Combining fixed-wing UAV multispectral imagery and machine learning to diagnose winter wheat nitrogen status at the farm scale. Eur. J. Agron. 2022, 138, 126537. [Google Scholar] [CrossRef]
  86. Chen, Z.; Miao, Y.; Lu, J.; Zhou, L.; Li, Y.; Zhang, H.; Lou, W.; Zhang, Z.; Kusnierek, K.; Liu, C. In-season diagnosis of winter wheat nitrogen status in smallholder farmer fields across a village using unmanned aerial vehicle-based remote sensing. Agronomy 2019, 9, 619. [Google Scholar] [CrossRef]
  87. Zheng, H.; Li, W.; Jiang, J.; Liu, Y.; Cheng, T.; Tian, Y.; Zhu, Y.; Cao, W.; Zhang, Y.; Yao, X. A comparative assessment of different modeling algorithms for estimating leaf nitrogen content in winter wheat using multispectral images from an unmanned aerial vehicle. Remote Sens. 2018, 10, 2026. [Google Scholar] [CrossRef]
  88. Argento, F.; Anken, T.; Abt, F.; Vogelsanger, E.; Walter, A.; Liebisch, F. Site-specific nitrogen management in winter wheat supported by low-altitude remote sensing and soil data. Precis. Agric. 2021, 22, 364–386. [Google Scholar] [CrossRef]
  89. Benincasa, P.; Antognelli, S.; Brunetti, L.; Fabbri, C.A.; Natale, A.; Sartoretti, V.; Modeo, G.; Guiducci, M.; Tei, F.; Vizzari, M. Reliability of ndvi derived by high resolution satellite and uav compared to in-field methods for the evaluation of early crop n status and grain yield in wheat. Exp. Agric. 2018, 54, 604–622. [Google Scholar] [CrossRef]
  90. Kefauver, S.C.; Vicente, R.; Vergara-Díaz, O.; Fernandez-Gallego, J.A.; Kerfal, S.; Lopez, A.; Melichar, J.P.E.; Serret Molins, M.D.; Araus, J.L. Comparative UAV and field phenotyping to assess yield and nitrogen use efficiency in hybrid and conventional barley. Front. Plant Sci. 2017, 8, 1733. [Google Scholar]
  91. Zhou, X.; Kono, Y.; Win, A.; Matsui, T.; Tanaka, T.S.T.T. Predicting within-field variability in grain yield and protein content of winter wheat using UAV-based multispectral imagery and machine learning approaches. Plant Prod. Sci. 2021, 24, 137–151. [Google Scholar]
  92. Yue, J.; Yang, G.; Li, C.; Li, Z.; Wang, Y.; Feng, H.; Xu, B. Estimation of winter wheat above-ground biomass using unmanned aerial vehicle-based snapshot hyperspectral sensor and crop height improved models. Remote Sens. 2017, 9, 708. [Google Scholar] [CrossRef]
  93. Yousfi, S.; Kellas, N.; Saidi, L.; Benlakehal, Z.; Chaou, L.; Siad, D.; Herda, F.; Karrou, M.; Vergara, O.; Gracia, A.; et al. Comparative performance of remote sensing methods in assessing wheat performance under Mediterranean conditions. Agric. Water Manag. 2016, 164, 137–147. [Google Scholar]
  94. Filippi, P.; Whelan, B.M.; Vervoort, R.W.; Bishop, T.F.A. Mid-season empirical cotton yield forecasts at fine resolutions using large yield mapping datasets and diverse spatial covariates. Agric. Syst. 2020, 184, 102894. [Google Scholar]
  95. Shendryk, Y.; Davy, R.; Thorburn, P. Integrating satellite imagery and environmental data to predict field-level cane and sugar yields in Australia using machine learning. Field Crops Res. 2021, 260, 107984. [Google Scholar]
  96. Richetti, J.; Judge, J.; Boote, K.J.; Johann, J.A.; Uribe-Opazo, M.A.; Becker, W.R.; Paludo, A.; Silva, L.C. de A. Using phenology-based enhanced vegetation index and machine learning for soybean yield estimation in Paraná State, Brazil. J. Appl. Remote Sens. 2018, 12, 026029. [Google Scholar] [CrossRef]
  97. Leo, S.; De Antoni Migliorati, M.; Grace, P.R. Predicting within-field cotton yields using publicly available datasets and machine learning. Agron. J. 2021, 113, 1150–1163. [Google Scholar] [CrossRef]
  98. Gómez, D.; Salvador, P.; Sanz, J.; Casanova, J.L. Modelling wheat yield with antecedent information, satellite and climate data using machine learning methods in Mexico. Agric. For. Meteorol. 2021, 300, 108317. [Google Scholar] [CrossRef]
  99. Wang, L.; Zhou, X.; Zhu, X.; Dong, Z.; Guo, W. Estimation of biomass in wheat using random forest regression algorithm and remote sensing data. Crop J. 2016, 4, 212–219. [Google Scholar]
  100. Yuan, H.; Yang, G.; Li, C.; Wang, Y.; Liu, J.; Yu, H.; Feng, H.; Xu, B.; Zhao, X.; Yang, X. Retrieving soybean leaf area index from unmanned aerial vehicle hyperspectral remote sensing: Analysis of RF, ANN, and SVM regression models. Remote Sens. 2017, 9, 309. [Google Scholar] [CrossRef]
  101. Bebie, M.; Cavalaris, C.; Kyparissis, A. Assessing durum wheat yield through Sentinel-2 Imagery: A machine learning approach. Remote Sens. 2022, 14, 3880. [Google Scholar] [CrossRef]
  102. Yue, J.; Feng, H.; Yang, G.; Li, Z. A Comparison of regression techniques for estimation of above-ground winter wheat biomass using near-surface spectroscopy. Remote Sens. 2018, 10, 66. [Google Scholar] [CrossRef]
  103. Cutler, D.R.; Edwards, T.C.; Beard, K.H.; Cutler, A.; Hess, K.T.; Gibson, J.; Lawler, J.J. Random forests for classification in ecology. Ecology 2007, 88, 2783–2792. [Google Scholar]
  104. Verrelst, J.; Muñoz, J.; Alonso, L.; Delegido, J.; Rivera, J.P.; Camps-Valls, G.; Moreno, J. Machine learning regression algorithms for biophysical parameter retrieval: Opportunities for Sentinel-2 and -3. Remote Sens. Environ. 2012, 118, 127–139. [Google Scholar]
  105. Liu, H.; Zhang, S. Noisy data elimination using mutual k-nearest neighbor for classification mining. J. Syst. Softw. 2012, 85, 1067–1074. [Google Scholar]
  106. Filippi, P.; Jones, E.J.; Wimalathunge, N.S.; Somarathna, P.D.S.N.; Pozza, L.E.; Ugbaje, S.U.; Jephcott, T.G.; Paterson, S.E.; Whelan, B.M.; Bishop, T.F.A. An approach to forecast grain crop yield using multi-layered, multi-farm data sets and machine learning. Precis. Agric. 2019, 20, 1015–1029. [Google Scholar]
  107. Fu, Z.; Yu, S.; Zhang, J.; Xi, H.; Gao, Y.; Lu, R.; Zheng, H.; Zhu, Y.; Cao, W.; Liu, X. Combining UAV multispectral imagery and ecological factors to estimate leaf nitrogen and grain protein content of wheat. Eur. J. Agron. 2022, 132, 126405. [Google Scholar]
  108. Ding, F.; Li, C.; Zhai, W.; Fei, S.; Cheng, Q.; Chen, Z. Estimation of nitrogen content in winter wheat based on multi-source data fusion and machine learning. Agriculture 2022, 12, 1752. [Google Scholar] [CrossRef]
  109. Chen, X.; Li, F.; Shi, B.; Chang, Q. Estimation of winter wheat plant nitrogen concentration from uav hyperspectral remote sensing combined with machine learning methods. Remote Sens. 2023, 15, 2831. [Google Scholar] [CrossRef]
  110. Li, Z.; Zhou, X.; Cheng, Q.; Fei, S.; Chen, Z. A machine-learning model based on the fusion of spectral and textural features from uav multi-sensors to analyse the total nitrogen content in winter wheat. Remote Sens. 2023, 15, 2152. [Google Scholar] [CrossRef]
  111. Kanning, M.; Kühling, I.; Trautz, D.; Jarmer, T. High-resolution UAV-based hyperspectral imagery for LAI and chlorophyll estimations from wheat for yield prediction. Remote Sens. 2018, 10, 2000. [Google Scholar] [CrossRef]
Figure 1. On the top is the location of the experimental site; in the centre left is the wheat field with the experimental design (strip plot with four replications) and the arrangement of the two wheat varieties, Ciclope (C) and Timilia (T). The different colours in the field indicate the three nitrogen (N) fertilization regimens: an unfertilized control with 0 kg ha−1 (grey), fertilization with 60 kg ha−1 (green) and fertilization with 120 kg ha−1 (red). On the right and below are some images related to the surveying and development of the wheat plants during the experimental period.
Agriengineering 07 00099 g001
Figure 2. The UAV survey and image processing workflow. Above, the first frame shows the UAV survey and data pre-processing process. In the middle, the second frame indicates the image processing and the calculation of the vegetation indices (VIs). Below, the third frame gathers information related to wheat data statistics and machine learning (ML) analysis.
Agriengineering 07 00099 g002
Figure 3. Effects of variety (Var) and fertilization (Fert) on wheat plant height. The values are the mean (n = 4) ± SE. Above are reported the results of the two-way ANOVA (Var × Fert). Distinct letters signify significant differences among soil treatments assessed by Tukey’s HSD test at p < 0.05.
Agriengineering 07 00099 g003
Figure 4. Effects of variety (Var) and fertilization (Fert) on wheat chlorophyll concentration index (CCI). The values are the mean (n = 4) ± SE. Above are reported the results of the two-way ANOVA (Var × Fert). Distinct letters signify significant differences among soil treatments assessed by Tukey’s HSD test at p < 0.05.
Agriengineering 07 00099 g004
Figure 5. Effects of variety (Var) and fertilization (Fert) on wheat grain yield (histograms) and protein concentration (circles). The values are the mean (n = 4) ± SE. For each trait, above are reported the results of the two-way ANOVA (Var × Fert), while distinct letters indicate significant differences among soil treatments assessed by Tukey’s HSD test at p < 0.05.
Agriengineering 07 00099 g005
Table 1. The table shows the vegetation indices (VIs) tested in this study.
Vegetation Index AcronymFormulaRef.
Chlorophyll Vegetation IndexCVI ρ N I R ρ G r e e n   ρ R e d ρ G r e e n [45]
Green Normalized Difference Red EdgeGNDRE ρ R e d   E d g e ρ G r e e n ρ R e d   E d g e + ρ G r e e n [46]
Green Normalized Difference Vegetation GNDVI ρ N I R ρ G r e e n ρ N I R + ρ G r e e n [47]
Modified Chlorophyll Absorption Ratio IndexMCARI2 1.5 [ 2.5   ρ N I R ρ R e d 1.3   ρ N I R ρ G r e e n ] 2 ρ N I R + 1 2 6 ρ N I R 5 ρ R e d 0.5 [48]
Modified Triangular Vegetation IndexMTVI 1.2   *   [ 1.2   ( ρ NIR ρ Green ) 2.5   ( ρ Red ρ Green ) ]
Modified Triangular Vegetation Index 2MTVI2 1.5 [ 1.2   ρ N I R ρ G r e e n 2.5   ρ R e d ρ G r e e n ] 2 ρ N I R + 1 2 6 ρ N I R 5 ρ R e d 0.5
Normalized Difference Red Edge NDRE ρ N I R ρ R e d   E d g e ρ N I R + ρ R e d   E d g e [49]
Normalized Difference Vegetation IndexNDVI ρ N I R ρ R e d ρ N I R + ρ R e d [50]
Optimized Soil Adjusted Vegetation IndexOSAVI 1.16   ( ρ N I R ρ R e d ) ρ N I R + ρ R e d + 0.16 [51]
Renormalized Difference Vegetation IndexRDVI ρ N I R ρ R e d ρ N I R + ρ R e d [52]
Red Edge Triangulated Vegetation IndexRTVI 100   ( ρ NIR ρ Red   Edge ) 10   ( ρ NIR ρ Green ) ] [53]
Simple RatioSR ρ N I R ρ R e d [54]
Simple Ratio Red EdgeSRRE ρ N I R ρ R e d   E d g e [55]
Table 2. The table shows the Pearson’s correlation coefficients calculated between the wheat productive traits, grain yield, and protein concentration for both tested varieties (Timilia and Ciclope) together and separately. In bold are highlighted the r-values higher than 0.6. Statistical significance is indicated in superscript (* p < 0.05, ** p < 0.01, *** p < 0.001, n.s.= not significant).
GlobalTimiliaCiclope
VIsGrain YieldProteinGrain YieldProteinGrain YieldProtein
CVI0.60 **0.64 **0.54 *0.63 **0.71 ***0.65 **
GNDRE0.54 *0.66 **0.45 n.s.0.65 **0.70 ***0.67 ***
GNDVI0.49 n.s.0.63 **0.44 n.s.0.62 **0.67 ***0.65 **
MCARI20.59 **0.66 **0.48 n.s.0.68 **0.66 **0.65 **
MTVI20.61 **0.67 **0.48 n.s.0.68 **0.67 ***0.66 **
MTVI0.41 n.s.0.57 **0.40 n.s.0.66 **0.44 n.s.0.48 n.s.
NDRE0.13 n.s.0.37 n.s.0.29 n.s.0.38 n.s.0.46 n.s.0.45 n.s.
NDVI0.47 n.s.0.64 **0.40 n.s.0.63 **0.66 **0.65 **
OSAVI0.46 n.s.0.62 **0.43 n.s.0.66 **0.55 *0.57 *
RDVI0.46 n.s.0.62 **0.43 n.s.0.65 **0.57 **0.58 **
RTVI0.24 n.s.0.21 n.s.0.30 n.s.0.39 n.s.0.36 n.s.0.05 n.s.
SR0.31 n.s.0.54 *0.28 n.s.0.53 *0.54 *0.56 *
SRRE0.57 **0.67 ***0.48 n.s.0.66 **0.71 ***0.68 ***
Table 3. Machine learning (ML) performance related to the overall data and separately for the two studied varieties: coefficient of determination (R2), root mean square error (RMSE) and mean absolute error (MAE). In bold are highlighted the R2 values higher than 0.6.
Models
LMRFSVMk-NNNN
GlobalGrain yieldR20.590.590.560.530.51
RMSE1.190.540.460.460.55
MAE1.030.430.340.340.53
Protein R20.460.420.480.450.44
RMSE2.000.860.770.690.49
MAE1.660.700.640.560.49
TimiliaGrain yieldR20.550.670.620.520.64
RMSE0.870.500.590.510.58
MAE0.770.420.390.410.48
Protein R20.550.720.680.560.69
RMSE1.420.530.650.512.48
MAE1.250.380.550.470.48
CiclopeGrain yieldR20.520.760.700.660.67
RMSE0.810.220.260.320.64
MAE0.660.200.250.270.54
Protein R20.490.790.700.700.72
RMSE1.800.560.720.720.57
MAE1.320.440.650.660.47
Disclaimer/Publisher’s Note: The statements, opinions and data contained in all publications are solely those of the individual author(s) and contributor(s) and not of MDPI and/or the editor(s). MDPI and/or the editor(s) disclaim responsibility for any injury to people or property resulting from any ideas, methods, instructions or products referred to in the content.

