Abstract
The present study seeks to improve the accuracy and reliability of disease identification in apple fruits and leaves through the use of state-of-the-art deep learning techniques. The research investigates several state-of-the-art architectures, such as Xception, InceptionV3, InceptionResNetV2, EfficientNetV2M, MobileNetV3Large, ResNet152V2, DenseNet201, and NASNetLarge. Among the models evaluated, ResNet152V2 performed best in the classification of apple fruit diseases, with a rate of 92%, whereas Xception proved most effective in the classification of apple leaf diseases, with 99% accuracy. The models were able to correctly recognize familiar apple diseases like blotch, scab, rot, and other leaf infections, showing their applicability in agriculture diagnosis. An important by-product of this research is the creation of a web application, easily accessible using Gradio, to conduct real-time disease detection through the upload of apple fruit and leaf images by users. The app gives predicted disease labels along with confidence values and elaborate information on symptoms and management. The system also includes a visualization tool for the inner workings of the neural network, thereby enabling higher transparency and trust in the diagnostic process. Future research will aim to widen the scope of the system to other crop species, with larger disease databases, and to improve explainability further to facilitate real-world agricultural application.
1. Introduction
Apples are one of the most widely used fruits, with over 75 million tons of apples consumed annually worldwide, fueled primarily by an increased emphasis on healthy eating. Apple production, however, is fraught with challenges in the form of leaf and fruit diseases, which have a deleterious effect on yield and also the quality of the apples [1].
The correct and adequate identification of such diseases is at the core of the application of effective management strategies, which are not only significant for immediate responses but also significant to ensure the health of the overall orchard for an extended period [2]. Conventional methods of plant disease diagnosis depend heavily on visual inspection by highly skilled pathologists. The method, however, has its own limitations; it is time-consuming as well as subjective in nature, and hence highly difficult to employ effectively across large orchards. Additionally, the factor of human fallibility, especially at the key early stages of disease identification, greatly contributes to the complexities surrounding effective management and containment of such diseases [3].
The application of AI in agriculture has transformed traditional farming methods, bringing new solutions to plant health monitoring, diagnosis, and management [4]. Manual visual inspections are time-consuming and tend to be susceptible to variation and inconsistencies, particularly when they are to be carried out in large geographical areas on a mass scale. Classical computer vision methods do possess valuable non-destructive analysis potential, however, with the utilization of various features such as texture, color, and shape for the assessment of conditions. These methods frequently encounter setbacks in their application due to the dependence on hand-crafted features and tend to fail at determining accurate interpretations for complex or overlapped symptoms of diseases [5,6,7]. The first symptoms of disease may demonstrate a level of subtlety that cannot be effectively detected by either human inspection or conventional computer vision methods, leading to postponed treatment and increased agricultural losses. Existing AI-driven systems usually have no friendly interfaces or transparent decision-making processes, which prevent their applied realization by plant pathologists and agricultural experts.
Recently, with the rise in the use of electronic devices, there has been a growing focus on combining machine learning and network technology for the automatic identification and diagnosis of plant diseases [8]. In recent years, the rapid advancement of GPU processors, offering greater computing power and memory, has significantly boosted the popularity of deep learning [9]. This progress has made deep learning more accessible and efficient for a variety of applications. Many studies have turned to machine learning and deep learning techniques in agriculture to improve the detection and classification of diseases [10,11,12,13]. Deep learning offers a fresh perspective by automating the detection process and making it faster and more consistent. Advanced deep learning models can analyze large datasets to achieve remarkable accuracy. These techniques reduce reliance on manual inspections, making disease management more efficient and scalable. The goal of the proposed system is to support farmers and pathologists with a reliable tool for early detection and timely action, ultimately contributing to healthier and more productive apple orchards.
To counter current limitations, future projects will place a high priority on the expansion of datasets to involve more types of crops, the addition of meteorological and environmental variables for prediction enhancement, and the inclusion of more explanatory elements. The method in this research tries to connect new artificial intelligence possibilities with actual and practical uses for the agricultural sector to promote sustainable production and minimize losses caused by plant disease.
This research is successful in demonstrating the immense and revolutionary scope that artificial intelligence, popularly termed AI, can provide in the field of agriculture. It offers scalable solutions that are particularly aimed at minimizing crop loss and improving overall productivity in a drastic way. By bringing together high-end technology and practical solutions that can be implemented in real environments, the research offers a useful contribution that assists in further advancing the growth and development of precision agriculture as a whole. It also plays a significant part in facilitating the development of sustainable food production systems that can fulfill the growing demands of the world population. Table 1 presents a comprehensive and elaborate overview of some of the studies on plant disease detection that have utilized machine learning and deep learning models. This indicates the innovative initiatives and pioneering efforts being undertaken in this important and significant area of research.

Table 1.
Overview of Plant Disease Detection Studies Using Machine Learning and Deep Learning Models.
The goal of this study is to create and test an easy-to-use, scalable AI model for accurate disease detection and classification on apple leaves and fruits. It will provide farmers and pathologists with timely insights that will aid in effective disease management, enhance crop yield and quality, and reduce losses.
The sub-objectives of this study are to focus on effective disease recognition in apples. It aims at choosing and comparing deep learning models like ResNet152V2 and Xception with the aim of obtaining 90% and above accuracy for disease classification in apple fruits and leaves. Models will be trained to identify diseases such as blotch, scab, rot, and leaf infections accurately despite overlapping symptoms. A Gradio web application with a simple interface will allow users to upload images for real-time prediction, fine-grained disease classification, confidence scores, and management recommendations. The system will also possess model interpretability to reveal the decisions of the neural network, and this will facilitate enhanced transparency and trust in AI. It will also set the stage for scalability through the addition of more crop types and conditions so that it can achieve robustness in fields of diverse kinds.
2. Materials and Methods
2.1. Data Preprocessing and Augmentation
Datasets used in this study were collected from Kaggle. There were two different sets: one for apple fruit disease classification and the other for apple leaf disease classification. The apple fruit dataset had four diverse categories: Blotch Apple, Normal Apple, Rot Apple, and Scab Apple. Blotch Apple is a name given to fruits that are blotched, i.e., they have irregular dark spots on their surface. Normal apples refer to wholesome fruits showing no apparent defects or infections. Rot apples represent those infected with deterioration due to fungal or bacterial disease. Finally, scab apples refer to fruits that have been affected by apple scab, a fungal disease marked by dark, fleshy spots. For the apple leaf dataset, the categories were scab, black rot, cedar apple rust, and healthy. Scab is leaves with lesions from the same fungus that infects apple scab on fruit. Black Rot is leaves infected with a fungus that turns the leaves into black, dead spots. Cedar Apple Rust is a fungal disease producing yellow-orange spots with black pustules. Healthy leaves exhibit no apparent sign of any disease. The training set, validation set, and test set were separated according to a pre-defined split of 90% for training, 5% for validation, and 5% for testing. The splitting was conducted programmatically for consistency purposes as well as to eliminate errors due to human intervention. Images were randomized prior to separation so that separation was random and unbiased. There was a separate directory for each split and class, and the images were copied into the directories in an organized fashion.
The apple fruit dataset contained 502 images, with 399 for training, 49 for validation, and 54 for testing (Table 2). There were 12,000 images in the apple leaf dataset, out of which 10,800 were for training, 600 for validation, and 600 for testing (Table 3).
Table 2.
Data Distribution of Training, Validation, and Test Sets for Apple Fruit Diseases Classification.
Table 3.
Data Distribution of Training, Validation, and Test Sets for Apple Leave Diseases Classification.
2.2. Model Performance Assessment
The Pseudocode for Roadmap Technology gives a well-organized framework of the key steps undertaken in this research, ranging from data preparation to deployment of the AI-based disease classification system. It acts as a blueprint to comprehend the order of operations employed, thereby facilitating a methodical approach to problem-solving. The roadmap starts with loading and preprocessing datasets to develop uniform training, validation, and testing datasets. Next follows the training phase, validation, and performance testing on several intricate deep learning models. The top-performing models are then combined into a web application developed using Gradio, which is deployed for real-time disease detection and classification. The application also includes capabilities for enhancing model interpretability, providing both understanding and usability benefits to end-users like pathologists and farmers. This pseudocode plan ensures the scalability, stability, and transparency of the AI solution aligned with the overall objectives of improving agricultural diagnostics and disease management.
Below is the pseudocode of processes executed in the research, from data preprocessing to model deployment in the Gradio-based application:
- -
- Load apple fruit and leaf data.
- -
- Shuffle the data heavily and then split them randomly into three separate subsets: the training dataset, the validation dataset, and the test dataset (90%/5%/5%).
- -
- Normalize and resize images.
- -
- Initialize deep learning models: ResNet152V2, Xception, etc.
- -
- For every model:
- Train the model on the training dataset.
- Validate on the validation set.
- Measure performance on the test set and note metrics (accuracy, precision, recall, F1-score).
- -
- Choose the models with the best performance based on evaluation metrics.
- -
- Create a Gradio-based web application:
- Load the trained models
- Configure the interface to accept image upload.
- Predict disease category and confidence score.
- Show predictions along with disease information and management tips.
- Visualize model interpretability using neural activation maps.
- -
- Conduct final testing and deployment of the web application.
The dataset of the apple fruit included a total of 502 images, of which 399 images were exclusively designated for training, 49 images for validation, and the remaining 54 images designated as testing images, as indicated in Table 2. The dataset of the apple leaves had an impressive overall figure of 12,000 images in all, out of which 10,800 images were separated for training purposes, while 600 images were reserved for purposes of validation and 600 images were reserved for testing purposes, as can be observed from Table 3.
2.3. Data Augmentation and Transformation
Data preprocessing consisted of executing a very well-structured and thorough pipeline that was carefully designed to properly preprocess the datasets for training purposes but also for testing purposes. In the case of both datasets, it started with the careful reading of images from their respective directories, where each anomaly that was detected, such as missing files or corrupted files, was systematically identified and resolved to ensure data integrity and quality.
Each and every image that was used also went through meticulous resizing, which was necessary in achieving consistency and standardization in all the images. The resizing was necessary as it played a significant role in achieving consistency for the input data that would later be input into the model to analyze and train it. To be specific, the apple leaf images were resized carefully to a specific size of 128 × 128 pixels, while the apple fruit images were resized to a relatively larger size of 224 × 224 pixels to capture their unique features in an appropriate manner.
The reason for using a lower resolution when capturing images of apple leaves was primarily because the dataset that we were working with was significantly larger in terms of size. Specifically, the apple leaf dataset had far more images compared to the apple fruit dataset, and this was a problem. In addition, the amount of GPU memory available to process these images proved to be inadequate, which meant that it was not feasible to process all the data at the desired resolution of 224 × 224 pixels.
By lowering the resolution of the images to a small enough size at 128 × 128 pixels, the training could run smoothly, thereby eliminating any risk of memory issues that would slow down performance. Not only did the resizing of the images make the training process manageable, but it also served to avoid lagging or crashing that would be faced because of excessive use of memory, while keeping enough detail to ensure that the model would still be capable of learning quite adequately from whatever data it was being fed during the training process.
Apart from this essential step, the pixel values were also normalized by dividing the pixel value by 255.0. This step was extremely important since it normalized the pixel values so that they ultimately fell in the range of 0 and 1. This normalization is extremely helpful in stabilizing and then enhancing the overall efficiency of the model training process.
The names of the various classes were encoded in numerical format, i.e., each unique class was represented by a unique and different integer. This encoding makes representation easier in the machine learning pipeline as well as enabling the data corresponding to these classes to be dealt with more efficiently.
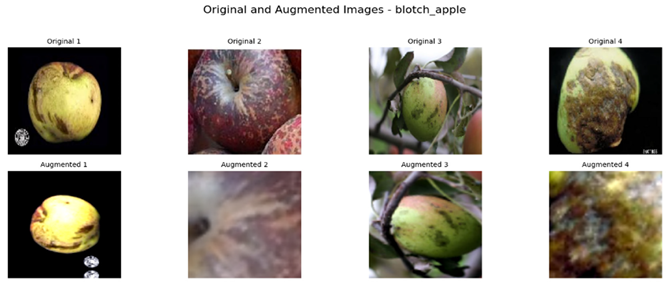
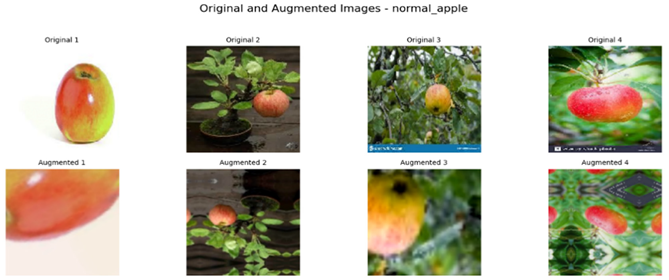
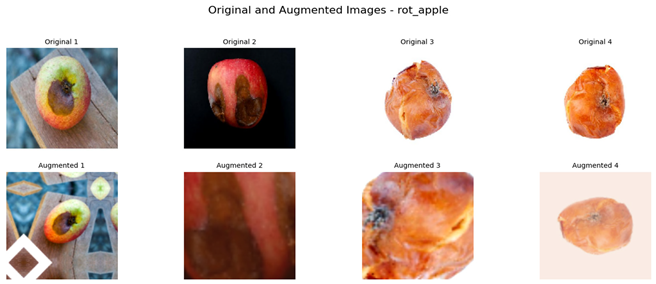
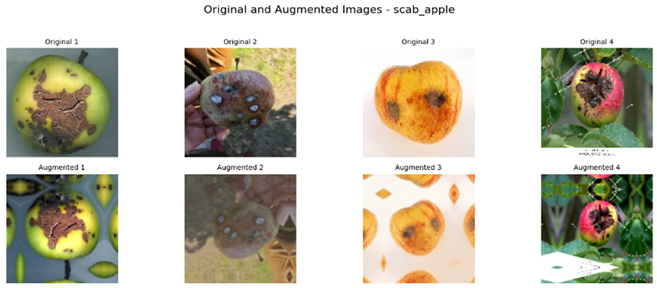
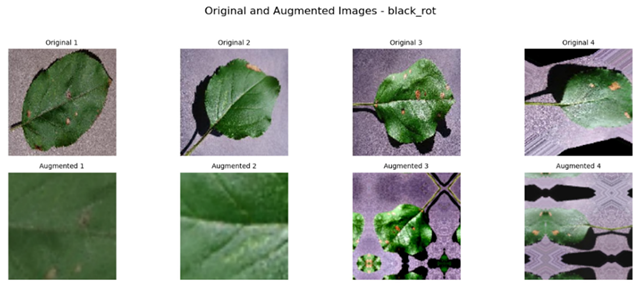
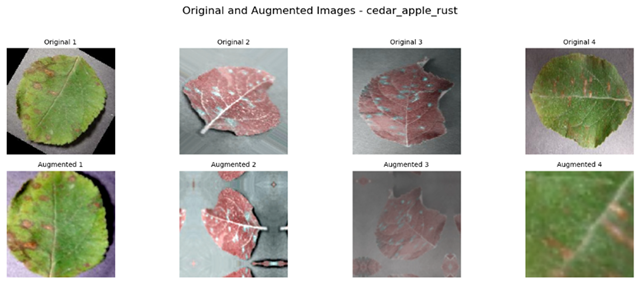
Referring to Table 4, one can see a complete visualization that depicts the different classes of diseases found on apple fruits, along with their respective augmented classes that have been improved for better visualization. Similarly, Table 5 shows another visualization that successfully displays both the original classes of diseases found on apple leaves and the improved augmented classes that correspond to the original classifications, giving a better idea of the categories of diseases.
Table 4.
Visualization of the Original and Augmented Apple Fruit Diseases Classes.
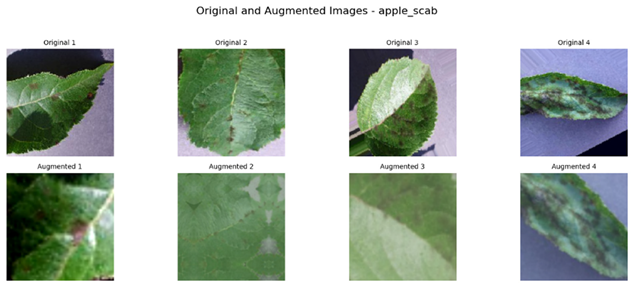
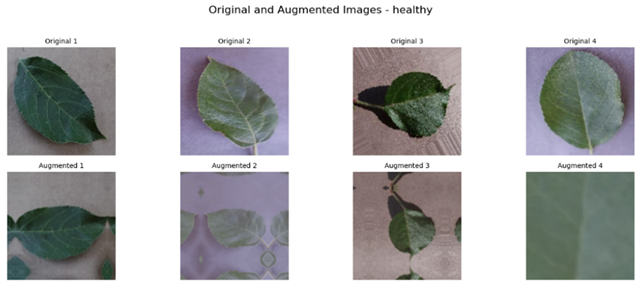
Table 5.
Visualization of the Original and Augmented Apple Leaves Diseases Classes.
2.4. Feature Selection for the Specified Models
Feature selection is required to optimize the performance of machine learning models, particularly in image classification. The present study utilized feature selection methods depending on the characteristics of the properties of the datasets and the specific models employed, including Xception, DenseNet, MobileNet, and EfficientNet. The primary aim was to determine and extract the most appropriate features that would improve the capacity of the models to differentiate between the various apple diseases.
Image data were preprocessed by resizing, normalization, and augmentation to standardize input and enhance feature quality. Feature extraction in deep learning models like Xception and DenseNet is automatically achieved during training. These architectures utilize convolutional layers to detect complex patterns in images, including texture, shape, and color. The lower layers identify simple features like edges, while the higher layers identify complex structures relevant for classification, for example, disease patterns on apple leaves and fruits.
Deeper networks like Xception and DenseNet extract features automatically, while light models like MobileNet and EfficientNet are busy selecting features. Although more efficient, the light models cannot detect subtle details like in deeper networks. We selected attributes from the database, such as color histograms, texture, and shape descriptors. These features were able to support light models to detect patterns from images, compensating for their smaller architecture.
To make sure that the selected features were non-redundant and pertinent, several feature selection techniques were utilized. Principal Component Analysis (PCA) was utilized in an attempt to minimize the feature space by selecting significant components with the highest variance. This eliminated less informative features. Correlation Analysis was employed to remove correlated features to prevent multicollinearity to ensure that every feature contained independent information. Mutual information among features and target variables (disease class) was calculated to quantify their relationships. Features with high mutual information values were employed for training models.
In architectures such as Xception and DenseNet, which are fundamentally based on convolutional neural networks (CNNs), feature extraction is realized by a sequence of convolutional layers. These layers automatically learn spatial hierarchies of features from raw pixel data during training. One of the most important capabilities of CNNs is that they can detect an extensive range of features without any manual adjustment, thereby allowing the model to fit the most applicable patterns in the data.
The low-level visual information features that are learned by the CNNs at the early layers tend to highlight edges and textures, while higher-level features that are related to the disease patterns on apple leaves and fruits are learned by the deeper layers. This automatic feature selection and extraction process is one of the most significant reasons why CNN-based models perform well in image classification tasks.
Feature selection was the factor that had significant effects on the ability of models to properly classify apple diseases. For more detailed models like Xception and DenseNet, application of automatic feature extraction created a robust foundation for the classification. Conversely, for lighter models like MobileNet and EfficientNet, combining manually pre-selected features with automatic learning yielded improved performance, even considering that their architectures are smaller.
By prioritizing significant features such as color, texture, and shape and applying sophisticated feature selection methods, we were able to ensure that the models were developed using the most important data. This was able to contribute to better generalization and performance, especially in addressing the imbalance between the apple leaf and apple fruit datasets.
2.5. Feature Selection Using PCA
PCA is one of the most popular dimensionality reduction techniques for feature selection in machine learning, particularly image classification. PCA converts original features to orthogonal features, giving more importance to the most important features that impact dataset variance. This procedure simplifies the model along with enhancing computational efficiency and generalization by removing redundant or noisy features.
PCA re-maps the original feature space to a new coordinate system where the principal components explain most of the variance. It identifies directions of maximum variance and projects the data onto them, dimensionally reducing and retaining information.
The research aimed to apply PCA to reduce the apple leaf and fruit disease data, making them more efficient and retaining important information. PCA was used to retain important features to classify and drop unimportant features, eliminating overfitting as well as saving computation expenses.
PCA was performed on the apple leaf and fruit disease datasets after preprocessing, involving resizing, normalization, and augmentation. There are subsequent feature selection steps using PCA. Data standardization features were standardized (mean-centered and unit variance) to avoid PCA being biased due to various units or ranges. This makes PCA treat all the features equally irrespective of scale. PCA begins with the covariance matrix, which explains how the features change together and includes their relationships. In eigenvalue decomposition, PCA applies eigenvalue decomposition to the covariance matrix to obtain principal components with an eigenvector and related eigenvalue that represents explained variance. In choosing principal components, following the computation of eigenvalues and eigenvectors, we ordered components based on explained variance. We chose the first N components explaining 95–99% of the variance to construct a lower-dimensional feature space for model training.
In data transformation, the data were mapped from the original space onto selected principal components, producing a lower-dimensional feature set that preserved the dataset’s essential features without retaining less informative features.
PCA as a feature selection method lowered the dimensionality of the dataset, enhancing model performance in a variety of ways. PCA eliminated redundant features, avoiding overfitting on the smaller apple fruit disease dataset. With fewer features, models were less likely to memorize noise, thereby generalizing better. Lessened features expedited training and reduced computing costs. This was especially relevant to lightweight models like MobileNet and EfficientNet, which derive benefits from faster training and lower cost. In apple leaf and fruit disease datasets, PCA helped in retaining the significant features for optimal classification. More precisely, PCA helped in enabling the models to focus on the most important patterns in the data, resulting in improved classification performance, especially if the dataset had high dimensionality or noise.
While PCA is effective at feature selection, there are a few limitations. The cost PCA incurs is that the new features are linear combinations of the originals, and this leads to a loss of interpretability, and it becomes harder to understand feature contributions to classification. PCA requires data to be linear, something which does not occur with complex non-linear datasets. Under these conditions, kernel PCA or autoencoders would be used.
PCA was combined with feature selection methods such as correlation analysis and mutual information. PCA is a dimensionality reduction method that retains components of maximum explained variance, while mutual information selects features based on relevance to the target variable. By combining the methods, selected features proved to be efficient and informative enough to use when training the models.
The application of PCA, manual feature selection, and deep learning-based feature extraction guaranteed that models used appropriate features, improving efficiency and performance.
To construct a balanced dataset and strengthen the model’s generalization ability, data augmentation strategies were implemented. Data augmentation strategies included random horizontal and vertical flipping, rotation, zooming, and contrast adjustment. For apple leaves alone, the augmentation parameters included random rotation up to 70%, zooming, and contrast adjustment to a comparable extent. This augmentation technique incorporated randomness in the training set, thereby mimicking the real-world conditions where the orientations of leaves and lighting conditions might differ. In the same way for apple fruits, random vertical and horizontal flips, 50% rotation, zoom, and contrast changes were introduced. These augmentations prevented the model from overfitting certain image characteristics so that it may generalize well on unseen data.
In the process of loading data, images in all folders were loaded one by one, resized, normalized, and labeled with corresponding labels. Then, both images and labels were transformed into TensorFlow datasets. For training datasets, data augmentation was performed on each batch of images, increasing their variety by mimicking various situations the model would face in practical applications. Validation and test sets were imported without augmentation to make sure that the performance of the model was evaluated on unchanged, original images. The sets were shuffled to avoid the model learning any unwanted sequential patterns and then batched, with a batch size of 16 for apple leaves and 32 for apple fruits. This variation in batch size was based on the available GPU memory size and the sizes of the datasets. Apple leaves possessed a greater dataset size, and thus needed a smaller batch size to fit into memory during training. In contrast, apple fruits’ smaller dataset size allowed for a greater batch size, enabling faster training iterations without compromising memory efficiency. These configurations enable smooth processing while achieving a balance between computational constraints and model performance.
2.6. Proposed Model
The proposed model structure was developed to perform the apple leaf and fruit disease classification, where the primary difference was the backbone networks used for feature extraction: Xception for apple leaves, and ResNet for apple fruits. Both models had a pre-trained backbone that employed the “imagenet” weights to leverage the rich feature representations achieved from a large data set. This is the strategy adopted for transfer learning to enable the model to learn lower-level patterns such as textures and edges and higher-level abstract features, thereby establishing a good foundation for the classification of diseases.
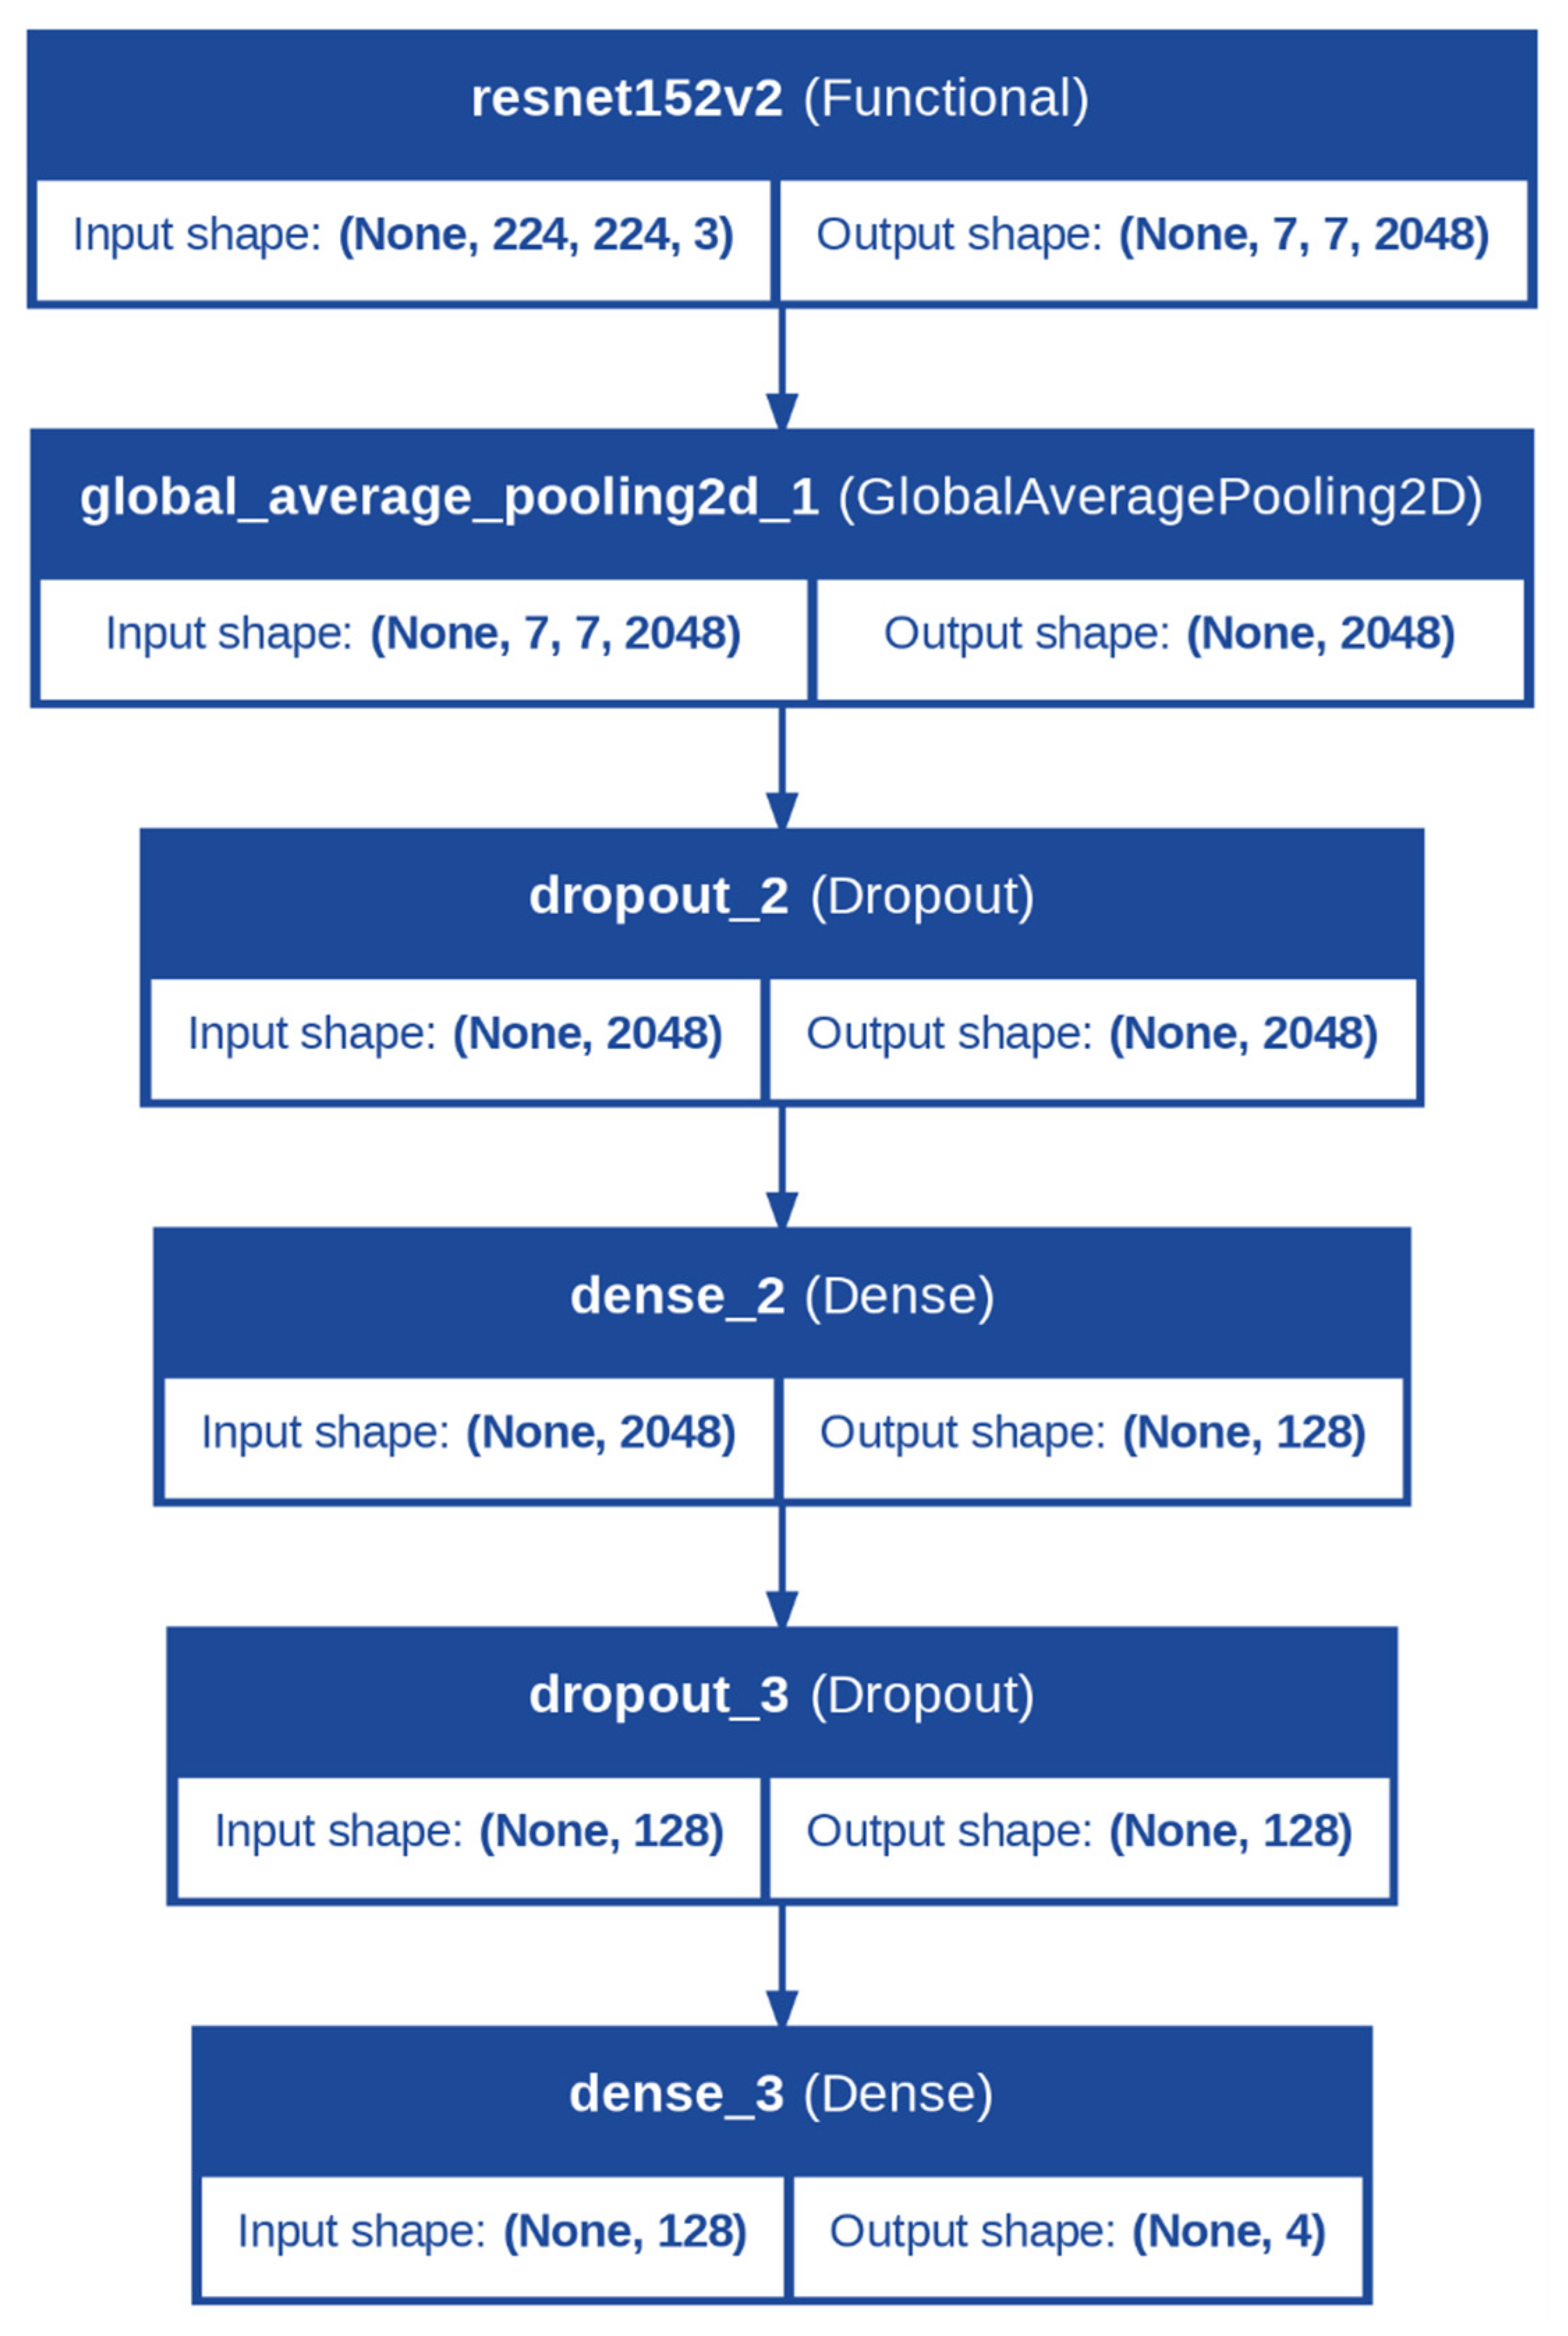
In the case of the apple fruit category, the standard model selected was the Residual Network (ResNet) architecture. ResNet architecture utilizes skip connections to alleviate the problem of the vanishing gradient and thereby facilitate the learning of deeper and more specialized representations. This characteristic makes it ideally suited to the fruit categorization task, in which the identification of disease includes the identification of subtle features, such as blemishes on the surface, in addition to more evident ones such as shape or color irregularities, all of which are well-served by the fine-grained structure of ResNet (Figure 1).
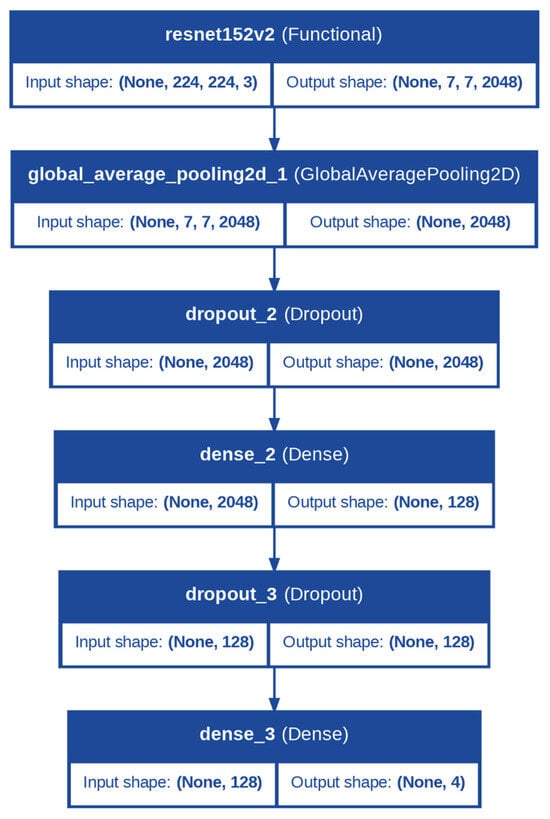
Figure 1.
Architecture of the Proposed Model for Apple Fruit Diseases Classification.
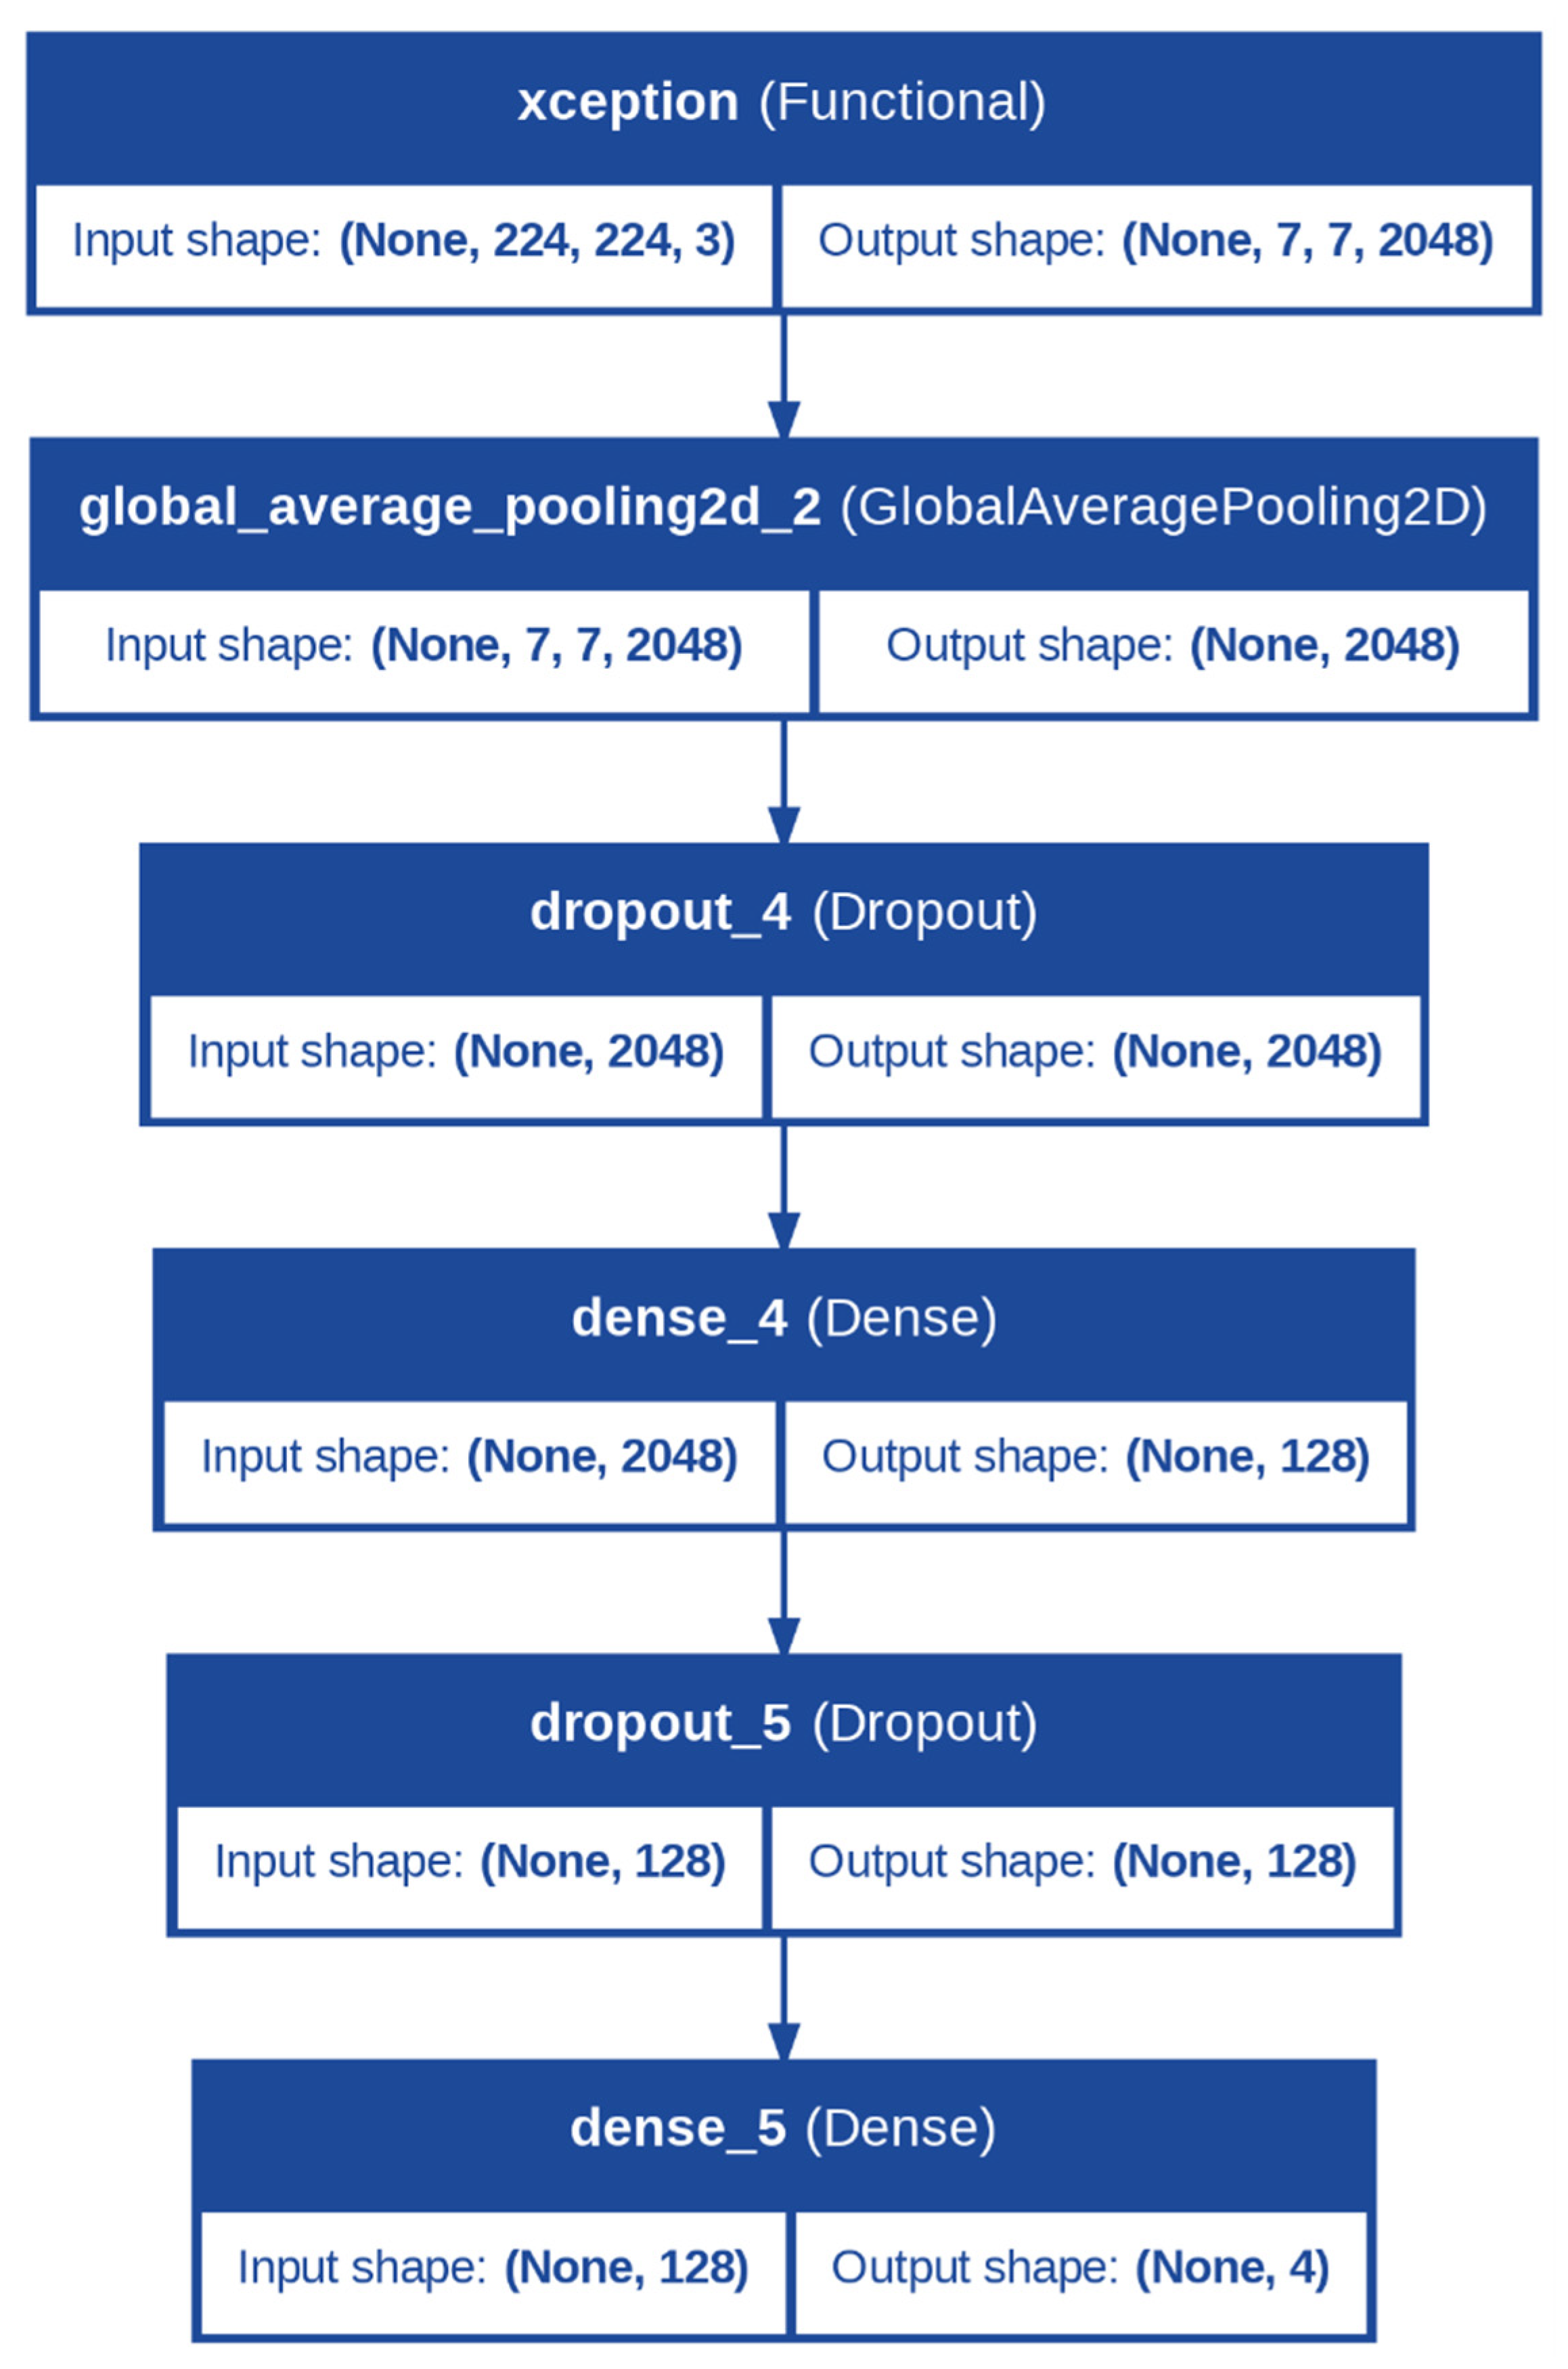
For apple leaves, the backbone was the Xception model. Xception (Extreme Incep-tion) is a depthwise separable convolutional network that is efficient at capturing detailed spatial patterns from images at low computational costs, and therefore it is highly appropriate for leaf classification. Leaves are likely to exhibit very fine patterns characteristic of specific diseases in the form of discoloration, spots, or the formation of thin veins. These fine points can be efficiently examined and recognized by the Xception model since it is capable of paying attention to spatial hierarchies at a low computational cost, as seen from Figure 2.
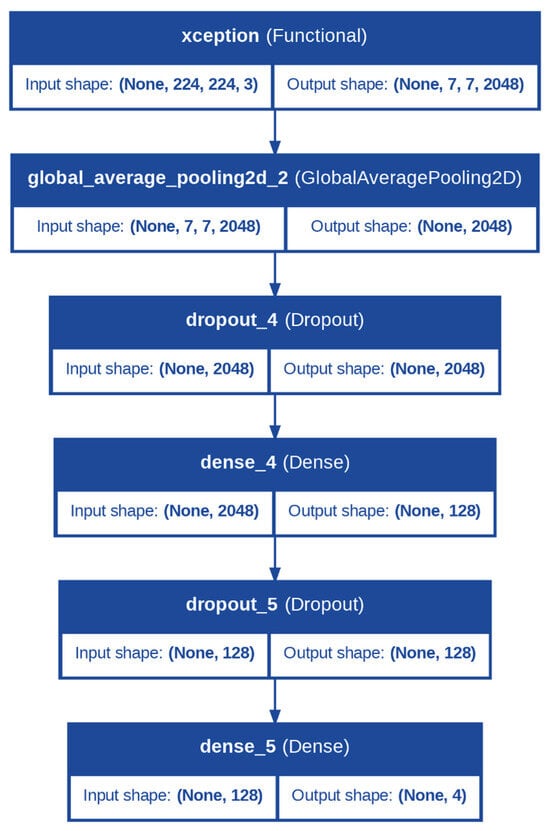
Figure 2.
Architecture of the Proposed Model for Apple Leaves Diseases Classification.
In both models, the backbone was configured with the include_top = False parameter, ensuring the exclusion of the fully connected layers from the original architecture, as these were specific to the ImageNet dataset. Instead, the output from the backbone was passed through a GlobalAveragePooling2D layer, which reduced the spatial dimensions of the feature maps to a single vector per feature map.
Following the backbone, the classification head was identical for both tasks and was designed to further process the extracted features and make predictions. A dropout layer with a rate of 0.5 was applied to introduce regularization, reducing the chances of overfitting. This was followed by a dense layer with 128 neurons and a ReLU activation function, enabling the model to learn complex, non-linear combinations of features. Another dropout layer with a rate of 0.5 was added to ensure robustness. Finally, the output layer comprised a dense layer with a number of neurons equal to the number of classes (num_classes) and a softmax activation function. The softmax layer converted the logits into class probabilities, allowing the model to output predictions for each class.
Additionally, during fine-tuning, the trainability of the backbone layers was adjusted to balance feature retention and task-specific learning. The last 10 layers of the backbone were set to be trainable, allowing the model to adapt the most relevant higher-level features for apple leaf and fruit disease classification while retaining the general feature representations learned from ImageNet.
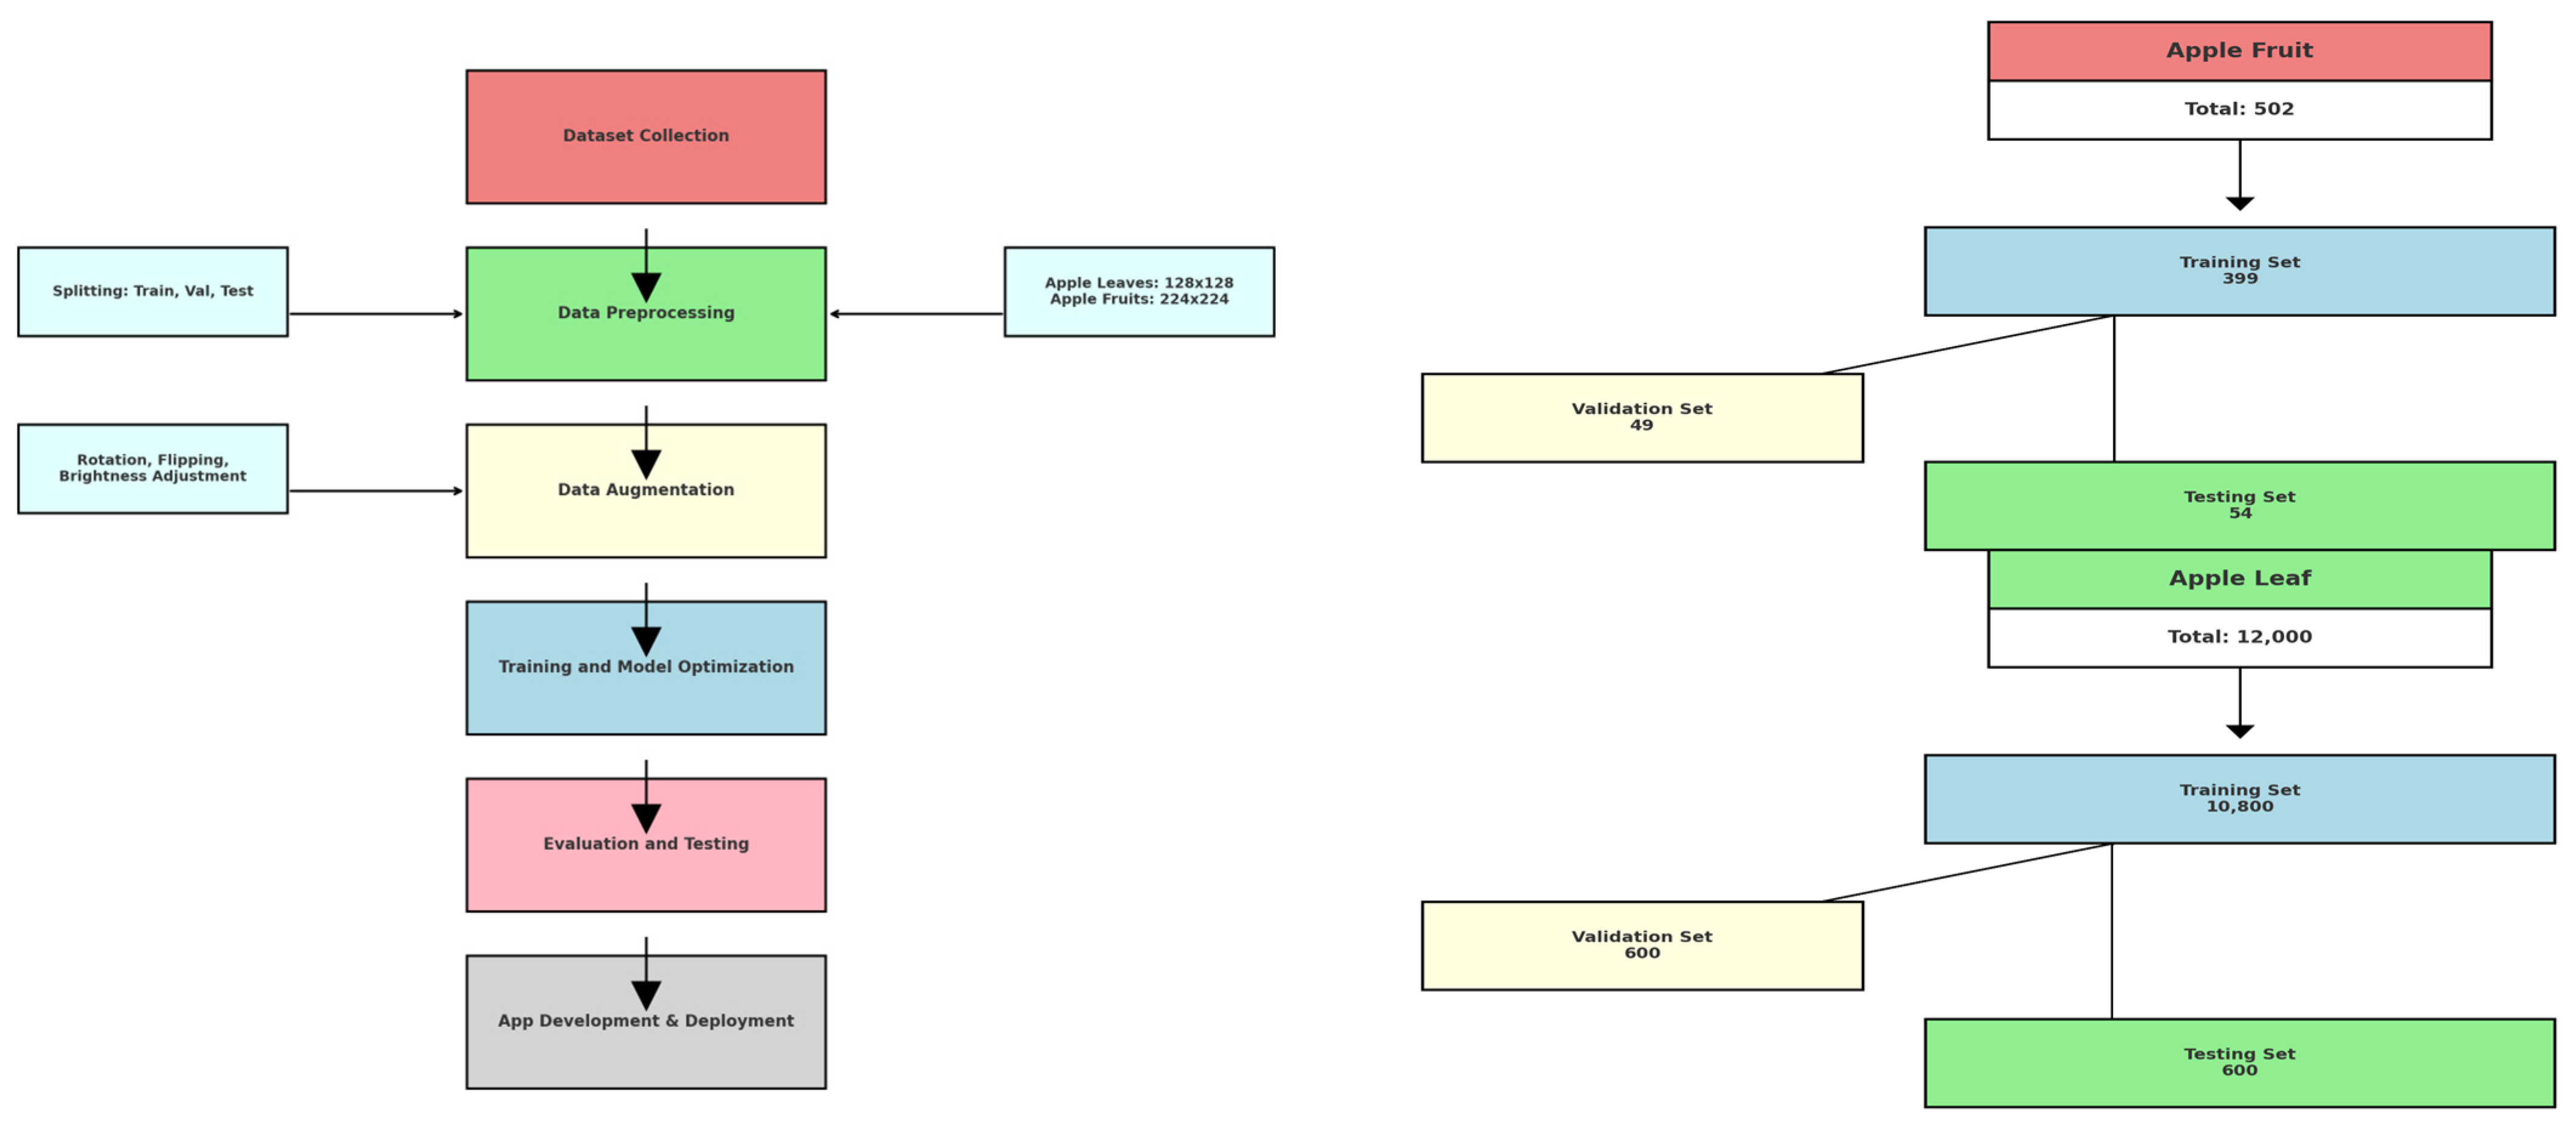
Figure 3 depicts a step-by-step experimental setup for apple leaf and fruit classification. The left graph illustrates the process flow, beginning with dataset gathering, then data preprocessing in which the dataset is divided into training, validation, and test datasets. Apple leaf images are resized to 128 × 128 and apple fruit images to 224 × 224 during preprocessing. Then, some data augmentation methods, such as rotation, flipping, and brightness adjustment, are performed to increase the generalization ability and decrease the possibility of overfitting. Then, the preprocessed and augmented data are used for model training and model optimization. Then, the performance of the model is evaluated with the test dataset prior to its integration into an application during development and deployment. The figure on the far right shows the structure of the dataset, which means that the apple fruit dataset comprises 502 images, out of which 399 are for training, 49 for validation, and 54 for testing. Similarly, the dataset of apple leaves comprises 12,000 images, out of which 10,800 are for training, 600 for validation, and 600 for testing, thus having more than enough data to facilitate thorough model training and testing.
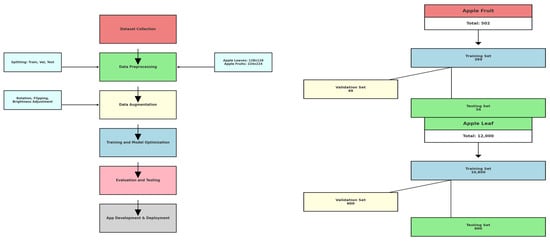
Figure 3.
Experimental Workflow (on the left); Dataset Structure (on the right).
TensorFlow 2.x was utilized as the main deep learning library during training and model development in the study. TensorFlow was utilized since it is versatile, supports GPU operations, and provides a full set of tools to deploy, visualize, and optimize models. XRAI (eXtended Regions of Interest) was utilized in finding the areas of the model responsible for its decision-making, enhancing explainability.
The models were trained on a NVIDIA RTX 3080 graphics processing unit and an Intel Core i9 central processing unit, and batch sizes were set to 32 for better memory utilization. The average training time per epoch of the apple leaf dataset comprising 12,000 images was 45 s; meanwhile, the apple fruit dataset comprising 502 images took under 5 s per epoch. The models took twenty epochs to converge, and there was no overfitting observed because of regularization and data augmentation. The inference time was four milliseconds per image on the GPU, and hence the system was real-time deployable.
2.7. lImplementation of the Proposed Model
The experimental setup for this study includes data preprocessing, training, evaluation, and app development. Initially, the dataset for both apple fruits and leaves underwent standard preprocessing, including splitting into training, validation, and test sets. To enhance model performance, data augmentation techniques such as rotation, flipping, and brightness adjustments were applied to mitigate overfitting and improve generalization. For apple leaves, images were resized to 128 × 128, while apple fruits were resized to 224 × 224, aligning with the input requirements of the respective models.
The training phase utilized several advanced deep learning architectures, including Xception, InceptionV3, InceptionResNetV2, EfficientNetV2M, MobileNetV3Large, ResNet152V2, DenseNet201, and NASNetLarge. Each model was initialized with ImageNet-pretrained weights to use transfer learning. The models’ base layers were made partially trainable, with only the last 10 layers unfrozen to fine-tune higher-level features specific to the task. A consistent head architecture comprising global average pooling, dropout layers, a dense layer with 128 neurons, and a final classification layer arranged to the number of classes (4 for each task) was appended. Training employed Adam optimizer with a learning rate of 1 × 10⁻⁴, sparse categorical cross-entropy loss, and accuracy as the primary metric. Callback mechanisms were implemented. The ModelCheckpoint callback is configured to save the best-performing model based on validation accuracy, specified ensuring the most accurate weights are preserved. It saves only the weights rather than the entire model. The mode is set to “max”, meaning it monitors for the maximum value of validation accuracy, and progress is displayed during training. The ReduceLROnPlateau callback dynamically adjusts the learning rate when validation performance plateaus by monitoring the validation loss. If no improvement is observed for five consecutive epochs, the learning rate is reduced by a factor of 0.5, but it is not allowed to drop below a minimum value of 1 × 10⁻⁶ ensuring stability. Progress for this adjustment is also displayed. Finally, the EarlyStopping callback stops training when validation accuracy shows no improvement for ten epochs, reducing unnecessary computation. It restores the model weights from the epoch with the highest validation accuracy and displays its progress. Each model was trained for 20 epochs, with metrics and weights saved for later analysis.
The assessment process entailed a thorough scrutiny of the performance displayed by the models upon application to the mandated test set. In an attempt to sufficiently judge their ability to classify different diseases accurately, a range of tools was utilized, including confusion matrices, precision-recall curves, and detailed classification reports. The metrics offered good insights into model performance. Specifically, important metrics like accuracy, precision, recall, and the F1-score were used in comparing the numerous models in contention. Apart from this quantitative study, graphical plots of training and validation accuracy and loss over multiple epochs were compiled. These plots played a beneficial role, as they enabled patterns of convergence to be viewed and offered a platform for identifying any possible signs of overfitting that would undermine the performance of the models. For both the tasks, the top performing models (Xception for apple leaves and ResNet152V2 for apple fruits) were chosen for deployment.
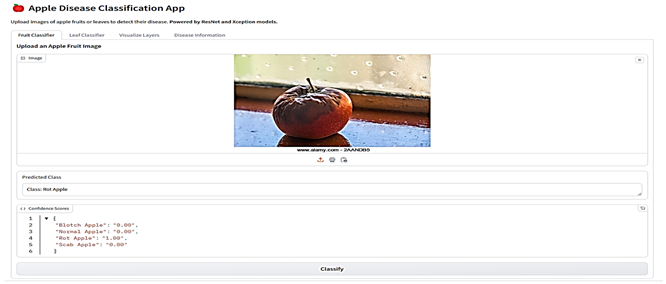
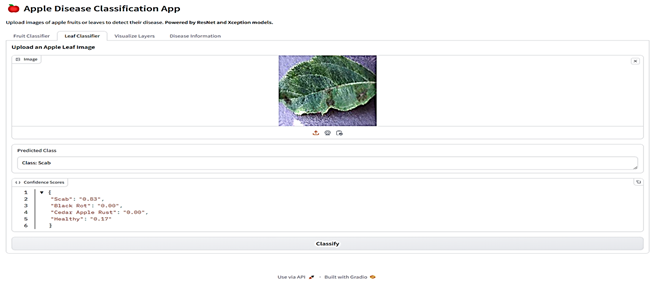
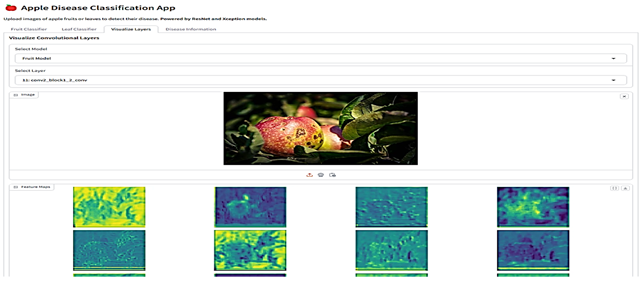
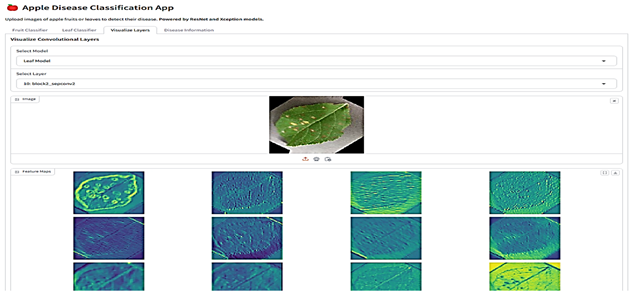
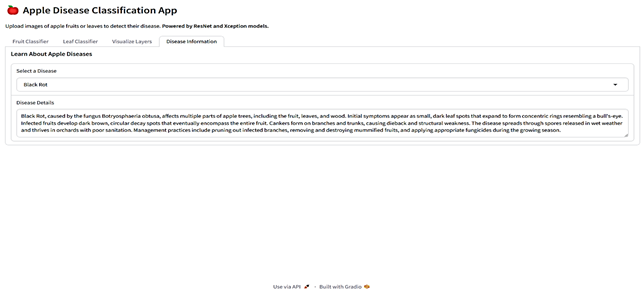
The final stage involved integrating the selected models into a Gradio-based web application (Table 6). This application is a comprehensive tool designed for analyzing images of fruits and leaves to classify them into specific categories and provide detailed insights. Users can upload images through an interface where various menus given as buttons allow navigation between functionalities such as classification and visualization. For classification, the app employs the proposed models ResNet for fruits and Xception for leaves, which analyze the uploaded image to predict its class along with confidence scores for all possible categories. Fruit images are classified as “Blotch Apple”, “Normal Apple”, “Rot Apple”, or “Scab Apple”, while leaf images are identified as “Scab”, “Black Rot”, “Cedar Apple Rust”, or “Healthy”. The application also offers advanced visualization capabilities, enabling users to explore intermediate layers of the models. Using dropdown menus, users can select the model they want to use, upload an image, and choose specific layers of the neural networks, which are then visualized as feature maps. These feature maps highlight how the model perceives various regions and patterns in the input image. Each class prediction is accompanied by a confidence score, providing transparency and aiding decision-making. The app also integrates an informative section, detailing the diseases associated with the predicted classes, their causes, and management strategies.
Table 6.
Web Application Interface.
3. Results
3.1. Apple Fruit Disease Classification
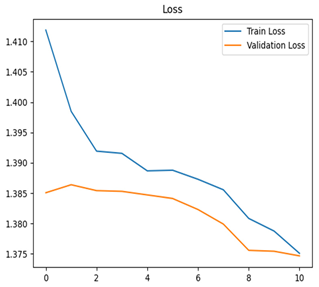
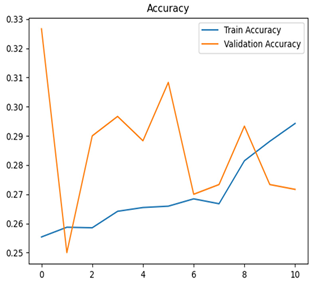
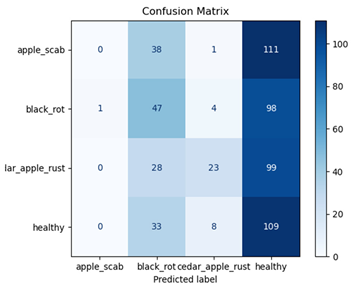
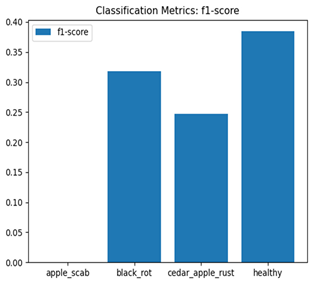
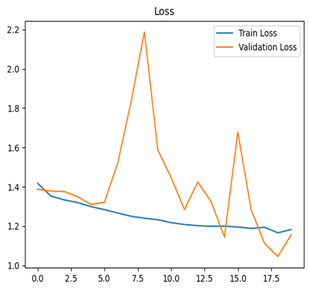
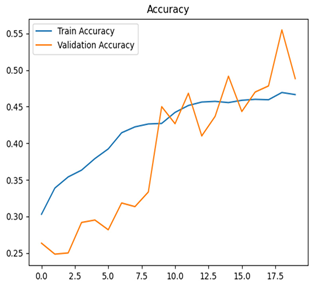
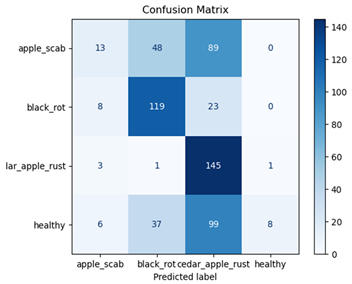
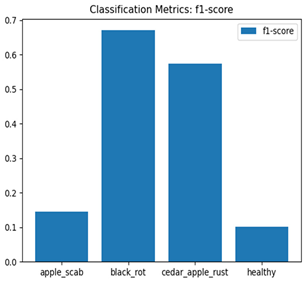
To determine the various diseases that occur in apple fruit, the performance and functionality of various deep learning models are important. The comprehensive summary that reveals the performance measures of eight various deep learning models used specifically for the task of classifying apple fruit diseases and apple leaves diseases in shown the following tables. Each model undergoes an exhaustive evaluation process consisting of key visual elements, including training and validation loss curves and accuracy curves, confusion matrices, and F1-score plots. These important measures enable a comparative evaluation, showing how well the models learn, how they generalize their outcomes, and how they classify the diseases of apple fruits. This clear illustration ultimately shows the strengths and weaknesses of each model in a straightforward and easy-to-comprehend way.
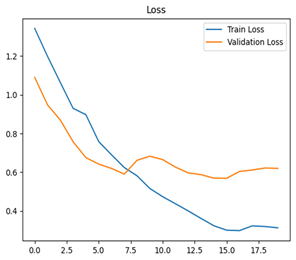
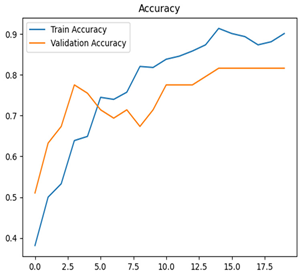
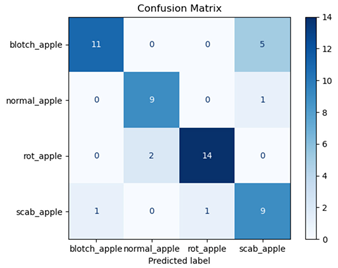
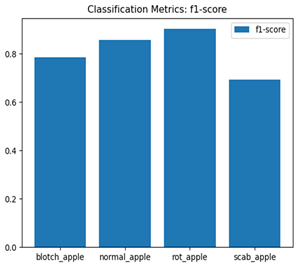
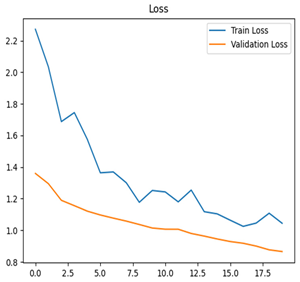
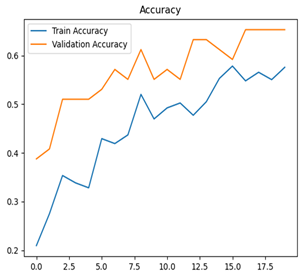
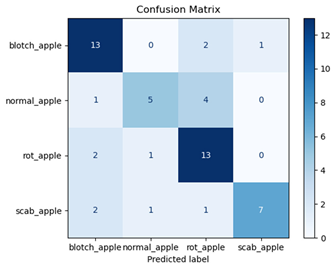
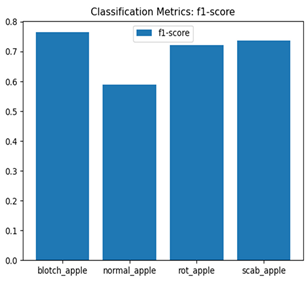
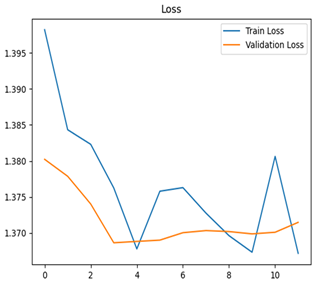
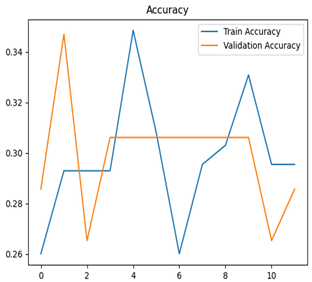
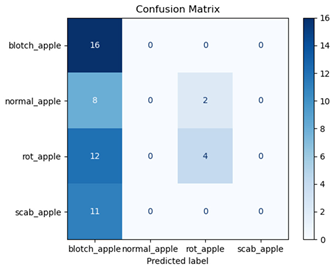
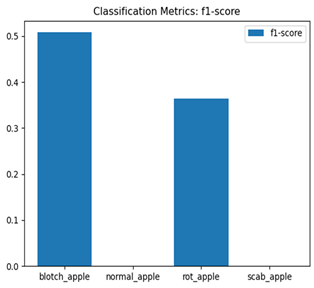
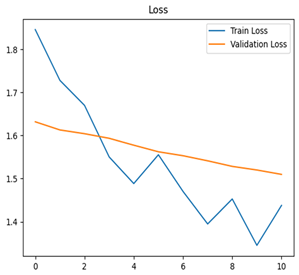
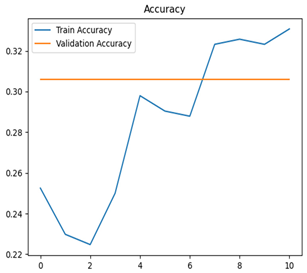
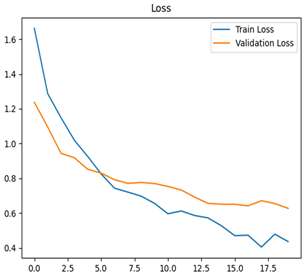
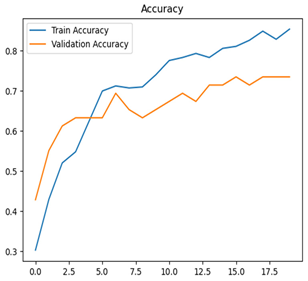
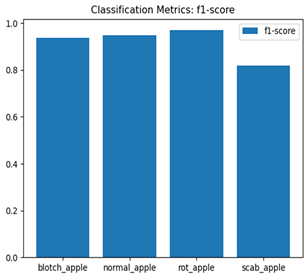
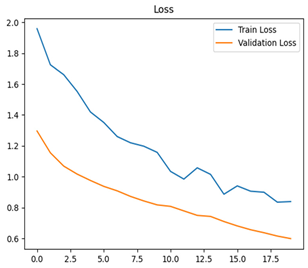
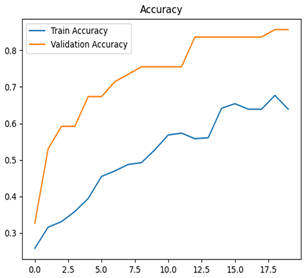
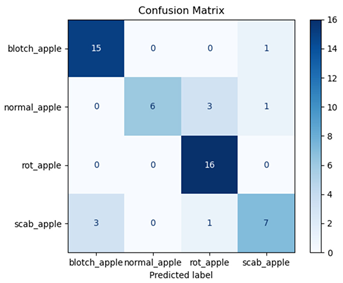
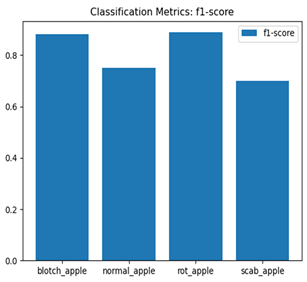
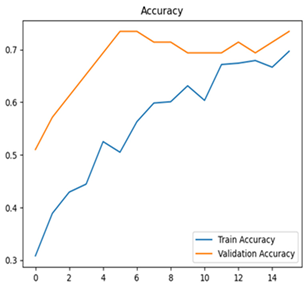
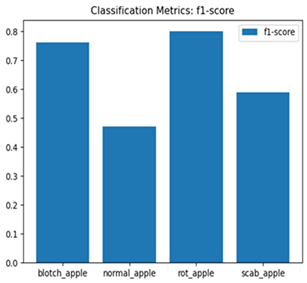
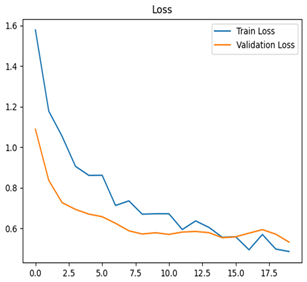
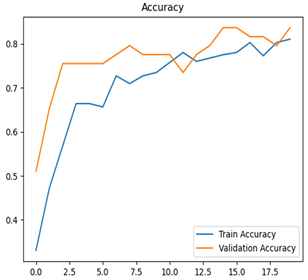
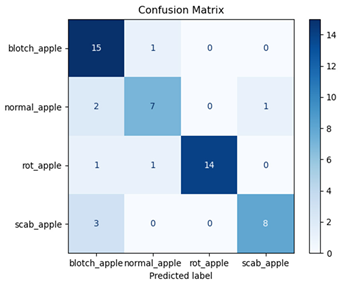
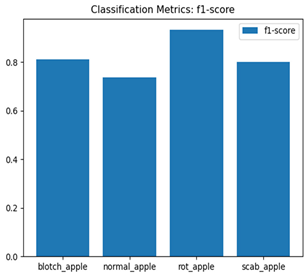
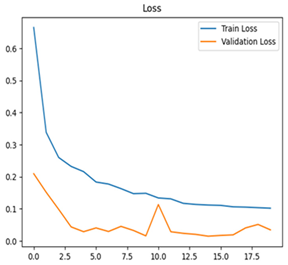
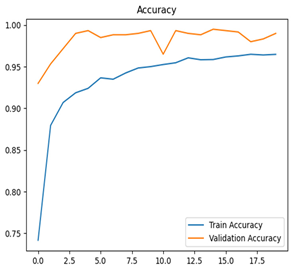
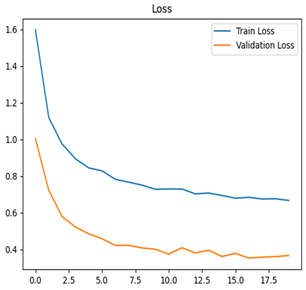
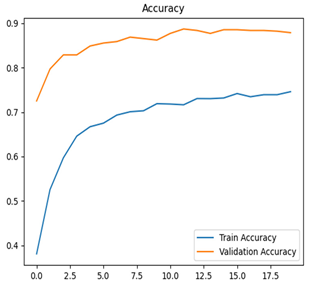
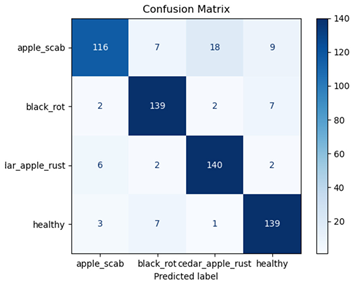
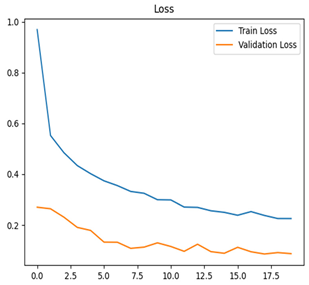
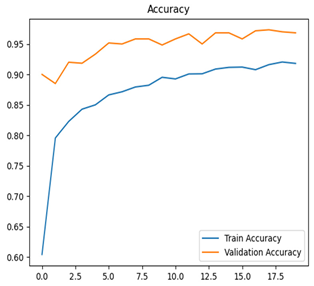
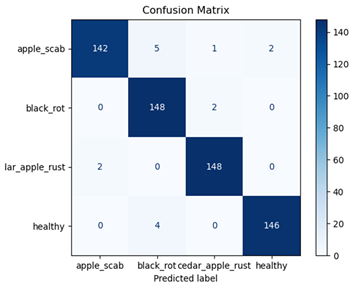
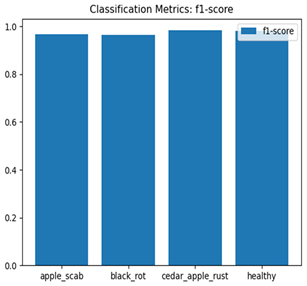
For disease classification in apple fruit, the ResNet model was most accurate at 92%. Its macro-averaged precision, recall, and F1-score were all 0.92, indicating good classification capability. ResNet demonstrated perfect recall in rot_apple (1.00) and precision in normal_apple (1.00). These results show its proficiency in identifying apple diseases with low false positives and negatives. The loss plot exhibits a steady decreasing trend in train loss, showing that the model effectively reduced error throughout epochs. Validation loss also decreases, especially for initial epochs, illustrating good generalization to new data. Small oscillations in validation loss in subsequent epochs indicate little risk of overfitting. The plot of accuracy confirms this, with a consistent increase in both training and validation accuracy, plateauing at high values towards the end. Convergence and validation stability of accuracy suggest that the ResNet model learned appropriately and worked consistently on the validation set, qualifying it for classification.
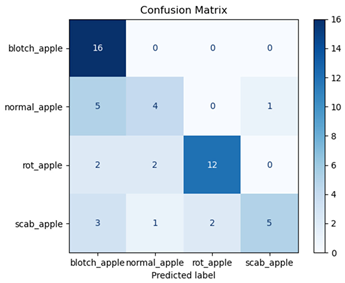
Inception-ResNet, the second-best model, achieved an 83% accuracy and a well-balanced performance, with a macro-averaged F1-score of 0.82. It excelled at predicting rot_apple with an F1-score of 0.93. For scab_apple, ResNet surpassed Inception-ResNet with an F1-score of 0.80 and a recall of 0.73.
DenseNet and Xception were both 83% accurate. DenseNet performed best with an F1-score of 0.89 for rot_apple and 0.88 for blotch_apple. For scab_apple, DenseNet F1-score of 0.70 was higher than Xception’s 0.69. Xception’s weighted average F1-score was higher at 0.82 compared to DenseNet with 0.81. Xception performed well on the whole but struggled with blotch_apple and scab_apple due to low rates of precision.
The Inception model showed a commendable degree of success by recording a very good accuracy rate of 72% in general, with a macro-averaged F1-score of 0.70. This result shows that although the model exhibited medium performance on most of the different classes being considered, it also revealed certain areas where it did not perform well. Specifically, the performance of normal_apple, which had an F1-score of 0.59, and scab_apple, which had a somewhat higher F1-score of 0.74, reflected its specific weaknesses and limitations in these classes.
NASNet achieved an accuracy of 70% and a macro-averaged F1-score of 0.66. It performed well for rot_apple (F1-score = 0.80) and blotch_apple (F1-score = 0.76) but showed significant performance drops in normal_apple (F1-score = 0.47) and scab_apple (F1-score = 0.59).
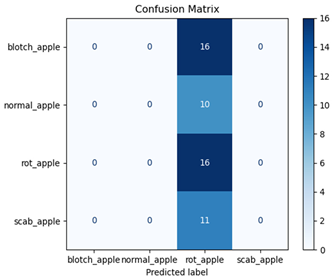
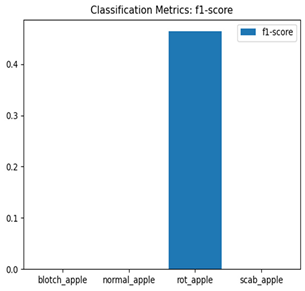
The EfficientNet and MobileNet models significantly underperformed, with accuracies of 38% and 30%, respectively. EfficientNet struggled to classify most categories, achieving a macro-averaged F1-score of only 0.22. Notably, it failed entirely to classify normal_apple and scab_apple (precision and recall = 0.00 for both). MobileNet similarly faced significant challenges, with a macro-averaged F1-score of 0.12, managing acceptable performance only for rot_apple (F1-score = 0.46).
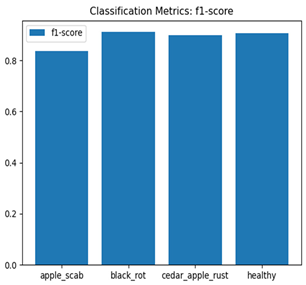
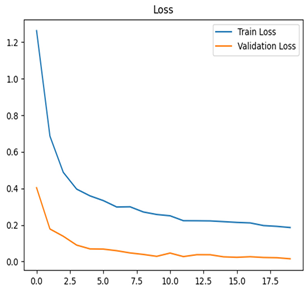
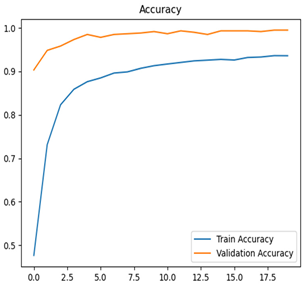
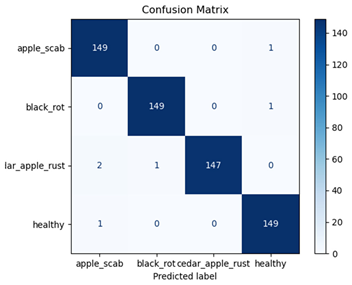
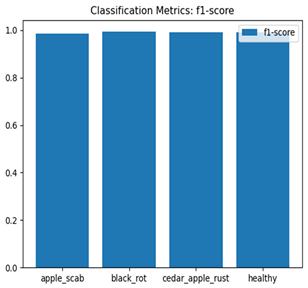
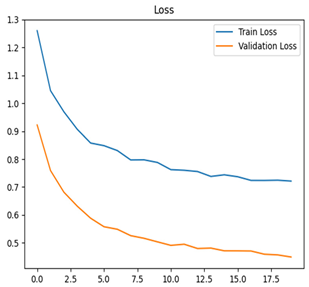
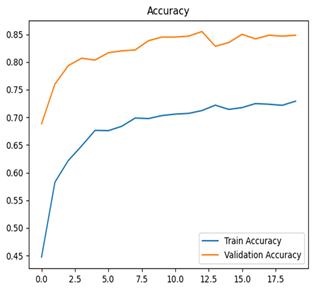
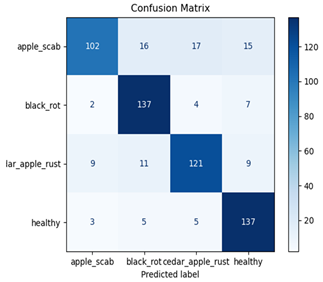
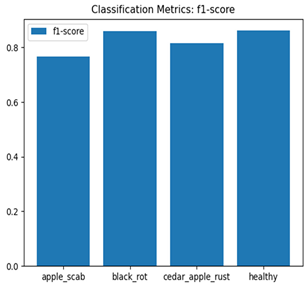
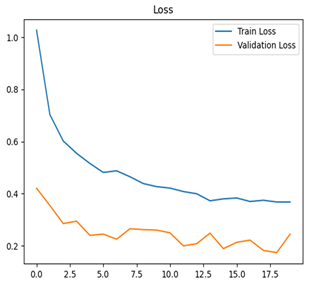
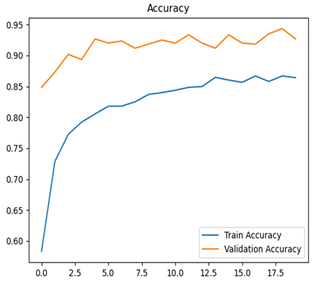
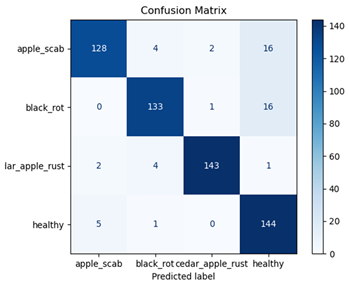
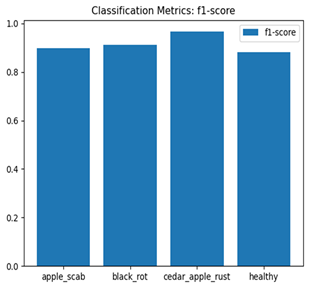
Table 7 and Table 8 are the Training and Validation Loss Curve Plot, where the x-axis is the number of epochs, with one epoch being one pass through the training data. On the other hand, the y-axis is a loss measure, quantifying the difference between predicted results and actual values. In the Training and Validation Accuracy Curve plot, the y-axis is accuracy, the ratio of correct predictions. In the confusion matrix plot, rows are the true labels (the true class), and columns are the predicted labels (the class as predicted by the model). In the F1-Score Plot, the x-axis has the categories blotch_apple, normal_apple, rot_apple, and scab_apple, and the y-axis has the F1 score, between 0 and 1.
Table 7.
Results of the Models for Apple Fruit Diseases Classification.
Table 8.
Results of the Models for Apple Leaves Diseases Classification.
3.2. Apple Leaf Disease Classification
Eight deep learning models, including Xception, InceptionV3, EfficientNetV2M, MobileNetV3Large, ResNet152V2, DenseNet201, NASNetLarge, and InceptionResNetV2, were tested to classify apple leaf diseases. Their performance was measured using training and validation loss and accuracy curves, confusion matrices, and F1-score plots. Table 8 presents a detailed summary of these results, offering understandings into how well each model learns and detects diseases along with their areas for improvement.
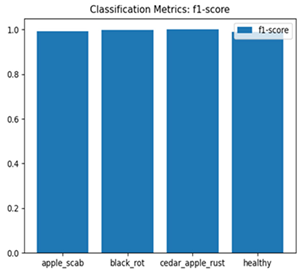
For apple leaf disease classification, the Xception model emerged as the best performer, achieving an accuracy of 99% and demonstrating near-perfect performance across all classes. Its macro-averaged precision, recall, and F1-score were each 0.99, highlighting its reliability and robustness. Xception particularly excelled in classifying scab_apple, with an F1-score of 0.99, slightly outperforming DenseNet. The training and validation plots for the Xception model demonstrate its excellent performance and efficient convergence during the classification task. In the accuracy plot, both the training and validation accuracy improve consistently over the epochs, reaching nearly 99% by the end. The validation accuracy starts high and stabilizes, indicating that the model generalizes well without signs of overfitting. The alignment between the training and validation accuracy curves further highlights the model’s robustness and stability during training. In the loss plot, both training and validation losses decrease steadily, with the validation loss showing minimal fluctuations. The low and stable validation loss toward the final epochs suggests that the model’s predictions are highly reliable, and the minimal gap between training and validation loss confirms that the model avoids overfitting.
DenseNet also achieved an accuracy of 99% and performed nearly as well as Xception, with a macro-averaged F1-score of 0.99. However, it showed a marginally lower performance in the scab_apple category, with an F1-score of 0.98.
ResNet followed closely with an accuracy of 97% and a macro-averaged F1-score of 0.97. It performed exceptionally well across all classes, achieving F1-scores of 0.98 for both rot_apple and scab_apple. Despite its strong results, it was slightly outperformed by Xception and DenseNet in overall classification metrics.
Inception-ResNet achieved an accuracy of 91%, with a macro-averaged F1-score of 0.91. It excelled in classifying rot_apple (F1-score = 0.97) and normal_apple (F1-score = 0.91) but struggled slightly with blotch_apple (F1-score = 0.90).
The Inception model achieved an accuracy of 89% and a macro-averaged F1-score of 0.89. It displayed consistent classification performance across all classes, although its metrics were slightly lower than Inception-ResNet.
NASNet achieved an accuracy of 83% and a macro-averaged F1-score of 0.83. While it maintained consistent metrics across classes, it particularly struggled with blotch_apple, achieving its lowest F1-score (0.77) among all classes.
The EfficientNet and MobileNet models showed considerable limitations in leaf disease classification, with accuracies of 30% and 47%, respectively. EfficientNet achieved a macro-averaged F1-score of 0.23, with significant difficulties in all categories except scab_apple (F1-score = 0.39). MobileNet achieved a macro-averaged F1-score of 0.37, performing moderately for normal_apple (F1-score = 0.67) but showing poor performance in other classes.
In conclusion, the Xception model emerged as the top performer for apple leaf disease classification, achieving 99% accuracy and delivering strong results across all categories. DenseNet also achieved 99% accuracy but fell slightly behind in scab_apple classification. ResNet performed well with 97% accuracy, while Inception-ResNet (91%) and Inception (89%) provided reliable but less competitive results. NASNet faced challenges with 83% accuracy, and both EfficientNet (30%) and MobileNet (47%) showed significant limitations in their performance.
4. Discussion
The experiments that were conducted reflected stark evidence of a noticeable difference in the classification accuracy when apple leaf diseases were juxtaposed with apple fruit diseases. One of the causative factors for this disparity in performance that was prominent was the huge disparity in the sizes of the training and testing datasets utilized. Specifically, the dataset of images of apple leaf diseases accounted for a total of 12,000 images, forming a solid and robust foundation for effective learning and feature extraction processes. This is in stark contrast with the dataset of apple fruit diseases, which comprised a meager 502 images, and by extension, greatly limited its strength and efficacy in comparison to the former. A larger dataset usually supports more generalization and more stable training, which is important in the success of machine learning models. Further, the difference in dataset size points to the need for both data quantity and quality when working with deep learning applications. Even when the fruit dataset had images of increased resolution, its small size may not have been diverse enough for the models to learn and perform best. This situation emphasizes the necessity for representative and diverse data in an attempt to achieve optimal results in the performance and training of such models.
The difference in performance that is observed is perhaps not necessarily a result of the sizes of the datasets employed, since there are many other factors that may also play a crucial role in causing this difference. For example, variations in image quality can be very important, as well as the varied sources from which the data are drawn. In particular, the dataset of apple fruit diseases consisted of images that were downloaded from various locations on the internet, and these might have caused some variations relative to the original images of actual apple leaves one would see in nature.
The choice of architecture was a determining factor in the overall results achieved in the study. Deeper and more complex models, i.e., Xception and DenseNet, recorded very impressive results when it came to the classification of leaf diseases. Their performance could be explained by their highly advanced feature extraction abilities, which enabled them to find and uncover complex patterns inherent in the data. Lightweight models like MobileNet and EfficientNet, on the other hand, struggled to record similar results, particularly with regard to the fruit dataset. This was very apparent given the fact that there was limited data, and thus they might have been prevented from learning efficiently. This observation is a strong indication of the paramount need to achieve a balanced harmony in the model’s complexity in relation to the nature of the dataset, as well as the particular needs of the problem being tackled.
In addition, this specific finding has completely established the supreme significance of achieving a balance between computation and data in deployment and training models. While models like MobileNet are computation-friendly lightweight models and therefore highly deployable on mobile hardware, they fared poorly when it came to achieving accuracy in this specific research study, especially on the fruit dataset used for the evaluation. On the other hand, deeper models, although they achieve greater accuracy levels, have the inherent characteristic of requiring many more computational resources to effectively and efficiently operate.
Additionally, the augmentation strategies took on a central and pivotal role to improve the performance of the models by significantly diversifying the dataset while at the same time eliminating the overfitting risks. Such strategies allow the models to generalize better to unseen data, which is essential for overall success. Random trans-formations like flips, rotations, and shifts strengthened the training process by introducing variability, which made the models robust. Considering the limited size of the fruit dataset, methods like Generative Adversarial Networks (GANs) offer an effective way for further improvement. GANs can generate realistic and diverse synthetic images, class imbalance can be overcome, and the dataset can be improved. This would especially be of beneficial value to the fruit classification task, which, as it was, was significantly prevented by the data availability constraints.
Table 9 presents key datasets frequently used in research on detecting diseases in apple leaves, pointing out their sources, sizes, covered diseases, and significant studies.
Table 9.
Summary of Datasets Used in Detecting Apple Leaf Diseases.
The originality of this study is in having created an operational, real-time web-based artificial intelligence system using Gradio, thereby providing an applicability higher than theoretical analysis documented in existing literature. As opposed to existing work that mainly deals with static datasets and performance comparison, this study addresses the data constraints through augmentation techniques and proposes using Generative Adversarial Networks (GANs) to balance the small fruit dataset. It benchmarks both lightweight models (MobileNet, EfficientNet) and deep models (Xception, ResNet152V2) and identifies optimal trade-offs between accuracy and computational overhead, making it suitable for mobile and resource-constrained deployments. Moreover, the incorporation of explainability methods, including activation maps and XRAI, enhances transparency in model decision-making, a valuable aspect that is missing in most traditional research. Through the development of a scalable system that can be implemented on mobile devices, drones, and IoT-based field monitoring systems, this study fills the gap between experimental AI research and practical agricultural use, thereby making a novel contribution to precision agriculture.
5. Conclusions
This extensive study was able to present the effective and innovative use of sophisticated deep learning models that have been created for the particular purpose of classifying diseases that occur in apple fruits and their corresponding leaves with a high accuracy rate. Among the sophisticated models used, ResNet152V2 was the best and highest-performing model that was specifically created for classifying diseases that occur in apple fruits, with a high accuracy rate of 92%. Besides this, it was also very good at distinguishing and differentiating between various diseases, i.e., blotch, scab, and rot, which are prevalent diseases of apple fruits. Conversely, when it came to classifying diseases that occur in apple leaves, Xception performed an excellent job with a high accuracy rate of 99%, illustrating almost perfect reliability and consistency in identifying various leaf diseases. The results pinpoint and emphasize the highly significant and critical role that deep learning has to play in agricultural diagnosis. Model selection, data augmentation, and fine-tuning are fundamental practices at the core of achieving the high levels of classification accuracy that are at the center of this exercise.
The findings of this research provide a wealth of promising enhancements and myriad ways in which it may be explored for further research activity. By broadening the scope of this research to include other types of crops and varying agricultural environments, the scope for a significant expansion of its overall applicability is huge, thus providing solutions to a larger array of plant disease issues faced in varying environments. Moreover, incorporating Internet of Things (IoT) technologies into this system, i.e., connecting the app with field sensors and automated image acquisition systems, presents a great opportunity to facilitate real-time monitoring and rapid identification of diseases in agricultural environments, leading to enhanced disease control practices.
Further, exploring the different decision-making pathways of the models through visualizing the different activation patterns in combination with the feature maps can help greatly improve transparency and thus reliability. This amount of interpretability is important as it will enable researchers, as well as end-users, to have a proper understanding of what the model “sees” when it is performing its classification tasks. Through this understanding, the model’s decisions are well grounded in agriculturally useful features. This subsequently leads to stakeholder confidence and improves the model’s use on a large scale.
Author Contributions
S.A. helped in conceptualization, software, validation, writing—original draft, resources and data curation. P.D. and I.B. helped in methodology, writing—review and editing, supervision, funding acquisition, and formal analysis. All authors have read and agreed to the published version of the manuscript.
Funding
This research received no external funding.
Data Availability Statement
All the datasets used in experimentation are available online on the internet.
Conflicts of Interest
Authors Pinar Demircioglu and Ismail Bogrekci have a cooperation with Alpler R&D Center and Alprobotics in consultancy services. The remaining author declares that the research was conducted in the absence of any commercial or financial relationships that could be construed as a potential conflict of interest.
References
- Gong, X.; Zhang, S. A High-Precision Detection Method of Apple Leaf Diseases Using Improved Faster R-CNN. Agriculture 2023, 13, 240. [Google Scholar] [CrossRef]
- Kannan, E.; Carmel Mary Belinda, M.J.; Alex David, S.; Ruth Naveena, N.; Begum, A.; Hemalatha, D. Deep Learning Techniques Advancements in Apple Leaf Disease Detection. Procedia Comput. Sci. 2024, 235, 713–722. [Google Scholar] [CrossRef]
- Li, Y.; Yang, Z.; Wang, W.; Wang, X.; Zhang, C.; Dong, J.; Bai, M.; Hui, T. Research Progress of Rapid Non-Destructive Detection Technology in the Field of Apple Mold Heart Disease. Molecules 2023, 28, 7966. [Google Scholar] [CrossRef] [PubMed]
- Aksoy, S.; Demircioglu, P.; Bogrekci, I. Evaluating Pre-Trained CNNs for Distinguishing Fresh vs Rotten Fruits and Vegetables. JAH 2024, 26, 361–366. [Google Scholar] [CrossRef]
- Hlaing, C.S.; Maung Zaw, S.M. Tomato Plant Diseases Classification Using Statistical Texture Feature and Color Feature. In Proceedings of the 2018 IEEE/ACIS 17th International Conference on Computer and Information Science (ICIS), Singapore, 6–8 June 2018; pp. 439–444. [Google Scholar]
- Shrivastava, V.K.; Pradhan, M.K. Rice Plant Disease Classification Using Color Features: A Machine Learning Paradigm. J. Plant Pathol. 2021, 103, 17–26. [Google Scholar] [CrossRef]
- Yang, N.; Qian, Y.; EL-Mesery, H.S.; Zhang, R.; Wang, A.; Tang, J. Rapid Detection of Rice Disease Using Microscopy Image Identification Based on the Synergistic Judgment of Texture and Shape Features and Decision Tree–Confusion Matrix Method. J. Sci. Food Agric. 2019, 99, 6589–6600. [Google Scholar] [CrossRef]
- Chen, J.; Yin, H.; Zhang, D. A Self-Adaptive Classification Method for Plant Disease Detection Using GMDH-Logistic Model. Sustain. Comput. Inform. Syst. 2020, 28, 100415. [Google Scholar] [CrossRef]
- Tian, Y.; Yang, G.; Wang, Z.; Li, E.; Liang, Z. Detection of Apple Lesions in Orchards Based on Deep Learning Methods of CycleGAN and YOLOV3-Dense. J. Sens. 2019, 2019, 1–13. [Google Scholar] [CrossRef]
- Bleasdale, A.J.; Whyatt, J.D. Classifying Early Apple Scab Infections in Multispectral Imagery Using Convolutional Neural Networks. Artif. Intell. Agric. 2025, 15, 39–51. [Google Scholar] [CrossRef]
- Santoso, C.B. Enhancing Apple Leaf Disease Detection with Deep Learning: From Model Training to Android App Integration. J. Appl. Data Sci. 2024, 6, 377–390. [Google Scholar] [CrossRef]
- Maheswaran, S.; Indhumathi, N.; Dhanalakshmi, S.; Nandita, S.; Mohammed Shafiq, I.; Rithka, P. Identification and Classification of Groundnut Leaf Disease Using Convolutional Neural Network. In Computational Intelligence in Data Science; Kalinathan, L.R.P., Kanmani, M.S.M., Eds.; IFIP Advances in Information and Communication Technology; Springer International Publishing: Cham, Switzerland, 2022; Volume 654, pp. 251–270. ISBN 978-3-031-16363-0. [Google Scholar]
- Maheswaran, S.; Sathesh, S.; Rithika, P.; Shafiq, I.M.; Nandita, S.; Gomathi, R.D. Detection and Classification of Paddy Leaf Diseases Using Deep Learning (CNN). In Computer, Communication, and Signal Processing; Neuhold, E.J., Fernando, X., Lu, J., Piramuthu, S., Chandrabose, A., Eds.; IFIP Advances in Information and Communication Technology; Springer International Publishing: Cham, Switzerland, 2022; Volume 651, pp. 60–74. ISBN 978-3-031-11632-2. [Google Scholar]
- Selvaraj, M.G.; Vergara, A.; Ruiz, H.; Safari, N.; Elayabalan, S.; Ocimati, W.; Blomme, G. AI-Powered Banana Diseases and Pest Detection. Plant Methods 2019, 15, 92. [Google Scholar] [CrossRef]
- Rumpf, T.; Mahlein, A.-K.; Steiner, U.; Oerke, E.-C.; Dehne, H.-W.; Plümer, L. Early Detection and Classification of Plant Diseases with Support Vector Machines Based on Hyperspectral Reflectance. Comput. Electron. Agric. 2010, 74, 91–99. [Google Scholar] [CrossRef]
- Mohanty, S.P.; Hughes, D.P.; Salathé, M. Using Deep Learning for Image-Based Plant Disease Detection. Front. Plant Sci. 2016, 7, 1419. [Google Scholar] [CrossRef] [PubMed]
- Kerkech, M.; Hafiane, A.; Canals, R. Vine Disease Detection in UAV Multispectral Images Using Optimized Image Registration and Deep Learning Segmentation Approach. Comput. Electron. Agric. 2020, 174, 105446. [Google Scholar] [CrossRef]
- Chuanlei, Z.; Shanwen, Z.; Jucheng, Y.; Yancui, S.; Jia, C. Apple Leaf Disease Identification Using Genetic Algorithm and Correlation Based Feature Selection Method. Int. J. Agric. Biol. Eng. 2017, 10, 74–83. [Google Scholar]
- Jiang, P.; Chen, Y.; Liu, B.; He, D.; Liang, C. Real-Time Detection of Apple Leaf Diseases Using Deep Learning Approach Based on Improved Convolutional Neural Networks. IEEE Access 2019, 7, 59069–59080. [Google Scholar] [CrossRef]
- Liu, B.; Zhang, Y.; He, D.; Li, Y. Identification of Apple Leaf Diseases Based on Deep Convolutional Neural Networks. Symmetry 2017, 10, 11. [Google Scholar] [CrossRef]
- Bansal, P.; Kumar, R.; Kumar, S. Disease Detection in Apple Leaves Using Deep Convolutional Neural Network. Agriculture 2021, 11, 617. [Google Scholar] [CrossRef]
- Yu, H.-J.; Son, C.-H. Leaf Spot Attention Network for Apple Leaf Disease Identification. In Proceedings of the 2020 IEEE/CVF Conference on Computer Vision and Pattern Recognition Workshops (CVPRW), Seattle, WA, USA, 14–19 June 2020; pp. 229–237. [Google Scholar]
- Baranwal, S.; Khandelwal, S.; Arora, A. Deep Learning Convolutional Neural Network for Apple Leaves Disease Detection. In Proceedings of the International Conference on Sustainable Computing in Science, Technology and Management (SUSCOM), Jaipur, India, 26–28 February 2019. [Google Scholar] [CrossRef]
- Li, X.; Rai, L. Apple Leaf Disease Identification and Classification Using ResNet Models. In Proceedings of the 2020 IEEE 3rd International Conference on Electronic Information and Communication Technology (ICEICT), Shenzhen, China, 13 November 2020; pp. 738–742. [Google Scholar]
- Mahato, D.K.; Pundir, A.; Saxena, G.J. An Improved Deep Convolutional Neural Network for Image-Based Apple Plant Leaf Disease Detection and Identification. J. Inst. Eng. India Ser. A 2022, 103, 975–987. [Google Scholar] [CrossRef]
- Nachtigall, L.G.; Araujo, R.M.; Nachtigall, G.R. Classification of Apple Tree Disorders Using Convolutional Neural Networks. In Proceedings of the 2016 IEEE 28th International Conference on Tools with Artificial Intelligence (ICTAI), San Jose, CA, USA, 6–8 November 2016; pp. 472–476. [Google Scholar]
- Singh, S.; Gupta, S. Apple Scab and Marsonina Coronaria Diseases Detection in Apple Leaves Using Machine Learning. Int. J. Pure Appl. Math. 2018, 118, 1151–1166. [Google Scholar]
- Banarase, S.; Shirbahadurkar, S. The Orchard Guard: Deep Learning Powered Apple Leaf Disease Detection with MobileNetV2 Model. JIST 2024, 12, 799. [Google Scholar] [CrossRef]
- Li, F.; Zheng, Y.; Liu, S.; Sun, F.; Bai, H. A Multi-Objective Apple Leaf Disease Detection Algorithm Based on Improved TPH-YOLOV5. Appl. Fruit. Sci. 2024, 66, 399–415. [Google Scholar] [CrossRef]
- Li, T.; Zhu, W.; Che, X. Design and Implementation of Apple Leaf Disease Recognition System Based on ResNet50. JCEIM 2024, 12, 96–104. [Google Scholar] [CrossRef]
- Yu, H.-J.; Son, C.-H. Apple Leaf Disease Identification through Region-of-Interest-Aware Deep Convolutional Neural Network. arXiv 2019. [Google Scholar] [CrossRef]
- Yan, Q.; Yang, B.; Wang, W.; Wang, B.; Chen, P.; Zhang, J. Apple Leaf Diseases Recognition Based on An Improved Convolutional Neural Network. Sensors 2020, 20, 3535. [Google Scholar] [CrossRef]
- Chao, X.; Hu, X.; Feng, J.; Zhang, Z.; Wang, M.; He, D. Construction of Apple Leaf Diseases Identification Networks Based on Xception Fused by SE Module. Appl. Sci. 2021, 11, 4614. [Google Scholar] [CrossRef]


Disclaimer/Publisher’s Note: The statements, opinions and data contained in all publications are solely those of the individual author(s) and contributor(s) and not of MDPI and/or the editor(s). MDPI and/or the editor(s) disclaim responsibility for any injury to people or property resulting from any ideas, methods, instructions or products referred to in the content. |
© 2025 by the authors. Licensee MDPI, Basel, Switzerland. This article is an open access article distributed under the terms and conditions of the Creative Commons Attribution (CC BY) license (https://creativecommons.org/licenses/by/4.0/).