Article

Estimating Field-Scale Soil Organic Matter in Agricultural Soils Using UAV Hyperspectral Imagery

1
College of Resources and Environment, Jilin Agricultural University, Changchun 130118, China
2
Key Laboratory of Soil Resource Sustainable Utilization for Jilin Province Commodity Grain Bases, Jilin Agricultural University, Changchun 130118, China
3
Key Laboratory of Straw Comprehensive Utilization and Black Soil Conservation, Ministry of Education, Changchun 130118, China
*
Author to whom correspondence should be addressed.
AgriEngineering 2025, 7(10), 339; https://doi.org/10.3390/agriengineering7100339
Submission received: 15 September 2025 / Revised: 3 October 2025 / Accepted: 7 October 2025 / Published: 10 October 2025
(This article belongs to the Section Remote Sensing in Agriculture)

Abstract

Fast and precise monitoring of soil organic matter (SOM) during maize growth periods is crucial for real-time assessment of soil quality. However, the big challenge we usually face is that many agricultural soils are covered by crops or snow, and the bare soil period is short, which makes reliable SOM prediction complex and difficult. In this study, an unmanned aerial vehicle (UAV) was utilized to acquire multi-temporal hyperspectral images of maize across the key growth stages at the field scale. The auxiliary predictors, such as spectral indices (I), field management (F), plant characteristics (V), and soil properties (S), were also introduced. We used stepwise multiple linear regression, partial least squares regression (PLSR), random forest (RF) regression, and XGBoost regression models for SOM prediction, and the results show the following: (1) Multi-temporal remote sensing information combined with multi-source predictors and their combinations can accurately estimate SOM content across the key growth periods. The best-fitting model depended on the types of models and predictors selected. With the I + F + V + S predictor combination, the best SOM prediction was achieved by using the XGBoost model (R2 = 0.72, RMSE = 0.27%, nRMSE = 0.16%) in the R3 stage. (2) The relative importance of soil properties, spectral indices, plant characteristics, and field management was 55.36%, 26.09%, 9.69%, and 8.86%, respectively, for the multiple periods combination. Here, this approach can overcome the impact of the crop cover condition by using multi-temporal UAV hyperspectral images combined with valuable auxiliary variables. This study can also improve the field-scale farmland soil properties assessment and mapping accuracy, which will aid in soil carbon sequestration and soil management.

1. Introduction

Soil organic matter (SOM) plays an important role in the soil–plant system. The black soil region of northeastern China is a dominant area for grain production and commercial grain supply. The annual output of spring maize accounts for more than 30% of China’s total output. Nevertheless, it is estimated that the annual loss of black soil thickness on sloping land ranges from 0.2 to 0.3 cm, and the soil depth has been reduced to 20 to 40 cm. Chinese agricultural systems are highly heterogeneous due to the complex topography, climate, and field management across the whole nation, especially in field-scale farmland [1,2]. Accurate estimation of field-scale SOM content is crucial for performing appropriate land management measures and promoting sustainable agriculture in the black soil region of northeastern China.
To obtain the SOM content, traditional methods mainly rely on field soil sampling and subsequent laboratory analyses, which are costly, time-consuming, and laborious [3]. Remote sensing (RS) technology can quickly obtain the spectral information of the above-ground surface. Nevertheless, SOM prediction using only RS data generally lacks environmental information from soil genesis (climate, biology, topography, parent material, and age) [4]. Recently, an increasing number of related studies have used the relationship between soil properties and readily available soil factors to improve SOM estimations in non-plain areas [5,6]. Some researchers have completed SOM maps in mountain and hilly areas by combining topographic, biological, or climatic factors [7]. However, in low-relief agricultural lands, weak or insignificant relationships of the traditional soil-forming factors with SOM are observed [7,8]. In addition, due to agricultural soils being mostly covered by crops or snow, with a limited period of bare soil, accurate SOM estimation remains a major challenge for agricultural soils in plains or small-scale areas.
Most previous studies were conducted on SOM estimation by using UAV imagery, especially on the bare soil condition [9,10]. As indicated in the literature, the ecological productivity of vegetation is a major driver of organic matter input to the soil, from which the SOM content is mostly derived, and the distribution of the SOM content is closely related to vegetation indices (VIs) extracted from RS images [11]. Because the changes in soil conditions will lead to vegetation growth differences, multi-temporal UAV images can record the changes in vegetation canopy during the growth process [12,13]. As the physiological growth of maize progresses, it can inhibit or accelerate the decomposition of SOM. Therefore, it is possible to monitor soil properties indirectly by using VIs obtained from vegetation canopy spectral data [8,14]. The hyperspectral data usually contain hundreds of narrow spectral bands, which are characterized by a large data volume. Numerous narrowband VIs derived from the hyperspectral data, such as the Green Chlorophyll Index (CIgreen), Red-edge Chlorophyll Index (CIred-edge), and Optimized Soil Adjusted Vegetation Index (OSAVI), were widely used in the prediction for the crop LAI (leaf area index), chlorophyll content, nitrogen content, biomass, and yield [15,16,17]. Although VIs can enhance the crop growth characteristics by transforming two or more bands and reflect soil nutrients indirectly, few studies have been conducted on SOM estimation by using the narrowband VIs from UAV hyperspectral imagery. If SOM can be estimated using multi-temporal narrowband VIs from several main growing stages during the maize growth period, this will lead to a new approach for SOM estimations in agricultural soils.
Farm management measures, including tillage, fertilization, and carbon input, greatly impact agricultural soils but have rarely been considered in SOM estimation, especially in field-scale farmland. For example, Wang [18] found that the accuracy of SOM prediction was improved by 16.67% and 17.75% for the coefficient of determination (R2) and the root mean squared error (RMSE), respectively, by adding crop management practices as the predictors for SOM. Meanwhile, plant traits, such as plant height, LAI, and biomass, can also inform soil carbon dynamics [19]. However, whether the integration of plant traits into the SOM prediction process can improve the prediction accuracy is still unclear.
Considering the possible nonlinear relationship between SOM and multivariate auxiliary variables, traditional regression models, such as stepwise multiple linear regression (SMLR) and partial least squares regression (PLSR), may not be the best choice for estimating SOM content. With the development of artificial intelligence and big data mining, the nonlinear relationships between SOM and various predictors can be addressed by using a range of machine learning (ML) techniques, such as tree-based learners, artificial neural networks (ANNs), support vector machines (SVMs), and random forests (RFs), which can conduct the complex nonlinear relationships between soil properties and auxiliary variables. For example, Mahmoudzadeh [20] compared the performances of five ML models in the spatial prediction of soil organic carbon and found that RF performed better than the other four models (R2 = 0.60, RMSE = 0.35%). Ge [21] found that XGBoost was superior to the RF model in estimating soil moisture content (R2 = 0.93, RMSE = 1.943%).
This study selected a maize field under the long-term experiments since 2010 in Sankeshu Village of the black soil region as the study area. The aims of this study were (i) to compare the results of multi-temporal RS information with multi-source auxiliary predictors for SOM prediction to determine the most suitable predictor combination; (ii) to obtain the best estimation method (SMLR, PLSR, RF, or XGBoost) that can estimate SOM more accurately; and (iii) to determine the contribution of narrowband VIs, farm management, plant traits, and soil properties for SOM estimation.

2. Materials and Methods

2.1. Study Area and Field Experiments

The study area (43°20′17.4″ N, 124°0′29.1″ E) was located in Sankeshu Village of northeastern China (Figure 1). The climate is semi-humid temperate with continental monsoons and has four distinct seasons. Black soil is the main soil type (viscosified humid soil) according to the United States Department of Agriculture Soil Taxonomy system. As a typical rainfed agricultural area, the annual mean temperature was 20.4 °C, and the precipitation was 558 mm during the maize growth stages in 2019–2020. The frost-free season was 155 days [22].
As Figure 1 shows, the experimental field is used for a long-term fertilizer experiment that has been carried out since 2010. The experiments included two tillage modes: traditional tillage and strip tillage with straw mulching. The planting density was 62,000 plants ha−1. Three fertilization treatments were included under each tillage method, namely, a nitrogen (N) gradient, phosphorus (P) gradient, and potassium (K) gradient, and each treatment was arranged as sub-plots with four replications. The fertilizer application was a single application before sowing. Each plot was given a single type of fertilizer, namely, N, P, or K fertilizer, with a certain application amount. N fertilizer was given as urea (46% N), and 5 fertilizer rates were set as N1: 0, N2: 60, N3: 120, N4: 180, and N5: 240 kg ha−1; P fertilizer was given as calcium superphosphate (18% P2O5), with 5 fertilizer rates of P1: 0, P2: 25, P3: 50, P4: 75, and P5: 100 kg ha−1; K fertilizer was given as potassium chloride (50% K2O), with 5 fertilizer rates of K1: 0, K2: 30, K3: 60, K4: 90, and K5: 120 kg ha−1. There were a total of 120 test plots and the plot area was 133 m2 (plot size of 19 × 7 m2).

2.2. Soil Samples and Chemical Analysis

Various VIs can be used to capture the crop growth status and reflect soil nutrients indirectly; thus, multi-temporal VIs were employed across different growth stages during the growing season. As Ritchie [24] indicates, the 6-leaf collar stage (V6), silking stage (R1), and maturity stage (R3) of maize are three key stages for maize growth; therefore, 120 topsoil (0–20 cm) samples were collected at each of the three stages in 2019–2020, which kept in step with the collection of VIs. Five sub-samples, which were thoroughly sampled from the four corners and the center of a 1 m2 grid, were mixed into one soil sample. Overall, 720 samples were collected at different growth stages of maize in 2019–2020. Before the chemical analyses, all samples were air-dried in a laboratory (20–25 °C) and passed through a 2 mm soil sieve. Then, the potassium dichromate (K2Cr2O7) heating method was selected to determine the SOM content, and the excess K2Cr2O7 was determined by standard ferrous sulfate titration. Soil total nitrogen (TN) content was determined by using the Kjeldahl method, and the pH content was determined using a pH meter.

2.3. Acquisition of UAV Hyperspectral Imagery

UAV images were collected from 10 a.m. to 15 p.m. Beijing time (solar height angle was greater than 45°) on 25 June, 5 August, and 28 September 2019, and on 28 June, 14 August, and 25 September 2020. A DJI Matrice 600 Pro UAV with six propellers was selected as the sensor platform. The UHD 185 sensor (Cubert GmbH Company, Ulm, Germany) was used to acquire hyperspectral images. The hyperspectral sensor has a spectral range of 454–950 nm with a band interval of 4 nm for a total of 125 bands. Before UAV take-off, flight line setting and whiteboard correction were carried out. The flight survey was conducted at a flight altitude of 120 m, corresponding to a spatial resolution of 5 cm.
To obtain the hyperspectral image of the whole field, a series of processing steps, including photo alignment, building dense point clouds, building mesh, building texture, and building orthomosaic, were applied. Image stitching was completed using Pix4D Mapper Version 1.81.1 (Prilly, Switzerland) software, followed by radiometric calibration, which used a 1.5 × 1.5 m whiteboard as a reference. The atmospheric correction of the hyperspectral images was applied using the Fast Line-of-Site Atmospheric Analysis of Spectral Hypercubes (FLAASH) module of ENVI 5.5 software (Exelis Visual Information Solutions, Boulder, CO, USA). Then, geographic registration was carried out using prearranged control points, which were selected from the RGB orthoimage of the UAV. Geometric correction was applied using affine transformations defined by the least-squares registration characterization in ArcGIS 10.6 (ESRI, Inc., Redlands, CA, USA), and the root mean square error (RMSE) was smaller than 0.5 pixels for each control point. The detailed description of atmospheric and geometric corrections of hyperspectral images can be found in [22].

2.4. The Predictors for SOM

Thirty-three spectral indices were selected according to SOM response bands, which showed good correlations with the SOM content. These indices were derived from the visible to near-infrared spectral range, and their formulas are given in Supplementary Table S1. Since farm management (e.g., fertilization, tillage, and irrigation) has a profound impact on the spatial variation in SOC, and the plant characteristics (e.g., crop height and biomass) can also reflect soil nutrient indirectly, in addition to the vegetation indices (I) derived from multi-temporal hyperspectral imagery, three other types of auxiliary variables (farm management, plant characteristics, and soil properties) were selected as predictors for SOM estimation. The farm management measures (F) included tillage methods (F-tillage) and the fertilizer rates of nitrogen (F-N), phosphorus (F-P), and potassium (F-K). The plant characteristics (V) included the crop height (V-H), dry weight (V-dry), fresh weight (V-fresh), SPAD values (V-SPAD), and leaf nitrogen content (V-TN). The soil properties included soil total nitrogen (S-TN) and soil pH (S-pH). Although N and P fertilizers may affect SOM more than K fertilizer does, the interaction between NPK fertilizer and organic matter also exists. Pearson correlation analysis was utilized to reflect the correlation between SOM and different auxiliary factors.

2.5. SOM Prediction Models

To compare the model performances at different growth stages, four datasets—the V6 stage (240 samples), R1 stage (240 samples), R3 stage (240 samples), and all three stage combinations (720 samples) during 2019–2020—were developed. Each of the datasets was divided into calibration and validation datasets, with a split ratio of 7:3. Then, four regression modeling methods—SMLR, PLSR, RF, and XGBoost—were utilized to construct SOM estimation models across different growth stages.

2.5.1. Stepwise Multiple Linear Regression

SMLR has been widely used in the field of spectral analysis and can dynamically introduce candidate independent variables into regression models one by one. The introduced variables are selected by their variance contribution, and the previously removed variables can be re-selected when the new variables become significant after the introduction. Until there are no variables that can be reintroduced or deleted, only the important variables are retained in the regression equation.

2.5.2. Partial Least Squares Regression

PLSR is a representative model of classic descending dimension methods. It has been widely used in the field of hyperspectral inversion. PLSR combines principal component analysis, canonical correlation analysis, and multiple linear regression analysis techniques, which can solve the problem of multicollinearity well.

2.5.3. RF Regression

The RF model is an integrated learning algorithm obtained by combining bagging with the decision tree algorithm, which has been successfully applied to the remote sensing estimation of SOM content by several scholars in recent years [3]. The RF regression model can effectively avoid the overfitting phenomenon in model training and effectively suppress the negative impact of noise. The RF algorithm can process high-dimensional information features and can perform statistical analysis according to importance, which is conducive to the comprehensive utilization of hyperspectral features of ground objects [10].

2.5.4. XGBoost Regression

XGBoost is a flexible and highly scalable tree structure enhancement model that can process sparse data, greatly improve the algorithm speed, and reduce computational memory during very large data training. It is an improvement of the boosting algorithm based on the gradient boosting decision tree (GBDT), which is composed of multiple decision tree iterations. The basic idea is as follows: First, multiple CART (classification and regression trees) models are constructed to predict the dataset, and then, these trees are integrated into a new tree model. Through continuous iterative improvement, the new tree model generated by each iteration will fit the residual of the previous tree. Until approaching the complexity of the data, the best training effect can be achieved.
In ML methods, the contributions of different predictors can be expressed regarding their relative importance. To obtain the contributions from SOM predictors, the contributions of the predictors were obtained using %IncMSE and IncNodePurity, which were performed in R 4.1. The relevant formula is as follows:
w i = 0.5 × A i / i = 1 n A i + 0.5 × B i / i = 1 n B i
where wi is the predicted value; Ai and Bi are %IncMSE and IncNodePurity of the variables, respectively; and n is the number of validation samples. %IncMSE represents the square mean of error rate of increase; that is, after removing this variable, the accuracy of target prediction decreases, which can be considered as the contribution to the target variable prediction accuracy. IncNodePurity represents the influence of each variable on the heterogeneity of observed values at each node of the classification tree to compare the importance of the variables; the greater the value is, the greater the importance of the variable.
Finally, the prediction accuracies of the above four models were evaluated using the determination coefficient (R2), root mean squared error (RMSE), and normalized root mean squared error (nRMSE). A higher R2 and lower RMSE and nRMSE for the model indicate a stronger SOM estimation performance. Their formulas are as follows:
R 2 = 1 i = 1 n X i Y i 2 i = 1 n X i X ¯ 2
R M S E = i = 1 n X i Y i 2 n
n R M S E = i = 1 n X i Y i 2 / n X ¯ × 100 %
where X i and Y i are the measured and estimated SOM, respectively; X ¯ is the averaged measured SOM values; and n represents the number of samples.

3. Results

3.1. Descriptions of Sampling Data

As Table 1 shows, SOM measurements of maize ranged from 1.93% to over 4.77%, with standard deviations (SDs) and mean values of 0.48% and 3.02%, respectively. Across all the growth stages in 2019 and 2020, similarities between the whole, calibration, and validation datasets suggested that the division of calibrated and validated datasets was representative. At the R1 stage, the coefficient of variation (CV) for the whole, calibration, and validation datasets was larger than that of the other growth stages, which were 0.36%, 0.35%, and 0.39%, respectively. Compared with the SOM data collected from other studies [25,26], which ranged from 1.10% to 3.54%, our SOM content was a little higher.

3.2. Correlation Between SOM and Hyperspectral Data

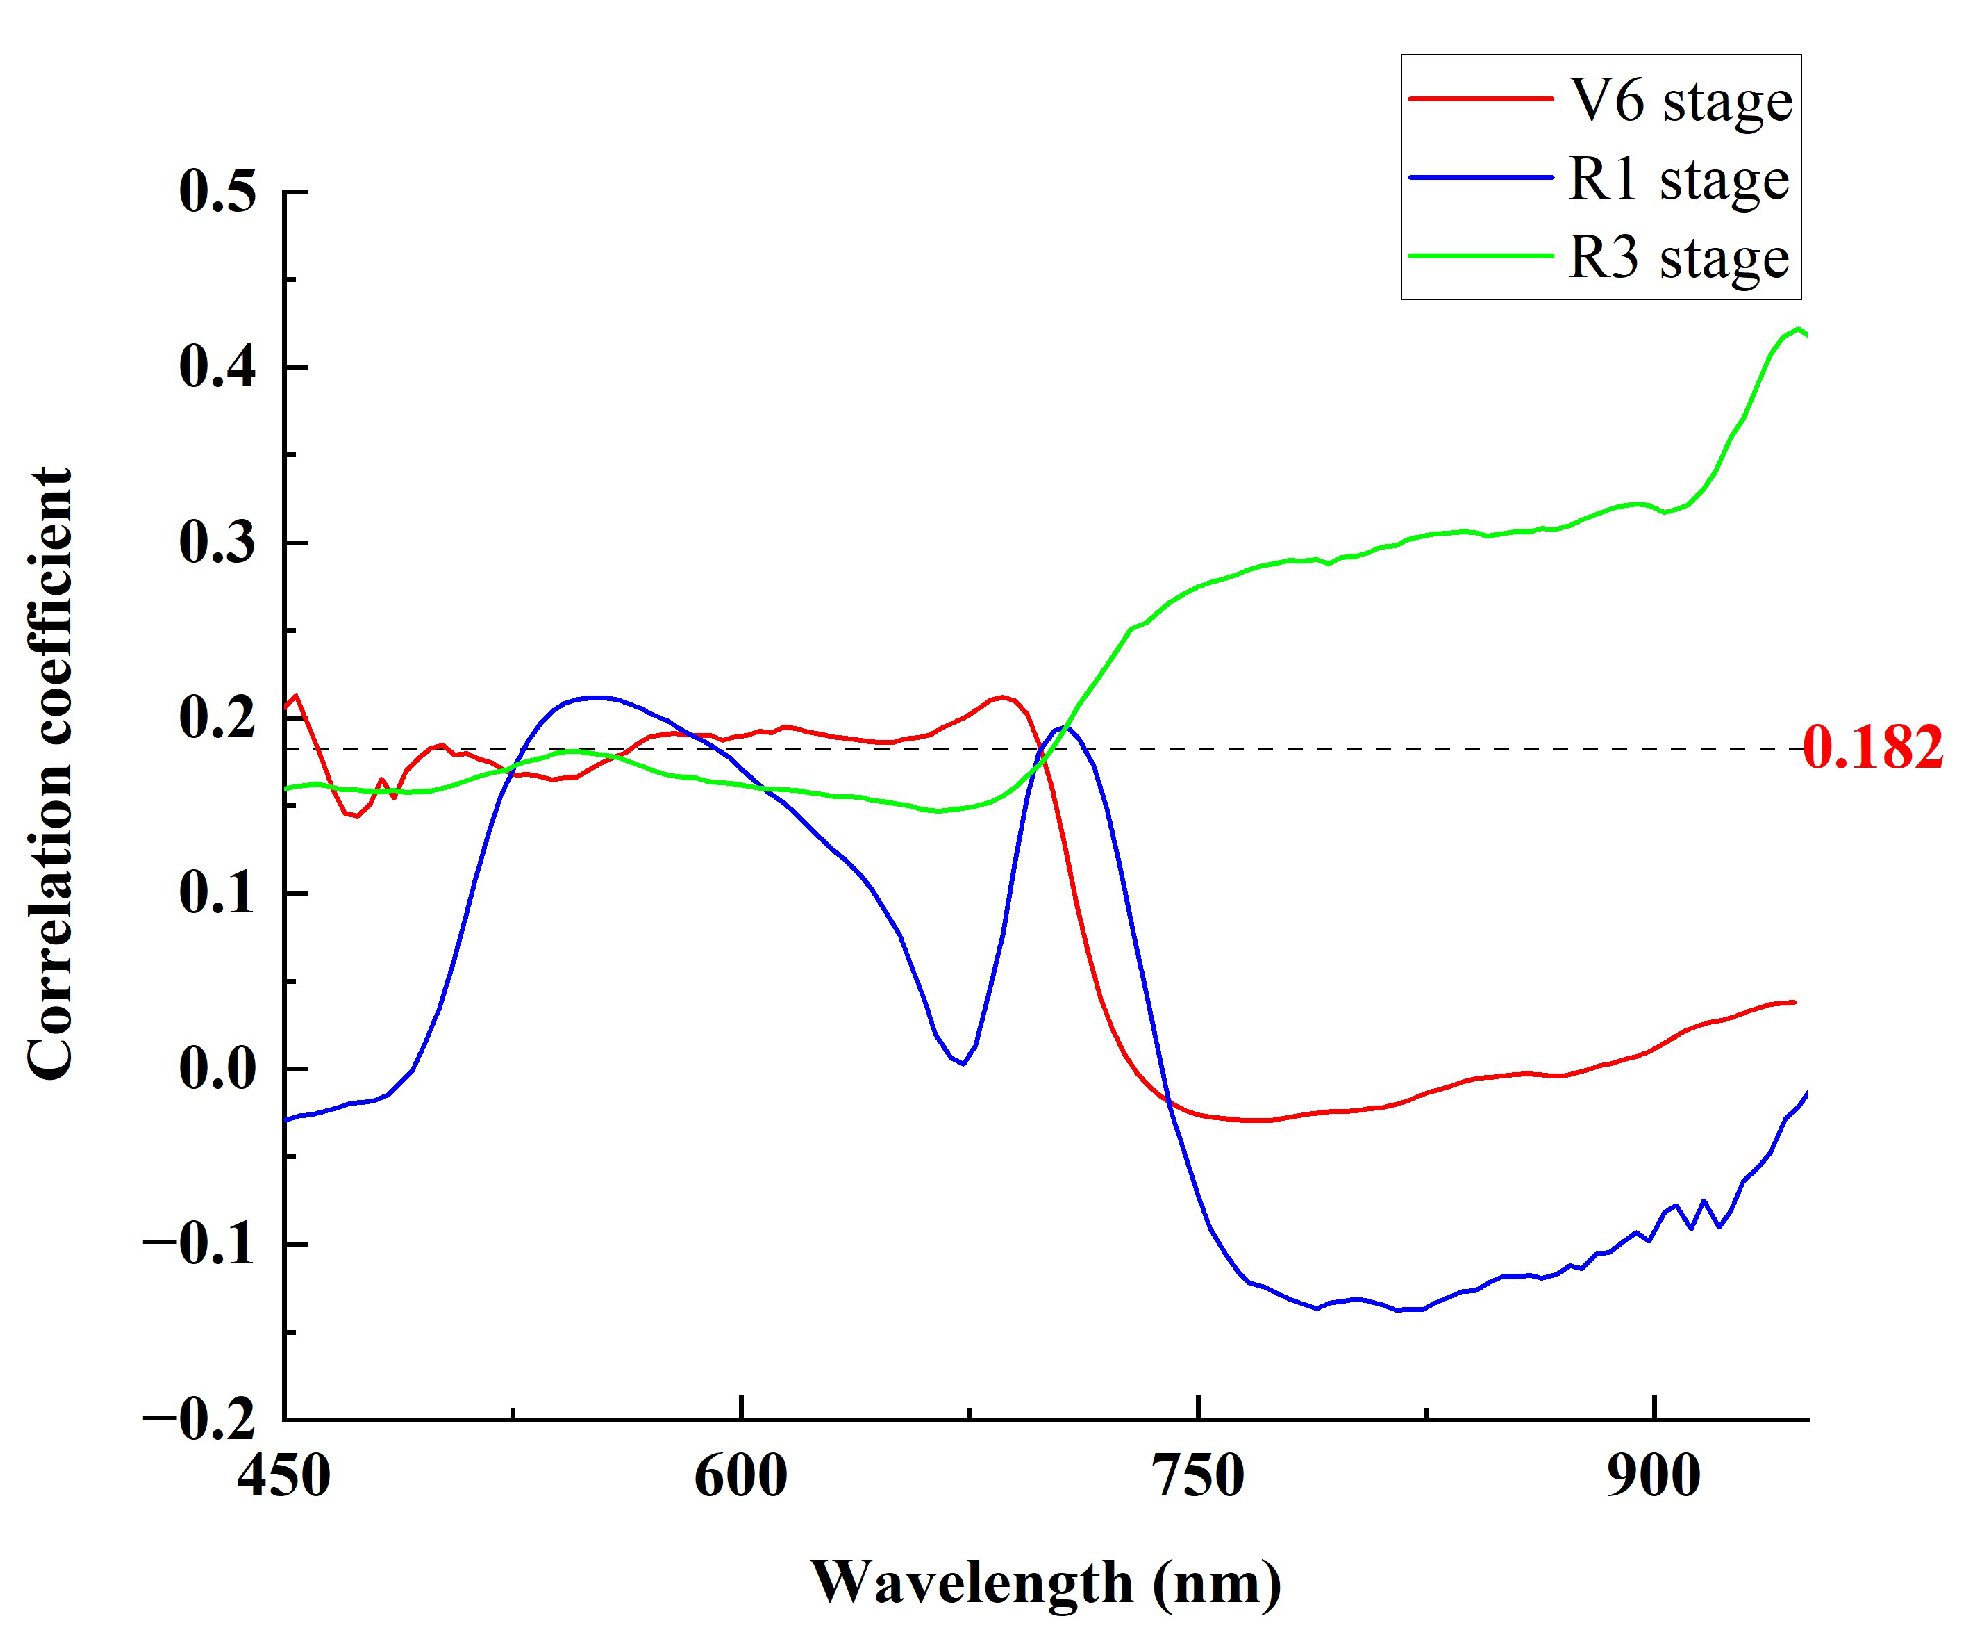
Pearson correlation analysis was conducted between the SOM and multi-temporal spectral data (Figure 2). From 570 to 700 nm, the V6 stage’s SOM had a high correlation with hyperspectral reflectance, and the correlation coefficient was the highest at 685 nm, which was 0.2118 (p < 0.05). The correlation between the SOM and reflectance values at the R1 stage was higher from 530 to 590 nm than at other wavelengths, and the correlation coefficient was the highest at 555 nm, which was 0.212 (p < 0.05). However, the correlation between SOM and hyperspectral reflectance at the R3 stage was higher in the near-infrared band, and the correlation coefficient reached a peak at 945 nm, which was 0.422 (p < 0.05).

3.3. Correlation Between SOM and Auxiliary Variables

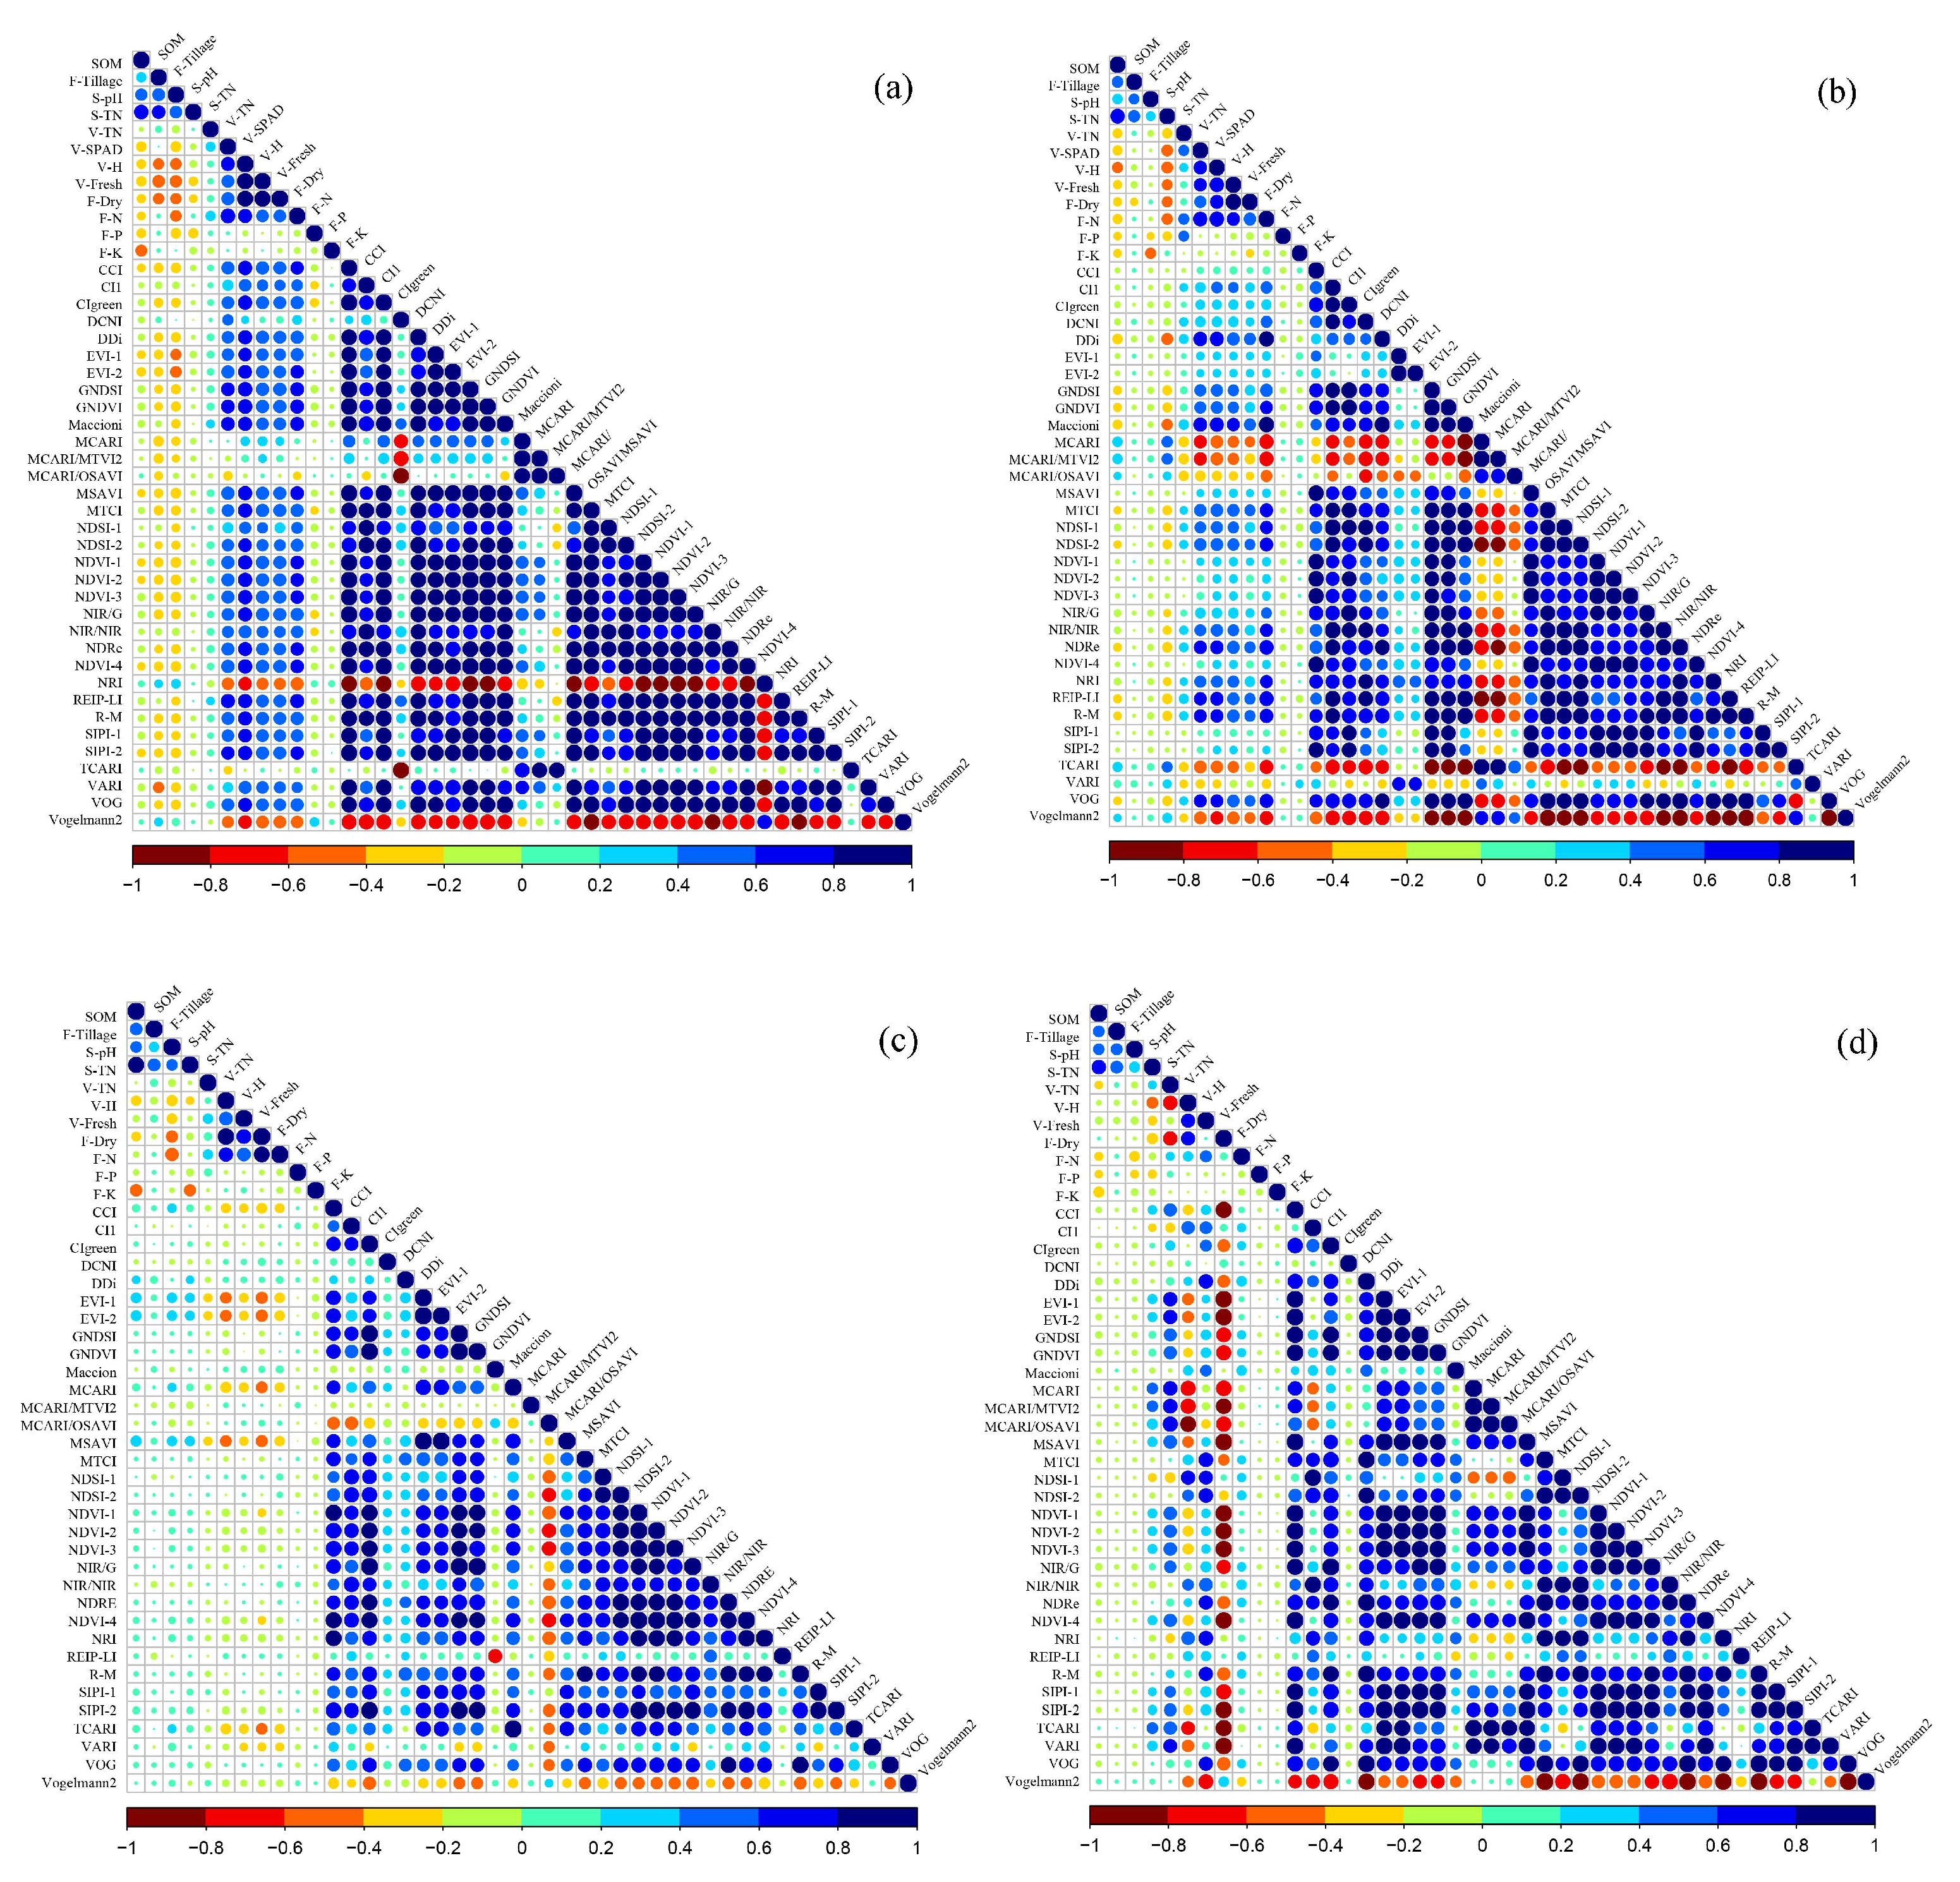
The correlation analysis results between these predictors and the SOM at each growth stage are shown in Figure 3.
An insignificant negative correlation was observed between SOM and fertilization at each stage, while a highly significant positive correlation was observed between the soil properties and SOM (Figure 3). Soil TN was most strongly correlated with SOM, with correlation coefficients of 0.71, 0.78, and 0.85 in the V6, R1, and R3 stages, respectively. The relationship between the dry and fresh aboveground biomasses of plants with SOM showed a significant negative correlation in the V6 and R3 stages. Most narrowband VIs showed a negative correlation with SOM, and the significance was weak across all the growth stages, except for the R1 stage.

3.4. Modeling and Comparison

The results show that the accuracies of the SOM estimation models with VIs were obviously lower than those of the models constructed with multiple source auxiliary variables (Table 2). In particular, the addition of farm management and soil properties significantly improved the model performance, while the addition of plant traits contributed little to the improvement of the model accuracy. Integrating the three predictor types with the basic spectral covariates could increase the SOM prediction accuracy by 45.95–84.72% regarding R2 and 14.29–38.10% regarding RMSE. Comparing the accuracies of all models, XGBoost had the best performance regarding SOM estimation, with the largest R2 value and the smallest RMSE (R2 = 0.72, RMSE = 0.27%, and nRMSE = 0.16%). In general, the SOM estimation model accuracy for agricultural soils can be significantly improved by adding appropriate auxiliary variables.
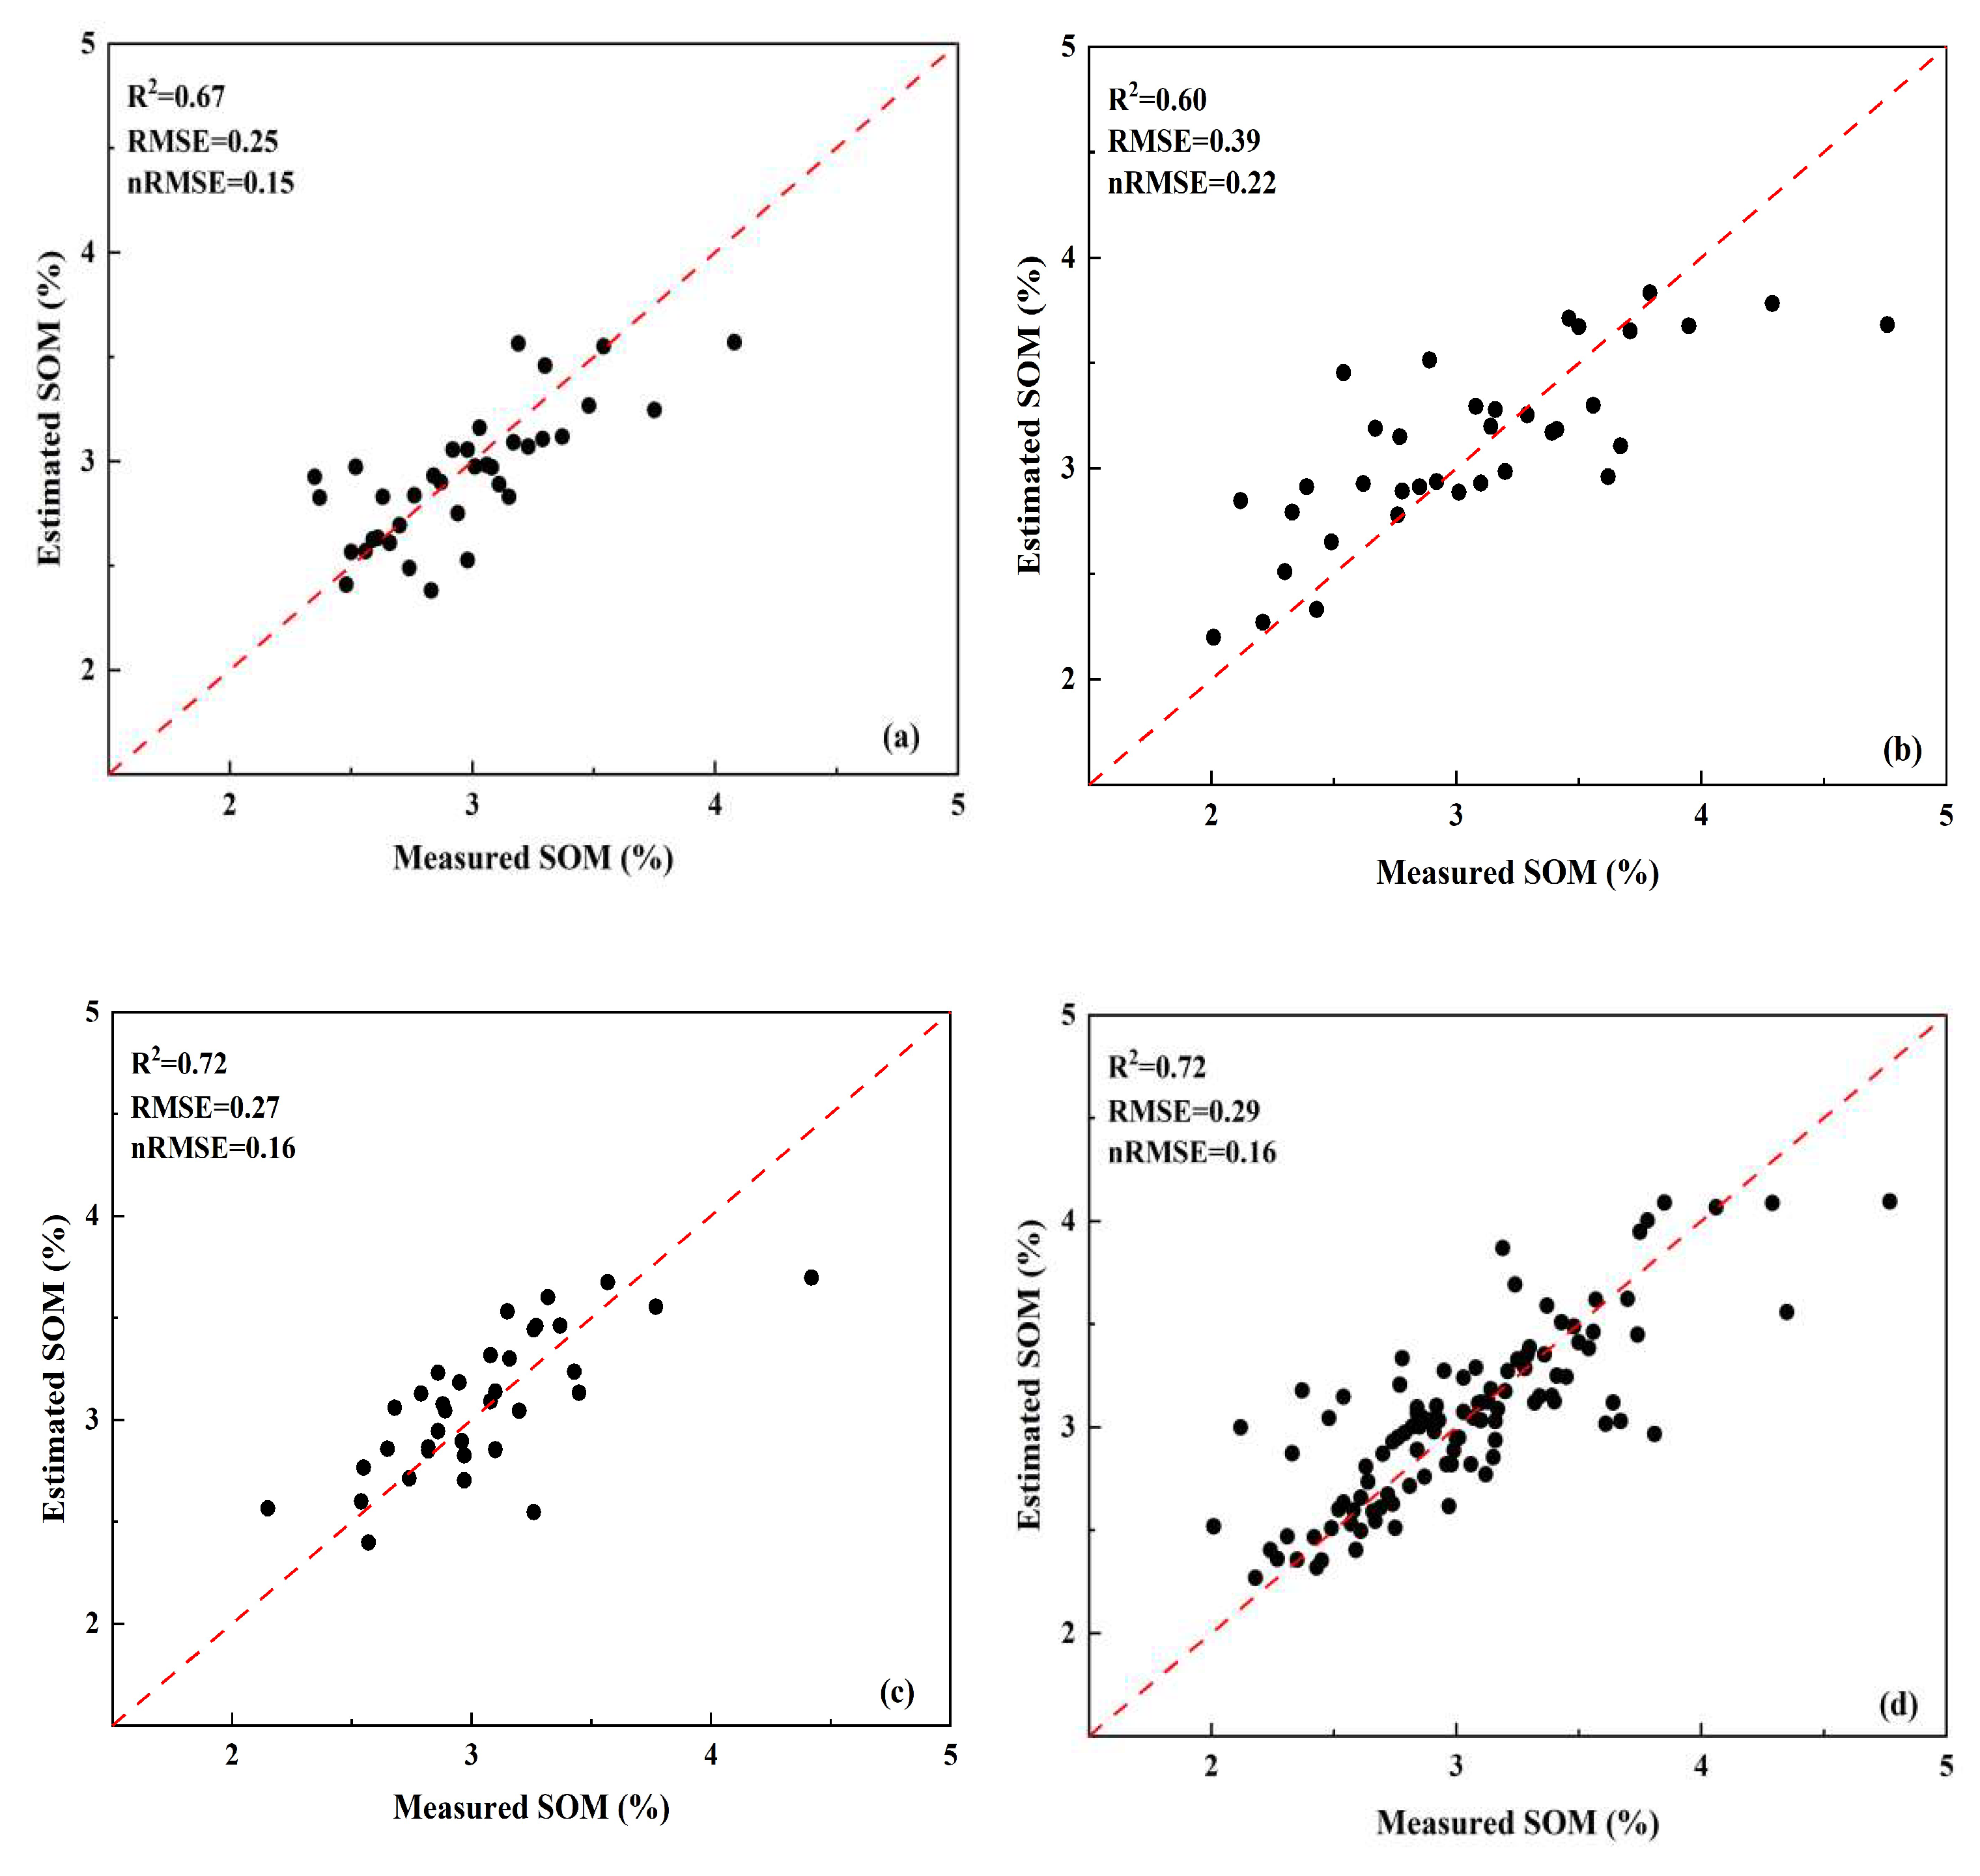
Although the XGBoost models had the highest accuracy, other models also achieved comparable results, making them viable alternatives. For example, the RF model with I + F + V + S had an R2 of 0.71 in the R3 stage, which was close to the XGBoost’s 0.72. Here, we illustrate only the SOM validation results from the XGBoost prediction models for the V6, R1, and R3 stages and multiple growth periods in Figure 4.

3.5. Importance of Auxiliary Variables

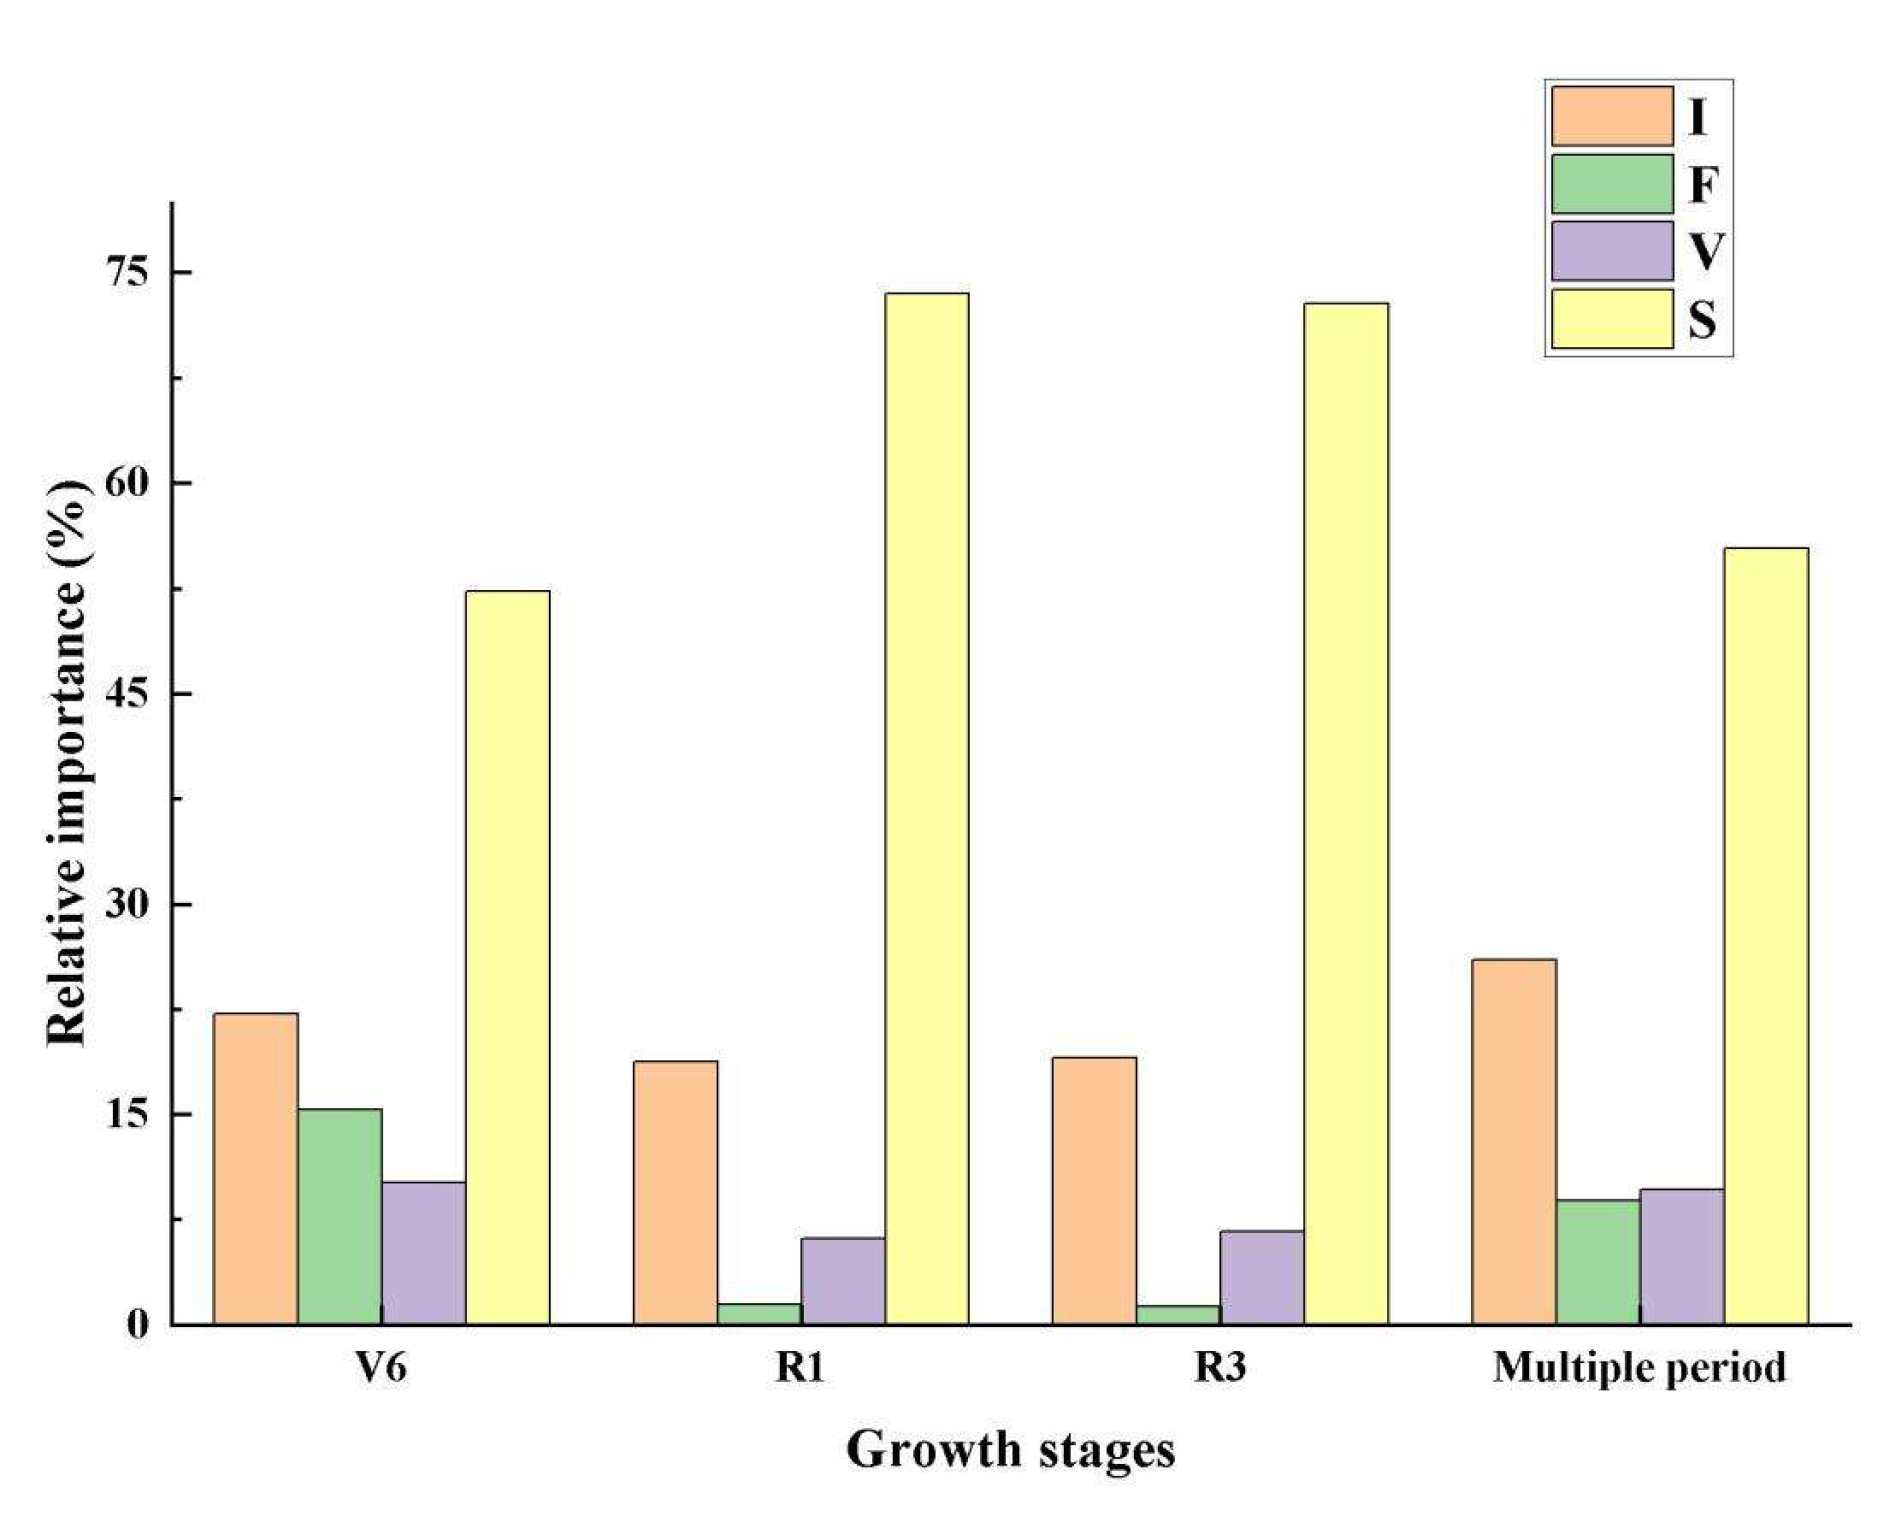
Figure 5 shows different effects of auxiliary predictors on SOM estimation at each growth stage. In the V6 stage, the importance scores of VIs, farm management, plant traits, and soil properties were 22.22%, 15.35%, 10.15%, and 52.28%, respectively. In the R1 stage, the importance scores of VIs, farm management, plant traits, and soil properties were 18.78%, 1.48%, 6.21%, and 73.53%, respectively. In the R3 stage, the importance scores of VIs, farm management, plant traits, and soil properties were 19.08%, 1.35%, 6.70%, and 72.86%, respectively. For multiple growth period combinations, the importance of VIs, farm management, plant traits, and soil properties was 26.09%, 8.86%, 9.69%, and 55.36%, respectively.
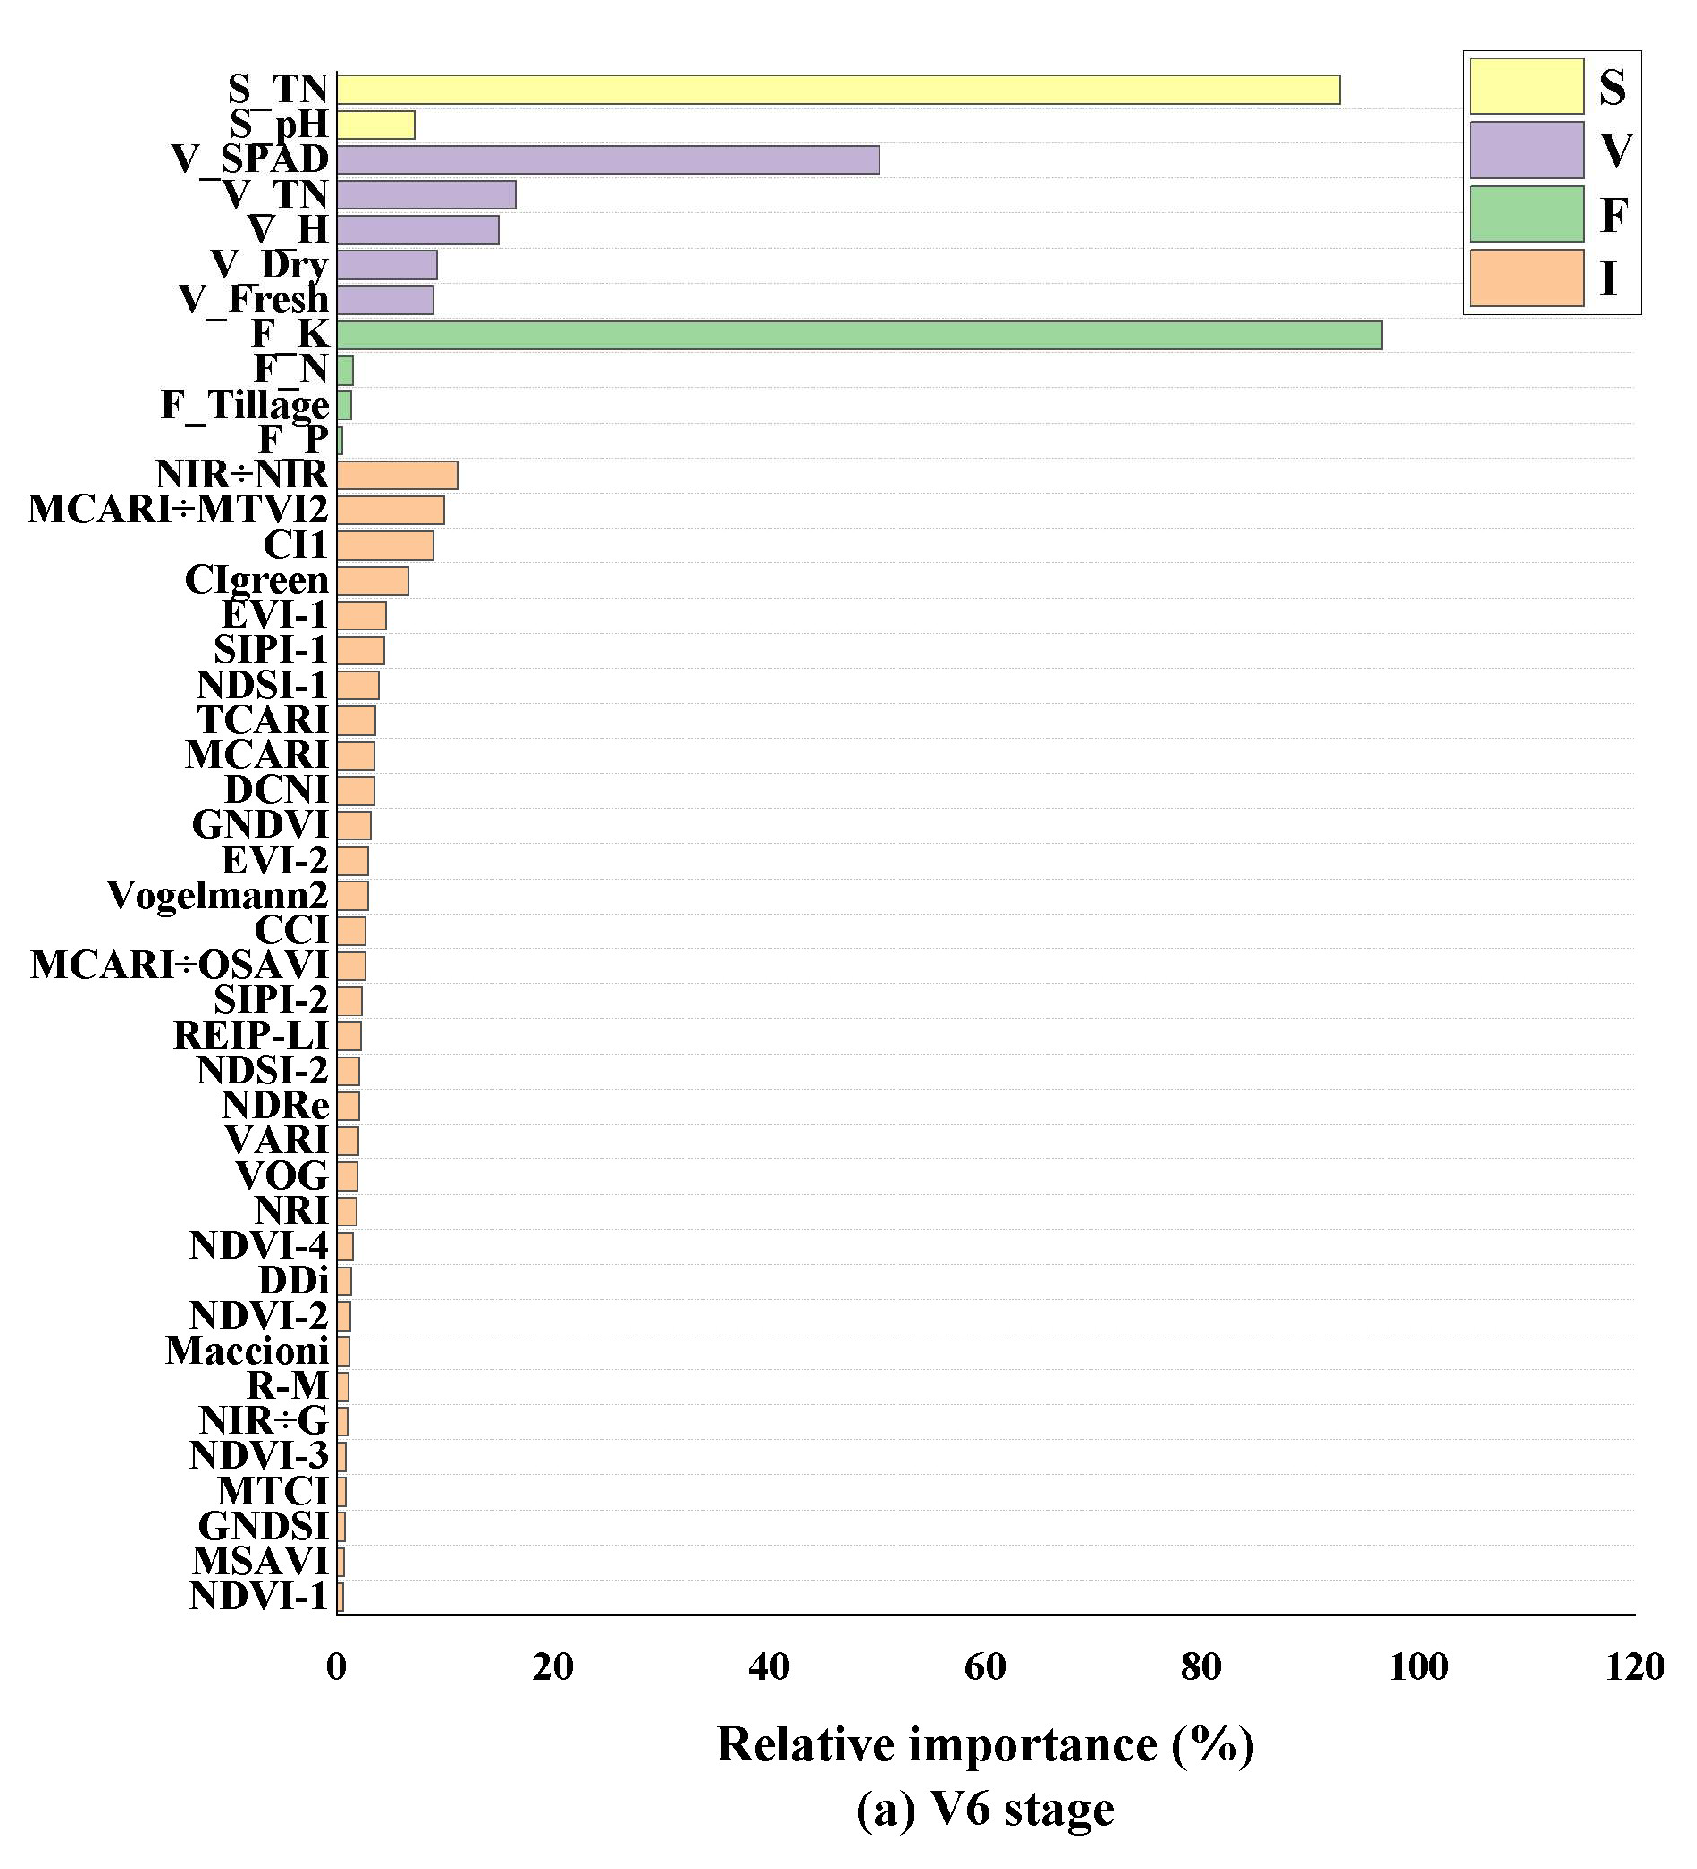
The relative importance of different auxiliary variables in the XGBoost model is shown in Figure 6. The most important soil property was S-TN, and the importance scores of soil TN were 92.79%, 94.39%, 99.29%, and 71.04% for the soil properties factor in the V6, R1, R3, and multiple period growth stages, respectively. The most important predictor of farm management was the amount of K fertilizer, and the relative importance scores were 96.64%, 73.70%, 73.11%, and 81.58% for the farm management factor in the four growth stages, respectively. As shown in Figure 6a, NIR/NIR (with its importance of 11.18%) was the most important predictor among all VIs in the V6 stage, and V-SPAD (50.23%) was the most important plant trait. In the R1 and R3 stages (Figure 6b,c), the relative importance scores of V-H were 43.51% and 67.22%, respectively. The most important VIs were CCI and MTCI, with their importance scores of 10.96% and 9.66%, respectively. In multiple growth periods (Figure 6d), the most important VIs and plant traits were MCARI/OSAVI (with its importance of 12.25%) and V-TN (with its importance of 42.94%).

4. Discussion

4.1. Selection of the Predictors

Chinese agricultural systems are highly heterogeneous due to the complex topography, climate, and farm management across the whole nation [1]. Especially in field-scale farmland, the terrain is flat, and surface meteorological observations are very limited due to the smaller scale [27]. Moreover, most previous studies on SOM estimation were based on bare soil conditions, while the area that may be accurately predicted at the target date is frequently limited due to many areas being covered by crop or snow, especially in the black soil area of northeastern China, which is located in the high-latitude areas.
Here, multi-temporal UAV hyperspectral images were obtained at the six-leaf collar (V6), silking (R1), and maturity (R3) stages of maize in 2019–2020, aiming to derive the narrowband VIs across the maize growing season to record valuable crop growth information. This study found that the hyperspectral data of maize, especially the narrowband VIs at different growth stages, could reflect the SOM in agricultural soils indirectly. Our results also indicate that crop growth and development status collected from in situ data (e.g., dry weight, fresh weight, and plant height) could also reflect SOM content indirectly. These results were consistent with those in Geng [28], which indicates that incorporating crop growth information could offer better insights into soil property estimation and spatial variations. Compared with previous studies that focused on bare soil periods [29,30], this study proposed a new method for SOM prediction under crop cover conditions. Many soil observations (720 samples) were collected and used to validate the model accuracy across different maize growth periods. The results from our study are expected to be used to overcome the limitations of short bare soil periods, especially in the farmland of high-latitude areas.
Furthermore, farmland management measures, such as tillage, fertilization, and irrigation, and human activities have an increasingly significant impacts on the spatial heterogeneity of farmland soil [29,31]. In agricultural soils, soil organic carbon release occurs when farmland is subjected to continuous cropping or intensive cultivation practices [32]. Improvements in soil tillage and fertilization are considered suitable agricultural practices [33]. In the intensively cultivated black soil region in northeastern China, chemical fertilizer has been widely used for many years, and it has made a significant contribution to crop production [34]. Here, we introduced N, P, and K fertilizer application amounts as the chemical fertilization predictor. To date, few studies have employed farm management as a predictor for soil property prediction in agricultural soils. It is necessary to reconsider SOM estimation and mapping in intensive farmland, and the use of agricultural practices can improve the performance of SOM prediction models.

4.2. Comparison of SOM Estimation Models

We found that the modeling accuracy using only narrowband VIs was not ideal. With the addition of multi-source auxiliary predictors, the model accuracy was significantly improved. This also verified that these variables have the potential for estimating SOM content at the field-scale during the critical growth period of maize. The accuracy and stability of ML methods (RF and XGBoost) were better than those of linear regression models (SMLR and PLSR) when multi-source auxiliary variables were added to the models. For example, the accuracy of the PLSR model in the R1 stage was better than the two ML algorithms for almost all the predictor combinations, but the performance of PLSR was not stable across the maize growing season. The linear regression model is known as a conventional approach for soil property prediction because of its simple development process and high interpretability. Therefore, the PLSR model could also be selected for SOM estimation when it achieved similar performance to ML models. Furthermore, a complex nonlinear relationship may exist between SOM and the predictors; thus, the ML models could be applied when a linear model cannot obtain a good performance.
Our results indicate that the XGBoost model achieved a higher prediction accuracy, with an R2 of 0.72 and an RMSE of 0.27% when the I + F + V + S combination was used for the R3 stage. Moreover, a comparable prediction performance was also obtained from the RF model of the I + F + V + S combination (R2: 0.71, RMSE: 0.27%) for the R3 stage, and from the XGBoost model of the I + F + V + S combination (R2: 0.72, RMSE: 0.29%) for multiple periods, all for the vegetation cover conditions. Compared with other studies, Wang [35] studied SOM inversion based on satellite imagery, and their model accuracies were R2 = 0.59 and RMSE = 1.30 g/kg and R2 = 0.63 and RMSE = 6.93 g/kg, respectively. Gu [10] used an ASD high spectrometer to conduct inversion research on the SOM content in cultivated land, and its model accuracy was R2 = 0.75 and RMSE = 0.25%. Our model and predictor combinations obtained similar or better performances for SOM prediction.

4.3. Contributions of the Predictors

Soil properties had the greatest relative importance at each growth stage (52.28%, 73.53%, 72.86%, and 55.36%, respectively) among the four types of predictors. Soil TN occupied the largest contribution in the soil properties group for SOM prediction since soil N can affect soil carbon accumulation and distribution in the soil–plant systems and the amounts of soil C and N were generally well correlated [36,37]. Alongside soil properties always having a large contribution in the prediction models, narrowband VIs had a large contribution for SOM estimation across the growing season. The narrowband VIs were affected by the soil background and plant chlorophyll content with maize growing, and thus, their correlations with SOM content varied across the growing season (Figure 3). There was a significant relationship between the near-infrared region and SOM, which meant the VIs (such as NIR/NIR) calculated using the near-infrared band had a better performance than those calculated by the visible band (such as NDVI-1). Here, the results, which present the relationships between SOM and the VIs, are consistent with those of previous studies. Some studies have shown that VIs can represent carbon input and are the dominant factor in soil organic carbon sequestration, especially in agricultural soils [18,38]. This study indicates that narrowband VIs extracted from multi-temporal hyperspectral images played an important role in the SOM estimation model.
As maize grows, the relative importance of field management and plant characteristics decreases. Among the predictors of farm management, the relative importance of K fertilizer was the highest, which occupied 96.64%, 73.70%, 73.11%, and 81.58% of the farm management factor in the V6, R1, R3, and multiple growth stages, respectively. This may have been because K fertilizer can promote microbial degradation of carbon by providing the available K to affect SOM indirectly [39]. The result was also consistent with Song [40], who revealed that K fertilizer can reduce the degree of SOM decomposition and improve the stability of organic matter storage. With the increase in crop height, the bare soil area was the smallest in the R1 stage, which caused the relative importance of V-H (43.51%) for the plant trait factor to increase significantly.
This study also has some limitations. Only four models were selected as the SOM prediction models; other machine learning and deep learning algorithms (neural networks (NNs) and convolutional neural networks (CNNs)) could also be applied in further research. Different models could be tested to derive reliable relationships between topsoil SOM and multiple temporal VIs combined with other environmental predictors. The findings from the present study should be tested across different soil types, crop types, agricultural cropping systems, and climatic environments. Then, the approach would be more viable and could be expanded to other geographic areas.

5. Conclusions

Multi-temporal UAV-based hyperspectral imagery was used to estimate the field-scale SOM content during the maize growth period. The study examined the capability of utilizing multi-temporal RS information coupled with spectral indices, field management, plant characteristics, and soil properties data to estimate SOM by using traditional regression models and ML algorithms. The conclusions were as follows:
(1)
Multi-temporal UAV hyperspectral images combined with multi-source auxiliary predictors can accurately estimate SOM across key growth periods at the field scale. The I + F + V + S predictor combination can achieve good accuracies across different models and maize growth stages when validated with the in situ SOM measured data.
(2)
Machine learning models obtained better performances for SOM prediction than those from the linear regression models. Specifically, the XGBoost regression model has the best stability and model accuracy for SOM prediction, achieving an R2 of 0.72 and RMSE of 0.27% at the field scale.
(3)
Integrating auxiliary predictors with the basic spectral covariates increased prediction accuracy by 45.95–84.72% for R2 and 14.29–38.10% for RMSE. Soil properties and spectral indices have a more significant effect than other predictors for SOM prediction in such small-scale farmland during the maize growth period.
Our work could also provide scientific implications for SOM estimation under other soil treatments, soil applications, or land improvement measures in similar agricultural regions. Specifically, the following should be considered: (a) More attention should be given to the selection of predictors to obtain more reliable soil–environment relationships. Except for soil TN, which is closely tied with SOM, alternative soil predictors (e.g., soil moisture and texture) could also be explored and investigated. (b) It is recommended to integrate other agricultural practices that may induce SOM dynamics into the prediction model to enhance the predictive capabilities. (c) The key collection time of UAV imagery should also be considered according to different crop types and their growth characteristics. Our results demonstrate the feasibility of estimating SOM under crop cover conditions in one specific field with limited types of soil and management. However, more effort is needed to verify and expand our approach to other fields with different soils or farm management approaches. Future works should find more effective algorithms (e.g., deep learning models) to process large amounts of hyperspectral imagery to improve the model performance. High-resolution and high-accuracy SOM distribution maps could also be considered to support the design of sustainable farm management approaches.

Supplementary Materials

The following supporting information can be downloaded at: https://www.mdpi.com/article/10.3390/agriengineering7100339/s1, Table S1: The spectral indices used in this study [41,42,43,44,45,46,47,48,49,50,51,52,53,54,55,56,57,58,59,60,61,62,63,64,65,66].

Author Contributions

Conceptualization, Y.Z.; methodology, Y.Z.; software, C.X.; validation, C.X.; formal analysis, Y.Z.; investigation, C.X.; resources, Y.Z.; data curation, C.X.; writing—original draft preparation, C.X.; writing—review and editing, Y.Z.; visualization, C.X.; supervision, C.X.; project administration, Y.Z.; funding acquisition, Y.Z. All authors have read and agreed to the published version of the manuscript.

Funding

This study was supported by the Natural Science Foundation of Jilin Province, China [grant number 20240101041JC].

Data Availability Statement

The datasets presented in this article are not readily available because the data are part of an ongoing study.

Conflicts of Interest

The authors declare no conflicts of interest.

References

  1. Luo, Y.H.; Zhang, Z.; Chen, Y.; Li, Z.; Tao, F. ChinaCropPhen1km: A high-resolution crop phenological dataset for three staple crops in China during 2000–2015 based on leaf area index (LAI) products. Earth Syst. Sci. Data 2020, 12, 197–214. [Google Scholar] [CrossRef]
  2. Zhang, Z.; Ding, J.; Li, L.; Cao, J.; Wang, K.; Zhu, C.; Ge, X.; Wang, J.; Yang, C.; Li, F.; et al. The impact of extreme climate on soil organic carbon in China. Geogr. Sustain. 2025, 6, 100356. [Google Scholar] [CrossRef]
  3. Hong, Y.; Guo, L.; Chen, S.; Linderman, M.; Mouazen, A.M.; Yu, L.; Chen, Y.; Liu, Y.; Liu, Y.; Cheng, H.; et al. Exploring the potential of airborne hyperspectral image for estimating top-soil organic carbon: Effects of fractional-order derivative and optimal band combination algorithm. Geoderma 2020, 365, 114228. [Google Scholar] [CrossRef]
  4. Jenny, H. A System of Quantitative Pedology: Factors of Soil Formation; McGraw-Hill Book: New York, NY, USA, 1941. [Google Scholar]
  5. Zhang, Z.; Ding, J.; Wang, J.; Ge, X. Prediction of soil organic matter in northwestern China using fractional-order derivative spectroscopy and modified normalized difference indices. Catena 2020, 185, 104257. [Google Scholar] [CrossRef]
  6. Zhang, Z.; Ding, J.; Zhu, C.; Wang, J.; Ge, X.; Li, X.; Han, L.; Chen, X.; Wang, J. Historical and future variation of soil organic carbon in China. Geoderma 2023, 436, 116557. [Google Scholar] [CrossRef]
  7. Dharumarajan, S.; Kalaiselvi, B.; Suputhra, A.; Lalitha, M.; Vasundhara, R.; Kumar, K.S.A.; Nair, K.M.; Hegde, R.; Singh, S.K.; Lagacherie, P. Digital soil mapping of soil organic carbon stocks in Western Ghats, South India. Geoderma Reg. 2021, 25, e00387. [Google Scholar] [CrossRef]
  8. Guo, L.; Fu, P.; Shi, T.; Chen, Y.; Zhang, H.; Meng, R.; Wang, S. Mapping field-scale soil organic carbon with unmanned aircraft system-acquired time series multispectral images. Soil Tillage Res. 2020, 196, 104477. [Google Scholar] [CrossRef]
  9. Mosleh, Z.; Salehi, M.H.; Jafari, A.; Borujeni, I.E.; Mehnatkesh, A. The effectiveness of digital soil mapping to predict soil properties over low-relief areas. Environ. Monit. Assess. 2016, 188, 195. [Google Scholar] [CrossRef]
  10. Gu, X.H.; Wang, Y.C.; Sun, Q.; Yang, G.J.; Zhang, C. Hyperspectral inversion of soil organic matter content in cultivated land based on wavelet transform. Comput. Electron. Agric. 2019, 167, 105053. [Google Scholar] [CrossRef]
  11. Biney, J.K.M.; Houška, J.; Volánek, J.; Abebrese, D.K.; Cervenka, J. Examining the influence of bare soil UAV imagery combined with auxiliary datasets to estimate and map soil organic carbon distribution in an erosion-prone agricultural field. Sci. Total Environ. 2023, 870, 161973. [Google Scholar] [CrossRef]
  12. Zeraatpisheh, M.; Garosi, Y.; Owliaie, H.R.; Ayoubi, S.; Taghizadeh-Mehrjardi, R.; Scholten, T.; Xu, M. Improving the spatial prediction of soil organic carbon using environmental covariates selection: A comparison of a group of environmental covariates. Catena 2022, 208, 105723. [Google Scholar] [CrossRef]
  13. Zhu, C.; Ding, J.; Zhang, Z.; Wang, J.; Wang, Z.; Chen, X.; Wang, J. SPAD monitoring of saline vegetation based on Gaussian mixture model and UAV hyperspectral image feature classification. Comput. Electron. Agric. 2022, 200, 107236. [Google Scholar] [CrossRef]
  14. Guo, L.; Fu, P.; Shi, T.; Chen, Y.; Zeng, C.; Zhang, H.; Wang, S. Exploring influence factors in mapping soil organic carbon on low-relief agricultural lands using time series of remote sensing data. Soil Tillage Res. 2021, 210, 104982. [Google Scholar] [CrossRef]
  15. Zhang, J.; Wei, D.; Zhou, B.; Zhang, L.; Hao, X.; Zhao, S.; Xu, X. Responses of soil aggregation and aggregate-associated carbon and nitrogen in black soil to different long-term fertilization regimes. Soil Tillage Res. 2021, 213, 105157. [Google Scholar] [CrossRef]
  16. Ye, S.; Zhang, Z.; Chen, J.; Chen, H.; Zhang, B.; Bai, X.; Yang, N.; Du, R.; Yang, X.; Xu, Q.; et al. Inversion of winter wheat canopy chlorophyll content using angle-insensitive UAV-based spectral indices. Comput. Electron. Agric. 2025, 230, 109902. [Google Scholar] [CrossRef]
  17. Liu, Y.; Feng, H.; Fan, Y.; Yue, J.; Yang, F.; Fan, J.; Ma, Y.; Chen, R.; Bian, M.; Yang, G. Utilizing UAV-based hyperspectral remote sensing combined with various agronomic traits to monitor potato growth and estimate yield. Comput. Electron. Agric. 2025, 231, 109984. [Google Scholar] [CrossRef]
  18. Wang, Q.; Noë, J.; Li, Q.; Lan, T.; Gao, X.; Deng, O.; Li, Y. Incorporating agricultural practices in digital mapping improves prediction of cropland soil organic carbon content: The case of the Tuojiang River Basin. J. Environ. Manag. 2023, 330, 117203. [Google Scholar] [CrossRef]
  19. Pantaleão, L.; de Moraes, L.; Cesário, F.; Moser, P.; Dias, A.; Amorim, T.; Sansevero, J. Linking plant functional traits to soil properties in tropical forest restoration. For. Ecol. Manag. 2024, 563, 121976. [Google Scholar] [CrossRef]
  20. Mahmoudzadeh, H.; Matinfar, H.R.; Taghizadeh-Mehrjardi, R.; Kerry, R. Spatial prediction of soil organic carbon using machine learning techniques in western Iran. Geoderma Reg. 2020, 21, e00260. [Google Scholar] [CrossRef]
  21. Ge, X.Y.; Ding, J.L.; Wang, J.Z.; Sun, H.L.; Zhu, Z.Q. A new method for predicting soil moisture based on UAV hyperspectral image. Spectrosc. Spectr. Anal. 2020, 40, 602–609. [Google Scholar]
  22. Zhang, Y.; Xia, C.Z.; Zhang, X.Y.; Cheng, X.H.; Feng, G.Z.; Wang, Y.; Gao, Q. Estimating the maize biomass by crop height and narrowband vegetation indices derived from UAV-based hyperspectral images. Ecol. Indic. 2021, 129, 107985. [Google Scholar] [CrossRef]
  23. Zhang, Y.; Xia, C.; Zhang, X.; Sha, Y.; Feng, G.; Gao, Q. Quantifying the relationship of soil properties and crop growth with yield in a NPK fertilizer application maize field. Comput. Electron. Agric. 2022, 198, 107011. [Google Scholar] [CrossRef]
  24. Ritchie, S.W.; Hanway, J.J.; Benson, G.O. How a Corn Plant Develops, Special Report; Iowa State University: Ames, IA, USA, 1986; p. 48. [Google Scholar]
  25. Wang, W.; Zhang, X.; Shang, K.; Feng, R.; Wang, Y.; Ding, S.; Xiao, Q. Estimation of soil organic matter content by combining Zhuhai-1 hyperspectral and Sentinel-2A multispectral images. Comput. Electron. Agric. 2024, 226, 109377. [Google Scholar] [CrossRef]
  26. Li, Y.; Wei, X.; Yan, J.; Du, Z.; Lv, Y.; Zhou, H. Divergent stabilization characteristics of soil organic carbon between topsoil and subsoil under different land use types. Catena 2025, 252, 108838. [Google Scholar] [CrossRef]
  27. Zhang, Y.; Li, M.; Zheng, L.; Qin, Q.; Lee, W.S. Spectral features extraction for estimation of soil total nitrogen content based on modified ant colony optimization algorithm. Geoderma 2019, 333, 23–34. [Google Scholar] [CrossRef]
  28. Geng, J.; Tan, Q.; Lv, J.; Fang, H. Assessing spatial variations in soil organic carbon and C:N ratio in Northeast China’s black soil region: Insights from Landsat-9 satellite and crop growth information. Soil Tillage Res. 2024, 235, 105897. [Google Scholar] [CrossRef]
  29. Segura, C.; Neal, A.L.; Castro-Sardiňa, L.; Harris, P.; Rivero, M.J.; Cardenas, L.M.; Irisarri, J.G.N. Comparison of direct and indirect soil organic carbon prediction at farm field scale. J. Environ. Manag. 2024, 365, 121573. [Google Scholar] [CrossRef]
  30. Broeg, T.; Don, A.; Gocht, A.; Scholten, T.; Taghizadeh-Mehrjardi, R.; Erasmi, S. Using local ensemble models and Landsat bare soil composites for large-scale soil organic carbon maps in cropland. Geoderma 2024, 444, 116850. [Google Scholar] [CrossRef]
  31. Petito, M.; Cantalamessa, S.; Pagnani, G.; Pisante, M. Modelling and mapping Soil Organic Carbon in annual cropland under different farm management systems in the Apulia region of Southern Italy. Soil Tillage Res. 2024, 235, 105916. [Google Scholar] [CrossRef]
  32. Post, W.M.; Mann, L.K. Changes in soil organic carbon and nitrogen as a result of cultivation. Soils Greenh. Eff. 1990, 6, 401–406. [Google Scholar]
  33. Lal, R. Soil carbon sequestration impacts on global climate change and food security. Science 2004, 304, 1623–1627. [Google Scholar] [CrossRef] [PubMed]
  34. Liang, Y.; Al-Kaisi, M.; Yuan, J.; Liu, J.; Zhang, H.; Wang, L.; Cai, H.; Ren, J. Effect of chemical fertilizer and straw-derived organic amendments on continuous maize yield, soil carbon sequestration and soil quality in a Chinese Mollisol. Agric. Ecosyst. Environ. 2021, 314, 107403. [Google Scholar] [CrossRef]
  35. Wang, Z.; Du, Z.; Li, X.; Bao, Z.; Zhao, N.; Yue, T. Incorporation of high accuracy surface modeling into machine learning to improve soil organic matter mapping. Ecol. Indic. 2021, 129, 107975. [Google Scholar] [CrossRef]
  36. Khalil, M.I.; Hossain, M.B.; Schmidhalter, U. Carbon and nitrogen mineralization in different upland soils of the subtropics treated with organic materials. Soil Biol. Biochem. 2005, 37, 1507–1518. [Google Scholar] [CrossRef]
  37. Coulter, J.A.; Nafziger, E.D.; Wander, M.M. Soil organic matter response to cropping system and nitrogen fertilization. Agron. J. 2009, 101, 592–599. [Google Scholar] [CrossRef]
  38. De Almeida Minhoni, R.T.; Scudiero, E.; Zaccaria, D.; Saad, J.C.C. Multitemporal satellite imagery analysis for soil organic carbon assessment in an agricultural farm in southeastern Brazil. Sci. Total Environ. 2021, 784, 147216. [Google Scholar] [CrossRef]
  39. Xia, H.; Wang, J.; Riaz, M.; Babar, S.; Li, Y.; Wang, X.; Xia, X.; Liu, B.; Jiang, C. Co-application of biochar and potassium fertilizer improves soil potassium availability and microbial utilization of organic carbon: A four-year study. J. Clean. Prod. 2024, 469, 143211. [Google Scholar] [CrossRef]
  40. Song, X.Y.; Li, Y.; Yue, X.; Hussain, Q.; Zhang, J.J.; Liu, Q.H.; Jin, S.A.; Cui, D.J. Effect of cotton straw-derived materials on native soil organic carbon. Sci. Total Environ. 2019, 663, 38–44. [Google Scholar] [CrossRef]
  41. Li, F.; Mistele, B.; Hu, Y.; Yue, X.; Yue, S.; Miao, Y.; Chen, X.; Cui, Z.; Meng, Q.; Schmidhalter, U. Remotely estimating aerial N status of phenologically differing winter wheat cultivars grown in contrasting climatic and geographic zones in China and Germany. Field Crops Res. 2012, 138, 21–32. [Google Scholar] [CrossRef]
  42. Sims, D.; Luo, H.; Hastings, S.; Oechel, W.; Rahman, A.; Gamon, J. Parallel adjustments in vegetation greenness and ecosystem CO2 exchange in response to drought in a Southern California chaparral ecosystem. Remote Sens. Environ. 2006, 103, 289–303. [Google Scholar] [CrossRef]
  43. Gitelson, A.A.; Viña, A.; Ciganda, V.; Rundquist, D.C.; Arkebauer, T.J. Remote estimation of canopy chlorophyll content in crops. Geophys. Res. Lett. 2005, 32, 271–282. [Google Scholar] [CrossRef]
  44. Chen, P.; Haboudane, D.; Tremblay, N.; Wang, J.; Vigneault, P.; Li, B. New spectral indicator assessing the efficiency of crop nitrogen treatment in corn and wheat. Remote Sens. Environ. 2010, 114, 1987–1997. [Google Scholar] [CrossRef]
  45. le Maire, G.; François, C.; Dufrêne, E. Towards universal broad leaf chlorophyll indices using PROSPECT simulated database and hyperspectral reflectance measurements. Remote Sens. Environ. 2004, 89, 1–28. [Google Scholar] [CrossRef]
  46. Huete, A.; Justice, C.; Liu, H. Development of vegetation and soil indices for MODIS-EOS. Remote Sens. Environ. 1994, 49, 224–234. [Google Scholar] [CrossRef]
  47. Huete, A.; Didan, K.; Miura, T.; Rodriguez, E.P.; Gao, X.; Ferreira, L.G. Overview of the radiometric and biophysical performance of the MODIS vegetation indices. Remote Sens. Environ. 2002, 83, 195–213. [Google Scholar] [CrossRef]
  48. Gitelson, A.A.; Kaufman, Y.J.; Merzlyak, M.N. Use of a green channel in remote sensing of global vegetation from EOS-MODIS. Remote Sens. Environ. 1996, 58, 289–298. [Google Scholar] [CrossRef]
  49. Maccioni, A.; Agati, G.; Mazzinghi, P. New vegetation indices for remote measurement of chlorophylls based on leaf directional reflectance spectra. J. Photochem. Photobiol. B 2001, 61, 52–61. [Google Scholar] [CrossRef]
  50. Eitel, J.U.H.; Long, D.S.; Gessler, P.E.; Smith, A.M.S. Using in-situ measurements to evaluate the new RapidEye™ satellite series for prediction of wheat nitrogen status. Int. J. Remote Sens. 2007, 28, 4183–4190. [Google Scholar] [CrossRef]
  51. Zarco-Tejada, P.J.; Miller, J.R.; Morales, A.; Berjón, A.; Agüera, J. Hyperspectral indices and model simulation for chlorophyll estimation in open-canopy tree crops. Remote Sens. Environ. 2004, 90, 463–476. [Google Scholar] [CrossRef]
  52. Qi, J.; Chehbouni, A.; Huete, A.R.; Kerr, Y.H.; Sorooshian, S. A modified soil adjusted vegetation index. Remote Sens. Environ. 1994, 48, 119–126. [Google Scholar] [CrossRef]
  53. Dash, J.; Curran, P.J. The MERIS terrestrial chlorophyll index. Int. J. Remote Sens. 2004, 25, 5403–5413. [Google Scholar] [CrossRef]
  54. Inoue, Y.; Sakaiya, E.; Zhu, Y.; Takahashi, W. Diagnostic mapping of canopy nitrogen content in rice based on hyperspectral measurements. Remote Sens. Environ. 2012, 126, 210–221. [Google Scholar] [CrossRef]
  55. Yao, X.; Zhu, Y.; Tian, Y.; Feng, W.; Cao, W. Exploring hyperspectral bands and estimation indices for leaf nitrogen accumulation in wheat. Int. J. Appl. Earth Obs. Geoinf. 2010, 12, 89–100. [Google Scholar] [CrossRef]
  56. Rouse, J.W., Jr.; Haas, R.H.; Schell, J.A.; Deering, D.W. Monitoring Vegetation Systems in the Great Plains with Erts. In NASA Special Publication; NASA: Greenbelt, MD, USA, 1974; Volume 351, p. 309. [Google Scholar]
  57. Rouse, J.W., Jr.; Haas, R.H.; Schell, J.A.; Deering, D.W. Monitoring the Vernal Advancement and Retrogradation (Green Wave Effect) of Natural Vegetation. In Proceedings of the Third Earth Resources Technology Satellite-1 Symposium, Held by Goddard Space Flight Center, Washington, DC, USA, 10–14 December 1973. [Google Scholar]
  58. Pu, R.; Landry, S. A comparative analysis of high spatial resolution IKONOS and WorldView-2 imagery for mapping urban tree species. Remote Sens. Environ. 2012, 124, 516–533. [Google Scholar] [CrossRef]
  59. Mistele, B.; Gutser, R.; Schmidhalter, U. Validation of field-scaled spectral measurements of the nitrogen status in winter wheat. Paper Presented at the 7th International Conference on Precision Agriculture and Other Precision Resources Management, Hyatt Regency , Minneapolis, MN, USA, 25–28 July 2004. [Google Scholar]
  60. Fitzgerald, G.; Rodriguez, D.; O’Leary, G. Measuring and predicting canopy nitrogen nutrition in wheat using a spectral index-The canopy chlorophyll content index (CCCI). Field Crops Res. 2010, 116, 318–324. [Google Scholar] [CrossRef]
  61. Datt, B. A New Reflectance Index for Remote Sensing of Chlorophyll Content in Higher Plants: Tests using Eucalyptus Leaves. J. Plant Physiol. 1999, 154, 30–36. [Google Scholar] [CrossRef]
  62. Guyot, G.; Baret, F.; Major, D.J. High spectral resolution: Determination of spectral shifts between the red and near infrared. ISPRS Congr. 1988, 11, 740–760. [Google Scholar]
  63. Penuelas, J.; Baret, F.; Filella, I. Semiempirical Indexes to Assess Carotenoids Chlorophyll-a Ratio from Leaf Spectral Reflectance. Photosynthetica 1995, 31, 221–230. [Google Scholar] [CrossRef]
  64. Haboudane, D.; Miller, J.R.; Tremblay, N.; Zarco-Tejada, P.J.; Dextraze, L. Integrated narrow-band vegetation indices for prediction of crop chlorophyll content for application to precision agriculture. Remote Sens. Environ. 2002, 81, 416–426. [Google Scholar] [CrossRef]
  65. Gitelson, A.; Viña, A.; Ciganda, V.; Rundquist, D.C.; Arkebauer, T.J. Relationships between leaf chlorophyll content and spectral reflectance and algorithms for non-destructive chlorophyll assessment in higher plant leaves. J. Plant Physiol. 2003, 160, 271–282. [Google Scholar] [CrossRef]
  66. Vogelmann, J.E.; Rock, B.N.; Moss, D.M. Red edge spectral measurements from sugar maple leaves. Int. J. Remote Sens. 2007, 14, 1563–1575. [Google Scholar] [CrossRef]
Figure 1. Location of the study area and field experiment design [23]. (a) Location of Jilin Province, (b) location of Lishu Prefecture, (c) UAV image of the experimental field, and (d) experimental design for each plot.
Agriengineering 07 00339 g001
Figure 2. Correlation coefficient between the SOM and hyperspectral reflectance values, where 0.182 is the value above which reliable data was found for each growing stage of maize.
Agriengineering 07 00339 g002
Figure 3. Correlation coefficient between SOM and hyperspectral reflectance values. (a) V6 stage; (b) R1 stage; (c) R3 stage; and (d) Multiple growth periods. SOM: soil organic matter; S_TN: soil total nitrogen; S_pH: soil pH; V_TN: leaf nitrogen content; V_Dry: dry weight; V_H: crop height; V_Fresh: fresh weight; F_N: the fertilizer rates of nitrogen; F_P: the fertilizer rates of phosphorus; F_K: the fertilizer rates of potassium; F_Tillage: tillage methods; other predictors represent the spectral indices.
Agriengineering 07 00339 g003
Figure 4. Scatter plots of the measured vs. estimated SOMs (%) for the XGBoost model. The dashed line is the 1:1 line. RMSE and nRMSE are represented as percentages. (a) V6 stage; (b) R1 stage; (c) R3 stage; and (d) Multiple growth periods.
Agriengineering 07 00339 g004
Figure 5. The importance of different auxiliary predictors at different growth stages in the XGBoost model. I—spectral indices, F—field management, V—plant traits, S—soil properties.
Agriengineering 07 00339 g005
Figure 6. The contributions of predictors across growth stages in the XGBoost model. Abbreviations: S: soil properties, V: plant traits, F: farm management, I: vegetation indices. S_TN: soil total nitrogen; S_pH: soil pH; V_TN: leaf nitrogen content; V_Dry: dry weight; V_H: crop height; V_Fresh: fresh weight; F_N: the fertilizer rates of nitrogen; F_P: the fertilizer rates of phosphorus; F_K: the fertilizer rates of potassium; F_Tillage: tillage methods; other predictors represent the spectral indices.
Agriengineering 07 00339 g006aAgriengineering 07 00339 g006b
Table 1. Characteristics of sampled SOM in 2019–2020 (unit: %).
Growth StagesDatasetNumber of SamplesMaxMinMeanSDCVMedian
V6Whole1204.082.242.950.380.142.95
Calibration844.062.242.940.380.142.95
Validation364.082.352.960.390.152.96
R1Whole1204.761.933.040.600.363.02
Calibration844.481.933.030.600.353.01
Validation364.762.013.060.630.393.04
R3Whole1204.772.153.080.440.193.02
Calibration844.422.153.070.420.183.01
Validation364.772.253.100.470.223.03
Multiple periodsWhole3604.771.933.020.480.232.98
Calibration2524.761.933.020.480.232.98
Validation1084.772.013.030.490.242.99
Table 2. Performance of four SOM estimation models.
Growth StageVariablesSMLRPLSRRFXGBoost
R2RMSE (%)nRMSE
(%)
R2RMSE (%)nRMSE
(%)
R2RMSE (%)nRMSE
(%)
R2RMSE (%)nRMSE
(%)
V6I0.220.440.260.390.450.260.110.390.230.210.410.24
I + F0.420.280.160.730.510.290.190.350.200.480.280.16
I + F + V0.430.270.160.850.520.300.260.330.190.440.290.17
I + F + V + S0.350.310.180.220.340.200.510.270.160.670.250.15
R1I0.150.630.360.250.690.390.200.630.360.200.630.36
I + F0.330.500.290.690.800.460.370.500.320.370.490.28
I + F + V0.310.510.290.620.640.370.400.490.310.390.480.28
I + F + V + S0.250.500.290.580.400.230.520.470.270.600.390.22
R3I0.190.360.210.540.490.280.120.380.220.210.420.24
I + F0.320.320.190.640.510.290.360.320.180.480.280.16
I + F + V0.540.340.200.660.480.270.290.340.190.670.360.21
I + F + V + S0.640.220.130.480.280.160.710.270.150.720.270.16
Multiple periodsI0.170.480.280.210.480.280.140.460.260.110.470.27
I + F0.450.360.210.570.530.300.520.340.190.550.330.19
I + F + V0.310.410.240.580.520.300.490.350.200.550.330.19
I + F + V + S0.630.300.170.630.290.170.640.290.170.720.290.16
Note: I—vegetation indices, F—farm management, V—plant traits, S—soil properties.
Disclaimer/Publisher’s Note: The statements, opinions and data contained in all publications are solely those of the individual author(s) and contributor(s) and not of MDPI and/or the editor(s). MDPI and/or the editor(s) disclaim responsibility for any injury to people or property resulting from any ideas, methods, instructions or products referred to in the content.