Article

Spatial-Temporal Dynamics of Water Resources in Seasonally Dry Tropical Forest: Causes and Vegetation Response

by
Maria Beatriz Ferreira
1,*,
Rinaldo Luiz Caraciolo Ferreira
1,
Jose Antonio Aleixo da Silva
1,
Robson Borges de Lima
2,
Emanuel Araújo Silva
1,
Alex Nascimento de Sousa
1,
Doris Bianca Crispin De La Cruz
1 and
Marcos Vinícius da Silva
3
1
Departamento de Ciências Florestais, Universidade Federal Rural de Pernambuco, Rua Dom Manuel de Medeiros, s/n, Dois Irmãos, Recife CEP 52171-900, Pernambuco, Brazil
2
Departamento de Engenharia Florestal, Universidade do Estado do Amapá, Av. Presidente Vargas, nº 450, Centro, Macapá CEP 68901-262, Amapá, Brazil
3
Programa de Pós-Graduação em Ciências Florestais, Universidade Federal de Campina Grande, Av. Universitária, s/n, Santa Cecília, Patos CEP 58708-110, Paraíba, Brazil
*
Author to whom correspondence should be addressed.
AgriEngineering 2024, 6(3), 2526-2552; https://doi.org/10.3390/agriengineering6030148
Submission received: 16 June 2024 / Revised: 12 July 2024 / Accepted: 19 July 2024 / Published: 1 August 2024

Abstract

:
Seasonally Dry Tropical Forests (SDTFs) are situated in regions prone to significant water deficits. This study aimed to evaluate and quantify the dynamics and spatial patterns of vegetation and water bodies through the analysis of physical–hydrological indices for a remnant of FTSD between 2013 and 2021. Basal area, biomass, and tree number were monitored in 80 permanent plots located in two areas of an SDTF remnant with different usage histories. To assess vegetation and water resource conditions, geospatial parameters NDVI, NDWIveg, NDWI, and MNDWI were estimated for the period from 2013 to 2021. The observed patterns were evaluated by simple linear regression, principal component analysis (PCA), and principal component regression (PCR). Area 2 presented higher values of basal area, biomass, and number of trees. In area 1, there was an annual increase in basal area and biomass, even during drought years. The NDVI and NDWIveg indicated the vulnerability of vegetation to the effects of droughts, with higher values recorded in 2020. NDWI and MNDWI detected the water availability pattern in the study area. Physical–hydrological indices in the dynamics of tree vegetation in dry forests are influenced by various factors, including disturbances, soil characteristics, and precipitation patterns. However, their predictive capacity for basal area, biomass, and tree number is limited, highlighting the importance of future research incorporating seasonal variability and specific local conditions into their analyses.

1. Introduction

Seasonally Dry Tropical Forests (SDTFs) comprise approximately 42% of the world’s tropical forests. They are predominantly located in the Neotropics, ranging from northwest Mexico to northern Argentina, as well as in parts of the African continent, Latin America, and regions of the Asia-Pacific. These forests generally occur in isolated patches or fragmented areas of land [1,2]. The vegetation of SDTFs exhibits seasonal variations, with leaf shedding being an important strategy to minimize the impacts of the dry season [3]. These forests are prevalent in environments with high thermal variability and low to moderate annual rainfall (500–1000 mm), with a dry season that can last from 5 to 8 months per year [4].
In recent years, human activities have significantly impacted SDTFs, as highlighted by Aguilar-Peralta et al. [3], where deforestation, urban expansion, and land conversion for agriculture and livestock have contributed to the deterioration of these forests. Studies conducted in dry tropical forests have shown that various factors directly or indirectly influence growth rates, mortality, and recruitment, such as rainfall, temperature, wind, and topography [5,6]. It is important to note that SDTFs are in regions subject to significant water deficits, with prolonged drought events being the main drivers of changes in forest structure, significantly affecting regeneration and the balance between tree mortality and recruitment [7,8]. As a result, a mosaic of remaining forest fragments interspersed with abandoned areas in various stages of degradation has been observed. One of the main consequences of these impacts is a high proportion of secondary forests in SDTFs, fragmented and in different stages of ecological succession [9,10].
A variety of native species found in SDTFs are known for their drought tolerance, including shrub species [11] and tree species [12]. However, variations in rainfall and temperature regimes can directly affect the population dynamics of trees that develop in dry forest ecosystems [13]. In this context, SDTFs are highly sensitive to potential changes as they are located in regions characterized by marked seasonality in rainfall distribution, resulting in several months of drought [14]. Therefore, studies that aim to analyze the spatio-temporal distribution of vegetation associated with water and natural resources are essential to understand the dynamics of forest communities or populations, with the goal of quantifying and assessing the impacts caused by exploitation, climate change, and biodiversity loss.
In scenarios of intense and rapid environmental changes, with the intensification of anthropogenic practices, remote sensing presents an opportunity for data acquisition to monitor the spatio-temporal dynamics of vegetation and water resources over large areas, quickly and at lower costs [15,16]. To assess the state and changes of forest vegetation from satellite images, crucial information is derived from the spectral properties of the studied vegetation species [17]. The effectiveness of multispectral data and the vegetation indices computed from these data can aid in monitoring forest vegetation [18,19].
Vegetation indices are tools used in remote analysis to estimate the quantity and quality of vegetation. The Normalized Difference Vegetation Index (NDVI) is widely used to estimate vegetation amount and health [20]. The Normalized Difference Water Index (NDWI) is often used to assess the amount of water in vegetation and to identify water bodies [21,22]; positive values for these indices indicate the presence of water [23]. NDWIveg [21], on the other hand, is an NDWI sensitive to the presence of water in vegetation [19]. The Modified Normalized Difference Water Index (MNDWI), proposed by Xu [24], is a modified version of the NDWI, recommended for estimating the presence of water bodies and wet areas, such as swamps or flooded areas [23].
Understanding the patterns of water bodies in soil and vegetation through physical–hydrological indices is necessary and crucial in the current scenario of climate change that has unfolded in global society, aiming to assist both present society and future generations in decision-making regarding forest management, to reduce the environmental liabilities resulting from anthropogenic actions combined with climate change. Moreover, it aids in the environmental conservation of the biomes in Brazil and worldwide.
To verify and quantify the relationship between variables, such as data obtained from field surveys and vegetation indices, regression is generally used as the main statistical tool [25,26]. When this involves three or more variables, it is considered a multiple regression. However, it is important to note that in these cases, highly correlated independent variables are commonly observed, which results in regression coefficients with low precision. In such cases, it is advantageous to discard some variables to increase the stability of the estimated regression coefficients [27,28]. There are several alternatives to reduce the dimensionality of a model, among which the use of principal components stands out. principal component regression (PCR) is a combination of principal component analysis (PCA) and least squares regression. In PCR, models aimed at explaining a dependent variable use principal components that show high correlations with the dependent variable, allowing for the discarding of PCs with low correlation. This process eliminates sources of random errors [28,29].
Considering the above, it was proposed to assess the spatio-temporal dynamics of vegetation and water resources using orbital sensing techniques via Landsat 8/OLI and quantify patterns of change in vegetation and water surfaces through the analysis of physical–hydrological indices (NDVI, NDWIveg, NDWI, MNDWI) in a remnant of SDTF in the semi-arid region of Northeast Brazil, between the years 2013 and 2021. The main hypotheses outlined were: I) How do vegetation and hydrological indices respond to the dynamics of floristic composition, individual structure, growth, and production of tree vegetation in an anthropized dry forest in the Brazilian semi-arid region? II) How do different disturbance histories correlate with vegetation indices NDVI, NDWI, NDWIveg, and MNDWI over time?

2. Materials and Methods

2.1. Characterization of the Study Area

The study was conducted at Fazenda Itapemirim, owned by Agrimex Agroindustrial Excelsior S.A., located in the municipality of Floresta, PE, in the mesoregion of São Francisco Pernambucano and microregion of Itaparica. The farm is situated at latitude 8°30′49″ S and longitude 37°57′44″ W, Zone 24S—UTM (SIRGAS 2000). The total area of the farm is approximately 6000 hectares. The study was carried out in two sample areas with different disturbance histories: Area 1—the last clear-cutting in the area was in 1987; and Area 2—no anthropogenic interventions have been recorded for approximately 58 years, considered a conserved area (Figure 1).
According to the Köppen-Geiger climate classification [30], the region’s climate is characterized as BSh—hot, semi-arid, steppe type, marked by a dry season and a rainy season [31]. The average annual temperature in the region is 27.8 °C, and the average annual precipitation according to climatological norms is 520.7 mm, with rainfall concentrated from January to June, with the wettest months being March and April [32]. The soil in the region is characterized as shallow Chronic Luvic soils, with a sandy to medium surface texture [33]. The vegetation in the area is shrub-tree type, with the occurrence of deciduous species, typical of a wooded Steppe Savanna [34].

2.2. Sampling and Data Collection

The study areas have been monitored since 2008 through 80 permanent plots (40 in each area). Each plot measures 20 m × 20 m (400 m2), spaced 80 m apart from each other and 50 m from the edge, totaling 3.2 hectares of sampled area. During plot installation, all shrub-tree individuals with a circumference at breast height (CBH) ≥ 6 cm were identified and tagged at their CBH to standardize the measurement location. From 2013 to 2021, all individuals were remeasured, and those that reached the minimum thresholds (CBH ≥ 6 cm) were included in the sampling, as well as dead and fallen individuals.

2.3. Characterization of Vegetation Cover via Geoprocessed Vegetation and Water Indices in Google Earth Engine (GEE)

For the development of thematic maps depicting vegetation conditions and water resources using Landsat 8/OLI satellite imagery, the following vegetation and water indices were determined: NDVI, NDWIveg, NDWI, MNDWI. These indices were developed, managed, and processed automatically using the Google Earth Engine (GEE) cloud-based digital platform (https://earthengine.google.com/, accessed on 22 March 2023) and programmed in JavaScript. This platform encompasses libraries that offer various functions for mathematical analysis, modeling, statistical analyses, and machine learning tasks, all utilizing specific algorithms designed for the digital processing of satellite images [35,36].
The Normalized Difference Vegetation Index (NDVI) indicates the state of green vegetated surfaces. It is calculated based on the ratio of the difference between near-infrared reflectance (rNIR1) and red band reflectance (rRED) to their sum, as shown in Equation (1)—[37,38,39].
NDVI = r NIR 1 r RED r NIR 1 + r RED
where
  • rNIR1—reflects radiation in the near infrared range;
  • rRED—reflects radiation in the red range.
The Normalized Difference Water Index (NDWI) was utilized to evaluate the water content on the land surface and the moisture conditions of the vegetation cover. Introduced by McFeeters [22], NDWI is calculated as the ratio of the difference between the green band reflectance (rGREEN) and near-infrared reflectance (rNIR1) to their sum, as expressed in Equation (2).
NDWI = r GREEN r NIR 1 r GREEN + r NIR 1
where
  • rNIR1—reflects radiation in the near infrared range;
  • rGREEN—reflects radiation in the green range.
NDWIveg is a variation of NDWI specific for characterizing water in healthy vegetation. It is designed to highlight the presence and health of plants, suppressing the effects of water in the image [40]. Higher NDWIveg values indicate healthier and denser vegetation (Equation (3)).
NDWIveg = r NIR 1 r SWIR r NIR 1 + r SWIR
where
  • rNIR1—reflects radiation in the near infrared range;
  • rSWIR—reflects radiation in the short-wave infrared range.
In alignment with the principle of NDWI, the modification proposed by Xu [24] replaces the near-infrared band (rNIR1) with the mid-infrared band (rSWIR1), resulting in the Modified Normalized Difference Water Index (MNDWI). This adjustment enhances the spectral response of water resources, producing clearer characteristics and higher positive values than NDWI. The increased absorption in the mid-infrared band effectively reduces noise from buildings, soil, and vegetation, which often causes overestimation of water features. The MNDWI is calculated as shown in Equation (4) [24].
MNDWI = r GREEN r SWIR 1 r GREEN + r SWIR 1
where
  • rGREEN—reflects radiation in the green range
  • rSWIR—reflects radiation in the short-wave infrared range.
The set of images used originates from the Landsat 8/OLI collection ee.ImageCollection (“LANDSAT/LC08/C02/T1_L2”), which spans from 2013 to the present day. The study was conducted during the dry season of each year, coinciding with the field data collection period (September and October). A criterion of less than 15% cloud cover was established for image selection, where the average of all images within the predetermined cloud percentage criterion was calculated for each period.

2.4. Statistical Analyses

2.4.1. Analysis of Tree Community Dynamics

The dynamics were characterized based on density change (number of trees per plot) and rates of change in basal area (m2·ha−1). The biomass stock of the study area was determined using allometric equations developed by Dalla Lana et al. [41] for eight Caatinga species, as well as a general equation. The equations were adjusted using data obtained from the forest inventory conducted in Area 2 in 2013 (Table 1). The authors selected these species based on their representativeness in the area, which accounted for over 90% of the total density.

2.4.2. Boxplot Analysis

A boxplot analysis was performed to detect outliers and examine the statistical dispersion of the data. This analysis included three percentiles (median and interquartile range) along with the minimum and maximum values (whiskers, represented by the lines of the standard boxplot), forming the five-number summary for the variables: number of trees, basal area, and biomass [42].

2.4.3. Trend Analysis

Trend analysis was performed for the dataset of basal area, number of trees, biomass, MNDWI, NDWI, NDWIveg, and NDVI using the non-parametric Mann–Kendall statistical test [43,44]. The test statistic (S) is described by Equation (5):
S =   k = 1 n 1 j = k + 1 n sgn x j - x i
where
  • n—the number of data points;
  • xj and xi—refer to each of the measurements at different time steps i and j, with ij;
  • sgn(xj − xi)—defined by Equation (6).
sgn =   1 ,   se   x j x i   >   0 0 ,   se   x j     x i = 0 1 ,   se   x j     x i   <   0
If the data set is identically and independently distributed, then the mean of S is zero and the variance of S is given by Equation (7):
Var S = n n     1 2 n + 5   t = 1 q t t     1 2 t + 5 18
where
  • n—the data set number;
  • t—the number of data with repeated values in a given group;
  • q—the number of groups containing repeated values.
During a long time series, the statistical value S can be transformed into Z according to the following conditions, given by Equation (8):
Z S     1 Var ( S ) ,   S   >   0 ;   0 ,   S = 0 ;   S + 1 Var ( S ) ,   S   <   0
When −1.96 ≤ Z ≤ 1.96, the null hypothesis (H0) is accepted, indicating that there is no statistically significant trend in the time series. The trend is significant at a 90% confidence level if |Z| > 1.64, at a 95% confidence level if |Z| > 1.96, and at a 99% confidence level if |Z| > 2.58. A positive Z value indicates an increasing trend in the sequence, while a negative Z reflects a decreasing trend.
The Mann–Kendall trend analysis was performed with the aid of Origin-Lab PRO 2024b.

2.4.4. Regression Analysis

The correlation between the variables obtained in the field, in areas with different land-use histories, and the spectral variables, in the different indices, was subjected to simple linear regression analysis, where the independent variable was the digital number value of each tested index, and the dependent variable was the value for the variables obtained in the field. The values for each index were generated using the “Point Sampling Tool” plugin in QGIS, where the values for the biophysical indices NDVI, NDWIveg, NDWI, and MNDWI were obtained at the center of each experimental unit.

2.4.5. Principal Component Analysis

To assess the degree of correlation among the variables studied and the adequacy of the data for principal component analysis, Bartlett’s test of sphericity and the Kaiser–Meyer–Olkin (KMO) test were used (Table 2). Bartlett’s test of sphericity checks whether the correlation matrix is an identity matrix, which would indicate no correlation among the data. At a significance level of 5%, the null hypothesis that the correlation matrix is an identity matrix is rejected.
After verifying the adequacy of the dataset, principal component analysis (PCA) was applied to the two study areas based on the following variables: basal area, biomass, number of trees, and vegetation and water indices (NDVI, NDWIveg, NDWI, and MNDWI). Based on the principal components (PCs), the covariance matrix was obtained to extract the eigenvalues that generate the eigenvectors.
To determine correlated variables, the Kaiser criterion was employed, selecting eigenvalues greater than 1 to produce components containing substantial information from the original dataset [45]. These analyses were performed using R software, version 3.6.1 [46].

2.4.6. Principal Component Regression (PCR)

After extracting the components, the variables (physical–hydrological indices) to be used in the regression for estimating the variables obtained from real data (biomass, basal area, and number of trees) were selected. Physical–hydrological indices most likely to contribute to the model development were identified by inspecting the eigenvectors in each principal component, as proposed by Oliveira et al. [47].
The differences in the contribution of each index to the variability in the dataset, along with the similarity in the calculated metrics (field variables), were determined by analyzing the eigenvectors and PC scores. Therefore, the indices with the highest loadings on the PCs were used as input variables in multiple linear regression models to predict biomass, basal area, and/or the number of trees.
To do this, it is necessary to assume that there is a linear relationship between a variable Y (biomass; basal area; number of trees) and k independent variables, xj (j = 1, …, k = physical–hydrological indices). In this context, the mathematical model that expresses the multiple linear regression equation is as follows:
Y = β 0 + β 1 X 1 + β 2 X 2 + + β o X o + e  
where
  • Y—biomass (kg), basal area (m2·ha−1), and number of trees;
  • β0—intercept on the Y-axis;
  • βi—slope of the i-th explanatory variable;
  • k—number of explanatory variables;
  • ε—random error.
The model parameters were estimated using the ordinary least squares (OLS) method. For each criterion established in the estimation of the response variables (biomass, basal area, and number of trees), the resulting equations were analyzed by comparing statistical criteria, including the R-squared (R2) values and the Pearson correlation coefficient (r). All the analyses described were conducted using SPSS 25 software.

3. Results and Discussion

3.1. Dynamics of Tree Vegetation

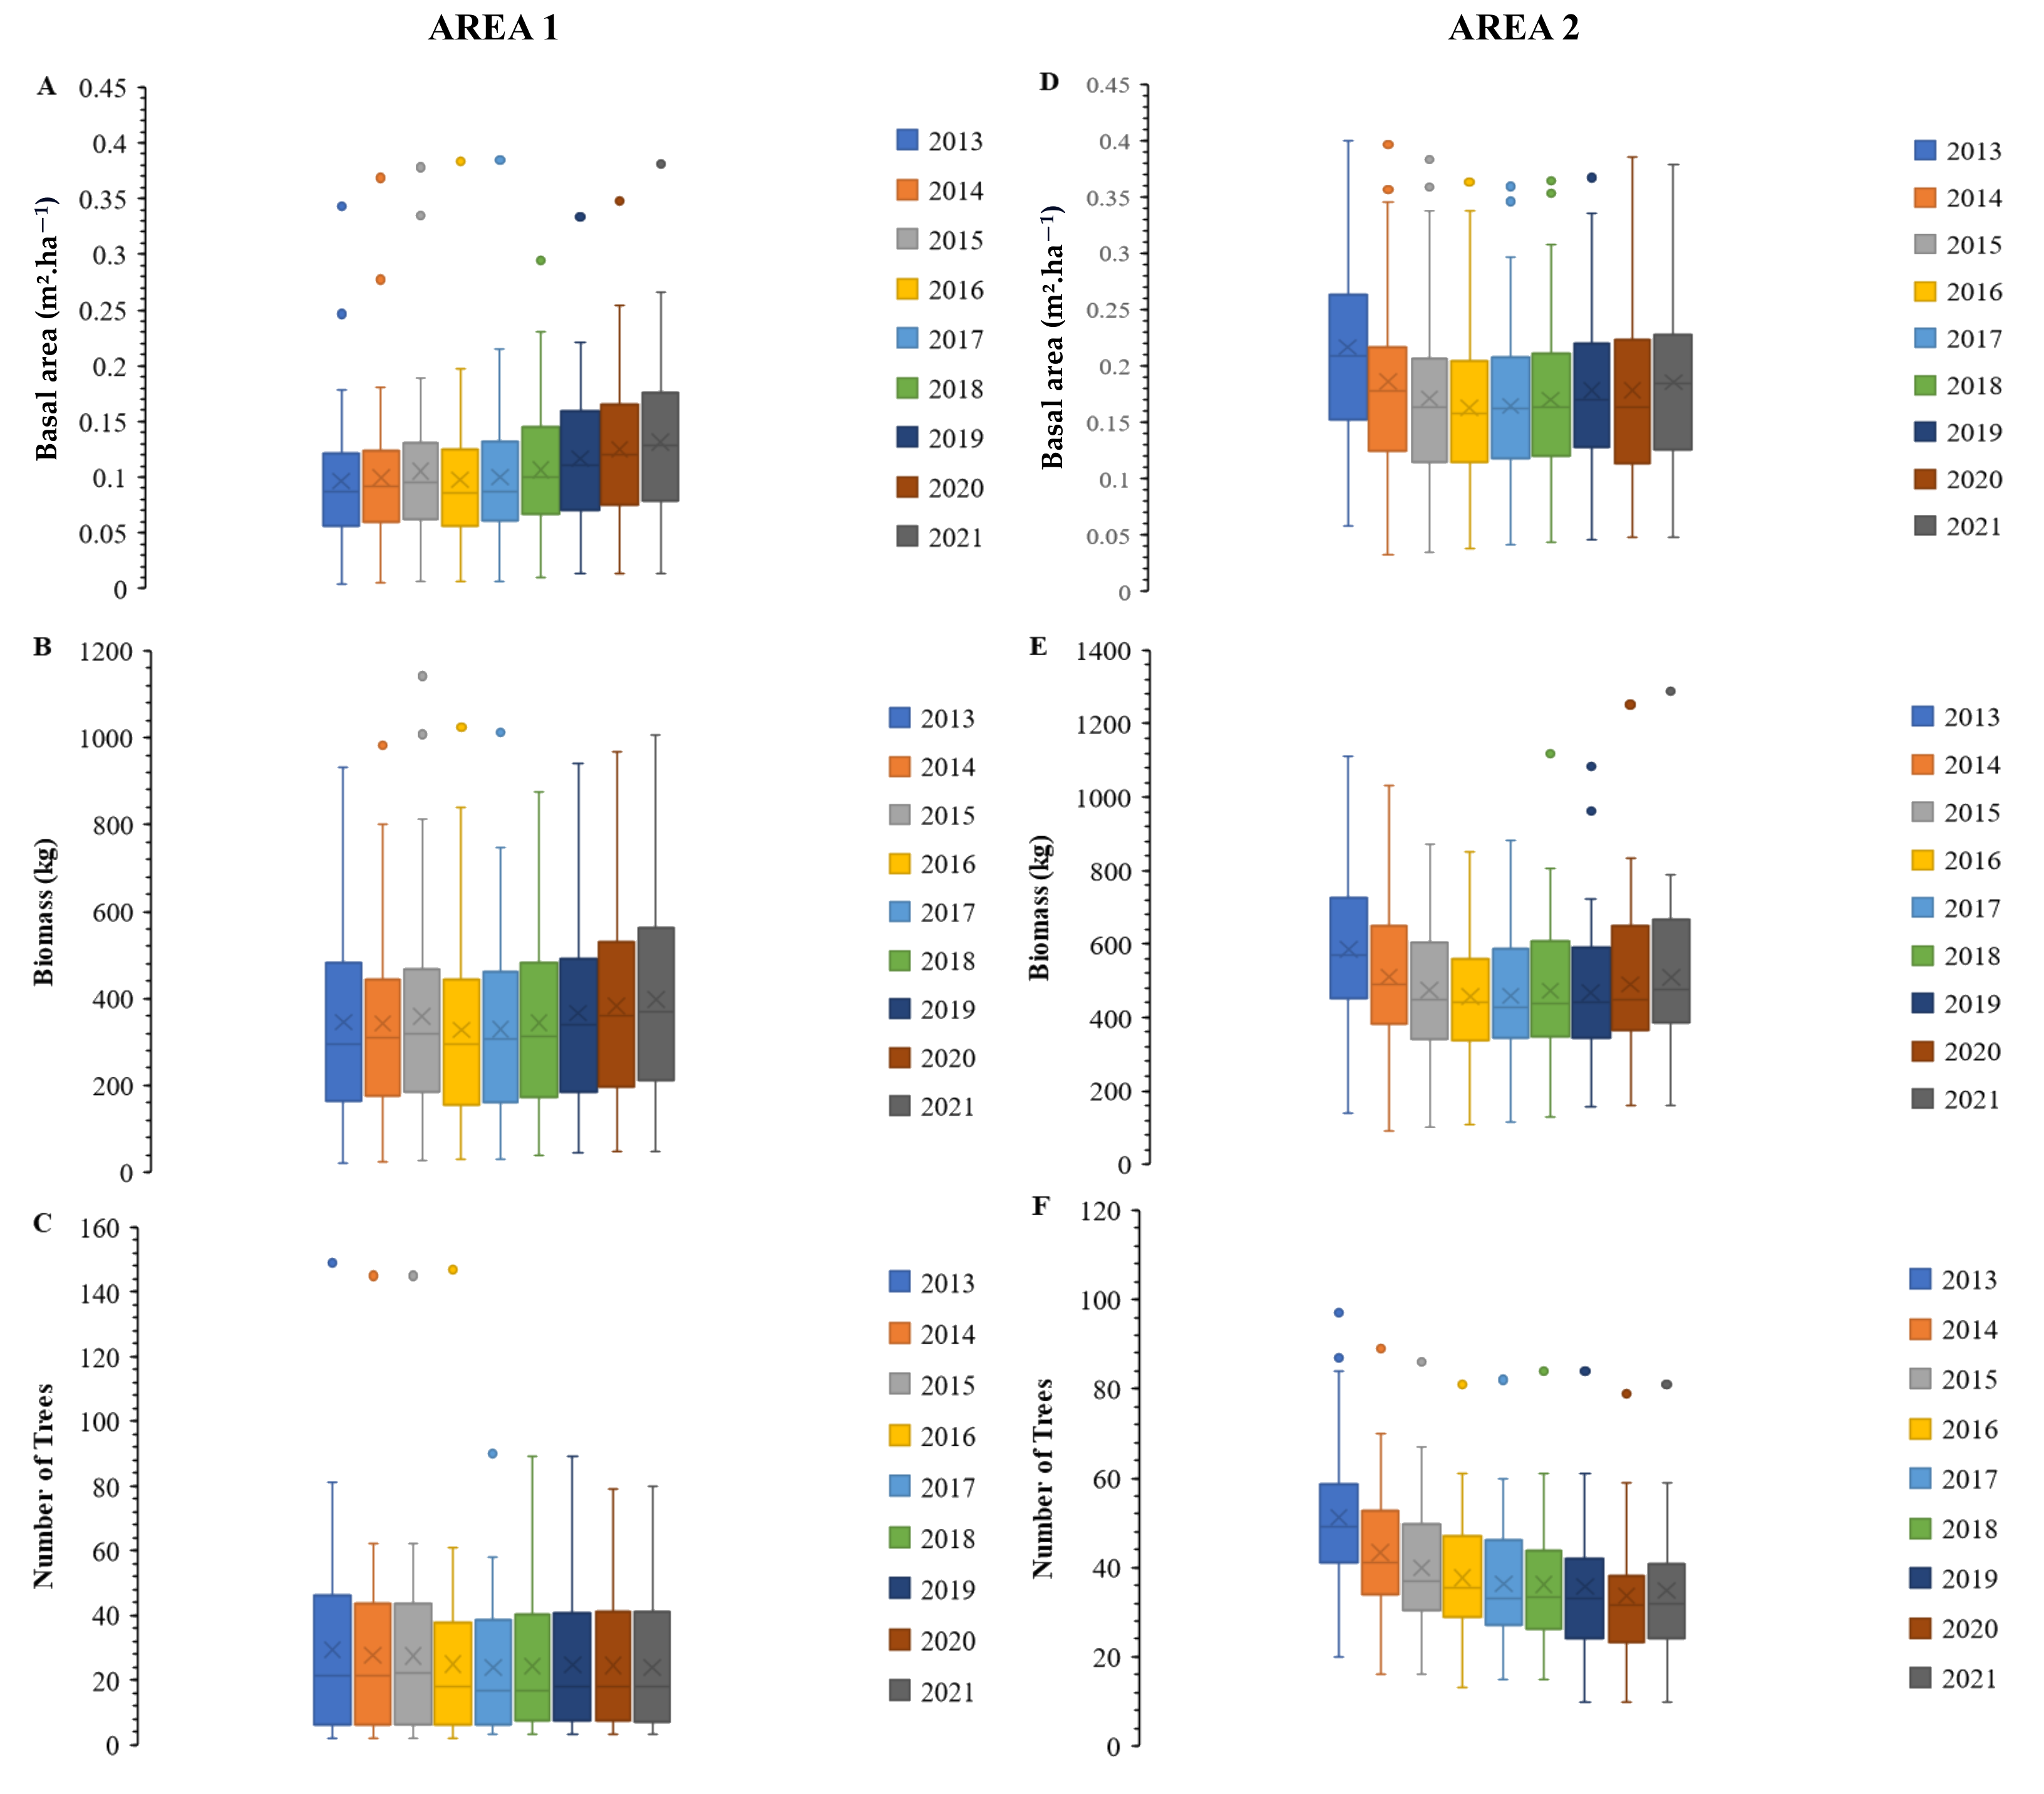
It is observed that the basal area values were higher in Area 2 (Figure 2), which is considered the most conserved area without a history of exploitation for over 50 years. However, over the studied years, these values have been decreasing (Figure 2D). This result may be associated with tree mortality, as the study period coincides with the occurrence of intense drought events in the region (2012–2019). This could have resulted in higher evapotranspiration rates and, consequently, a negative water balance for the plants [48,49].
Such results are observed in the study by Costa Júnior et al. [50], who analyzed the vegetation dynamics in the same study area and noted high mortality between 2008 and 2019. However, the opposite can be observed for Area 1, which showed an increasing average basal area between 2013 and 2021 (Figure 2A). This can be explained by the mechanical clearing of the vegetation in 1987, which initiated a process of natural regeneration with a lower tree density. According to Dale et al. [51], a lower tree density can have significant effects on tree development, as the increased spacing between trees can reduce competition for resources such as water, nutrients, and space, thereby promoting survival and growth even after drought events.
A similar result to the basal area was observed for biomass, with increasing production recorded in Area 1, with an average varying from 345 kg to 398 kg between 2013 and 2021, respectively (Figure 2B). Considering that light is an essential factor for photosynthesis, the process by which plants convert solar energy into chemical energy necessary for their growth and development, a greater amount of light, enhanced by the lower tree density in Area 1, may have boosted the photosynthetic rate of the plants. This resulted in an increase in carbohydrate production and, consequently, in the growth and production of biomass [52,53].
In this context, the higher tree density combined with the drought period recorded for the study region may have led to a decrease in biomass production in Area 2 (Figure 2E). This is because, in semi-arid regions, water availability is the main limiting factor for biomass increase [54]. Thus, considering the consecutive drought periods in the region, the continuous water scarcity may lead to an increase in tree and shrub mortality [55]. This occurs because, during drought periods, trees have adaptation mechanisms to cope with water deficit, such as closing stomata in the leaves and temporary leaf loss (deciduousness) to reduce evapotranspiration [56]. However, when climatic conditions exceed the plants’ tolerance limits due to increased temperature, vapor pressure, and water deficit [57], the probability of tree mortality can increase, negatively affecting biomass production, as observed in the study area.
Regarding tree density, Area 1 maintained an almost constant average (Figure 2C), while Area 2 registered a reduction in tree density between 2013 and 2021 (Figure 2F). The reduction in tree density results from a mortality rate higher than the recruitment rate, as these rates are strongly influenced by climate seasonality and consecutive years of drought [58]. In this sense, the decrease in plant density from 2013 to 2020 in Area 2 can be explained by the droughts that occurred in the region from 2012 to 2019 [49,59].

3.2. Analysis of Vegetation and Water Indices

The NDVI values ranged between −0.10 and 0.40 from 2013 to 2021 (Figure 3). Analysis of the NDVI thematic maps reveals values corresponding to different types of land cover and use over the time series in the study area. Water bodies, exposed soil, roads, deforested areas, and other non-vegetative cover [35] are represented by negative pixel values, ranging from −0.10 to −0.01 (pixels in red tones). Environments with denser vegetation exhibit green tones, with NDVI values close to the maximum recorded for the area (0.40). These high NDVI values, even during dry scenarios, are related to areas with a more humid surface and subsurface hydrological conditions, such as areas near rivers and streams, which can sustain native perennial species and invasive exotic species like Prosopis juliflora (Sw) DC) [60,61]. However, most of the studied area recorded values below 0.40, these environments being occupied by vegetation typical of dry forests that tend to lose their leaves during the dry season and are still susceptible to the effects of intense droughts common in the region [20,23,62].
The NDVI provides a comprehensive measure of vegetation health and status, being one of the first remote sensing-based indicators used for drought detection and monitoring [37,63]. The spectral changes associated with this index are related to vegetation patterns, which are strongly influenced by rainfall regimes and moisture conditions in semi-arid regions. In this sense, considering that rainfall plays a fundamental role in the resilience and seasonality of natural vegetation cover in dry forest environments, and consequently the spatio-temporal behavior of the NDVI [20,23,64,65], the results for the NDVI observed in the present study can be associated with the water deficit common to the region.
According to observations by Marengo et al. [66], the Caatinga biome is considered one of the Brazilian ecosystems most susceptible to climate change. This is due to low rainfall levels, which exacerbate environmental degradation and make native vegetation more vulnerable. This is in line with the results obtained in this study, especially for the years 2013 and 2017 when NDVI thematic maps showed a predominantly reddish coloration (Figure 3), coinciding with periods of extreme drought in the region and, consequently, reduced water supply to plants. Similar findings are noted in the study by Silva et al. [20], which highlights that from 2016 to 2018, there was lower resilience in areas with natural vegetation in the Caatinga, in the municipality of Capoeiras-PE, with NDVI values below 0.642 when compared to other years.
In 2020, there was a smoothing of the reddish coloration across the entire study area, indicating higher NDVI values, especially around Area 1, which during rainy seasons has the characteristic of retaining a greater amount of water in the soil, providing greater water availability for plants throughout the year. These results indicate the sensitivity of NDVI to climatic variability in dry forests. Several studies using NDVI in semi-arid regions show sensitive monitoring of vegetative biomass and photosynthetically active vegetation covers [20,23,67,68,69].
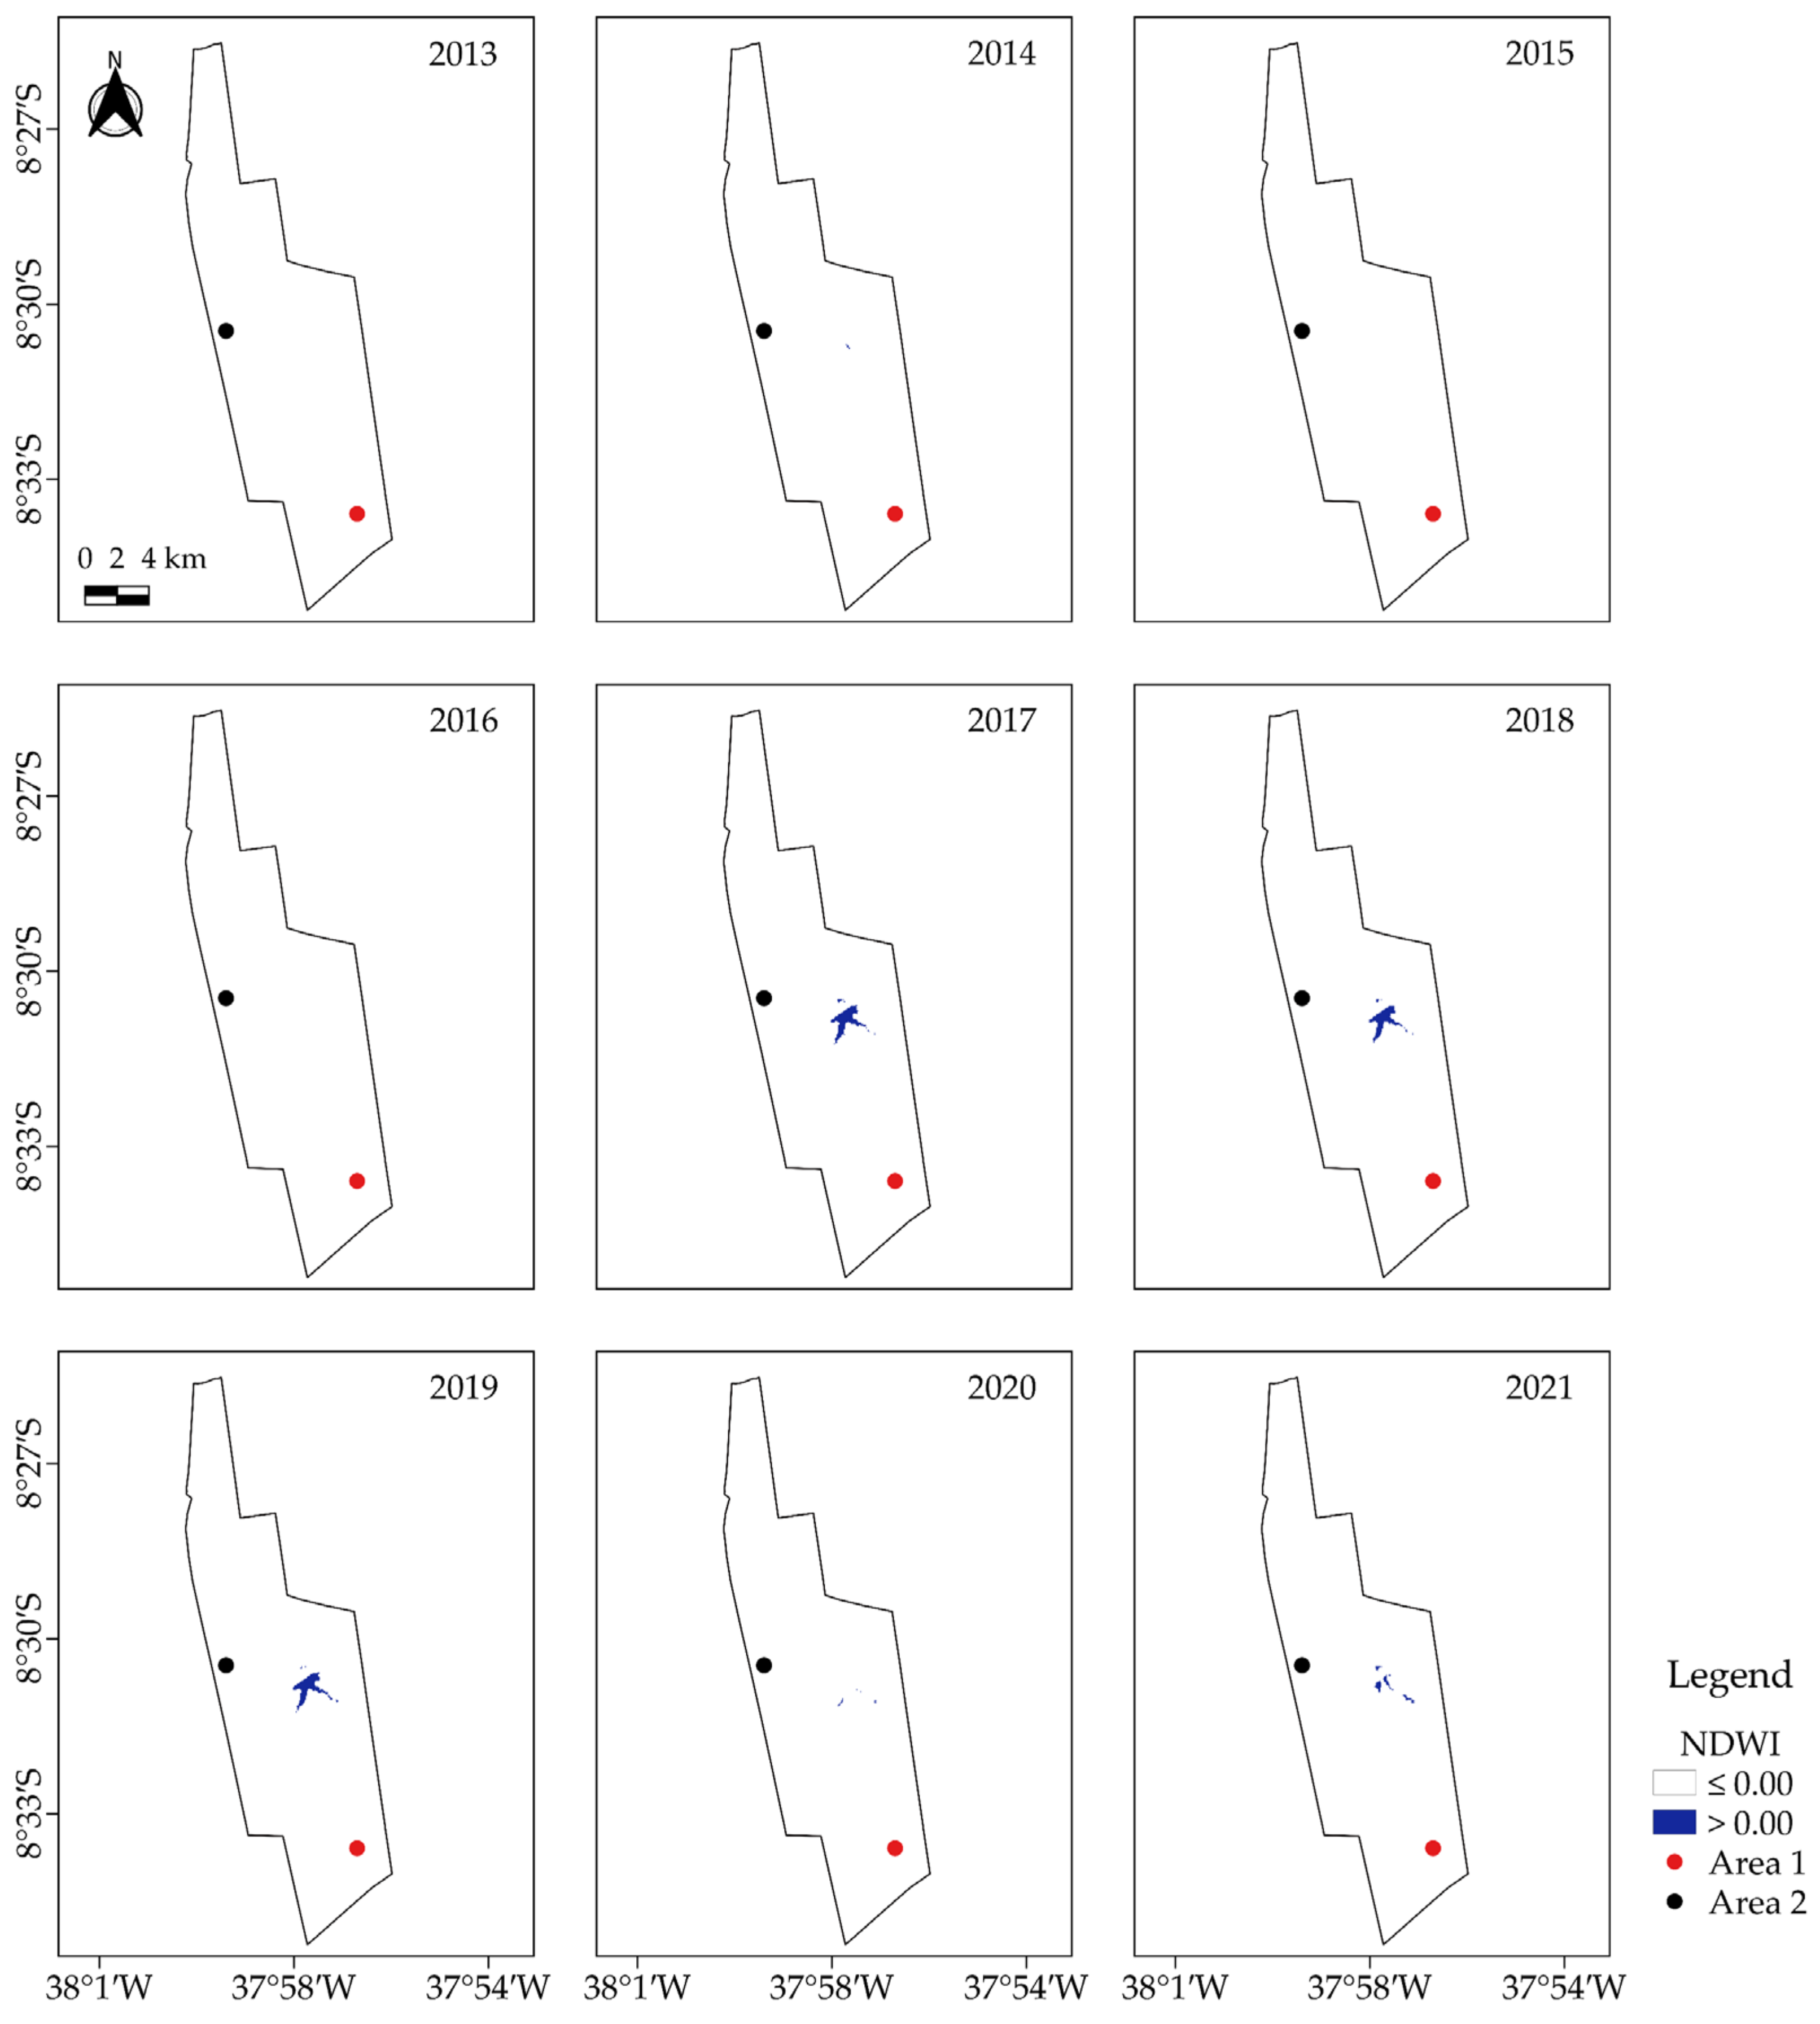
It is possible to observe that for NDWIveg, the values ranged from ≤0.00 to >0.00 (positive and negative) during the period from 2013 to 2021 (Figure 4), with a predominance of negative values in the study area. Considering the time of year when the images used for index processing were obtained, the low water content in the area can be explained by the region’s dry season. As highlighted by Costa Júnior et al. [50], assessing the climatic variability of the municipality of Ibimirim-PE, 40 km from the study area, the precipitation recorded in the region for the months of September and October is less than 20 mm.
In 2020, the spectral response of vegetation assessed based on NDWIveg indicated a higher presence of water in plants (Figure 4). It is important to emphasize that in this year, the northeast region of Brazil was affected by the strong La Niña climatic event [70], which has the main effect of increasing rainfall volume in the region even during the considered dry season [71,72,73], justifying the result indicated by NDWIveg. However, between the years 2012 and 2019, events of drought with greater intensity and duration of the last 60 years were recorded in northeast Brazil, mainly in the semiarid region, resulting in a high water deficit and consequent stress for vegetation [23,74,75]. In this sense, based on the statements made by Silva et al. [76], successive episodes of increasing and decreasing rainfall can result in a higher degree of irregularity in rainfall dynamics and, therefore, in higher entropy values.
The low NDWIveg values recorded Indicate a degradative process of native vegetation over the years. Considering the study by Lastovicka et al. [19], where NDWIveg was particularly useful for detecting disturbed forest and forest recovery after beetle outbreaks, it also provided relevant information about forest health. For the study conditions, the authors observed that undisturbed areas showed NDWIveg values ranging from 0.37 to 0.69, while affected or recovering areas exhibited significantly lower values ranging from −0.12 to 0.28. These results suggest that vegetation in the study area may have been impacted by a physiological disturbance associated with drought, as observed in the evaluated time series.
Through NDWI, it was possible to identify variations between positive and negative values during the period from 2013 to 2021 (Figure 5). In the thematic maps generated from NDWI, there is only a small strip of positive value, characterized in the pixels of the geospatial maps as areas of minor water coverage, such as environments with some moisture condition around rivers, lakes, and reservoirs [23].
In monitoring and quantifying vegetation change patterns and water coverage areas by determining physical–hydrological parameters in the northeast region of Brazil, Silva et al. [23] considered exposed soil, agriculture, and Caatinga vegetation cover when NDWI ranged between −0.2 and −0.01, similar to the present study. Additionally, according to Marin et al. [11] and Reis et al. [12], ecosystems in this region are adapted to water scarcity conditions and hot summers. However, in 2012, the onset of one of the most severe droughts ever recorded in the semiarid region of northeast Brazil led to the rapid depletion of vegetation water, which persisted and intensified until 2019 [35], resulting in reduced water availability for plants in the region, consistent with observations in NDWIveg thematic maps (Figure 4) and NDWI (Figure 5).
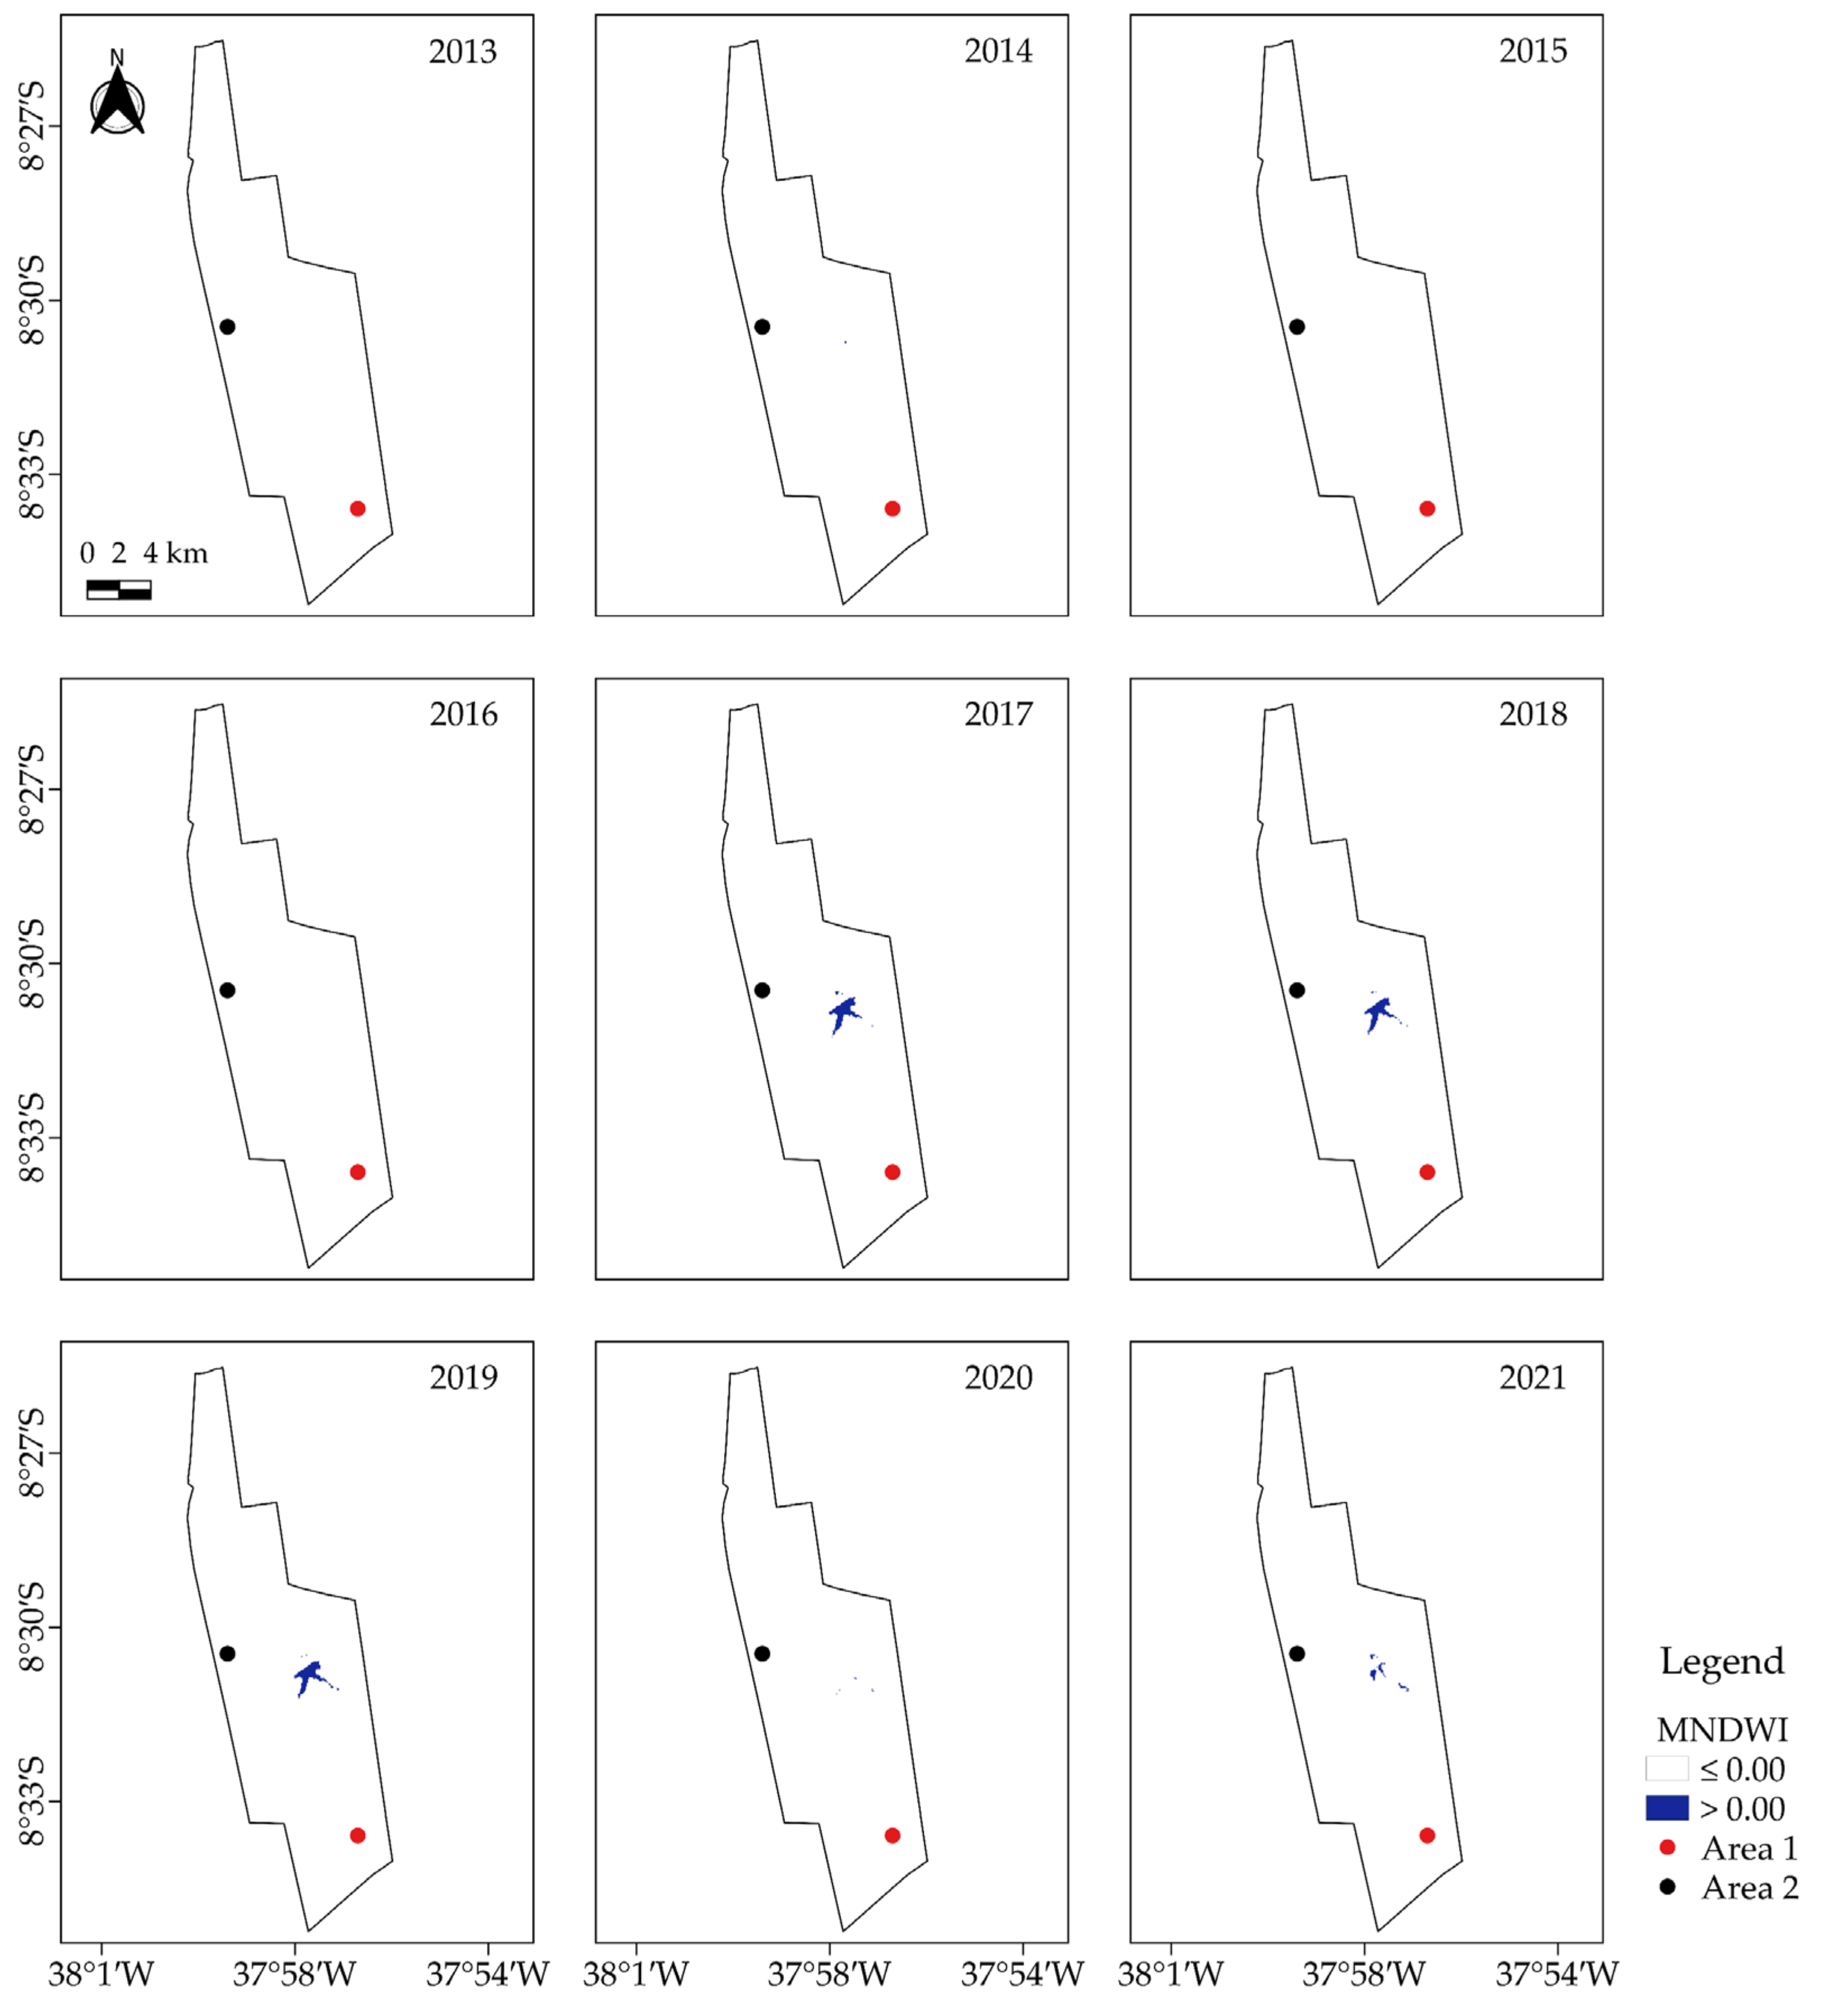
Negative values for MNDWI, similar to NDWI, were considered as exposed soil, agriculture, and Caatinga vegetation cover (Figure 6). In the thematic maps of MNDWI, a characteristic of homogenizing agricultural and vegetation cover areas is highlighted, whereas for characterizing water bodies, MNDWI shows greater sensitivity in characterizing water bodies than NDWI, as already observed by Silva et al. [23]. In this sense, in the spatio-temporal analysis of MNDWI, it was possible to identify water bodies, especially in the environment located in the central region of the study area in the year 2017, which emerged because of the São Francisco River transposition project. This result can be explained by the observations of Titolo [77]. Studying artificial reservoirs using water indices, the authors mentioned that no pixels were incorrectly recorded in water when using the MNDWI equation, highlighting its efficiency and precision compared to other water indices.

3.3. Mann–Kendall Trend Analysis of Field Parameters and Indices Analyzed

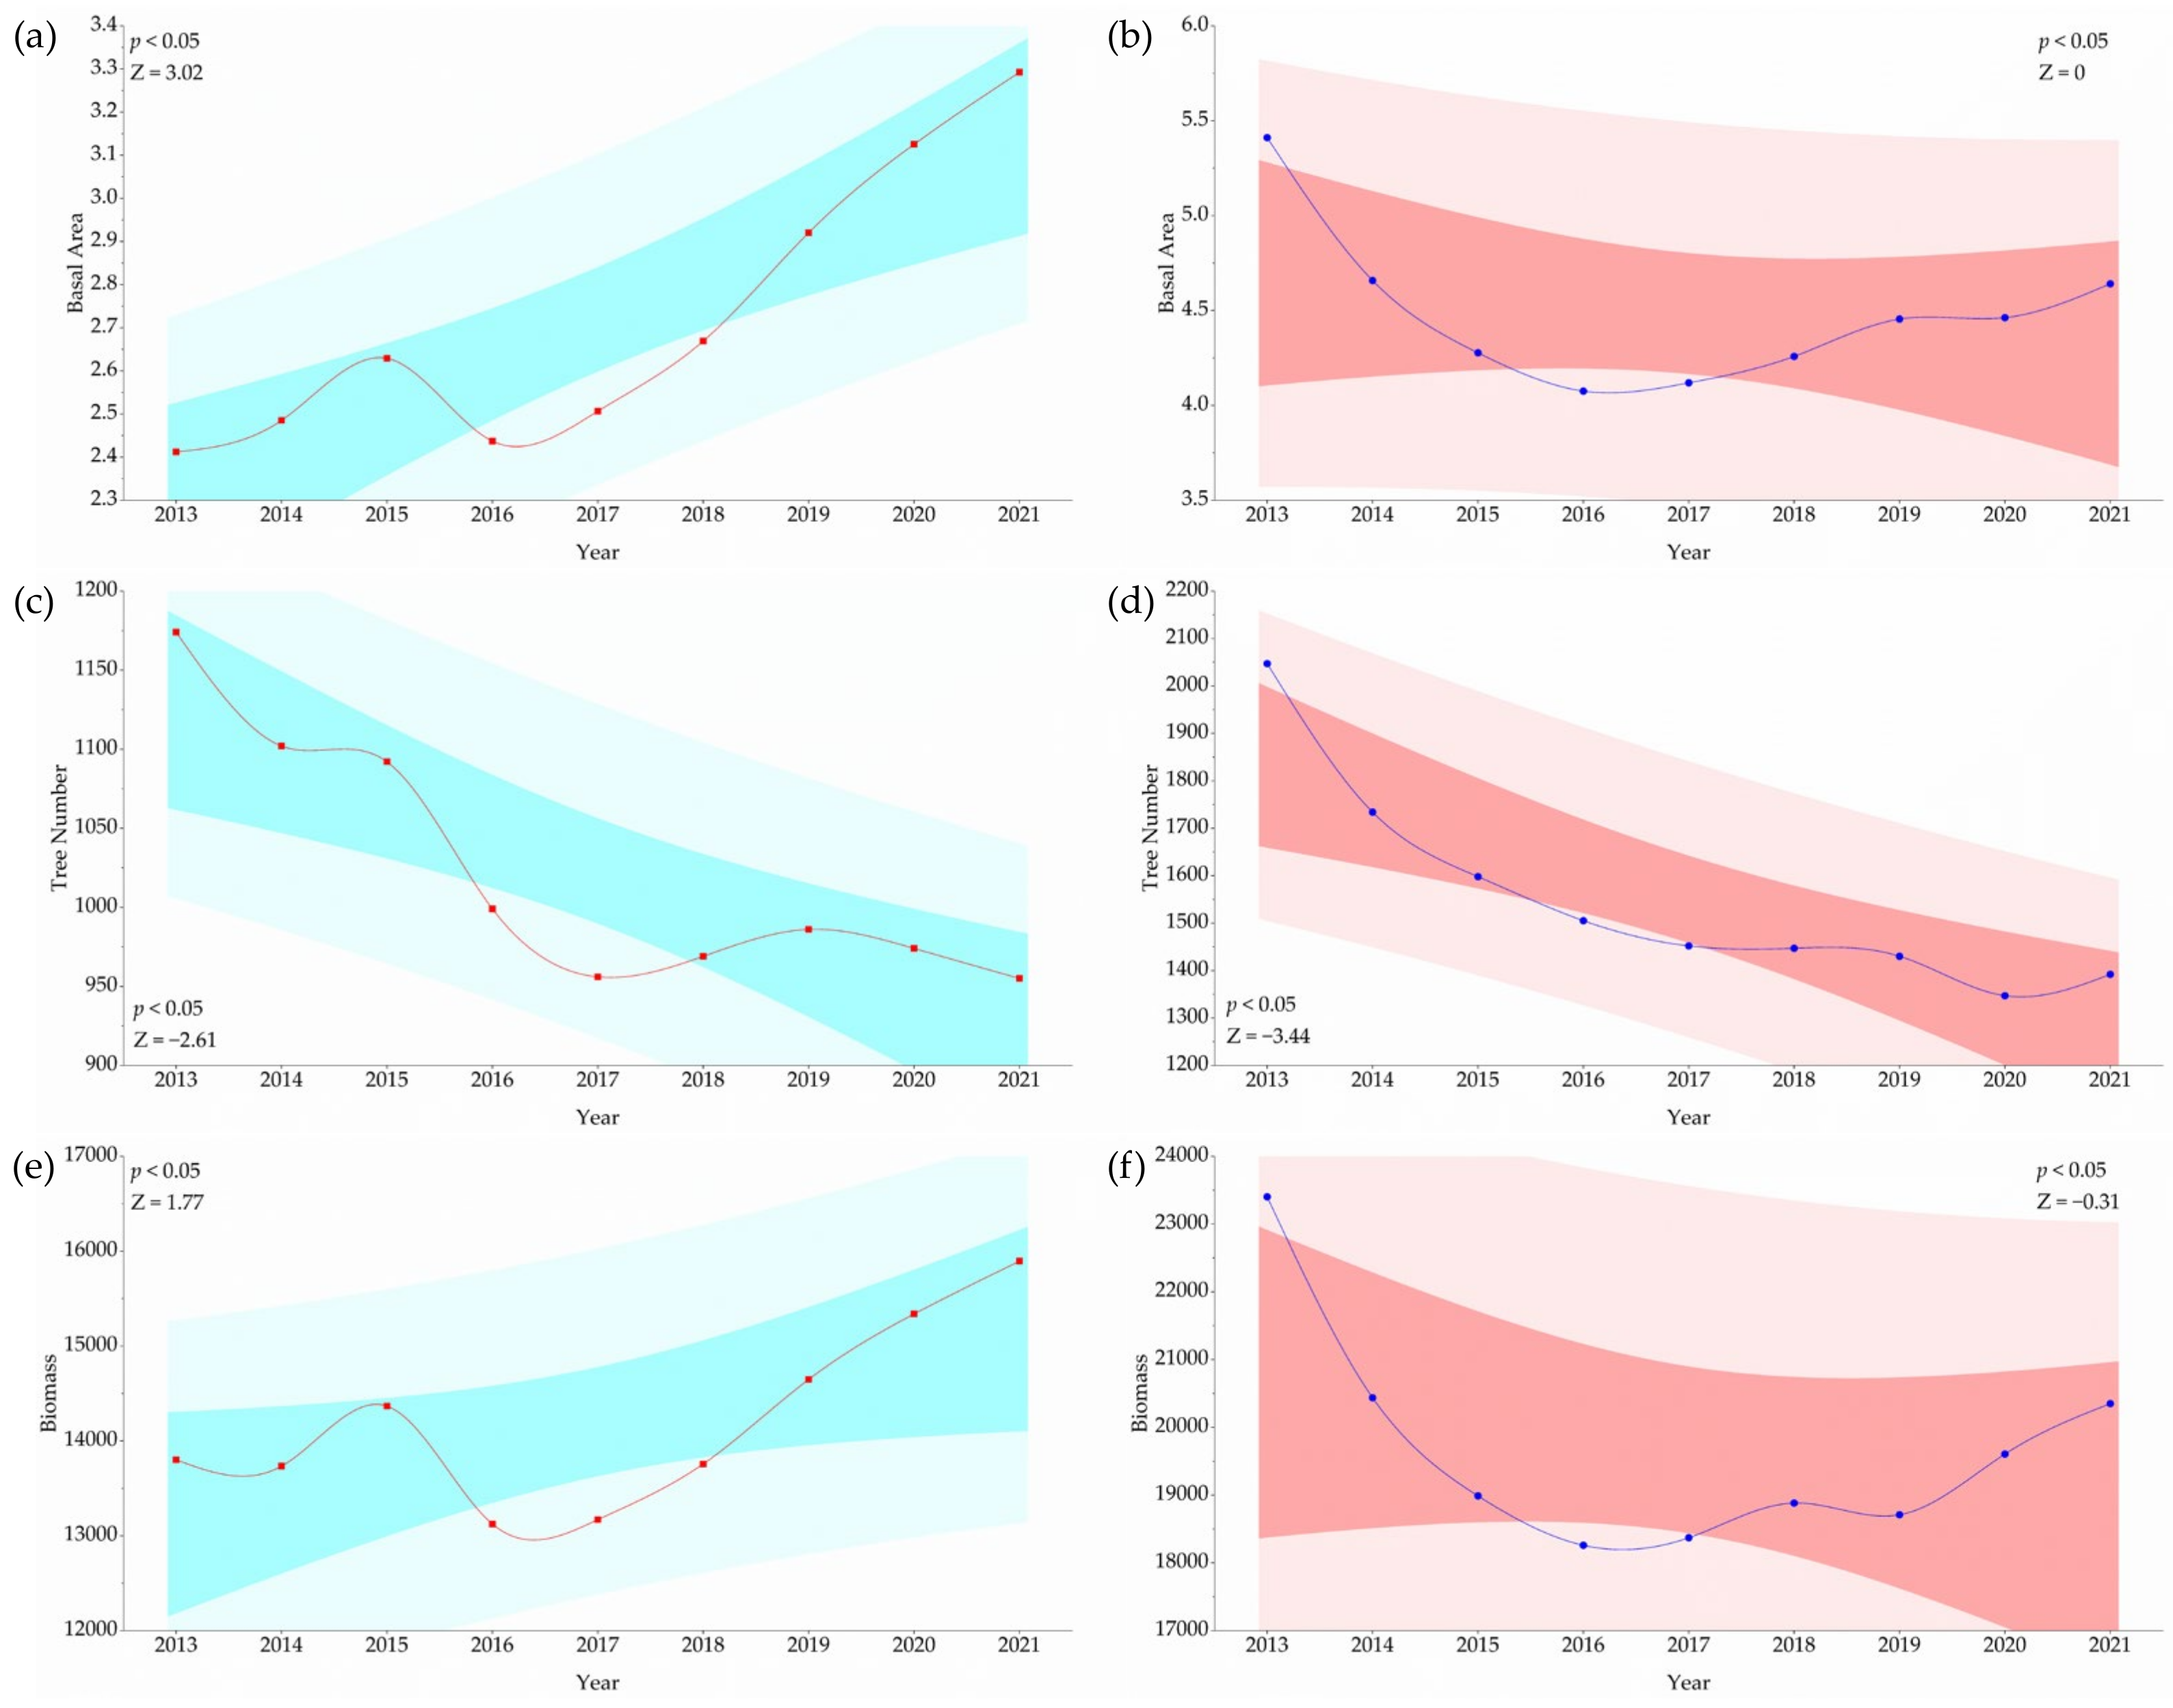
Based on the adopted 95% confidence level (|Z| > ±1.96), the basal area (m2.ha−1) showed a strong increasing trend (|Z| = 3.02), indicating that the trees in the area’s vegetation exhibited diameter growth (Figure 7a). Positive Mann–Kendall values indicate an upward trend, while negative values indicate a declining trend. This result can be attributed to the regeneration process the area is undergoing, with lower plant density following the mechanical clearing carried out about three decades ago. However, for Area 2 (Figure 7b), there was no trend observed significative. These results likely reflect the vegetation’s response to the severe droughts recorded between 2012 and 2016 in the semi-arid region of Brazil [49], which was more pronounced in Area 2, where there was higher plant density and, consequently, greater competition for water resources (Figure 2). Under conditions of water deficit, mortality exceeds recruitment, disrupting the dynamic vegetation system.
The higher tree mortality compared to recruitment in the vegetation can also explain the negative trend in the number of trees observed in both areas (Figure 7c,d). This phenomenon is concerning because the lack of tree recruitment in areas experiencing mortality rates is characteristic of a degrading process without area recovery. In dry tropical forests, such as the study areas with open vegetation and greater exposure to solar radiation, the effects of drought on vegetation are intensified, leading to severe tree mortality, often caused by hydraulic failure [78]. The risk of hydraulic failure increases proportionally with the exposure of the canopy to light and heating, being more intense in open vegetation. These risks are associated with the plants’ response to water deficit caused by drought events, causing them to close their stomata to prevent hydraulic failure. However, this process can result in a carbon deficit, causing the plant to “starve” [79]. Regarding biomass production, this showed a negative trend for both areas; however, the values of |Z| less than −1.96 indicate that this trend is not significant at 95% confidence level (Figure 7e,f).
The values of MNDWI and NDWI, indices sensitive to identifying the presence or absence of water bodies, showed negative trends with negative |Z| values for both study areas (Figure 8b–d), except for MNDWI in Area 1, which showed a positive trend (Figure 8a). However, only the negative trend for NDWI in Area 2 was significant at the 95% level. These results can be easily explained by the severe droughts recorded in the region between 2012 and 2016 [49], which drastically reduced the presence of water bodies in the study area. Regarding the index’s sensitivity to vegetation response, NDWIveg and NDVI generally showed a positive trend (Figure 8e–h). However, this trend was only positive for NDWIveg and NDVI in Area 2, which may be related to the higher tree density observed when analyzing the number of trees (Figure 2F and Figure 8d), resulting in higher vegetation reflectance and consequently higher values for the analyzed indices.

3.4. Regression Analysis

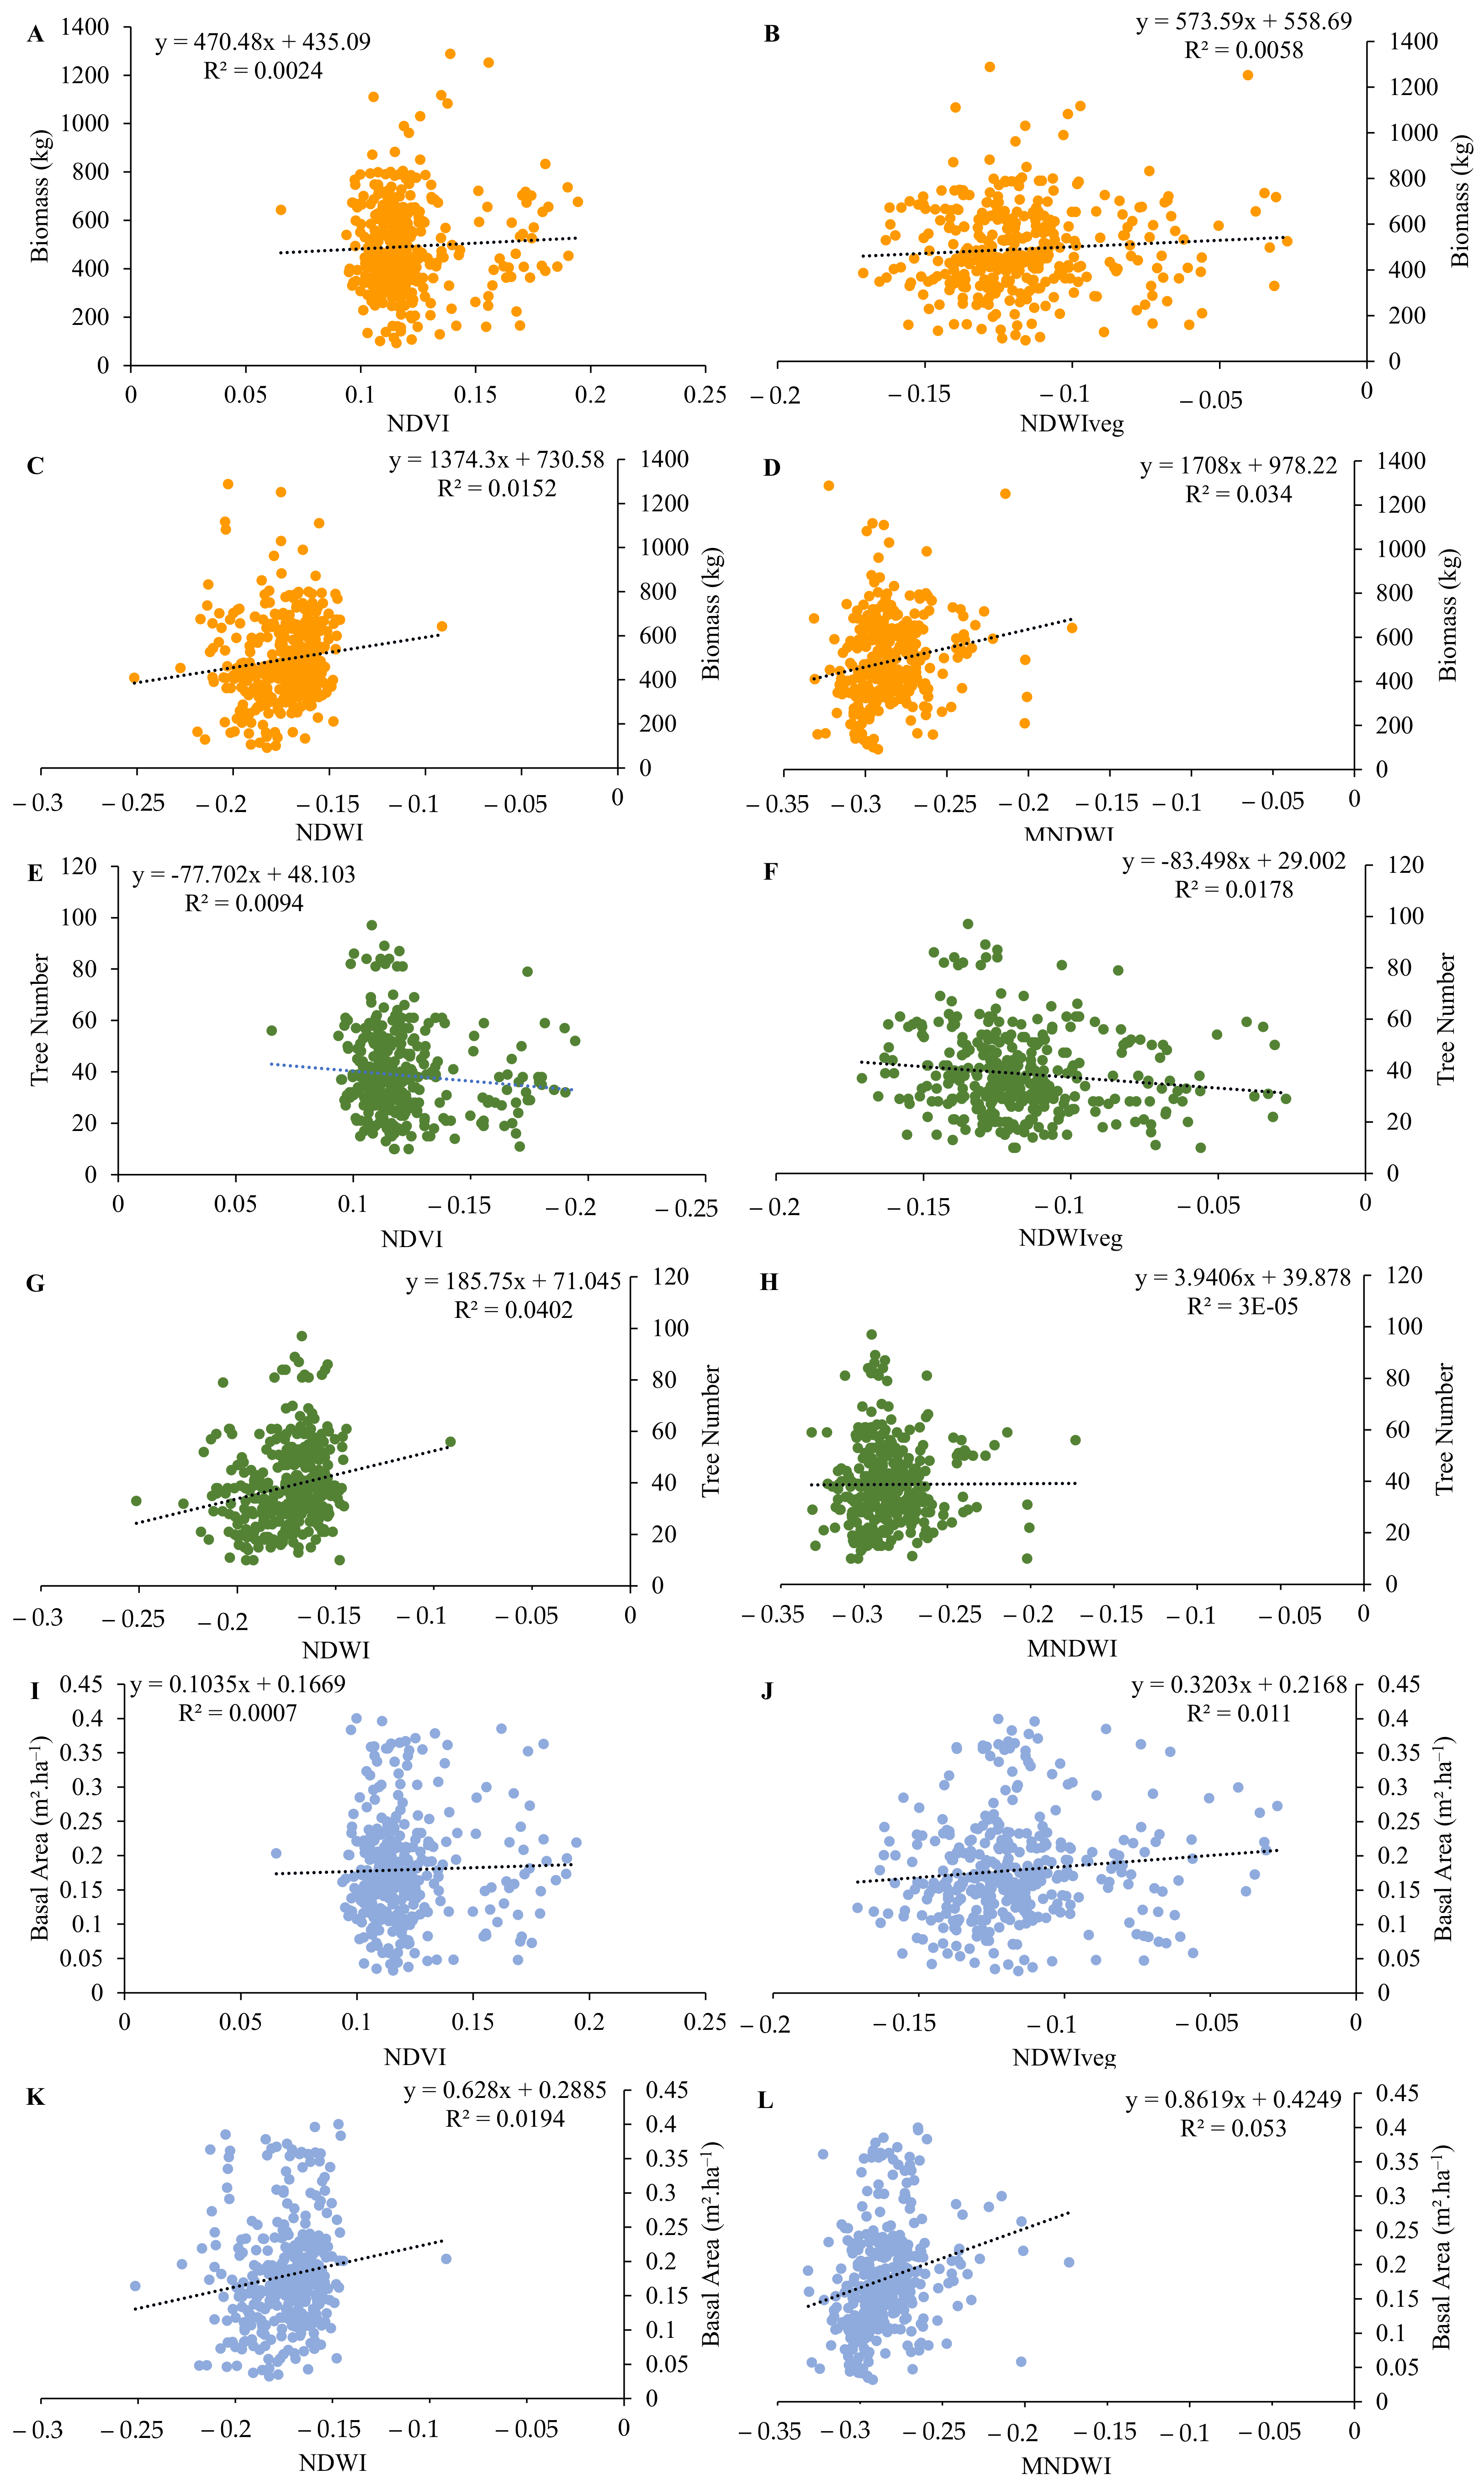
The vegetation indices of the images evaluated in this study did not show considerable predictive power for basal area, tree number, and biomass for the two experimental areas, based on the correlations observed in Figure 9 and Figure 10. The low correlation observed in NDVI, NDWIveg, NDWI, and MNDWI mainly occurs because the analysis was conducted during the dry period of each year when rainfall is low or absent in semi-arid regions. As a result, there is a significant reduction in the photosynthetic rate of plants, as well as in their vegetative vigor and biomass. Consistent with the results observed in this study, Barros Santiago et al. [80], who used biophysical indices and water indices from orbital products in the Araripe National Forest, at the border of Pernambuco and Ceará, highlight that the application of NDVI and NDWI during dry periods showed low values for vegetation characterization. Similarly, Serrano et al. [81], who applied NDWI to characterize pasture vegetation in the semi-arid region of southern Portugal (annual average between 400 and 600 mm), report that NDWI is efficient in characterizing water bodies in vegetation, but during the dry season, this index is not representative.
It is important to note that the use of indices to characterize water bodies in the soil and vegetation during the dry season in semi-arid regions requires careful analysis. The application of these indices for large semi-arid regions is well-represented, as discussed by Silva et al. [20] and Melo et al. [82], who applied biophysical indices to characterize soil and vegetation degradation in semi-arid regions. Similarly, Silva et al. [23] applied biophysical indices and water indices to characterize the Brazilian semi-arid region using orbital data from the MODIS sensor. These authors highlight the efficiency of applying NDVI and NDWI, for example, to characterize the vegetation of semi-arid regions during dry seasons, as well as the response of FTSS, showing the dynamics of water in the vegetation and soil of these regions.

3.5. Principal Component Analysis (PCA)

According to the Kaiser–Meyer–Olkin (KMO) adequacy test for principal component analysis (PCA), the components for Areas 1 and 2 showed a moderate fit (KMO between 0.70 and 0.79), with KMO values of 0.721 and 0.732, respectively (Table 3). As for the Bartlett test, both PCA analyses showed significant results in both areas (p-value < 0.01). Based on these results, the PCA established in this study is adequate for characterizing and representing the analyzed variables. Pandorfi et al. [83] highlight the importance of using the KMO test for sampling adequacy, where the authors validated their results with a KMO value of 0.70. Additionally, significance in the Bartlett test is crucial (<0.01) for representing the stability of the established PCA, according to the authors.
Based on the adequacy of the data sampling, the principal components (PCs) were established for Areas 1 and 2, respectively. According to Table 4, the eigenvalues, variances, and cumulative variances of the variables for the established PCs in this study are presented. It is noted that six PCs were generated, but only the first three components have significant informational load to be analyzed in this study. According to Kaiser [45], PCs only possess significant informational load if they have an eigenvalue above 1. Therefore, only PCs 1, 2, and 3 meet the criterion established by Kaiser [45], with eigenvalues of 2.70, 2.06, and 1.62, respectively, for Area 1, and 2.57, 2.29, and 1.26, respectively, for Area 2. Corroborating the results of this study, Melo et al. [82], when analyzing the degradative effects using biophysical indices in the dairy basin of the state of Pernambuco, highlighted that the correlation between the biophysical indices observed through principal component analysis was significant, with an eigenvalue of 2.949 for PC1.
Regarding the cumulative variance of the PCs, six components were established, which together account for 100% of the explanatory variance of the dataset. However, for plotting the component graph, only PCs 1 and 2 are used, with their cumulative values for these two in Areas 1 and 2 being 67.89% and 69.40%, respectively. Supporting these findings, Silva et al. [84], who utilized biophysical indices via Sentinel-2, soil physical data, and morphometric variables of forage palm, reported that PCs 1 and 2 exhibit the highest variance rates and are therefore recommended for generating the component graph.
Total accumulated variance values above 50% are representative, as evidenced in a study by Silva et al. [84], which focused on soil physical attributes, biophysical indices, and morphometric variables of cacti in the semiarid region of northeast Brazil. Their study observed that total variance values ranging from 50% to 60% of the total accumulated variance of the principal components were sufficient to significantly observe correlations between variables and to predict a model for estimating cactus leaf area in a semi-arid region.
It is noted that both the NDVI and NDWIveg showed strong correlations (>0.80) for both study areas (Figure 11a–d), which is because both indices are directly proportional. Additionally, it can be observed that the year 2020 was the most representative for NDVI and NDWIveg, mainly influenced by the extreme La Niña effect that affected the entire northeastern region of Brazil [70]. Corroborating the results observed in this study, an analysis of the spatio-temporal variability of rainfall and the occurrence of extreme rainfall events in the state of Pernambuco by Silva et al. [73] highlights that the year 2020 was atypical with anomalies in the intensity of extreme rainfall.
A correlation is observed between biomass, basal area, and tree density for both study areas, regardless of the year of study. This effect occurs due to the correlation of biomass with the variables, meaning that the greater the density and basal area, the higher the estimated biomass in the field. This result is expected, as the biomass behaves similarly when the tree density increases or decreases in an area since more or fewer trees contribute to the total production of organic matter [85]. Basal area is related to the size and density of the trees, and these factors directly influence the amount of accumulated biomass [86]. Furthermore, the basis for calculating basal area is the tree diameter at 1.30m above the ground, which is also a component in all equations used in the estimation (Table 1).
From the observations made in the principal component analysis (Figure 11), it is noted that the years 2013 to 2019 and 2021 did not show directly proportional differences in the physical–hydric parameters on the surface recorded for Area 1 (Figure 11a,b) and Area 2 (Figure 11c,d). This period includes the great drought in northeastern Brazil from 2012 to 2016, which extended until 2019. Corroborating the results of this study, Silva et al. [35] report the effects of the great droughts in northeastern Brazil through the NDWI and highlight that the droughts continued until 2019.

3.5.1. Principal Component Regression (PCR)

Area 1

Table 5 presents the correlation matrix by PCs of the variables studied with the six components established in Area 1. It is noted that from PC4 onwards, the correlation values of the variables are almost null, which is consistent with Table 4, where the eigenvalues from PC4 onwards are less than 1, indicating almost no contribution of these components to the set of variables studied. On the other hand, PCs 1, 2, and 3 showed variables with significant correlation loads, where high positive correlations of one or more variables indicate that these variables are strongly correlated with each other.
In Principal Component 1 (PC1), the variables basal area, tree number, biomass, NDWIveg, and NDVI showed significant correlations with values of approximately 0.85, 0.73, 0.89, 0.50, and 0.51, respectively. In PC2, residual information is generated, as stated by Kaiser [45], where we observed higher inversely proportional correlations in the variables NDWI and NDVI, with respective values of 0.89 and −0.81. In PC3, the variables MNDWI and NDWIveg exhibited strong proportional correlations with values of approximately 0.92 and 0.73, respectively.
In Table 6, the principal component regression (PCR) results are presented for the response variables basal area, tree number, and biomass. For all three response variables, the component that best fit the variables was PC1, with coefficients of determination (R2) values of 0.73, 0.53, and 0.80, respectively. The regressions were highly significant (p-value < 0.01) for all variables in question.
Based on the observations from Table 6, the component that best represents the established response variables for predicting multiple regression models was determined. Consequently, the predictor variables that showed the highest correlation with the response variables were the vegetation indices NDWIveg and NDVI (Table 5).
The analysis of variance (ANOVA) for each of the multiple models for basal area, tree number, and biomass response variables is presented in Table 7. All models had a p-value < 0.01, indicating significance. However, the R-squared values were low for each response variable, with values of 0.04, 0.02, and 0.02 for basal area, tree number, and biomass, respectively. It is evident that, consistent with the findings from a simple regression (Figure 9), the models developed using principal component analysis to identify physical–hydrological predictors for each response variable (basal area, tree number, and biomass) performed unsatisfactorily. As noted by Oliveira et al. [47] in their modeling of biomass and carbon stock using LiDAR metrics in dry tropical forest areas of Brazil, principal component regression showed the lowest R-squared values among the regression techniques analyzed.

Area 2

In Table 8, it is possible to observe that, similar to Area 1 starting from PC4, the correlation values of the variables are almost null. It is noted that in these cases, the eigenvalues are less than 1, indicating a minimal or nearly negligible contribution of these components to the regression. On the other hand, primarily PCs 1 and 2, and for some variables PC 3 (MNDWI and NDWI), exhibited variables with high correlation loads, indicating a strong correlation among these variables.
In Principal Component 1 (PC1), the variables NDWIveg, NDWI, and NDVI showed significant correlations with values of 0.92, −0.78, and 0.92, respectively. In PC2, inverse proportional correlations are observed, where the variables basal area, tree number, and biomass had higher loadings with values of 0.82, 0.68, and 0.93, respectively. PC3 exhibited strong proportional correlations between the variables MNDWI and NDWI, with values of 0.77 and 0.54, respectively. It is evident that for the dataset obtained in Area 2, the correlation loadings for the variables in each PC were defined differently between the physical–hydrological indices and the field variables.
Table 9 presents the statistical values for principal component regression (PCR) for each response variable (basal area, tree number, and biomass). For all three response variables, PC2 provided the best fit, with coefficients of determination (R2) of 0.67, 0.46, and 0.86, respectively, for basal area, tree number, and biomass. The regressions were highly significant (p-value < 0.01) for all analyzed variables.
As observed in Table 8, there is no significant correlation between the response variables and the predictor indices in PC2, nor in any of the other components. This result is consistent with what was observed in the simple regression results (Figure 10), which indicated low predictive power of the evaluated indices to estimate the response variables. These findings, along with the low R2 values in the proposed regressions also for Area 1, support the hypothesis that the sensitivity of the indices to the presence and absence of water, combined with the fact that the analyzed images and raw data are from the dry period of each evaluated year (2013 to 2021), complicates the adequacy of the dataset for regression analyses. Therefore, we recommend future studies to better understand the correlation between field-obtained data and physical–hydrological indices, evaluating images both in dry and rainy seasons in the study area. Additionally, the use of indices more sensitive to the characteristics of dry forest vegetation is recommended.

4. Conclusions

The highest values of basal area, biomass, and tree density were recorded in Area 2, which is considered more conserved due to the absence of recent exploitation. However, over the years, there has been a decrease in these values in this area. On the other hand, in Area 1, there was an increase in basal area and biomass, even during drought years in the region. This can be explained by the lower competition for water, space, and nutrients due to the lower tree density in Area 1.
The vegetation indices analyzed in this study offer valuable insights into how the native vegetation of dry forests responds to various environmental and climatic conditions. The changes observed in the NDVI over time reflect variations in the density, health, and vitality of the tree vegetation, especially during the dry periods in the northeast region. On the other hand, the fluctuations in NDWIveg values between 2013 and 2021 correlated with years of lower and higher water availability for vegetation, while the NDWI and MNDWI proved effective in identifying bodies of water and wet areas.
However, according to the simple regression analyses combined with the results obtained from principal component regression (PCR), the physical–hydrological indices evaluated in the study did not show considerable predictive power for estimating the variables basal area, biomass, and number of trees. The principal component analysis (PCA) allowed us to observe that the NDVI and NDWI are extremely volatile to the dynamics of droughts in the study region, with the year 2020, a La Niña year, standing out positively due to the contribution of water bodies in the soil and vegetation.
It is important to consider the unique leaf distribution of vegetation in semi-arid areas, seasonality, and the hydraulic capacity of the soil when selecting vegetation indices. Therefore, future studies should include field surveys in different periods based on the seasonality of vegetation and indices sensitive to the characteristics and conditions of the forest, considering that the correlation between vegetation indices and the dynamics of tree vegetation in dry forests can be influenced by various factors such as the intensity and frequency of disturbances, soil characteristics, rainfall patterns, among others. It should also be noted that the results observed in our study are preliminary. However, the application and exploration of the analyses discussed (linear regression, PCA, and PCR) should be tested in future studies with a more suitable database for such analyses.

Author Contributions

Conceptualization, M.B.F., R.L.C.F., E.A.S. and A.N.d.S.; methodology, M.B.F., R.L.C.F., J.A.A.d.S., E.A.S., A.N.d.S. and M.V.d.S.; software, M.B.F. and M.V.d.S.; validation, M.B.F., J.A.A.d.S., D.B.C.D.L.C. and A.N.d.S.; formal analysis, M.B.F., J.A.A.d.S., A.N.d.S. and M.V.d.S.; investigation, M.B.F.; resources, M.V.d.S.; data curation, M.B.F., J.A.A.d.S., R.B.d.L. and D.B.C.D.L.C.; writing—original draft preparation, M.B.F., R.L.C.F., R.B.d.L. and E.A.S.; writing—review and editing, M.B.F., R.L.C.F., J.A.A.d.S., R.B.d.L., E.A.S., A.N.d.S., D.B.C.D.L.C. and M.V.d.S.; visualization, M.B.F., R.L.C.F., J.A.A.d.S., R.B.d.L., E.A.S., A.N.d.S., D.B.C.D.L.C. and M.V.d.S.; supervision, R.L.C.F.; project administration, R.L.C.F.; funding acquisition, M.V.d.S. All authors have read and agreed to the published version of the manuscript.

Funding

This research received no external funding.

Data Availability Statement

The data used in this research is confidential and copyright of the authors.

Acknowledgments

To the Programa de Pós-Graduação em Ciências Florestais (PPGCF) at the Universidade Federal Rural de Pernambuco (UFRPE) for supporting the development of this study. To the Coordenação de Aperfeiçoamento de Pessoal de Nível Superior (CAPES—Financing Code 001) and to the Fundação de Amparo à Ciência e Tecnologia do Estado de Pernambuco (FACEPE), and to the Conselho Nacional de Desenvolvimento Científico e Tecnológico (CNPq)—Grants 303991/2016-0 and 308676/2018-1, for funding scholarships and research productivity.

Conflicts of Interest

The authors declare no conflicts of interest.

References

  1. Miles, L.; Newton, A.C.; DeFries, R.S.; Ravilious, C.; May, I.; Blyth, S.; Kapos, V.; Gordon, J.E. A Global Overview of the Conservation Status of Tropical Dry Forests. J. Biogeogr. 2006, 33, 491–505. [Google Scholar] [CrossRef]
  2. Siyum, Z.G. Tropical Dry Forest Dynamics in the Context of Climate Change: Syntheses of Drivers, Gaps, and Management Perspectives. Ecol. Process 2020, 9, 25. [Google Scholar] [CrossRef]
  3. Aguilar-Peralta, J.S.; González-Rodríguez, A.; Maldonado-López, Y.; Fagundes, M.; Faria, M.L.; Ávila-Cabadilla, L.D.; Álvarez-Añorve, M.Y.; Cuevas-Reyes, P. Contrasting Patterns of Morphology, Fluctuating Asymmetry and Leaf Herbivory in Three Plant Species of Different Successional Stages of a Tropical Dry Forest. Trees 2020, 34, 1075–1086. [Google Scholar] [CrossRef]
  4. FAO World Ecozones. Available online: http://foris.fao.org/static/data/fra2010/ecozones2010.jpg (accessed on 24 May 2024).
  5. Dionisio, L.F.S.; Schwartz, G.; Mazzei, L.; Lopes, J.d.C.; dos Santos, G.G.A.; Oliveira, F.d.A. Mortality of Stocking Commercial Trees after Reduced Impact Logging in Eastern Amazonia. For. Ecol. Manag. 2017, 401, 1–7. [Google Scholar] [CrossRef]
  6. Deng, Y.; Wang, X.; Wang, K.; Ciais, P.; Tang, S.; Jin, L.; Li, L.; Piao, S. Responses of Vegetation Greenness and Carbon Cycle to Extreme Droughts in China. Agric. For. Meteorol. 2021, 298–299, 108307. [Google Scholar] [CrossRef]
  7. Senf, C.; Sebald, J.; Seidl, R. Increasing Canopy Mortality Affects the Future Demographic Structure of Europe’s Forests. One Earth 2021, 4, 749–755. [Google Scholar] [CrossRef]
  8. Bauman, D.; Fortunel, C.; Delhaye, G.; Malhi, Y.; Cernusak, L.A.; Bentley, L.P.; Rifai, S.W.; Aguirre-Gutiérrez, J.; Menor, I.O.; Phillips, O.L.; et al. Tropical Tree Mortality Has Increased with Rising Atmospheric Water Stress. Nature 2022, 608, 528–533. [Google Scholar] [CrossRef] [PubMed]
  9. Chazdon, R.L.; Guariguata, M.R. Natural Regeneration as a Tool for Large-scale Forest Restoration in the Tropics: Prospects and Challenges. Biotropica 2016, 48, 716–730. [Google Scholar] [CrossRef]
  10. Ferreira, M.B.; Bakke, I.A.; Bakke, O.A.; Sousa, G.G.D.; Silva Henrique, G.D.; Brito, G.F.D.; Batista, A.W.; Dantas, É.C.D.O.; de Sousa, A.N.; Ferreira, W.C.; et al. Distribution of Thornless Mimosa Tenuiflora, Piptadenia Stipulacea and Cnidoscolus Quercifolius in a Seasonally Dry Tropical Forest Remnant. For. Trees Livelihoods 2023, 32, 189–206. [Google Scholar] [CrossRef]
  11. Marin, A.; dos Santos, D.M.M.; Banzatto, D.A.; Ferraudo, A.S. Germinação de Sementes de Guandu Sob Efeito Da Disponibilidade Hídrica e de Doses Subletais de Alumínio. Bragantia 2004, 63, 13–24. [Google Scholar] [CrossRef]
  12. Reis, R.C.R.; Dantas, B.F.; Pelacani, C.R. Mobilization of Reserves and Germination of Seeds of Erythrina Velutina Willd. (Leguminosae-Papilionoideae) under Different Osmotic Potentials. Rev. Bras. Sementes 2012, 34, 580–588. [Google Scholar] [CrossRef]
  13. Fettig, C.J.; Mortenson, L.A.; Bulaon, B.M.; Foulk, P.B. Tree Mortality Following Drought in the Central and Southern Sierra Nevada, California, U.S. For. Ecol. Manag. 2019, 432, 164–178. [Google Scholar] [CrossRef]
  14. Dantas, B.F.; Moura, M.S.B.; Pelacani, C.R.; Angelotti, F.; Taura, T.A.; Oliveira, G.M.; Bispo, J.S.; Matias, J.R.; Silva, F.F.S.; Pritchard, H.W.; et al. Rainfall, Not Soil Temperature, Will Limit the Seed Germination of Dry Forest Species with Climate Change. Oecologia 2020, 192, 529–541. [Google Scholar] [CrossRef] [PubMed]
  15. Pettorelli, N.; Laurance, W.F.; O’Brien, T.G.; Wegmann, M.; Nagendra, H.; Turner, W. Satellite Remote Sensing for Applied Ecologists: Opportunities and Challenges. J. Appl. Ecol. 2014, 51, 839–848. [Google Scholar] [CrossRef]
  16. Skidmore, A.K.; Pettorelli, N.; Coops, N.C.; Geller, G.N.; Hansen, M.; Lucas, R.; Mücher, C.A.; O’Connor, B.; Paganini, M.; Pereira, H.M.; et al. Environmental Science: Agree on Biodiversity Metrics to Track from Space. Nature 2015, 523, 403–405. [Google Scholar] [CrossRef] [PubMed]
  17. Merchant, J.W. Remote Sensing of the Environment: An Earth Resource Perspective. Cartogr. Geogr. Inf. Sci. 2000, 27, 311. [Google Scholar]
  18. Stych, P.; Lastovicka, J.; Hladky, R.; Paluba, D. Evaluation of the Influence of Disturbances on Forest Vegetation Using the Time Series of Landsat Data: A Comparison Study of the Low Tatras and Sumava National Parks. ISPRS Int. J. Geoinf. 2019, 8, 71. [Google Scholar] [CrossRef]
  19. Lastovicka, J.; Svec, P.; Paluba, D.; Kobliuk, N.; Svoboda, J.; Hladky, R.; Stych, P. Sentinel-2 Data in an Evaluation of the Impact of the Disturbances on Forest Vegetation. Remote Sens. 2020, 12, 1914. [Google Scholar] [CrossRef]
  20. Silva, M.V.D.; Pandorfi, H.; Lopes, P.M.O.; Silva, J.L.B.D.; Almeida, G.L.P.D.; Silva, D.A.D.O.; Santos, A.D.; Rodrigues, J.A.D.M.; Batista, P.H.D.; Jardim, A.M.D.R.F. Pilot Monitoring of Caatinga Spatial-Temporal Dynamics through the Action of Agriculture and Livestock in the Brazilian Semiarid. Remote Sens. Appl. 2020, 19, 100353. [Google Scholar] [CrossRef]
  21. Gao, B. NDWI—A Normalized Difference Water Index for Remote Sensing of Vegetation Liquid Water from Space. Remote Sens. Environ. 1996, 58, 257–266. [Google Scholar] [CrossRef]
  22. McFEETERS, S.K. The Use of the Normalized Difference Water Index (NDWI) in the Delineation of Open Water Features. Int. J. Remote Sens. 1996, 17, 1425–1432. [Google Scholar] [CrossRef]
  23. da Silva, J.L.B.; Moura, G.B.d.A.; da Silva, M.V.; de Oliveira-Júnior, J.F.; Jardim, A.M.d.R.F.; Refati, D.C.; Lima, R.d.C.C.; de Carvalho, A.A.; Ferreira, M.B.; de Brito, J.I.B.; et al. Environmental Degradation of Vegetation Cover and Water Bodies in the Semiarid Region of the Brazilian Northeast via Cloud Geoprocessing Techniques Applied to Orbital Data. J. S. Am. Earth Sci. 2023, 121, 104164. [Google Scholar] [CrossRef]
  24. Xu, H. Modification of Normalised Difference Water Index (NDWI) to Enhance Open Water Features in Remotely Sensed Imagery. Int. J. Remote Sens. 2006, 27, 3025–3033. [Google Scholar] [CrossRef]
  25. Abdolalizadeh, Z.; Ghorbani, A.; Mostafazadeh, R.; Moameri, M. Rangeland Canopy Cover Estimation Using Landsat OLI Data and Vegetation Indices in Sabalan Rangelands, Iran. Arab. J. Geosci. 2020, 13, 245. [Google Scholar] [CrossRef]
  26. Guerini Filho, M.; Kuplich, T.M.; Quadros, F.L.F. Estimating Natural Grassland Biomass by Vegetation Indices Using Sentinel 2 Remote Sensing Data. Int. J. Remote Sens. 2020, 41, 2861–2876. [Google Scholar] [CrossRef]
  27. Marques, J.M.; Marques, M.A.M. As Componentes Principais No Descarte de Variáveis Em Um Modelo de Regressão Múltipla. Revista FAE 2005, 8, 93–101. [Google Scholar]
  28. Keithley, R.B.; Mark Wightman, R.; Heien, M.L. Multivariate Concentration Determination Using Principal Component Regression with Residual Analysis. TrAC Trends Anal. Chem. 2009, 28, 1127–1136. [Google Scholar] [CrossRef] [PubMed]
  29. Supriyadi, E. Perbandingan Metode Partial Least Square (PLS) Dan Principal Component Regression (PCR) Untuk Mengatasi Multikolinearitas Pada Model Regresi Linear Berganda. Unnes J. Math. 2017, 6, 117–128. [Google Scholar]
  30. Köppen, W. Das geographische System der Klimate. In Handbuck der Klimatologie Bd. 1; Köppen, W., Geiger, R., Eds.; Teil C. Gebrüder Bornträger: Stuttgart, Berlin, 1936. [Google Scholar]
  31. Beck, H.E.; Zimmermann, N.E.; McVicar, T.R.; Vergopolan, N.; Berg, A.; Wood, E.F. Present and Future Köppen-Geiger Climate Classification Maps at 1-Km Resolution. Sci. Data 2018, 5, 180214. [Google Scholar] [CrossRef]
  32. da Costa Júnior, D.S.; Ferreira, R.L.C.; da Silva, J.A.A.; da Silva, A.F.; Pessoa, M.M.d.L. Dinâmica de Crescimento de Uma Floresta Tropical Sazonalmente Seca No Semiárido Brasileiro. Ciência Florest. 2022, 32, 1594–1616. [Google Scholar] [CrossRef]
  33. Embrapa Sistema Brasileiro de Classificação de Solos. Available online: https://ainfo.cnptia.embrapa.br/digital/bitstream/item/199517/1/SiBCS-2018-ISBN-9788570358004.pdf (accessed on 22 May 2024).
  34. IBGE. Manual Técnico Da Vegetação Brasileira, 2nd ed.; Instituto Brasileiro de Geografia e Estatística: Rio de Janeiro, Brazil, 2012. [Google Scholar]
  35. da Silva, M.V.; Pandorfi, H.; de Oliveira-Júnior, J.F.; da Silva, J.L.B.; de Almeida, G.L.P.; Montenegro, A.A.d.A.; Mesquita, M.; Ferreira, M.B.; Santana, T.C.; Marinho, G.T.B.; et al. Remote Sensing Techniques via Google Earth Engine for Land Degradation Assessment in the Brazilian Semiarid Region, Brazil. J. S. Am. Earth Sci. 2022, 120, 104061. [Google Scholar] [CrossRef]
  36. GEE—Google Earth Engine. A Planetary-Scale Platform for Earth Science Data & Analysis. 2022. Available online: https://earthengine.google.com/ (accessed on 25 May 2023).
  37. Rouse, J.W.; Haas, R.H.; Schell, J.A.; Deering, D.W. Monitoring the Vernal Advancement and Retrogradation (Green Wave Effect) of Natural Vegetation; Technical Report; 1973. Available online: https://ntrs.nasa.gov/citations/19740022555 (accessed on 15 April 2023).
  38. Huete, A.R. A Soil-Adjusted Vegetation Index (SAVI). Remote Sens. Environ. 1988, 25, 295–309. [Google Scholar] [CrossRef]
  39. Huete, A.; Didan, K.; Miura, T.; Rodriguez, E.P.; Gao, X.; Ferreira, L.G. Overview of the Radiometric and Biophysical Performance of the MODIS Vegetation Indices. Remote Sens. Environ. 2002, 83, 195–213. [Google Scholar] [CrossRef]
  40. Gasparri, N.I.; Parmuchi, M.G.; Bono, J.; Karszenbaum, H.; Montenegro, C.L. Assessing Multi-Temporal Landsat 7 ETM+ Images for Estimating above-Ground Biomass in Subtropical Dry Forests of Argentina. J. Arid. Environ. 2010, 74, 1262–1270. [Google Scholar] [CrossRef]
  41. Dalla Lana, M.; Caraciolo Ferreira, R.L.; Aleixo da Silva, J.A.; Pereira Duda, G.; Lins e Silva Brandão, C.F.; Da Silva, A.F. Biomass Equations for Caatinga Species. Nativa 2018, 6, 517. [Google Scholar] [CrossRef]
  42. Matasci, G.; Hermosilla, T.; Wulder, M.A.; White, J.C.; Coops, N.C.; Hobart, G.W.; Zald, H.S.J. Large-Area Mapping of Canadian Boreal Forest Cover, Height, Biomass and Other Structural Attributes Using Landsat Composites and Lidar Plots. Remote Sens. Environ. 2018, 209, 90–106. [Google Scholar] [CrossRef]
  43. Mann, H.B. Nonparametric Tests Against Trend. Econometrica 1945, 13, 259. [Google Scholar] [CrossRef]
  44. Kendall, M.G. Rank Correlation Methods; Griffin: London, UK, 1975. [Google Scholar]
  45. Kaiser, H.F. The Varimax Criterion for Analytic Rotation in Factor Analysis. Psychometrika 1958, 23, 187–200. [Google Scholar] [CrossRef]
  46. R Core Team. R: A Language and Environment for Statistical Computing. Available online: https://www.r-project.org/ (accessed on 6 February 2023).
  47. Oliveira, C.P.; Ferreira, R.L.C.; Silva, J.A.A.; Lima, R.B.; Silva, E.A.; Silva, A.F.; Lucena, J.D.S.; Santos, N.A.T.; Lopes, I.J.C.; Pessoa, M.M.L.; et al. Modeling and Spatialization of Biomass and Carbon Stock Using LiDAR Metrics in Tropical Dry Forest, Brazil. Forests 2021, 12, 473. [Google Scholar] [CrossRef]
  48. Taiz, L.; Zeiger, E.; Møller, I.M.; Murphy, A. Fisiologia e Desenvolvimento Vegetal; Artmed Editora: Porto Alegre, Brazil, 2017; ISBN 8582713673. [Google Scholar]
  49. Marengo, J.A.; Alves, L.M.; Alvala, R.C.S.; Cunha, A.P.; Brito, S.; Moraes, O.L.L. Climatic Characteristics of the 2010–2016 Drought in the Semiarid Northeast Brazil Region. An. Acad. Bras. Cienc. 2018, 90, 1973–1985. [Google Scholar] [CrossRef]
  50. Silva da Costa Júnior, D.; Luiz Caraciolo Ferreira, R.; Antônio Aleixo da Silva, J.; De Gois, G.; Maria de Lima Pessoa, M.; Sousa da Silva, V. Variabilidade Ambiental No Município de Ibimirim, Estado de Pernambuco, Brasil. Rev. Bras. De Climatol. 2022, 31, 565–610. [Google Scholar] [CrossRef]
  51. Dale, V.H.; Joyce, L.A.; McNulty, S.; Neilson, R.P.; Ayres, M.P.; Flannigan, M.D.; Hanson, P.J.; Irland, L.C.; Lugo, A.E.; Peterson, C.J.; et al. Climate Change and Forest Disturbances: Climate Change Can Affect Forests by Altering the Frequency, Intensity, Duration, and Timing of Fire, Drought, Introduced Species, Insect and Pathogen Outbreaks, Hurricanes, Windstorms, Ice Storms, or Landslides. Bioscience 2001, 51, 723–734. [Google Scholar] [CrossRef]
  52. Toillon, J.; Fichot, R.; Dallé, E.; Berthelot, A.; Brignolas, F.; Marron, N. Planting Density Affects Growth and Water-Use Efficiency Depending on Site in Populus Deltoides×P. Nigra. For. Ecol. Manag. 2013, 304, 345–354. [Google Scholar] [CrossRef]
  53. Xue, H.; Han, Y.; Li, Y.; Wang, G.; Feng, L.; Fan, Z.; Du, W.; Yang, B.; Cao, C.; Mao, S. Spatial Distribution of Light Interception by Different Plant Population Densities and Its Relationship with Yield. Field Crops Res. 2015, 184, 17–27. [Google Scholar] [CrossRef]
  54. Pereira Júnior, L.R.; Andrade, E.M.D.; Palácio, H.A.d.Q.; Raymer, P.C.L.; Ribeiro Filho, J.C.; Pereira, F.J.S. Carbon Stocks in a Tropical Dry Forest in Brazil. Rev. Ciência Agronômica 2016, 47. [Google Scholar] [CrossRef]
  55. Spannl, S.; Volland, F.; Pucha, D.; Peters, T.; Cueva, E.; Bräuning, A. Climate Variability, Tree Increment Patterns and ENSO-Related Carbon Sequestration Reduction of the Tropical Dry Forest Species Loxopterygium huasango of Southern Ecuador. Trees 2016, 30, 1245–1258. [Google Scholar] [CrossRef]
  56. Anderegg, W.R.L.; Kane, J.M.; Anderegg, L.D.L. Consequences of Widespread Tree Mortality Triggered by Drought and Temperature Stress. Nat. Clim. Change 2013, 3, 30–36. [Google Scholar] [CrossRef]
  57. McDowell, N.G.; Allen, C.D. Darcy’s Law Predicts Widespread Forest Mortality under Climate Warming. Nat. Clim. Change 2015, 5, 669–672. [Google Scholar] [CrossRef]
  58. Campos, D.A.; Andrade, E.M.; Castanho, A.D.A.; Feitosa, R.C.; Palácio, H.Q.A. Biomass Dynamics in a Fragment of Brazilian Tropical Forest (Caatinga) over Consecutive Dry Years. Appl. Sci. 2020, 10, 7813. [Google Scholar] [CrossRef]
  59. Marengo, J.A.; Galdos, M.V.; Challinor, A.; Cunha, A.P.; Marin, F.R.; Vianna, M.d.S.; Alvala, R.C.S.; Alves, L.M.; Moraes, O.L.; Bender, F. Drought in Northeast Brazil: A Review of Agricultural and Policy Adaptation Options for Food Security. Clim. Resil. Sustain. 2022, 1, e17. [Google Scholar] [CrossRef]
  60. Souza Nascimento, C.E.; Tabarelli, M.; da Silva, C.A.D.; Leal, I.R.; de Souza Tavares, W.; Serrão, J.E.; Zanuncio, J.C. The Introduced Tree Prosopis Juliflora Is a Serious Threat to Native Species of the Brazilian Caatinga Vegetation. Sci. Total Environ. 2014, 481, 108–113. [Google Scholar] [CrossRef]
  61. Albano, C.M.; McGwire, K.C.; Hausner, M.B.; McEvoy, D.J.; Morton, C.G.; Huntington, J.L. Drought Sensitivity and Trends of Riparian Vegetation Vigor in Nevada, USA (1985–2018). Remote Sens. 2020, 12, 1362. [Google Scholar] [CrossRef]
  62. Oliveira-Júnior, J.F.; Shah, M.; Abbas, A.; Correia Filho, W.L.F.; da Silva Junior, C.A.; de Barros Santiago, D.; Teodoro, P.E.; Mendes, D.; de Souza, A.; Aviv-Sharon, E.; et al. Spatiotemporal Analysis of Fire Foci and Environmental Degradation in the Biomes of Northeastern Brazil. Sustainability 2022, 14, 6935. [Google Scholar] [CrossRef]
  63. Cunha, A.P.M.; Alvalá, R.C.; Nobre, C.A.; Carvalho, M.A. Monitoring Vegetative Drought Dynamics in the Brazilian Semiarid Region. Agric. For. Meteorol. 2015, 214–215, 494–505. [Google Scholar] [CrossRef]
  64. Barbosa, H.A.; Huete, A.R.; Baethgen, W.E. A 20-Year Study of NDVI Variability over the Northeast Region of Brazil. J. Arid. Environ. 2006, 67, 288–307. [Google Scholar] [CrossRef]
  65. Rodrigues, J.A.D.M.; Lopes, P.M.O.; Silva, J.L.B.D.; Araújo, H.L.; Silva, M.V.D.; Santos, A.D.; Moura, G.B.D.A. Spatial-Temporal Dynamics of Caatinga Vegetation Cover by Remote Sensing in the Brazilian Semiarid Region. Dyna 2020, 87, 109–117. [Google Scholar] [CrossRef]
  66. Marengo, J.A.; Torres, R.R.; Alves, L.M. Drought in Northeast Brazil—Past, Present, and Future. Theor. Appl. Climatol. 2017, 129, 1189–1200. [Google Scholar] [CrossRef]
  67. Batista, P.H.D.; de Almeida, G.L.P.; da Silva, J.L.B.; Lins, F.A.C.; da Silva, M.V.; Cordeiro Junior, J.J.F. Hydro-Physical Properties of Soil and Pasture Vegetation Coverage under Animal Trampling. Rev. Bras. Eng. Agrícola Ambient. 2020, 24, 854–860. [Google Scholar] [CrossRef]
  68. dos Santos, A.; Oliveira Lopes, P.M.; da Silva, M.V.; Maniçoba da Rosa Ferraz Jardim, A.; Barbosa de Albuquerque Moura, G.; Siqueira Tavares Fernandes, G.; de Oliveira Silva, D.A.; Bezerra da Silva, J.L.; de Moraes Rodrigues, J.A.; Araújo Silva, E.; et al. Causes and Consequences of Seasonal Changes in the Water Flow of the São Francisco River in the Semiarid of Brazil. Environ. Sustain. Indic. 2020, 8, 100084. [Google Scholar] [CrossRef]
  69. David, R.M.; Rosser, N.J.; Donoghue, D.N.M. Remote Sensing for Monitoring Tropical Dryland Forests: A Review of Current Research, Knowledge Gaps and Future Directions for Southern Africa. Environ. Res. Commun. 2022, 4, 042001. [Google Scholar] [CrossRef]
  70. INPE Condições Atuais Do ENOS: Enfraquecimento Do La Niña e Início de Condições de Neutralidade. Available online: http://enos.cptec.inpe.br/ (accessed on 21 March 2024).
  71. de Oliveira-Júnior, J.F.; de Gois, G.; Silva, I.J.d.L.; de Oliveira Souza, E.; Jardim, A.M.d.R.F.; da Silva, M.V.; Shah, M.; Jamjareegulgarn, P. Wet and Dry Periods in the State of Alagoas (Northeast Brazil) via Standardized Precipitation Index. J. Atmos. Sol. Terr. Phys. 2021, 224, 105746. [Google Scholar] [CrossRef]
  72. Lopes, A.B.; Andreoli, R.V.; Souza, R.A.F.; Cerón, W.L.; Kayano, M.T.; Canchala, T.; de Moraes, D.S. Multiyear La Niña Effects on the Precipitation in South America. Int. J. Climatol. 2022, 42, 9567–9582. [Google Scholar] [CrossRef]
  73. da Silva, A.S.A.; Barreto, I.D.d.C.; Cunha-Filho, M.; Menezes, R.S.C.; Stosic, B.; Stosic, T. Spatial and Temporal Variability of Precipitation Complexity in Northeast Brazil. Sustainability 2022, 14, 13467. [Google Scholar] [CrossRef]
  74. Cunha, A.P.M.A.; Zeri, M.; Deusdará Leal, K.; Costa, L.; Cuartas, L.A.; Marengo, J.A.; Tomasella, J.; Vieira, R.M.; Barbosa, A.A.; Cunningham, C.; et al. Extreme Drought Events over Brazil from 2011 to 2019. Atmosphere 2019, 10, 642. [Google Scholar] [CrossRef]
  75. De Medeiros, F.J.; de Oliveira, C.P.; Gomes, R.D.S.; Da Silva, M.L.; Cabral Júnior, J.B. Hydrometeorological Conditions in the Semiarid and East Coast Regions of Northeast Brazil in the 2012–2017 Period. An. Acad. Bras. Cienc. 2021, 93. [Google Scholar] [CrossRef]
  76. Silva, T.R.B.F.; dos Santos, C.A.C.; Silva, D.J.F.; Santos, C.A.G.; da Silva, R.M.; de Brito, J.I.B. Climate Indices-Based Analysis of Rainfall Spatiotemporal Variability in Pernambuco State, Brazil. Water 2022, 14, 2190. [Google Scholar] [CrossRef]
  77. Titolo, A. Use of Time-Series NDWI to Monitor Emerging Archaeological Sites: Case Studies from Iraqi Artificial Reservoirs. Remote Sens. 2021, 13, 786. [Google Scholar] [CrossRef]
  78. Meira Junior, M.S.; Pinto, J.R.R.; Ramos, N.O.; Miguel, E.P.; Gaspar, R.O.; Phillips, O.L. The Impact of Long Dry Periods on the Aboveground Biomass in a Tropical Forest: 20 Years of Monitoring. Carbon. Balance Manag. 2020, 15, 12. [Google Scholar] [CrossRef]
  79. Mitchell, P.J.; O’Grady, A.P.; Tissue, D.T.; White, D.A.; Ottenschlaeger, M.L.; Pinkard, E.A. Drought Response Strategies Define the Relative Contributions of Hydraulic Dysfunction and Carbohydrate Depletion during Tree Mortality. New Phytol. 2013, 197, 862–872. [Google Scholar] [CrossRef]
  80. de Barros Santiago, D.; Correia Filho, W.L.F.; de Oliveira-Júnior, J.F.; da Silva Junior, C.A. Mathematical Modeling and Use of Orbital Products in the Environmental Degradation of the Araripe Forest in the Brazilian Northeast. Model. Earth Syst. Environ. 2019, 5, 1429–1441. [Google Scholar] [CrossRef]
  81. Serrano, J.; Shahidian, S.; Marques da Silva, J. Evaluation of Normalized Difference Water Index as a Tool for Monitoring Pasture Seasonal and Inter-Annual Variability in a Mediterranean Agro-Silvo-Pastoral System. Water 2019, 11, 62. [Google Scholar] [CrossRef]
  82. Melo, M.V.N.D.; Oliveira, M.E.G.D.; Almeida, G.L.P.D.; Gomes, N.F.; Montalvo Morales, K.R.; Santana, T.C.; Silva, P.C.; Moraes, A.S.; Pandorfi, H.; Silva, M.V.d. Spatiotemporal Characterization of Land Cover and Degradation in the Agreste Region of Pernambuco, Brazil, Using Cloud Geoprocessing on Google Earth Engine. Remote Sens. Appl. 2022, 26, 100756. [Google Scholar] [CrossRef]
  83. Pandorfi, H.; Sobrinho, A.T.; Oliveira, V.S.; Guiselini, C.; Almeida, G.L.P.; Oliveira, M.E.G.; Melo, M.V.N.; Silva, M.V. Prediction of an Occupational Comfort Index for Agricultural Tractor Operation in Sugarcane Cultivation. Sugar Tech 2023, 25, 630–637. [Google Scholar] [CrossRef]
  84. da Silva, M.V.; Pandorfi, H.; de Almeida, G.L.P.; de Lima, R.P.; dos Santos, A.; Jardim, A.M.d.R.F.; Rolim, M.M.; da Silva, J.L.B.; Batista, P.H.D.; da Silva, R.A.B.; et al. Spatio-Temporal Monitoring of Soil and Plant Indicators under Forage Cactus Cultivation by Geoprocessing in Brazilian Semi-Arid Region. J. S. Am. Earth Sci. 2021, 107, 103155. [Google Scholar] [CrossRef]
  85. Farooq, T.; Wu, W.; Tigabu, M.; Ma, X.; He, Z.; Rashid, M.; Gilani, M.; Wu, P. Growth, Biomass Production and Root Development of Chinese Fir in Relation to Initial Planting Density. Forests 2019, 10, 236. [Google Scholar] [CrossRef]
  86. Sajad, S.; Haq, S.M.; Yaqoob, U.; Calixto, E.S.; Hassan, M. Tree Composition and Standing Biomass in Forests of the Northern Part of Kashmir Himalaya. Vegetos 2021, 34, 857–866. [Google Scholar] [CrossRef]
Figure 1. Geographic location and spatial distribution of sampling units at Fazenda Itapemirim, municipality of Floresta, PE.
Agriengineering 06 00148 g001
Figure 2. Boxplot analysis for basal area—Area 1 (A) and Area 2 (D), biomass—Area 1 (B) and Area 2 (E), and tree density per sampling unit—Area 1 (C) and Area 2 (F) in the period from 2013 to 2021.
Agriengineering 06 00148 g002
Figure 3. Spatio-temporal distribution of NDVI in the scientific area, between 2013 and 2021.
Agriengineering 06 00148 g003
Figure 4. Spatio-temporal distribution of NDWIveg in the scientific area between 2013 and 2021.
Agriengineering 06 00148 g004
Figure 5. Spatio-temporal distribution of NDWI in the studied area between 2013 and 2021.
Agriengineering 06 00148 g005
Figure 6. Spatio-temporal distribution of MNDWI in the studied are between 2013 and 2021.
Agriengineering 06 00148 g006
Figure 7. Trend analysis from 2013 to 2021 for basal area in Area 1 (a) and Area 2 (b); number of trees in Area 1 (c) and Area 2 (d); and biomass in Area 1 (e) and Area 2 (f).
Agriengineering 06 00148 g007
Figure 8. Trend analysis from 2013 to 2021 MNDWI area in Area 1 (a) and Area 2 (b); NDWI in Area 1 (c) and Area 2 (d); NDWIveg in Area 1 (e) and Area 2 (f); and NDVI in Area 1 (g) and Area 2 (h).
Agriengineering 06 00148 g008
Figure 9. Linear relationship and regression models of field variables with the values of NDVI, NDWIveg, NDWI, and MNDWI for Area 1 in the period from 2013 to 2021.
Agriengineering 06 00148 g009
Figure 10. Linear relationship and regression models of field variables with the values of NDVI, NDWIveg, NDWI, and MNDWI for Area 2 in the period from 2013 to 2021.
Agriengineering 06 00148 g010
Figure 11. Principal component analysis (PCA) of the physical–water parameters on the surface recorded for Area 1 (a,b) and Area 2 (c,d) in the period from 2013 to 2021.
Agriengineering 06 00148 g011
Table 1. Allometric equations for estimating dry biomass stock (kg) for eight characteristic species of dry tropical forest, municipality of Floresta, Pernambuco, Brazil.
SpeciesEquationsR2ajSxy%
Anadenanthera colubrina var. cebil (Griseb.) Altschul B i o ^ = 48.7255x [1 − exp(−0.1435*d)]2.40960.8920.69
Aspidosperma pyrifolium Mart. B i o ^ = 0.7858x(d2xh)0.45500.7526.64
Bauhinia cheilantha (Bong.) Steud. B i o ^ = 0.0669x(d2.2115)x(h0.8155)0.9712.09
Cnidoscolus quercifolius Pohl B i o ^ = 0.6064x(d1.4216)0.8225.51
Croton heliotropiifolius Kunth B i o ^ = 0.1868x(d1.2764)x(h0.9401)0.7618.96
Mimosa ophthalmocentra
Mart. ex Benth.
ln B i o ^ = 1.1118 + 1.7371xln(d) − 0.9536xln(h)0.899.04
Mimosa tenuiflora (Willd.)
Poir.
B i o ^ = 0.5084x(d1.7121)0.9416.79
Cenostigma bracteosum (Tul.)
Gagnon & G.P. Lewis
B i o ^ = 6.6205 + 0.0341x(d2xh)0.8523.40
Equação Geralln B i o ^ = −1.2884 + 1.6102xln(d) + 0.4343xln(h)0.8523.46
B i o ^ = estimate of total dry biomass above ground (kg); d = diameter at 1.30 m above the ground (cm) e h = total height (m); R2aj (%) = coefficient of determination adjusted in percentage; Sxy = standard error of the estimate in percentage. Source: Dalla Lana et al. [41].
Table 2. Dataset suitability according to Kaiser–Meyer–Olkin (KMO).
Kaiser–Meyer–Olkin (KMO)Adequacy of Data
<0.5Not adequate
0.5 to 0.6Weak
0.6 to 0.69Mediocre
0.7 to 0.79 Middling
0.8 to 1.0Adequate
>1.0Excellent
Table 3. Kaiser–Meyer–Olkin (KMO) and Bartlett sphericity tests for the principal components established in Areas 1 and 2.
Sphericity TestArea 1Sphericity TestArea 2
KMO0.721KMO0.732
Test de BartlettChi-square4773.292Test de BartlettChi-square4685.68
GL21GL21
Significance<0.01Significance<0.01
Table 4. Eigenvalues, variance, and cumulative variance of the principal components (PCs) for areas 1 and 2.
ComponentArea 1Area 2
Initial Eigenvalues% CumulativeInitial Eigenvalues% Cumulative
Eigenvalue% of VarianceEigenvalue% of Variance
12.7038.5238.522.5736.7236.72
22.0629.3767.892.2932.6869.40
31.6223.1591.041.2617.9787.37
40.456.3997.430.669.4996.86
50.131.8699.300.131.8398.69
60.050.71100.000.091.31100.00
Table 5. Correlation matrix of the principal components (PCs) of Area 1.
VariablesComponents
PC1PC2PC3PC4PC5PC6
Basal Area0.850.27−0.18−0.390.030.13
Tree Number0.730.35−0.260.52−0.050.06
Biomass0.890.35−0.20−0.11−0.02−0.17
MNDWI0.250.290.920.030.020.00
NDWIveg0.50−0.450.730.00−0.130.00
NDWI−0.260.890.320.050.190.00
NDVI0.51−0.810.010.110.27−0.01
Table 6. Principal component regression (PCR) for the response variables basal area, tree number and biomass of Area 1.
Basal Area
ComponentrR2p-ValueErrorRegression p-Value
PC10.840.73<0.010.03<0.01
PC20.270.07<0.010.06<0.01
PC30.180.03<0.010.07<0.01
Tree Number
PC10.730.53<0.0115.96<0.01
PC20.350.12<0.0121.91<0.01
PC30.260.07<0.0122.59<0.01
Biomass
PC10.890.80<0.01101.49<0.01
PC20.350.13<0.01209.73<0.01
PC30.200.04<0.01219.90<0.01
Table 7. Analysis of variance (ANOVA) of the basal area, tree number and biomass regression models followed by the predictors and regression models for Area 1.
Basal Area
FontDFSSMSF-Valuep-Value
Regression20.060.037.140.001
Residue3571.540
Total3591.6
Model predictorsConstant (β0)NDWIveg (β1)NDVI (β2)R2r
0.0950.2370.3280.040.2
Multiple regressionBasal Area = 0.095 + (0.237*NDWIveg) + (0.328*NDVI)
Tree Number
FontDFSSMSF-valuep-value
Regression23941.221970.613.670.027
Residue357191,840.75537.37
Total359195,781.98
Model predictorsConstant (β0)NDWIveg (β1)NDVI (β2)R2r
−4.239−68.431161.0280.020.14
Multiple regressionTree Number = −4.239 − (68.431*NDWIveg) + (161.028*NDVI)
Biomass
FontDFSSMSF-valuep-value
Regression2490,779.3245,389.655.010.007
Residue35717,502,392.449,026.31
Total3591,799,3171.7
Model predictorsConstant (β0)NDWIveg (β1)NDVI (β2)R2r
331.024722.696873.4970.020.17
Multiple regressionBiomass = 331.024 + (722.696*NDWIveg) + (873.497*NDVI)
DF—degree of freedom; SS—sum of squares; MS—mean square.
Table 8. Correlation matrix of the principal components (PCs) of Area 2.
VariablesComponents
PC1PC2PC3PC4PC5PC6
Basal_Area0.010.82−0.08−0.540.18−0.02
Tree_Number−0.250.68−0.340.590.14−0.03
Biomass−0.030.93−0.26−0.05−0.270.01
MNDWI0.440.440.770.140.000.01
NDWI_veg0.920.200.290.090.00−0.10
NDWI−0.780.260.540.040.010.16
NDVI0.920.01−0.300.030.030.23
Table 9. Principal component regression (PCR) for the response variables basal area, tree number and biomass of Area 2.
Basal Area
ComponentrR2p-ValueErrorRegression p-Value
PC10.010.000.8240.080.824
PC20.820.67<0.010.04<0.01
PC30.080.010.1440.080.144
Tree Number
PC10.250.06<0.0115.23<0.01
PC20.680.46<0.0111.57<0.01
PC30.340.12<0.0114.75<0.01
Biomass
PC10.030.000.539189.040.539
PC20.930.86<0.0171.58<0.01
PC30.260.07<0.01182.70<0.01
Disclaimer/Publisher’s Note: The statements, opinions and data contained in all publications are solely those of the individual author(s) and contributor(s) and not of MDPI and/or the editor(s). MDPI and/or the editor(s) disclaim responsibility for any injury to people or property resulting from any ideas, methods, instructions or products referred to in the content.