1. Introduction
Modern agriculture must deal with many different challenges simultaneously. Digital farming technology can help the farmer deal with difficulties like labor availability, public perception of agriculture, climate change, further environmental issues, limited resources, and many more at the same time with data management systems and decision-support systems based on these data [
1,
2].
Digital ecosystems will require increasing farmers’ digital competence in the coming years. Surveys from Bavaria and Germany indicate that a minority of arable farms use a Farm Management Information System (FMIS) in crop production, use maps from satellite data, GPS-guided section control, site-specific pesticide application, and automatic steering system [
3,
4]. Surveys show that prediction models and communication and trading platforms will gain more importance. In Bavaria, 52% of farmers already use computer programs for fertilizer requirement determination [
1,
3,
4]. Despite the higher percentage of computer program usage compared to other “smart” measures, this might include self-created Excel sheets. In particular, the low trust in cloud solutions from software manufacturers appears to be a barrier for many farmers [
1,
3].
Looking comparatively at the USA, the utilization of digital farming technologies is indeed higher. However, the adaptation and application of digital farming technologies depend on farm structure, technology, and crop type. Moreover, the obstacles to adopting digital farming technologies are comparable to those in Bavaria [
5,
6]. Furthermore, there needs to be more knowledge about which kind of digital farming technology is strictly used on farms and how the farmers adapt and are aware of this technology [
7]. Multiple factors have impacted the adoption of new smart technologies on farms [
8].
However, in 2022, it was identified that the “Internet of Things” (IoT), which had negligible significance in Bavaria in 2020, emerged as the most important technological innovation in the overall agricultural market [
9]. There are multiple use cases for adopting IoT in agriculture, whether in livestock or arable farming. Examples of applications are real-time animal tracking and monitoring in livestock farming and real-time crop plant and soil monitoring regarding irrigation control of arable agriculture [
2,
10,
11]. The IoT refers to a network consisting of several sensor-equipped objects that communicate through Machine-to-Machine Communication (M2M) [
2]. These objects (“Smart Objects”) have their own internet addresses and can be controlled over the internet by other systems or individuals [
12]. IoT ecosystems can assist farmers in reacting purposefully, quickly, and effectively to weather changes and other factors without additional bureaucracy. In agriculture, an IoT ecosystem involves wireless interaction and cloud-based communication among various digital components, including hardware, software, user interface (UI), wireless communication, a cloud platform, and cloud-based applications [
10,
13]. Components may include sensors, machine information, attachments, and mobile devices with integrated FMIS [
14]. For the widespread adoption of digital ecosystems in agriculture, in addition to the advantages mentioned above, easy and reliable operation must be guaranteed [
15,
16]. Otherwise, the farmer will need help from an expert [
17]. Thus, a customer-centric development of a UI can be beneficial to enable the IoT, as a new key technology, to establish itself in agriculture for better oversight and localized, simplified data management [
9,
17,
18,
19].
One of the most important workplaces for a farmer is still the tractor cabin. This differs significantly from other industries and poses challenges, particularly evident in the design of human–machine interfaces (HMIs) on agricultural machinery. A tractor must fulfill various requirements, including noise reduction, shock absorption, and clear visibility, as tractors often traverse uneven fields and unpaved paths. Additionally, controls for hydraulics and attachments must be easily accessible from the seat without diverting attention from the work or the path to prevent accidents. A full-field view is essential, and UI and screen hardware considerations must factor in light exposure, vibrations, dust, and dirt [
15,
20].
The usability of the interfaces on farm machinery should be intuitive, allowing easy use by older workers or foreign workers who may need to become more familiar with digital technologies [
21]. The challenge is further compounded by the fact that user interfaces of operating systems from different manufacturers and retrofit segments differ in structure. Mixed fleets are prevalent in Europe, adding to the complexity [
22].
While the ISOBUS (ISO 11783) [
23] enables M2M communication between tractors and attachments, the increasing use of sensors has led to a rise in the number of operating terminals in tractor cabins [
24]. The ISO 11783:2018 Part 6 describes a universal virtual terminal that can be used [
25]. Still, the design of the specific farm machinery manufacturer terminals needs to be standardized, with each manufacturer adopting a unique visual approach. Additionally, proprietary operating systems are not compatible with all other networks. This incompatibility hampers the ongoing digitization of agriculture compared to other industries [
26,
27].
Different from the design of mobile smartphone apps, which have standardized guidelines depending on the operating system [
28,
29], no comparable design guidelines or recommendations are available in the agricultural context.
Given these diverse requirements for agriculture UIs, different UI designs, and the increasing importance of IoT in agriculture, this work aimed to determine the requirements of practicing farmers for the UI of farm machinery. To be as close as possible to the practical working environment of a farmer, a usability test was designed to determine the main disruptive factors in the UI design based on Nielsen [
30]. Since testing every tractor manufacturer’s UI design is impossible, a new UI design of a new IoT platform (NEVONEX), a concept of a cross-manufacturer solution for the IoT ecosystem, was chosen. Based on the results, the UI was adjusted. Consequently, a usability test of the NEVONEX Cockpit App Version 1.5.1 (618) [
31] was conducted as a representative test for a digital ecosystem to identify application problems in the UI. The UI design is oriented to follow the design principles of mobile software applications design (further referred to as “mobile design”) and not to the design of ISOBUS terminals [
25]. A further goal was to figure out the weaknesses of this new UI design and improve the NEVONEX Cockpit app’s UI in an additional step.
2. Materials and Methods
In the following paragraphs, a description of the NEVONEX Technology is given. The “NEVONEX Cockpit App” (Version 1.5.1 (618)) [
31] that was used for the usability testing based on Nielsen [
30] is explained behind the big picture background of this digital platform. The Methods Section describes the steps taken during the actual investigation. Due to technical issues, the method of a usability test on a tractor and a usability test using video screens was conducted.
2.1. NEVONEX
NEVONEX is a digital ecosystem developed by Robert Bosch GmbH (Stuttgart, Germany) for agriculture, comparable to an operating system on a smartphone. It serves as a wireless and manufacturer-independent interface between the farmer and the tractor, and between the tractor and the implements. NEVONEX comprises the NEVONEX Box, a MyNEVONEX account, and the NEVONEX Cockpit App with digital services. The NEVONEX Cockpit App runs on any consumer mobile device (iOS or Android-based). It serves as a frame for different 3rd party digital services that can be used and controlled through the app framework (“App in App” approach).
The core value of NEVONEX to a farmer is utilizing digital services (app-like software) that improve data compatibility and process optimization. Various manufacturers offer these services and run independently by manufacturers of agricultural machinery. While the farmer interacts with the digital services through the NEVONEX Cockpit App, the actual processing is done on the NEVONEX Box. Therefore, the Cockpit App is just the HMI extension of the digital ecosystem. NEVONEX and the associated digital services aim to contribute to a manufacturer-neutral, timesaving, and resource-efficient process optimization for the farmer through the IoT ecosystem. NEVONEX positions itself as a neutral orchestrator for all components of the IoT ecosystem. The digital services of NEVONEX can enhance output efficiency by providing simplified documentation, improved communication, data value-added services (e.g., yield and quality predictions), enhanced machine uptime and maintenance, and additional machine functionality [
32].
2.2. Materials
The materials used are described in detail in the following sections: “On-Tractor Practical Test” and “Usability Test Using Screen Video Sequences of the UI”.
2.2.1. On-Tractor Practical Test
To conduct the practical part of the survey, in addition to the questionnaire, a tractor with ISOBUS and GNSS receiver, an ISOBUS implement simulator (Kverneland ISOmatch), the NEVONEX Box, and a tablet (iPad 7th Generation) were needed. Reith Landtechnik (Wolnzach, Germany) provided a John Deere 6155R (Mannheim, Germany), model year 2022, as the tractor. On the tablet, an iPad (7th Generation), the NEVONEX Cockpit App of Version 1.5.1 (618) [
31] with the digital service geoNex was installed beforehand. Via the associated Farm Management Information System (FMIS) portal FarmInfo [
33], a test field, including an application map, was created over the Reith company’s yard (Wolnzach, Germany). This test field and work orders were transmitted from FarmInfo to geoNex and were available on the tablet. These preparations were necessary as the test scenario involved the site-specific mineral fertilizer application simulation using an application map from an FMIS (in this case, FarmInfo [
33]).
2.2.2. Usability Test Using Screen Video Sequences of the UI
In addition to the previously mentioned questionnaire, an iPad (7th Generation) was used for the screen video recordings of the application tasks with the NEVONEX Cockpit App of Version 1.5.1 (618) [
31]. The screen video recordings were conducted at a demo stand at geo-konzept GmbH (Adelschlag, Germany). The demo stand consisted of a Topcon steering wheel and terminal, an ISOBUS implement simulator (Kverneland ISOmatch), the NEVONEX Box, and an iPad with the Cockpit App. The digital service geoNex was installed on the Cockpit App of Version 1.5.1 (618) [
31]. The imaginary test field’s application maps and work orders were already transmitted to geoNex and, consequently, to the Cockpit App through the FarmInfo Portal [
33].
The screen videos were recorded in individual segments, corresponding to the tasks outlined in the third part of the questionnaire. Subsequently, these recordings were arranged in the correct order and transmitted to a tablet to represent the UI of the Cockpit App in a format as close to real-world usage as possible.
2.3. Methods
A usability test was conducted to assess the usability of the NEVONEX Cockpit App [
31].
The usability test for assessing the usability of the NEVONEX Cockpit App’s user interface (UI) consisted of four parts:
A questionnaire with general questions about the farmer;
Technical understanding questions;
Usability test tasks for the respondent farmer to perform;
Feedback questions related to the usability test.
Nielsen’s standard useability testing method was adopted, which says that to identify 85% of UI problems, a minimum of 5 participants are needed [
30], adding phases 1,2, and 4 to capture additional insights about user background and predicted usage behavior. Also, because of the early-stage version of the tested software [
31], the reflections from phase 4 provide additional insights for improving the UI.
At the beginning, each participant filled out the first two parts of the questionnaire. This included general questions about the farmer, technical equipment knowledge, and criticisms regarding known UIs on agricultural machinery.
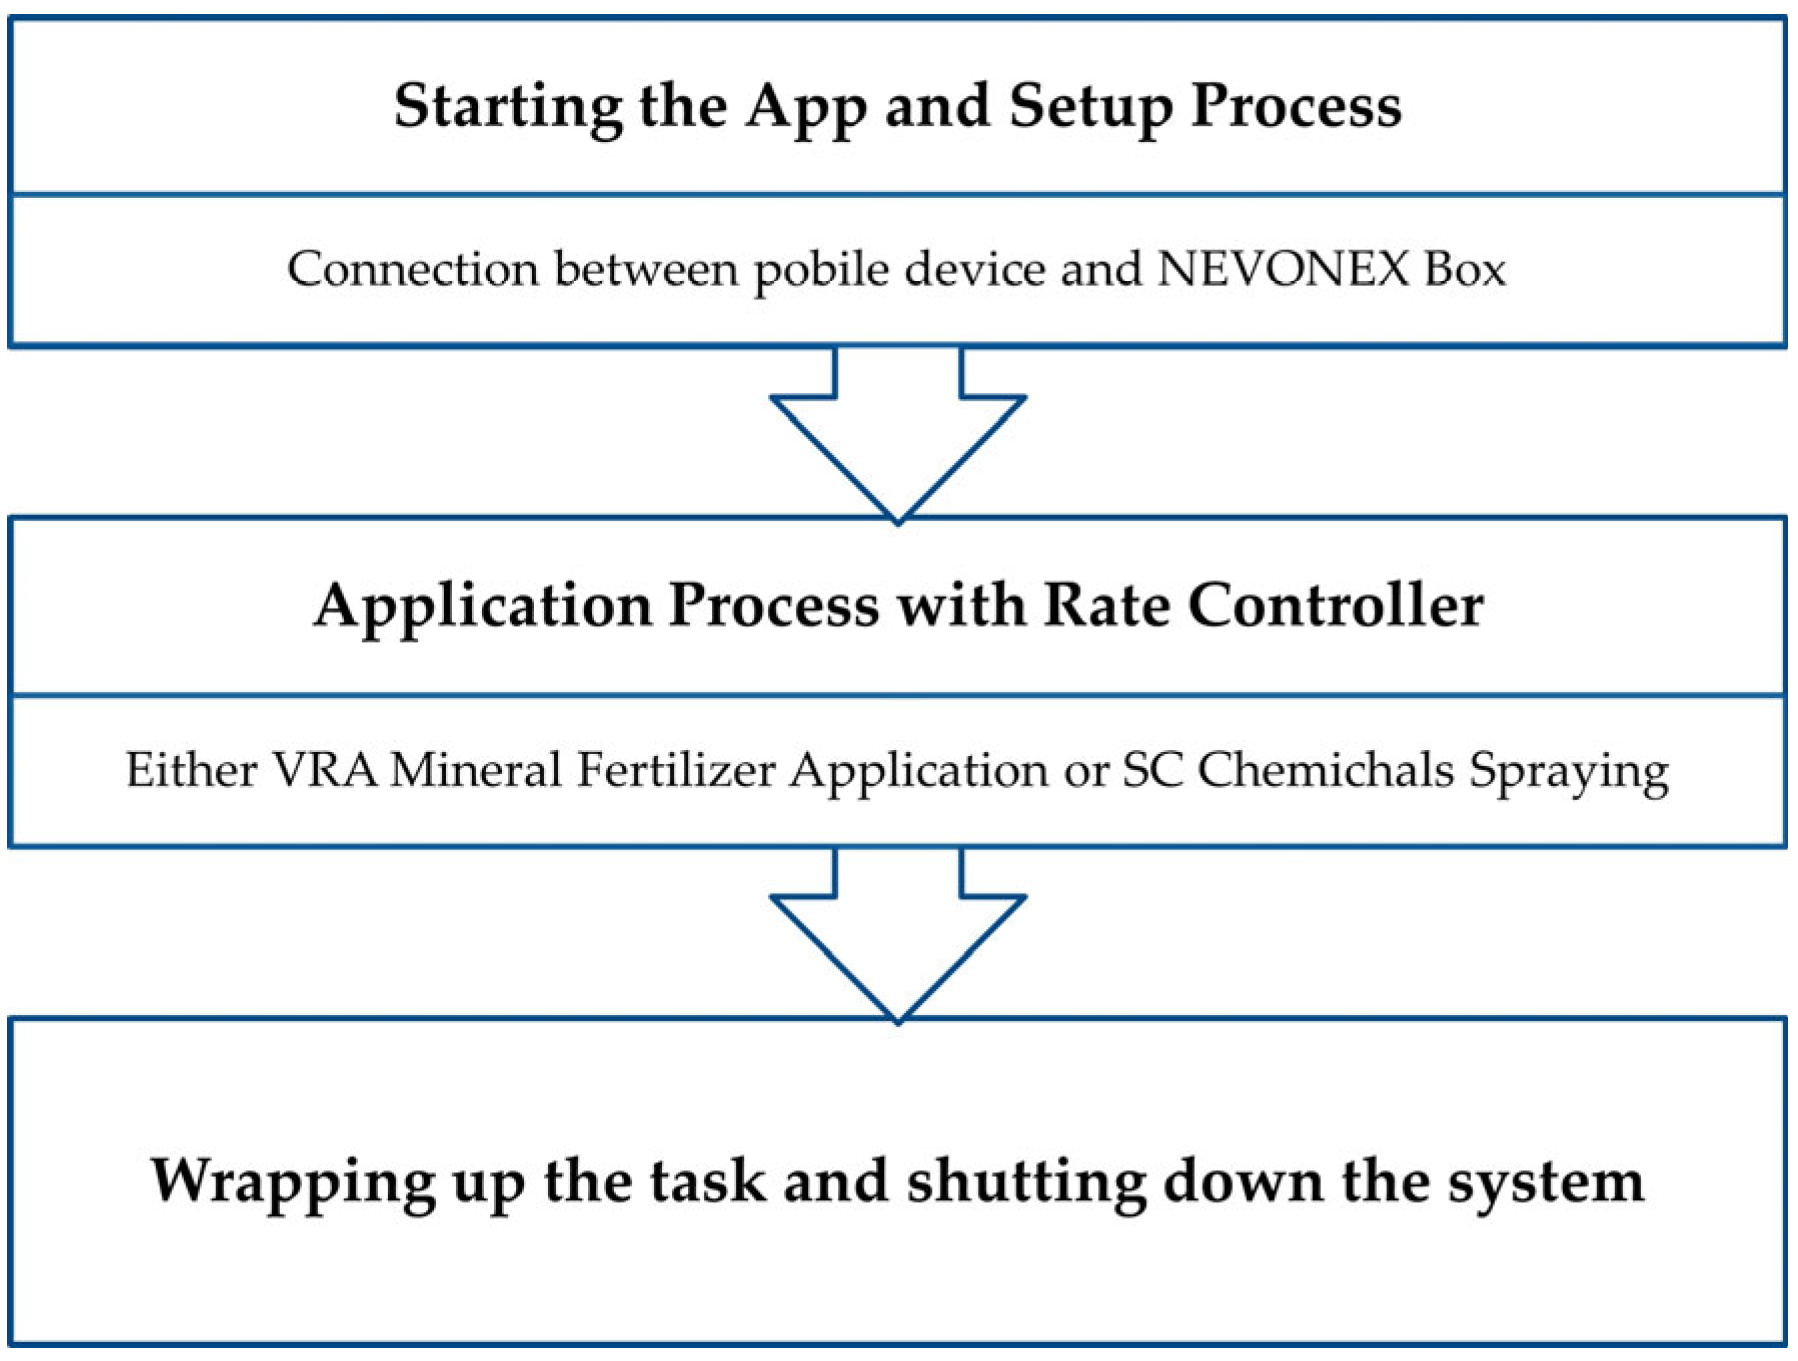
The observer explained the usability test task to the farmer in the next step. The participant then carefully reread the task description. After rereading the task, the observer asked the farmer to verbalize his thoughts and actions. These were noted by the observer on a separate sheet under each task and were transcribed later. During the third part, the farmer followed the usability test flow of the scenario shown in
Figure 1 in the tractor cabin on the tractor. Through doing the task (
Figure 1), the farmer expressed his thoughts and steps loudly while an observer sat silently beside the farmer and made notes.
The on-tractor practical test occurred at Reith Landtechnik GmbH & Co. KG (Wolnzach, Germany). Participants were allowed to test the NEVONEX Cockpit App under simulated real conditions on an agricultural machine. The NEVONEX Box was connected to the tractor via the in-cab connection. In this case, the ISOBUS implement simulator, corresponding to a Kverneland fertilizer spreader, was related to an ISOBUS interface. Subsequently, the tablet with the Cockpit App was started, establishing a connection with the NEVONEX Box, and the digital services were ready for use. Three farmers had the chance to complete the session before the test was discontinued due to technical issues. The issues involved conflicts with security certificates and updates in the NEVONEX ecosystem, preventing further work with the system and interrupting the interview. As this problem could only be resolved weeks later, the subsequent investigations shifted to a video procedure to ensure the continued availability of participants.
Since Nielsen recommends a minimum of 5 tests [
30], the subsequent approach shifted to a usability test using screen videos of the UI. This transition was facilitated using the demo stand from geo-konzept GmbH (Adelschlag, Germany) for video recording on an iPad. The experiences gained from the on-tractor practical test were leveraged. The workflow (
Figure 1) and concept for the video testing is the same as the on-tractor test.
The video interviews all took place during in-person meetings with the participating farmers. During these sessions, the participants were no longer in the practical environment of the tractor cabin but were physically seated next to the observer at a table. During the video test, the participant had to verbally articulate the steps they would take, indicate which buttons they would press, and express their thoughts loudly.
A total of six farmers participated in this test. The practical part of the usability test deviates from the on-tractor practical test. The task was changed slightly based on the experiences gained from the preceding on-tractor practical test, but the usability test flow stayed the same as shown in
Figure 1 and as the on-tractor test.
After completing the application test, each participant independently completed the questionnaire’s feedback section. In contrast to the general and technical understanding questions, the feedback section aims to capture diverse individual wishes, suggestions, and criticisms.
After conducting the session, the notes were transcribed and summarized into critical terms. The analysis of the completed questionnaires and the transcribed usability tests was done using Microsoft® Excel® (Version 2301 (Build 16026.20200); Microsoft Corporation, Redmond, WA, USA) for Microsoft 365 MSO due to the number of participants (n = 9).
3. Results
As described in
Section 2.2, the survey consisted of four parts. Initially, the participant had to independently answer general, definition, and comprehension questions. Those first two parts are summarized under
Section 3.1. Subsequently, the practical UI testing was conducted in two parts. The first was a live test on the tractor that was continued (due to circumstances) by video-based UI testing. Lastly, participants had to complete a feedback questionnaire to collect their thoughts on their experiences during the UI test.
3.1. Participant Classification
Nine individuals, ranging in age from 18 to 59 years, were surveyed. Their backgrounds included Bavarian farm structures with a crop farming focus, mixed farm equipment fleets, and a higher education level.
Since the work’s focus is on HMIs, participants were asked about their familiarity with ISOBUS UIs (VT) (ISO 11783 Part 6) [
25] and their preferred smartphone operating systems. Six individuals used Apple devices (iOS), two used Android devices, and the oldest respondent did not own a smartphone.
The participants were familiar with FMIS and automatic guidance systems, and various systems were mentioned among those who used farm management systems.
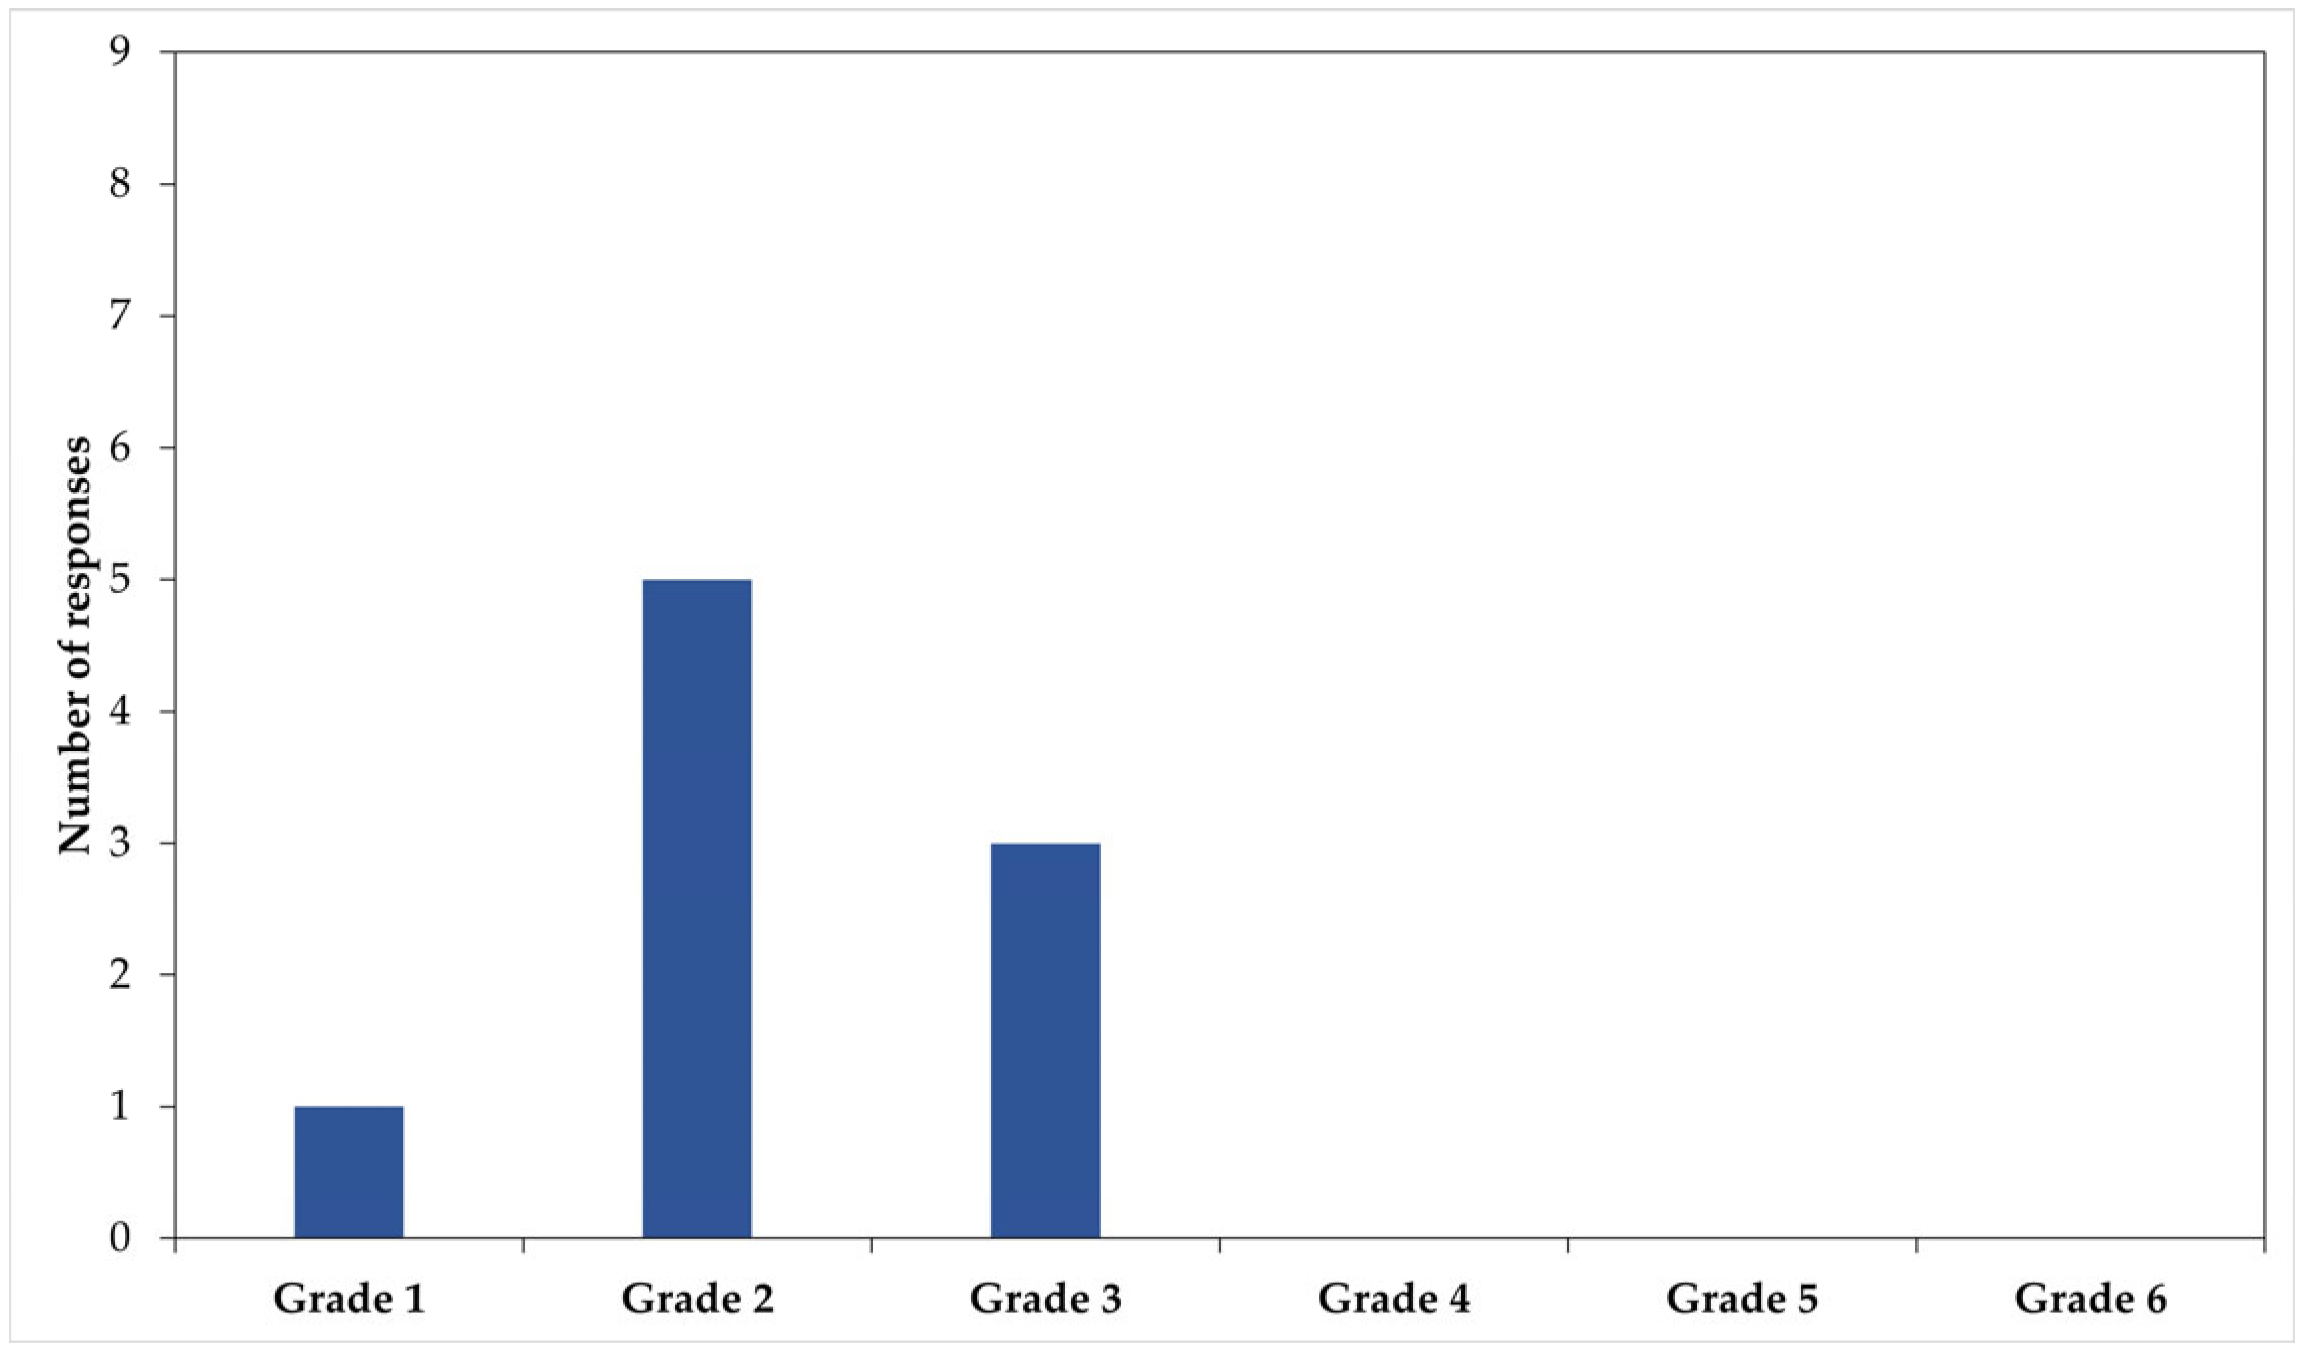
Also, the farmers were asked how clearly they found their familiar screens in the tractor cabin and to provide a rating from Grade 1 to 6, where 1 represents “very good clarity”, and 6 represents “insufficient clarity”. Five respondents rated the screens as “good clarity” (Grade 2), three as “satisfactory clarity” (Grade 3), and one as “very good clarity” (Grade 1). The indication of satisfaction with familiar tractor screens is shown in
Figure 2.
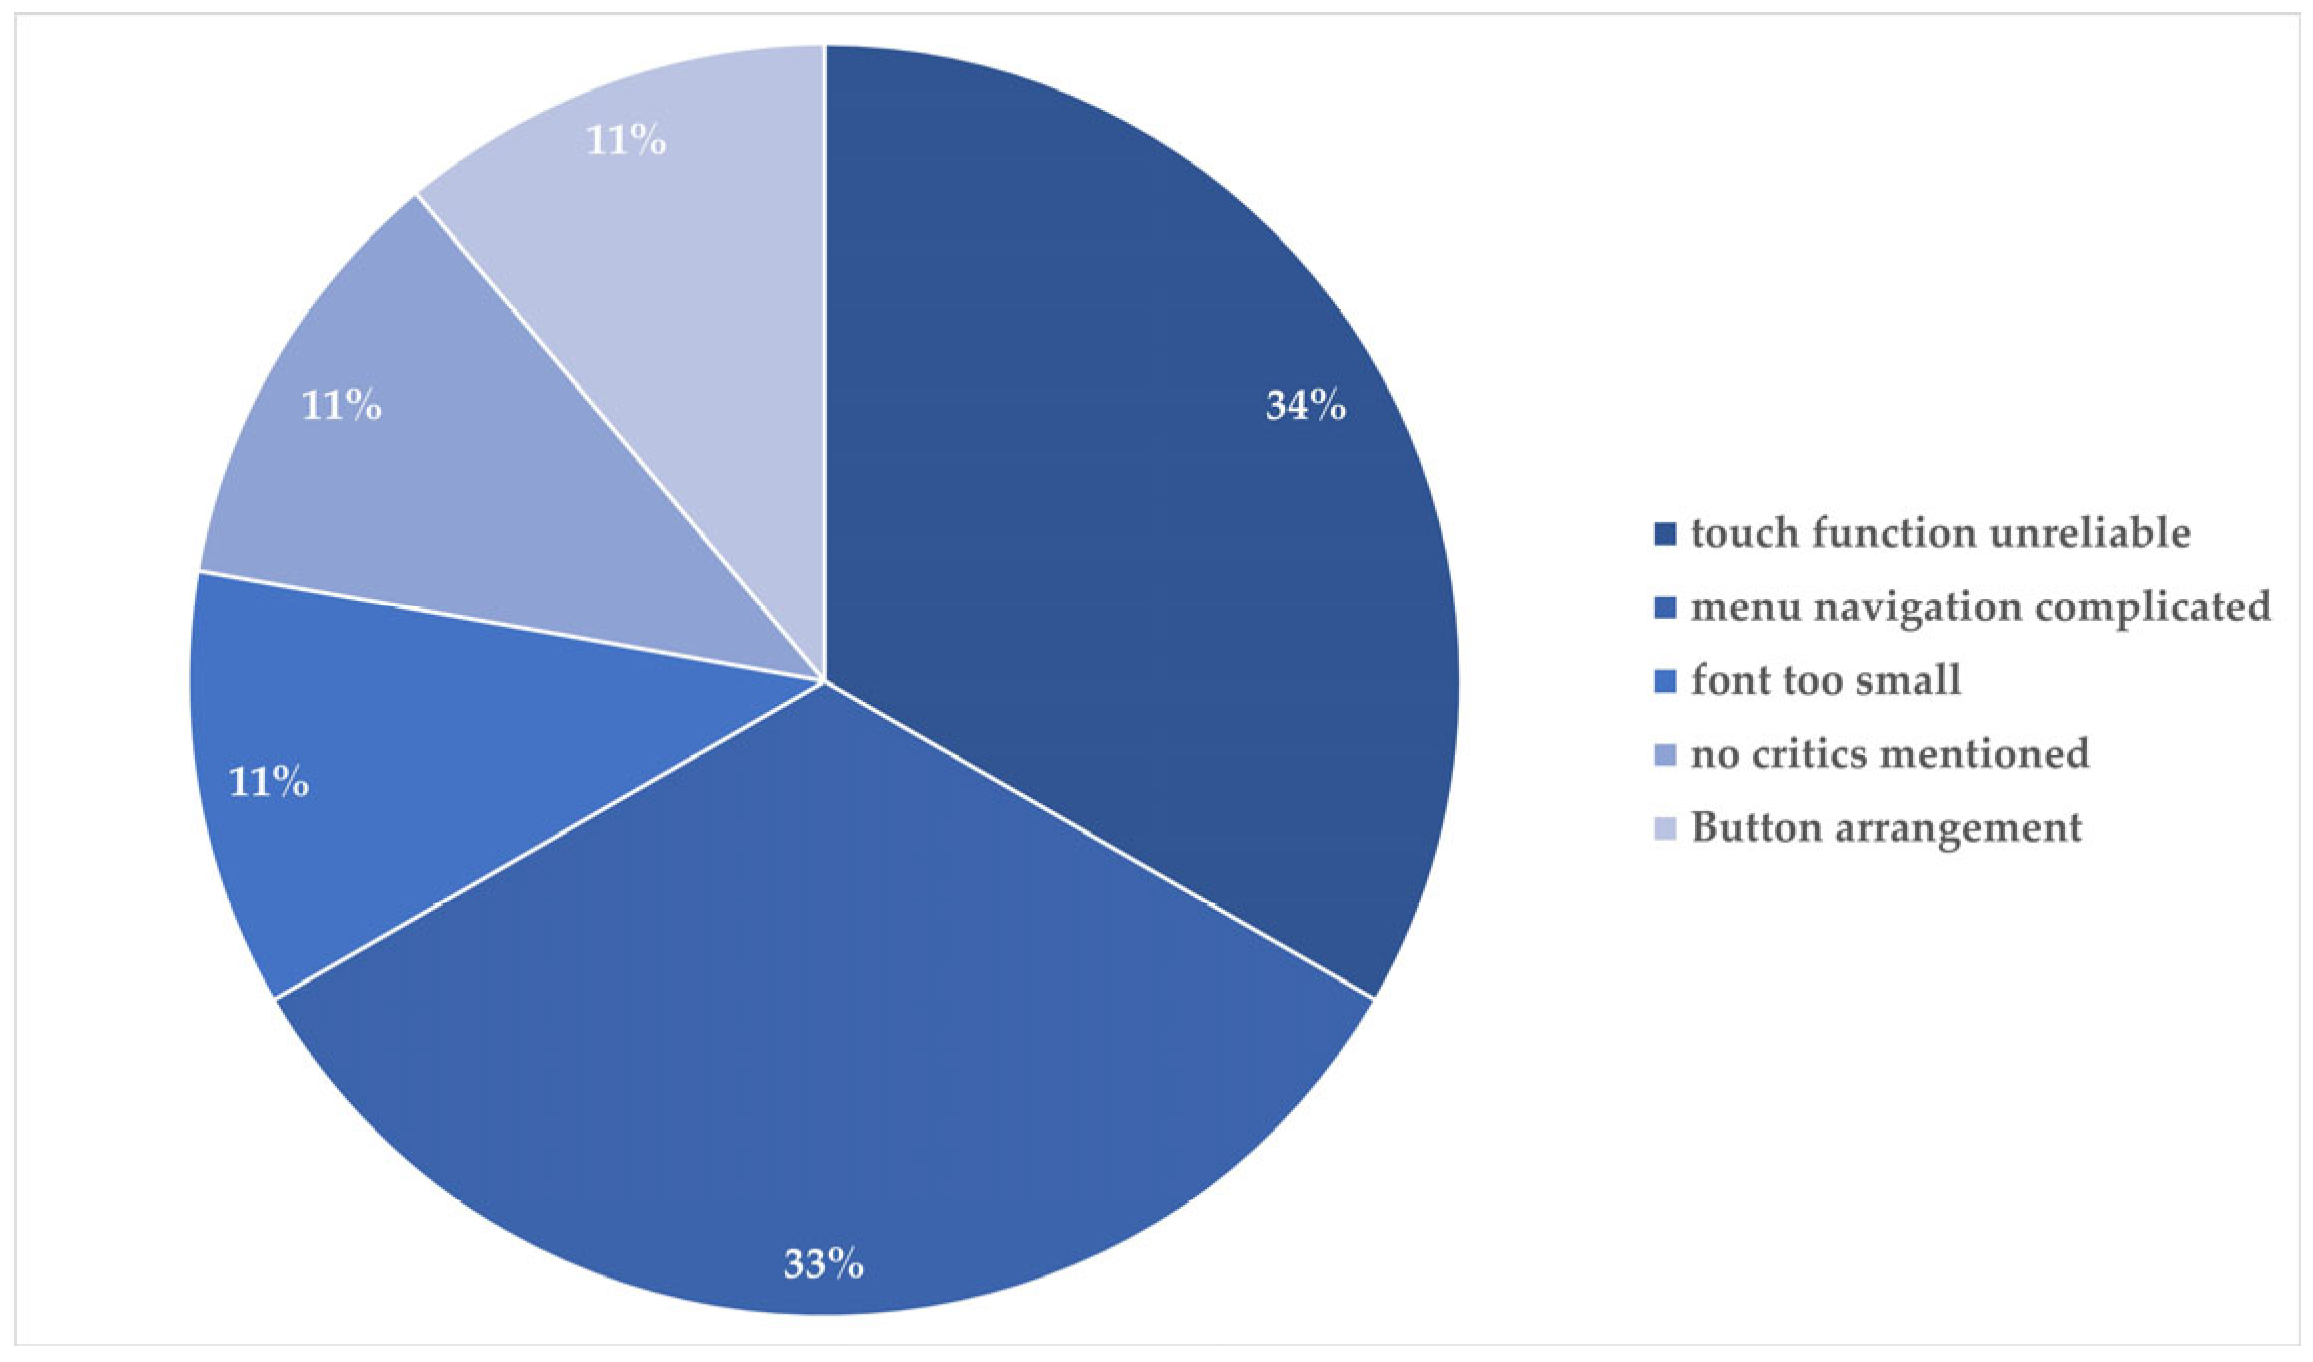
The farmers were also asked about the most bothersome characteristics of their familiar screens on agricultural machinery (
Figure 3). They could choose multiple options and mention missing ones. The majority were bothered by the complicated menu navigation and the unreliable touch function (
Figure 3). These are essential findings for improving the new UI design of NEVONEX.
3.2. Usability Test Execution
As mentioned, a total of nine farmers were interviewed. The number of participants aligns with Jakob Nielsen’s recommendations for usability tests [
30]. Due to an issue with security certificate updates on the testing day, only three participants could complete the workflow live in the tractor cabin by the on-tractor test. As Nielsen et al. [
30] described, these three participants are sufficient to identify approximately 70% of UI problems. After the problem arose, the Cockpit App was unusable for several days. Therefore, it was decided to finish the rest of the UI testing by switching to pre-recorded video sequences of the scenarios of the NEVONEX Cockpit App [
31]. The Usability Test flow was the same as shown in
Figure 1.
3.2.1. Results of On-Tractor Practical Test
All three participating farmers of the on-tractor practical test successfully completed the Cockpit App, connecting the box and opening the digital service geoNex without apparent issues. They found the workflow understandable.
Starting the application in the digital service geoNex and driving a few meters showed problems for all participants. They mentioned that the symbols in NEVONEX overlapped the functions of the digital services screen. After enlarging it, they say it became more organized. One respondent mentioned finding the color scheme confusing, and another expressed confusion about displaying section widths as either on or off, making it challenging to discern the application rate.
Two participants needed clarification on NEVONEX symbols while stopping the work and the digital service. It was suggested that automatic saving would be important.
Due to an issue with security certificate updates on the testing day, only three participants could complete the workflow live in the tractor cabin by the on-tractor test. After the problem arose, the Cockpit App was unusable for several days. Therefore, as mentioned earlier, it was decided to finish the rest of the UI testing by switching to pre-recorded video sequences of the scenarios.
3.2.2. Results of Usability Test Using Screen Video Sequences of the UI
All six participating farmers of the usability test, using video sequences of the UI, completed the first tasks of the test in the tractor cabin, starting the Cockpit App, connecting the box, opening the digital service geoNex, and selecting the field.
Starting the application was confusing and led to problems for five out of six participants, like the “On-Tractor Practical Test”.
In contrast to the “On-Tractor Practical Test”, the instruction “Enlarge the digital service screen while continuing to drive” was added, revealing that only one respondent found it understandable. Four mentioned needing help finding the zoom function. Three respondents suggested they would find a “+” as the zoom symbol more logical, and two agreed that the digital service screen was more organized when enlarged.
All respondents had difficulties finding out how to stop the task. Additionally, five out of six respondents stated that the NEVONEX symbols were confusing. This result is comparable to the “On-Tractor Practical Test”.
3.3. Feedback Questionnaires
The farmers completed the feedback questionnaires right after their respective user interface testing sessions to collect their thoughts about their experiences while working with the system. Improvements to the NEVONEX user interface were mentioned. Noteworthy are the straightforward organization of functions, clear structure, resolution, and user interface, which are more understandable than comparable interfaces. One respondent expressed a preference for the mobile UI over ISOBUS user interfaces as well. However, five out of nine respondents stated that there are no improvements in the NEVONEX UI compared to familiar ISOBUS terminals.
In general, the majority preferred a mobile design over an ISOBUS terminal. Also, using haptic buttons, especially for the most used functions and tasks, is preferable over swipe functions.
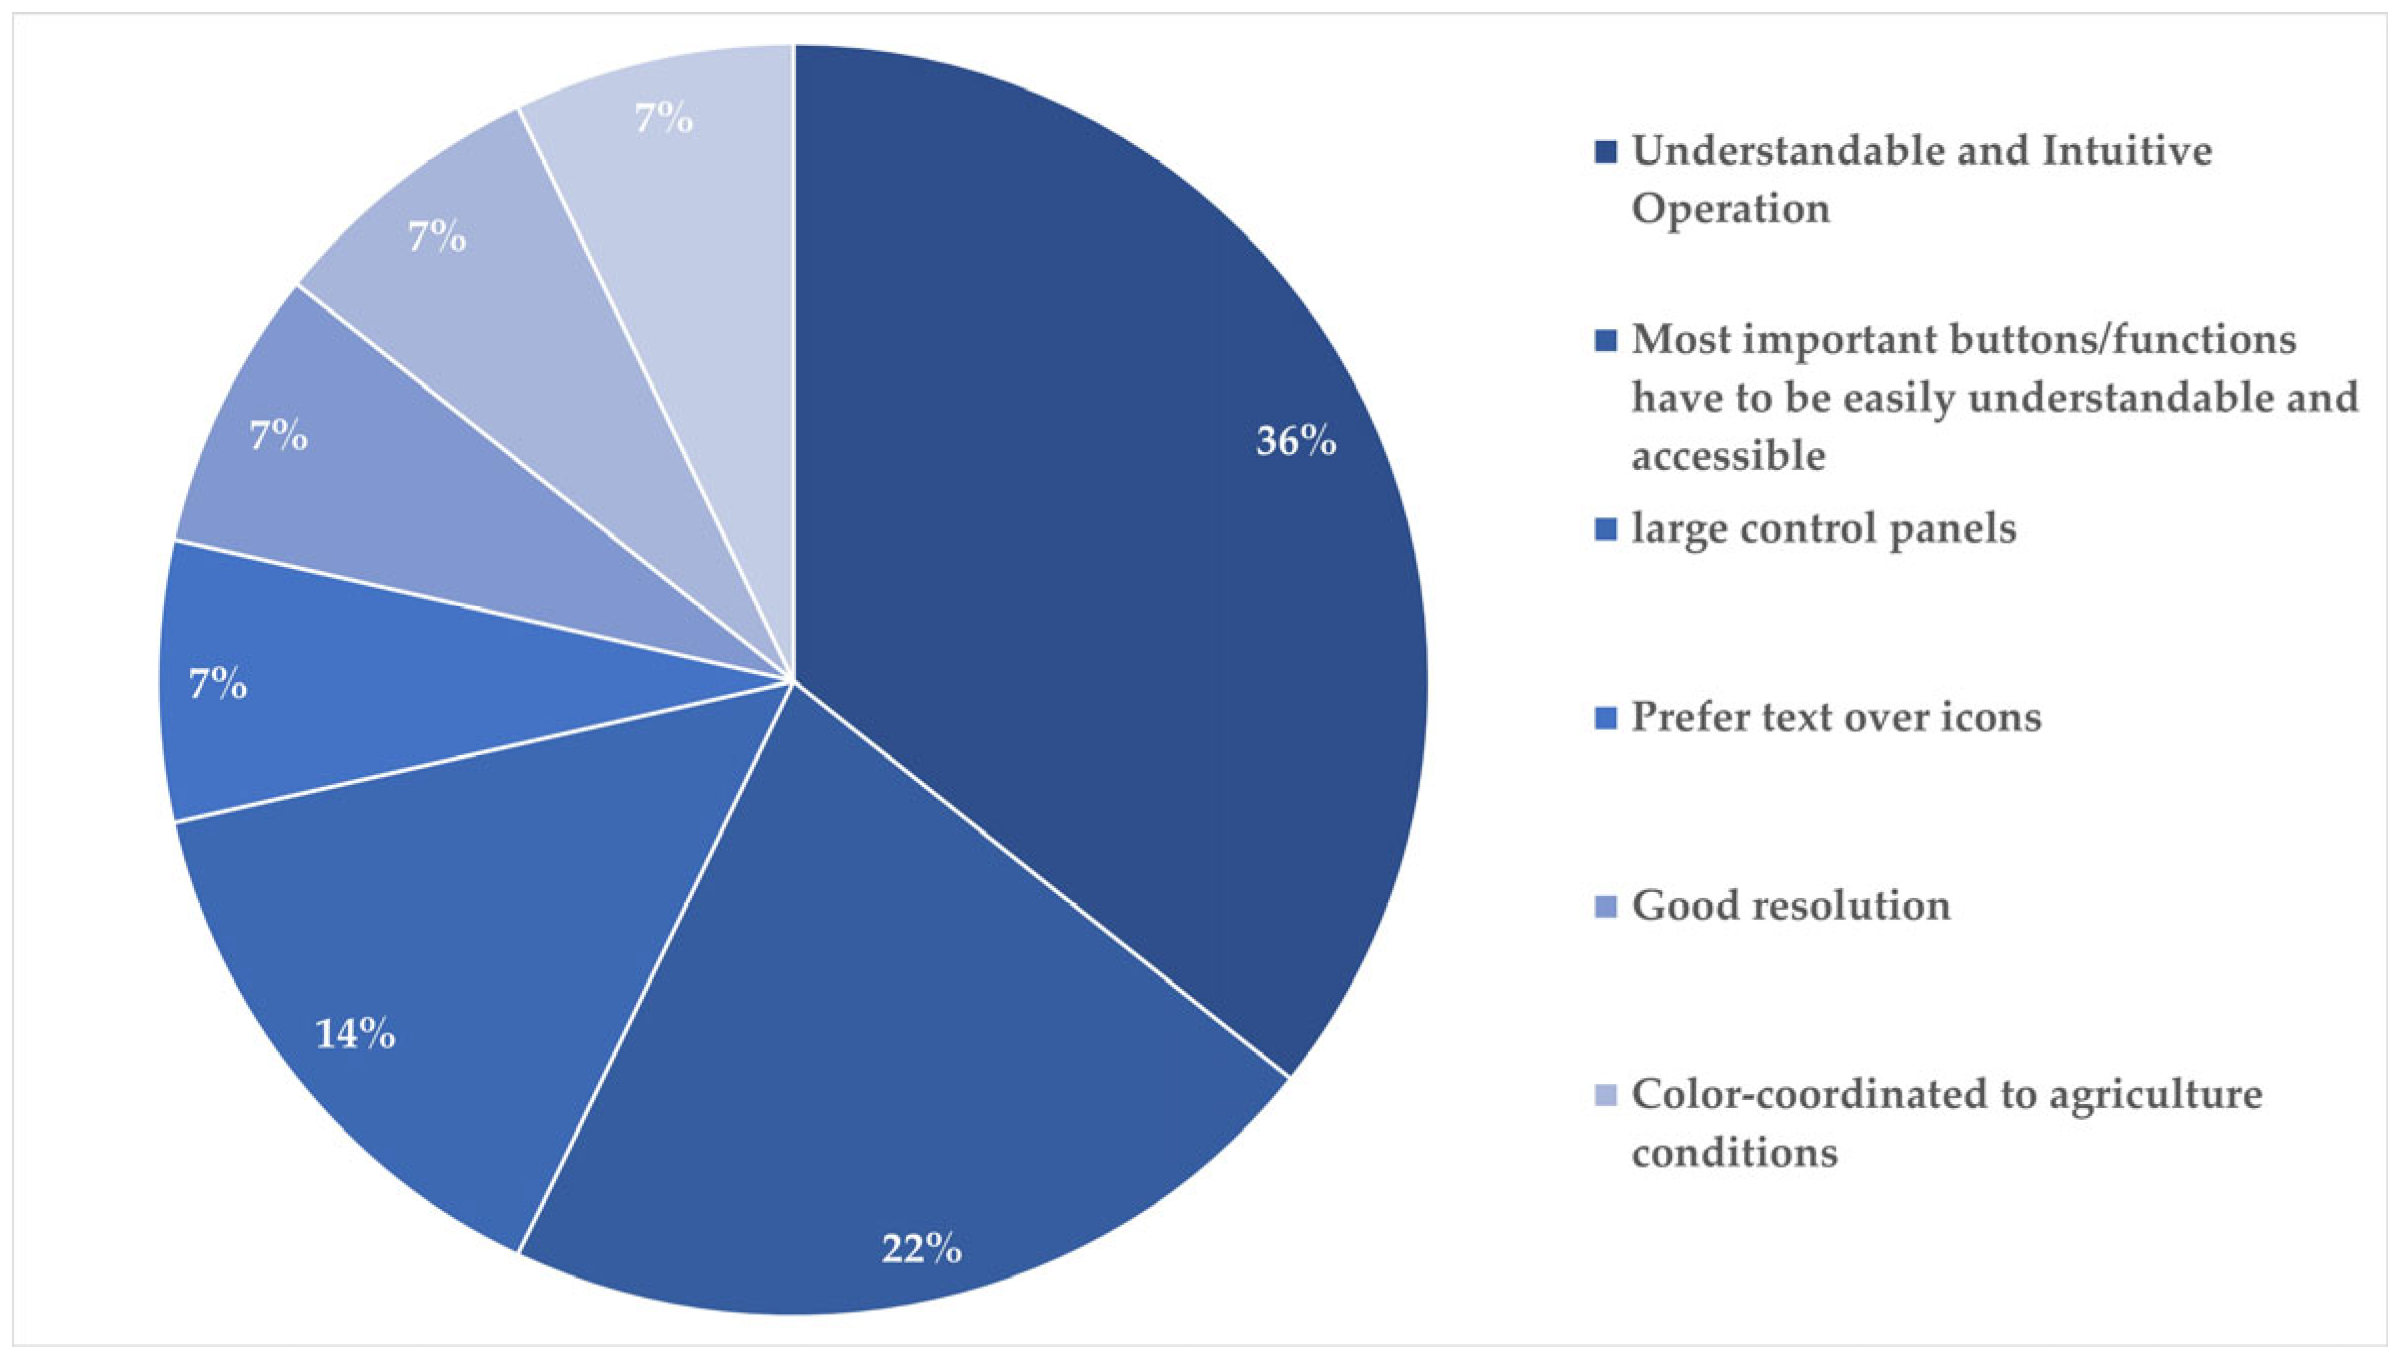
The essential characteristic of a user-friendly UI in agriculture from a farmer’s perspective is an understandable and intuitive operation for the farmer (
Figure 4). Furthermore, large control panels would be preferred (
Figure 4). In this context, farmers prefer that the most important buttons and functions must be easily understandable and accessible. The farmers mentioned the importance of colors coordinated to agricultural conditions, a good resolution, and a clear color difference for on and off functioning for an agricultural-friendly UI design. It also mentioned that text is preferred over icons for functions.
4. Discussion
The usability tests were conducted as an on-tractor practical test and using screen video sequences of the UI. The results indicate that the outcomes of the practical and survey sections were similar for both methods. This confirms Nielsen’s statement [
30] that most UI problems could be identified after testing with three to five participants. Additionally, the comparable results suggest that video-based surveys are equivalent to practical tests on the tractor. However, it is essential to note that, based on the practical test experiences and results, the task assignment of the usability test for the survey using screen videos was revised and adjusted. Nevertheless, both tests are deemed equivalent due to the high consistency in feedback and usability test statements.
Whether a test on the actual agricultural machine (practical test), which involves higher resource expenditure and greater organizational complexity, or a usability test using screen videos or dummies is better suited to assess the user-friendliness of screen design on agricultural machinery is not evident from the conducted surveys. To conserve resources for companies and simultaneously determine optimal user-friendliness for farmers about screen design, more precise surveys with identical usability tests in this direction would need to be conducted in the future. However, assessing this for agricultural machinery, in general, is complex, as screen usage is often linked to controllers and buttons on the armrest, making the haptic controls and their positioning crucial for usability. Therefore, the design of the tractor cabin, considering the manufacturer’s proprietary operating systems, must be evaluated and improved to enhance user experience.
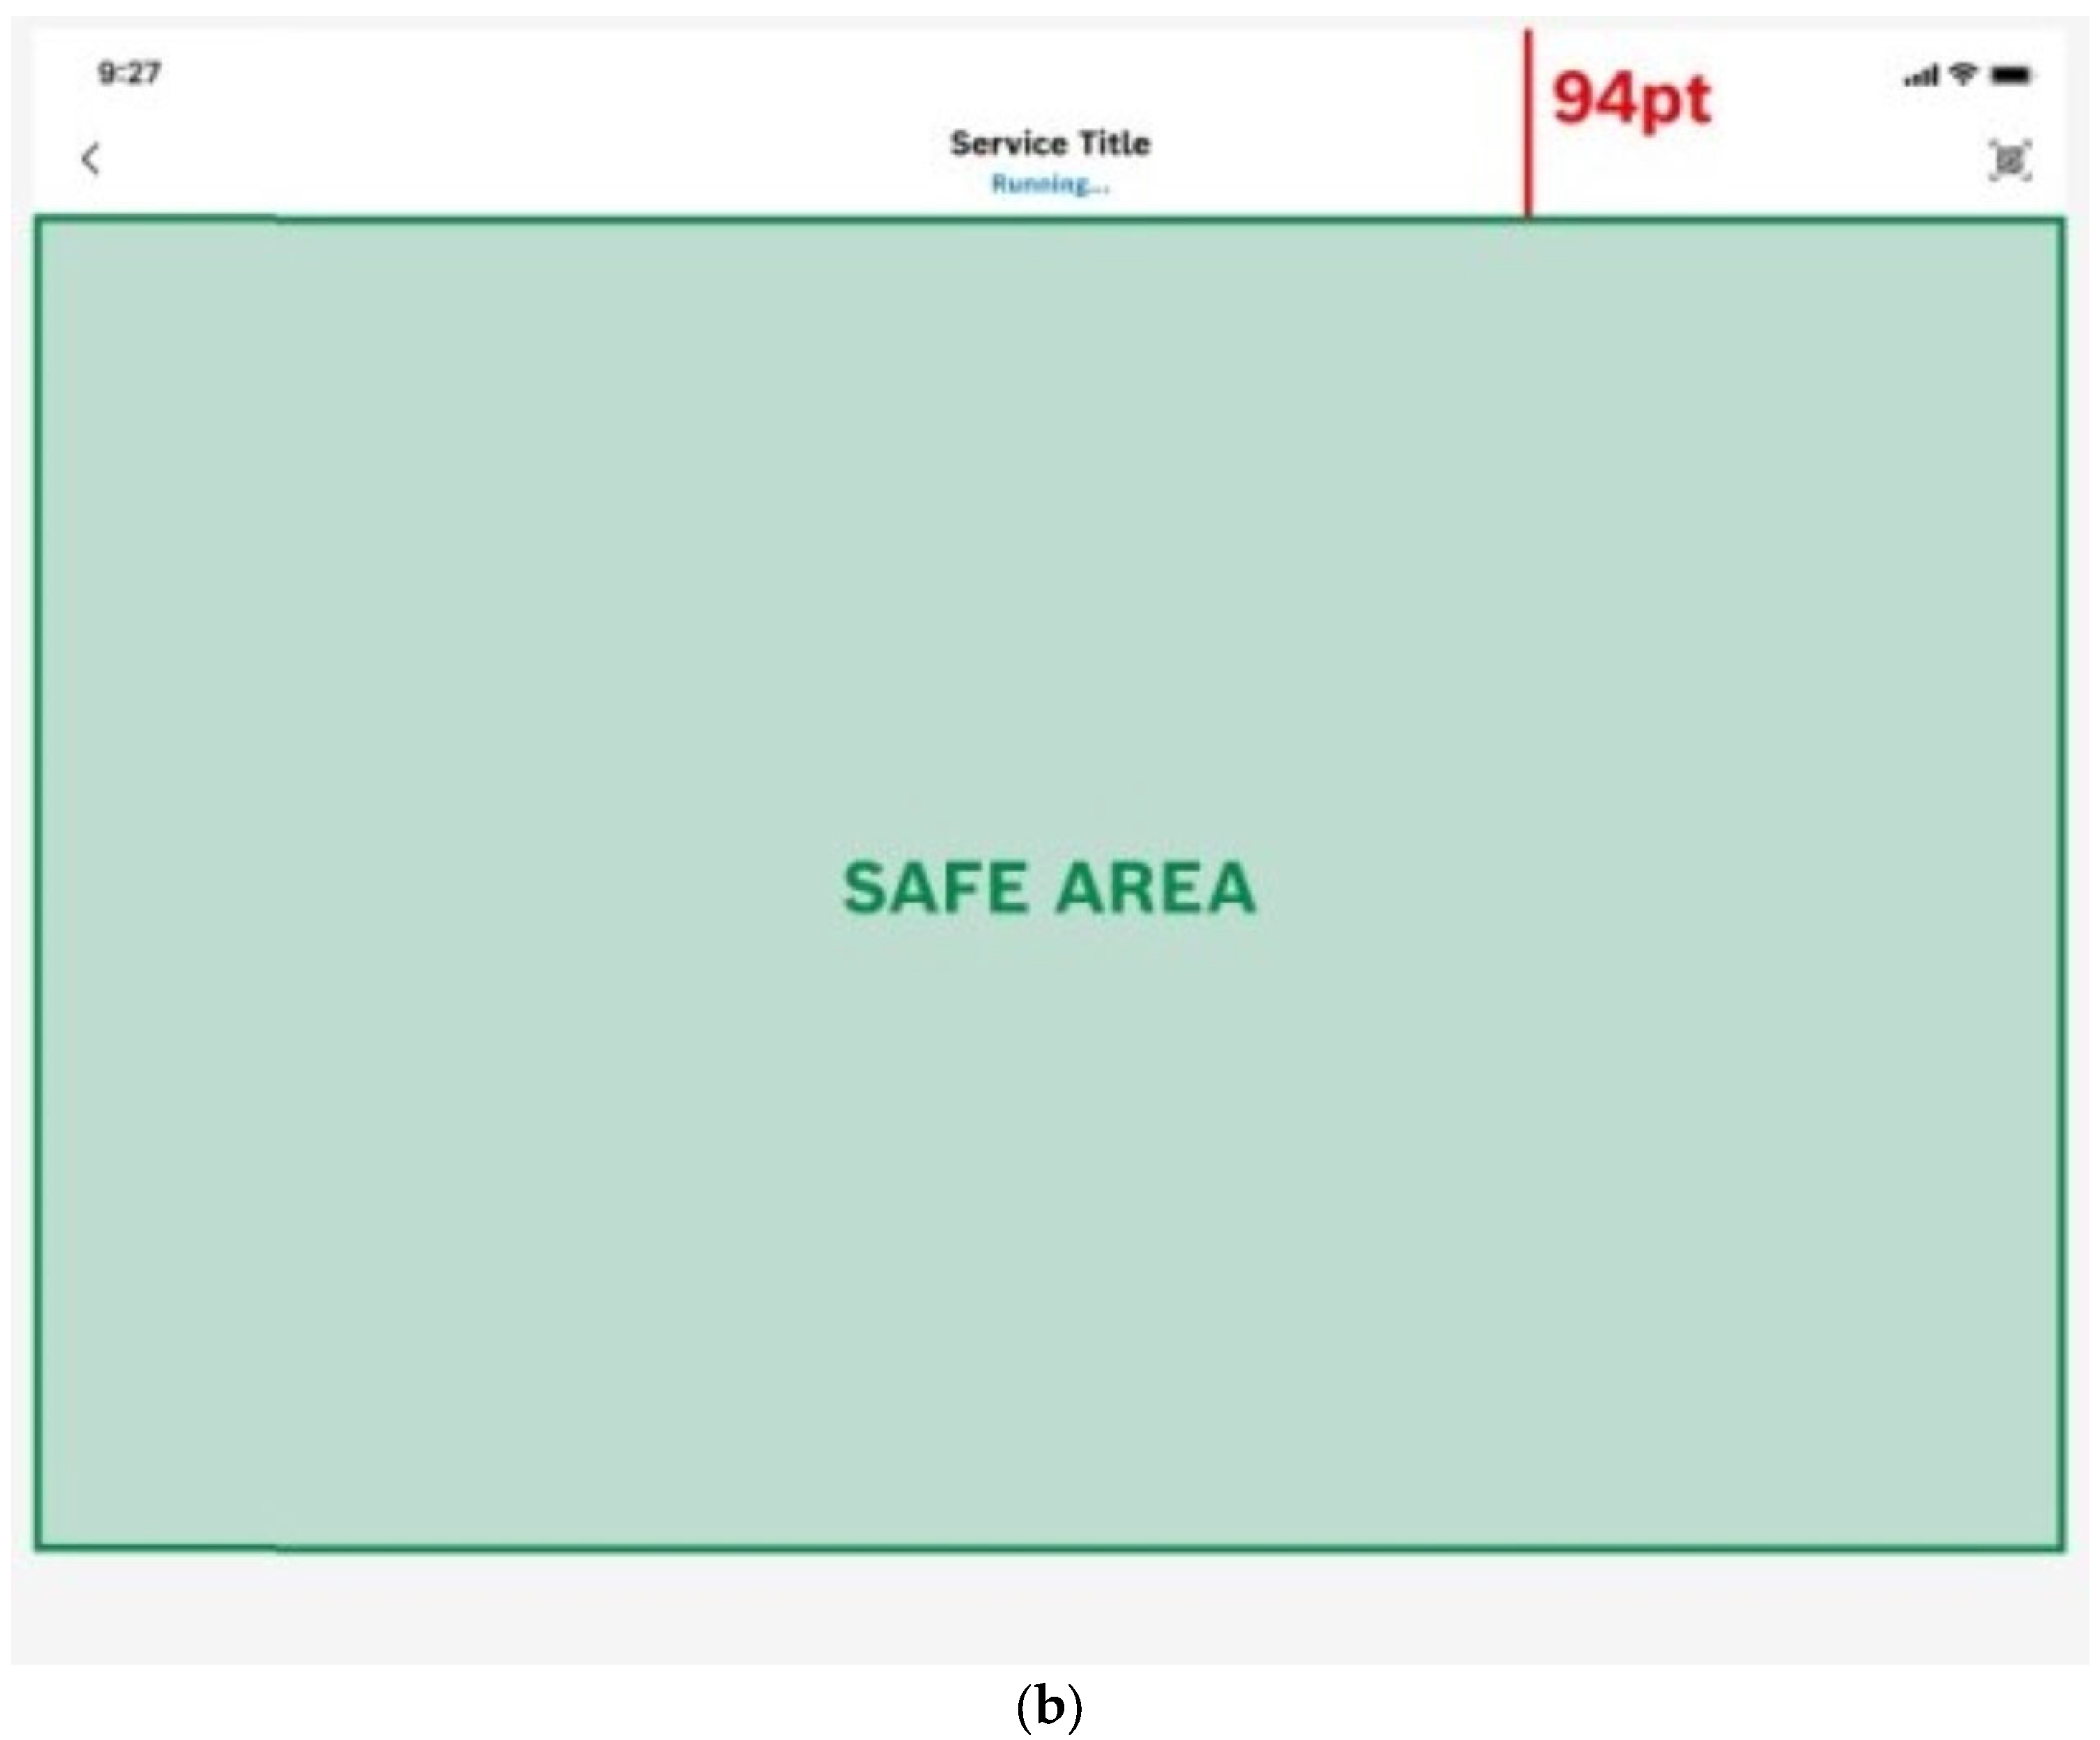
The survey focused on the visual design of the NEVONEX Cockpit App, representing the UI design of an on- and off-board IoT ecosystem for agricultural machinery. As previously mentioned, the visual design of the NEVONEX user interface for the Cockpit App is based on guidelines for mobile UI design. In
Figure 5, the old design (
Figure 5a) and the reworked UI design (
Figure 5b), including the space, are shown. The “SAFE AREA” shows the area for the NEVONEX Digital Services (“App in App” approach) tasks and the spacing. The rework was based on the usability test and feedback from the participating farmers. Compared to the reworked UI design of NEVONEX, based on the usability test results, the digital service area was extended, and the spacing was reduced (
Figure 5b).
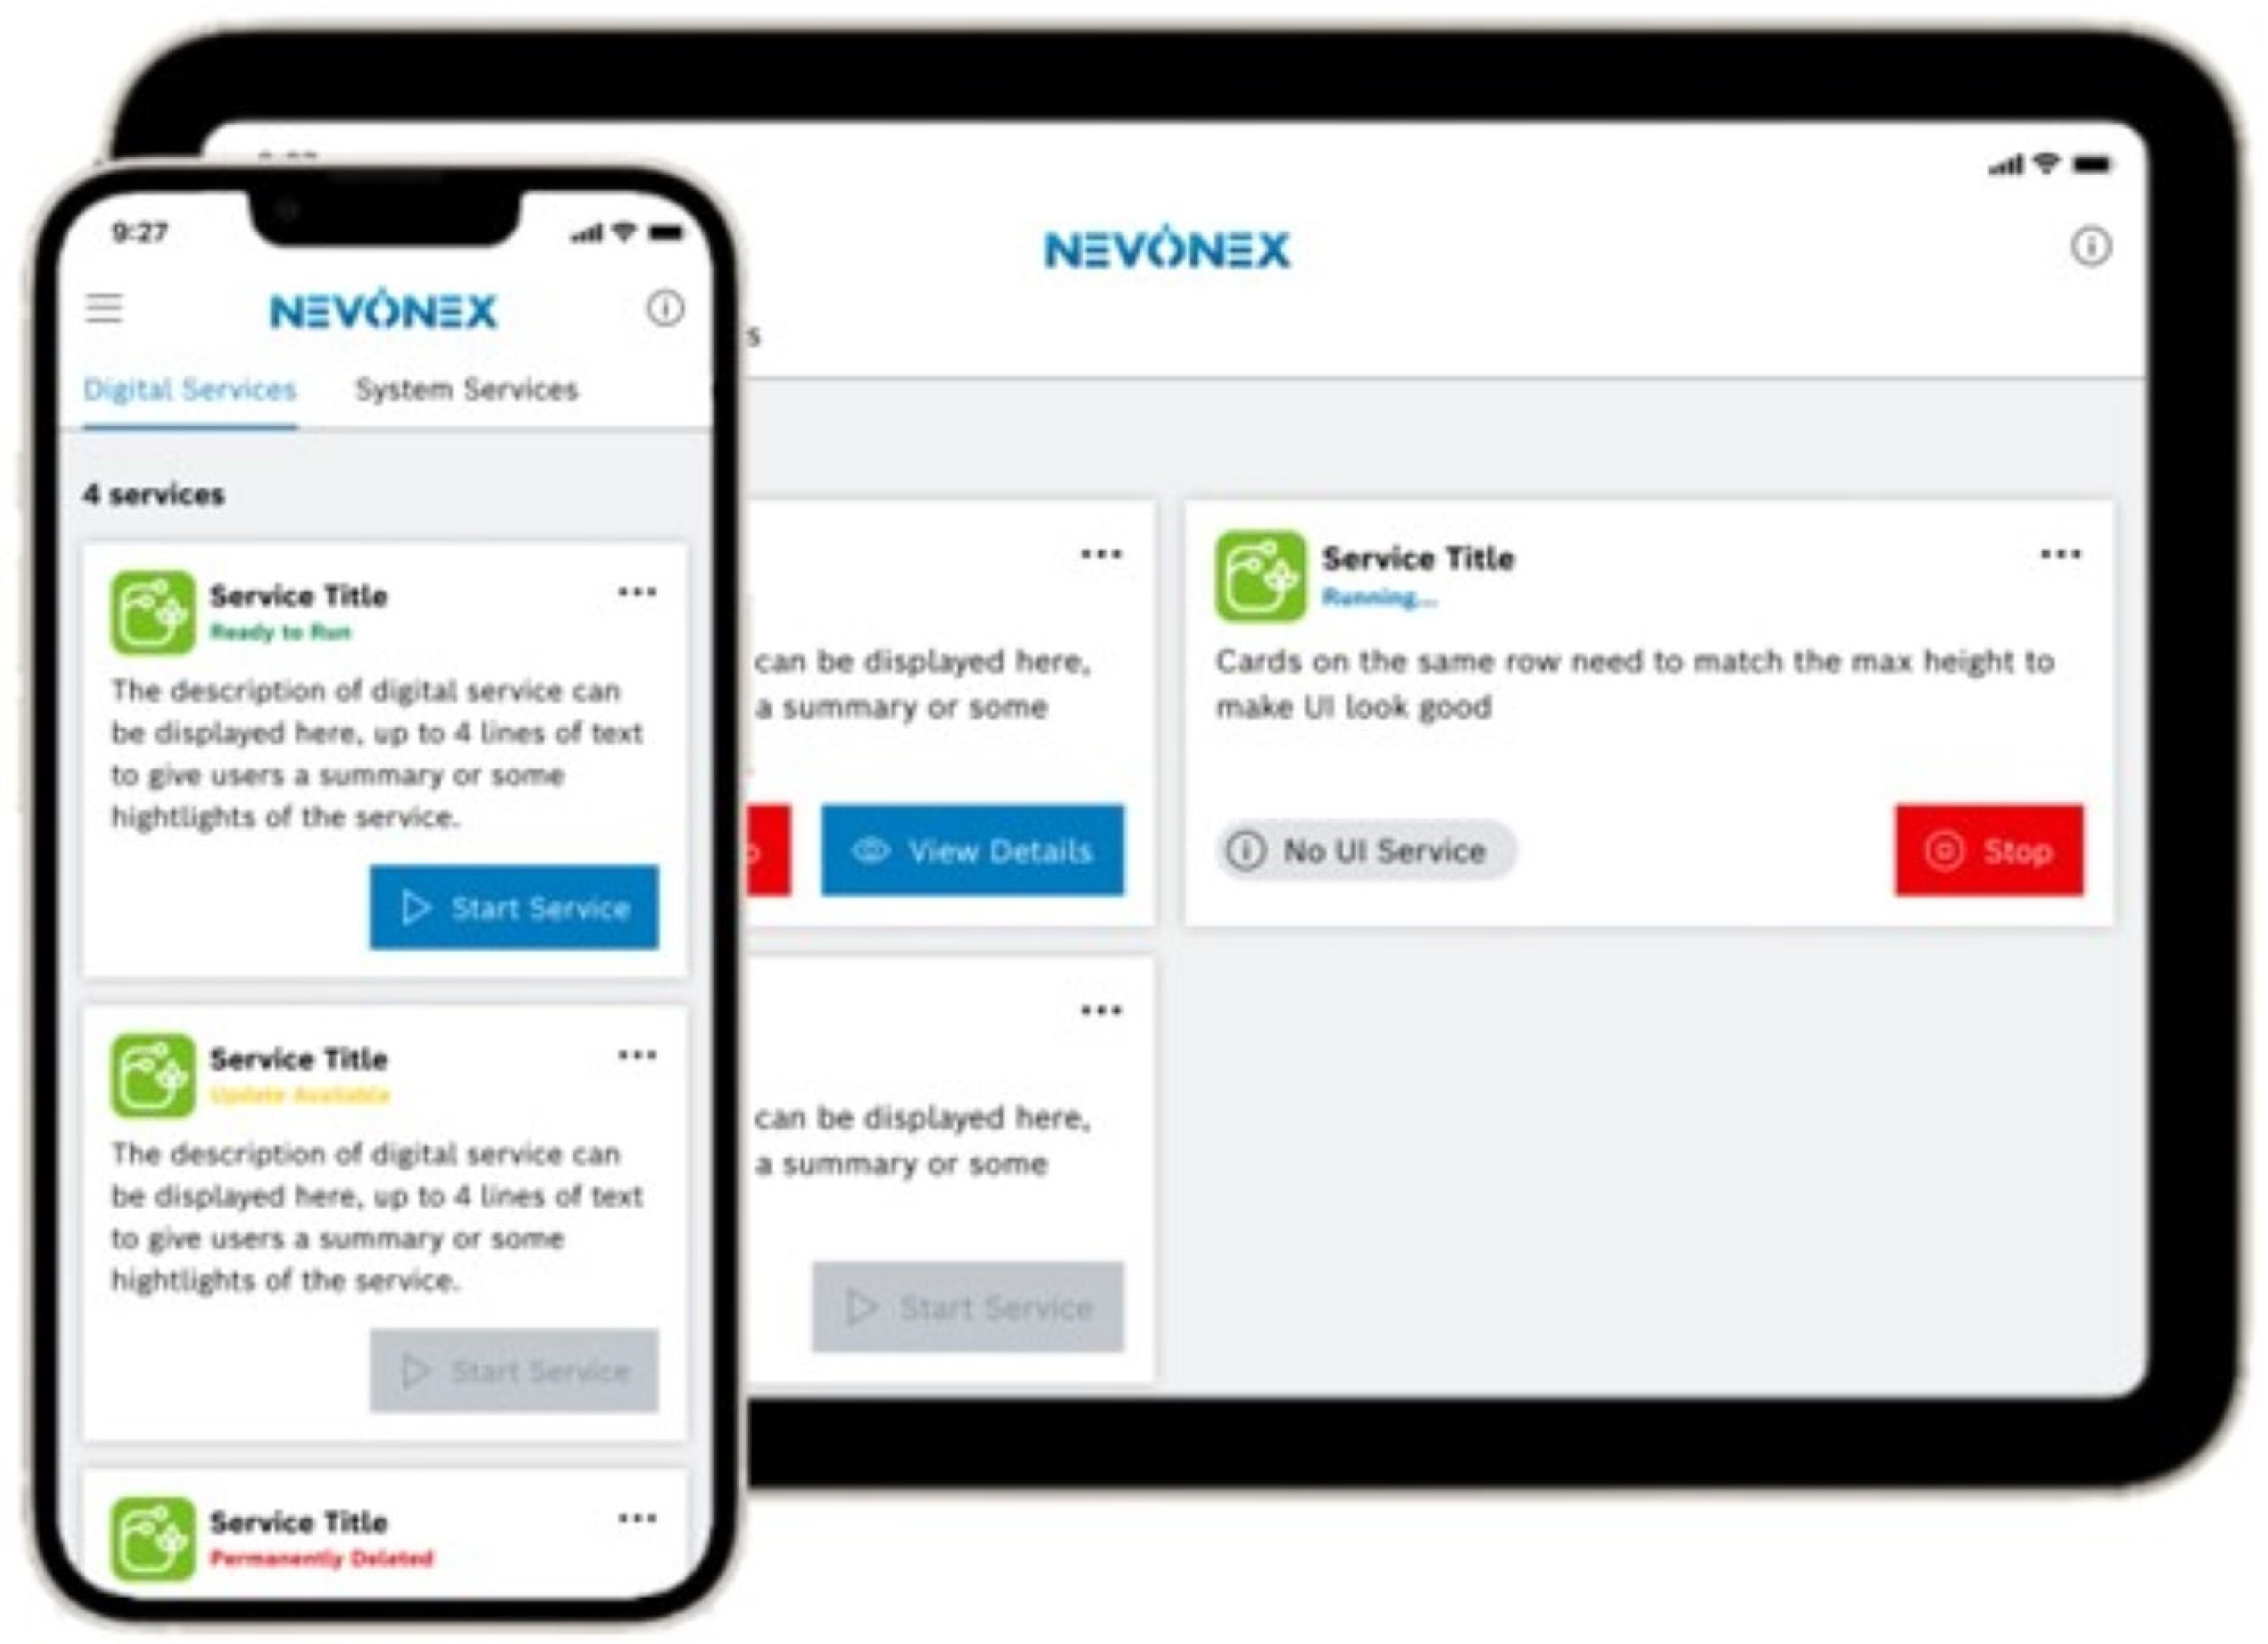
A commercial tablet was used as a human–machine interface for NEVONEX to leverage the fact that most potential customers already own a tablet and that all the computing power for running the digital services is already located on the NEVONEX Box. However, there are aspects to consider when choosing the right hardware, like choosing a mobile end device of appropriate size and ruggedness. In addition to increasing the safe area for displaying the information and control buttons of the individual digital services, a change was made to a tile-based overview of all the installed digital services that could be run in parallel. This change also enabled the implementation on mobile devices with smaller screens (
Figure 6), as the tile view works equally well on tablets with larger than 10-inch screen sizes and smartphones (showing fewer tiles). The tile concept and how it looks on tablet computers and smartphones is shown in
Figure 7.
Points such as arrangement in tiles and red buttons for exiting digital services have been implemented. Apart from the space for the digital services and the spacing change, the functions are now represented with more text instead of icons, providing a description. The icons of NEVONEX in the header, which the farmers often criticized during the usability test, have also been removed. The digital services are now arranged in tiles on a main page, as seen in
Figure 7. Furthermore, a menu navigation was added.
Three of the surveyed farmers were presented with the latest design a month after the actual useability tests, and the results were implemented into the new design of the NEVONEX Cockpit App. They all noticed the more apparent arrangement through the tiles and the enlarged safe area. In addition, the new menu navigation, arrangement, and overview of digital services and the omission of icons were also positively evaluated.
In summary, it can be noted that the redesigned UI for the tablet successfully addressed the farmers’ criticisms. To precisely illustrate this, the next step would involve conducting another usability test for the new UI design with a similar task assignment and the same participants, making them comparable.
Increasing the number of participants would be necessary to create a universally applicable guideline for UI design in the IoT ecosystem on agricultural machinery. This would help identify potential habituation effects of individuals and UIs from multiple manufacturers, which should be examined with the same participants.
Furthermore, criticism was directed at the color scheme of NEVONEX, which was perceived as too neutral and not vibrant enough. Given the continuous changes in light exposure on the screen, the vehicle operator must discern screen information during driving and operational tasks. Whether this was better regulated in the new UI design would need to be determined through a follow-up usability test.
During the survey, several criticisms were also voiced regarding hardware selection. In addition to the complex menu navigation, which will be examined shortly, the most significant complaint was the unreliable touch function on some of the consumer device’s screens. This issue primarily stems from UI design and hardware susceptibility to factors such as dust, dirt, vibrations, and light exposure. Considering that dirty fingers often impair touch functionality, it is understandable that most respondents prefer physical buttons over swipe functions. Therefore, for future research, an exploration of how modular physical input devices that pair to the mobile device running the Cockpit App could be incorporated into the user experience (UX) concept could be further evaluated.
The complicated menu navigation of well-known systems was frequently criticized. This leads to the assumption that no well-known agricultural machinery factors currently have an outstanding and user-friendly UI and operation system for tractor screens.
However, it can be assumed that, as tractor operators regularly work with a system, they become accustomed to it, as suggested by responses to the question, “Do you find it more organized when the visual design resembles that of a smartphone app (mobile device) or the familiar ISOBUS terminals?” Most respondents preferred a user interface design following mobile guidelines, as smartphones are integral to their daily lives and the respondents were accustomed to their design. As mentioned earlier, the farmers presented with the new design of the NEVONEX UI found the new menu navigation and the overview page of digital services more appealing at first glance than the old design.
5. Conclusions
In summary, doing a usability test for UI improvements in agriculture on video screens or with tools like a “click dummy” with five persons like Nielsen [
30] is a valuable tool for getting quick feedback with an affordable study design. However, more than a study of UI on a monitor alone is required to significantly improve UX in agriculture machinery. The tractor cabin workplace must be considered holistically [
34], with the farmer prioritizing fast and intuitive operation and reliable functionality. Given the weather dependency and reliance on external factors, agriculture is a time-sensitive and complex industry [
1].
Regarding the UI design, attention should be mainly given to the essential characteristics of a user-friendly UI in agriculture from the farmers’ perspective. Therefore, understandable and intuitive operation is of great importance. The structure of an intuitive operational system can be developed through a usability test, which is orientated on a practical workflow in agriculture.
As the likelihood of achieving a uniform, universal tablet solution is currently deemed unlikely in agriculture, introducing a pure and universal tablet solution with a uniform user interface (UI) is challenging. This is due to the complex, heterogeneous, and operation-specific conditions prevailing in the external environment of the agricultural sector, as mentioned earlier. However, tablets can serve as additional screens, offering more display areas for controlling attachments and capturing and transmitting data, reducing the number of screens in the tractor cabin.
In March 2023, the NEVONEX Digital Ecosystem was discontinued by Robert Bosch GmbH (Stuttgart, Germany). This business decision cannot be attributed to poor visual UI after the revision. The concept of a cross-manufacturer solution for the IoT ecosystem of a farm remains relevant, especially in small-structured regions with predominantly mixed fleets and highly modular and individualized requirements from high-intensity farming operations. In the future, leading tractor and attachment manufacturers will likely enable cross-manufacturer interface communication for farmers [
35], facilitating their work, improving user-friendliness, and driving digital transformation in agriculture.
