Abstract
Broilers are particularly sensitive to heat stress, which can impair growth, and lower conversion efficiency and survival rates. Under a climate change scenario, maintaining optimal thermal conditions within broiler houses becomes more complex and energy-intensive. Climate change can worsen air quality issues inside broiler houses by increasing the concentration of harmful gases, and proper mechanical ventilation systems are essential for diluting and removing these gases. The present study aimed to develop and validate a model for the ideal broiler housing strategy by applying the Paraconsistent Annotated Evidential Logic Eτ. A database from four broiler houses in a commercial farm, rearing 157,700 birds from the 1st to the 42nd day of growth, was used in the research. All environmental data were recorded weekly inside the houses, and on day 42, flock mortality, overall feed-to-gain ratio, and body weight were calculated and registered. The Cohen’s Kappa statistics for each environmental parameter classification compared to the paraconsistent classification. Results indicated that temperature shows good agreement, relative humidity shows slight agreement, air velocity presents a good agreement, CO2 concentration has a slight agreement, and NH3 concentration is classified by slight agreement. The environmental and productivity variables as a function of the broiler age using the extreme True paraconsistent state indicate the model validation. The paraconsistent analysis presented the ideal scenario for broilers’ growth, maintaining the environmental variables level within a particular threshold and providing greater profit to broiler farmers.
1. Introduction
The global broiler meat industry has experienced significant growth over recent years, driven by rising consumption patterns worldwide and advancements in production efficiencies. The United States, Brazil, and China are among the world’s largest broiler producers, contributing significantly to the global supply. The United States is noted for its high production levels, while Brazil has gained prominence as the largest exporter of chicken meat [1,2]. Broiler meat is the world’s second most consumed meat, with forecasts suggesting an increase in consumption to nearly 35 kg/capita/year by 2027 [3]. The demand for broiler meat reflects its affordability, versatility, and perceived health benefits compared to red meat.
However, rising environmental temperatures constitute a significant risk factor for the poultry industry, potentially compromising avian thermoregulation, feed production, and disease susceptibility. Due to climate change, broiler housing faces challenges, including various issues related to the physical environment, health management, and production efficiency within broiler production systems in different geographic regions [4,5,6,7]. These challenges are critical to addressing the birds’ well-being, operational efficiency, and product quality. Such issues are related to the variables inside the housing, such as air quality (ammonia and carbon dioxide concentrations and aerial particulates) and thermal environment (dry bulb temperature and relative humidity). The ideal housing environment balances air quality and appropriate temperature related to the bird’s age, which can be achieved using equipment designed to control it [8,9,10].
The efficiency of animal product synthesis is compromised during the summer heat, and it is estimated that a 1.0 °C increase in ambient temperature during the hot months leads to a 4.5% reduction in production [11,12]. However, the needs of broilers change very quickly from the first to the last weeks of growth (generally around 7–9 weeks until they reach market size), posing a challenge to design a set of equipment solutions that balance air quality and thermal environment, constantly modifying growth needs [7].
The concentration of ammonia and dust within broiler houses sets significant challenges, affecting broiler health and the surrounding environment, and it is highly dependent on litter quality and management [13,14,15]. High levels of ammonia and inspirable dust can lead to respiratory problems in broilers and carry odorous compounds that affect the quality of life for nearby residents [16]. Broiler production faces additional challenges due to their susceptibility to heat stress, which affects their feed intake, metabolism, health, and overall growth performance [17].
Mitigating heat stress is crucial for maintaining productivity under these conditions [18,19]. Precision Livestock Farming technologies offer promising solutions to optimize broiler production by monitoring and adjusting environmental conditions in real time [20]. However, the input data for the overall design of supporting equipment decisions needs calibration from previous models and dealing with the uncertainties that heat waves and other extreme events may represent to broiler housing.
Addressing the challenges posed by uncertain, insufficient (paracomplete), or conflicting data necessitates directly engaging with these anomalies. However, conventional forms of logic, which thrive on certainty, fail when faced with such complexities. In this context, the Paraconsistent Annotated Evidential Logic Eτ (Logic Eτ ) directly addresses problems related to imprecision, incompleteness, and inconsistency, generating more assertive solutions [21]. Paraconsistent logic can encompass propositions p and (p) (the negation of p), which are both true without the danger of trivialization. In paracomplete logic, theories based on it can encompass propositions p and ¬p (the negation of p), both false and without trivialization [22]. We refer to a particular paraconsistent logic, namely the logic Eτ. The formulas of the logic Eτ is of the type p(μ, λ), where (μ, λ) ∈ [0, 1]2 and [0, 1] is the real unitary interval (p denotes a propositional variable). An order relation is defined on [0, 1]2: (μ1, λ1) ≤ (μ2, λ2) ⇔ μ1 ≤ μ2 and λ2 ≤ λ1, constituting a lattice that will be symbolized by τ. A detailed account of annotated logic is to be found in [20]. Logic Eτ has been previously applied to several areas of knowledge in decision-making tools [23] and the classification of animal stress [24,25].
Some investigations have been conducted on predictive approaches concerning environmental parameters within animal housing facilities, encompassing conventional statistical methodologies and contemporary machine learning techniques [9,26,27,28]. Nevertheless, extant methodologies frequently encounter challenges related to inadequate predictive precision [20] and limited adaptability to environmental fluctuations within the intricate and dynamically evolving animal husbandry setting [10,29]. The problem primarily stems from the broiler housing environment’s highly nonlinear, dynamically evolving, and data-dependent nature. Using paraconsistent logic to analyze and decide broiler house conditions allows for a more sophisticated approach that acknowledges and effectively manages the complexity and contradictions inherent in real-world animal production systems [30,31].
This research focused on the requirement for precise forecasting of environmental variables, including temperature, relative humidity, air velocity, ammonia, and carbon dioxide, within broiler housing, which are vital for the growth and well-being of the birds. Predicting the ideal broiler housing needs a holistic approach due to the variation of environmental parameters and the complex interactions of the biological and physical factors intervening in the broiler housing indoors. The present study aims to propose a model for the ideal housing environment using the Paraconsistent Annotated Evidential Logic Eτ and validate the developed model.
2. Materials and Methods
A database from four broiler houses (n = 3328) in four commercial farms, rearing 157,700 birds from the 1st to the 42nd day of growth, was used in the research. The flock density varied from 13 to 15 birds/m2. All husbandry regimes were performed according to practices recommended by the breeder companies [32].
2.1. Database
The houses were made of concrete blocks 120 m long and 20 m wide, with a roof slope of 22%. Birds had automatic feeding and drinking lines from the same commercial strain (Cobb Vantress 500). All environmental data were automatically recorded inside the houses, starting on the first day. For the model validation, we used data starting from the 21st day, the end of the brooding period, since during this period, the chicks require specific environmental conditions, such as controlled temperature, humidity, and lighting, to ensure their health, growth, and development, determined by the commercial breeders. On day 42, when broilers reached market size, flock mortality (%), overall feed-to-gain ratio, and body weight (g) were calculated and registered (Table 1).

Table 1.
Zootechnical performance of broiler chickens at 42 days in the four studied houses.
The broiler productivity data were acquired using the genetic strain methodology [32], which uses a 5% flock sampling to measure the body weight each week of production until slaughter. All houses had mechanical ventilation (exhaust fans with a diameter of ~1.35 m) and cooling strategies using evaporative cooling equipment (cellulose cooling pad system) (Figure 1) [33].
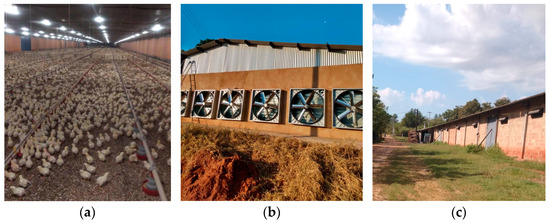
Figure 1.
Images from indoor (a) and outdoor back with the exhaust fans (b) and the lateral outdoor view (c) of the commercial broiler house.
Monitoring of the thermal environment was carried out by recording data on dry bulb temperature (Tbs, °C), relative humidity (RH, %), and air velocity (Var, m/s). Tbs and Var data were recorded using a wire anemometer (model9555, VelociCalc, TSITM, Shoreview, MN, USA), with a reading scale for temperature from −18 to 93 °C and resolution of 0.1 °C and airspeed with an amplitude of 0 at 30 m/s, speed resolution of 0.01 m/s and accuracy of ±0.015 m/s. RH data were collected using the equipment (THDL 400, Instrutherm, Sao Paulo, SP, Brazil), with an amplitude of 25 to 95% and an accuracy of ±5%. NH3 and CO2 data were recorded using an instantaneous gas concentration meter (GasAlertMIcro 5, BW Technologies-Honeywell, Essex, England, UK).
Broiler age and housing requirements, including the indoor environmental variables, were classified according to the effect each one had on the broiler’s performance and current literature (Table 2).

Table 2.
Classification of dry bulb temperature (DBT, °C), relative humidity (%), air velocity (AV, m/s), ammonia concentration (NH3, ppm), and Carbon dioxide (CO2, ppm) as a function of the broiler’s age.
The following classifications were also stipulated for DBT_Classification, RH_Classification, AV_Classification, CO2_Classification, and NH3_Classification obtained adopting the following weights: Unacceptable = −0.4, Poor = −0.3–0.2, Acceptable = 0.0, Good = 0.2, Excellent = +0.4. These weights were given by distributing the mean value considered appropriate by the references (Table 2) in each category.
2.2. Paraconsistent Annotated Evidential Logic Eτ
We applied the Logic Eτ on the re-arranged dataset. Regarding the application of the logic Eτ, p(μ, λ) can be intuitively read: ‘It is assumed that p’s favorable evidence degree (or belief, or probability) is μ and contrary evidence degree (or disbelief) is λ’. For instance, (1.0, 0.0) naturally indicates total favorable evidence, (0.0, 1.0) indicates total unfavorable evidence, (1.0, 1.0) indicates total inconsistency, and (0.0, 0.0) indicates total paracompleteness (absence of information). The operator ~: |τ| → |τ| defined in the lattice ~ (μ, λ) = (λ, μ) works as the “meaning” of the logical negation of Eτ. The consideration of the values of the belief degree and disbelief degree is made, for example, by specialists who use heuristics knowledge, probability, or statistics. We can consider several important concepts (all considerations are taken with 0 ≤ μ, λ ≤ 1):
Segment DB—segment perfectly defined: μ + λ − 1 = 0
Segment AC—segment perfectly undefined: μ − λ = 0
Uncertainty Degree: Gun(μ, λ) = μ + λ − 1; Certainty Degree: Gce(μ, λ) = μ − λ;
With the uncertainty and certainty degrees, we can obtain the following 12 output decision-making states: extreme states that are False, True, Inconsistent, and Paracomplete, and the non-extreme states. All the states are represented in the lattice of Figure 2, and the usual Cartesian system can represent the underlying set of the lattice τ.
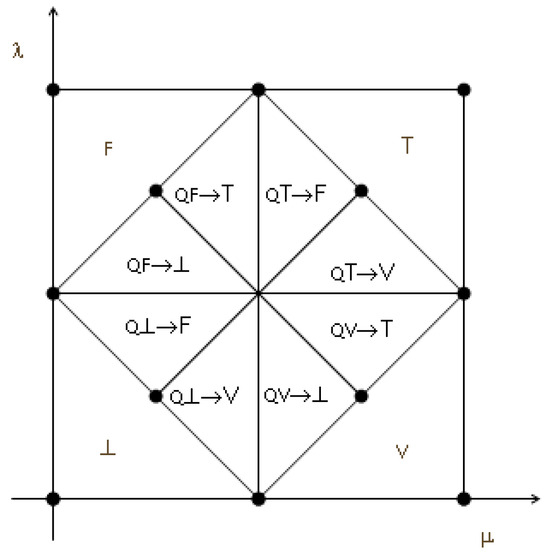
Figure 2.
Representation of the extreme and non-extreme state’s regions [21,30,31].
Where True = V, False = F, Inconsistent = T, Paracomplete = ⊥, Quasi-true tending to Inconsistent = QV→T, Quasi-true tending to Paracomplete = QV→⊥, Quasi-false tending to Inconsistent = QF→T, Quasi-false tending to Paracomplete = QF→⊥, Quasi-inconsistent tending to True= QT→V, Quasi-inconsistent tending to False = QT→F, Quasi-paracomplete tending to True= Q⊥→V, and Quasi-paracomplete tending to False = Q⊥→F.
Logic Eτ is a non-classical logic system that allows for the handling of contradictions in a controlled manner [30,31]. In the context of broiler house conditions, an “extreme True paraconsistent state” could be a situation where all indicators unambiguously suggest optimal conditions for the broilers’ welfare and productivity. This might include ideal temperature, humidity, ventilation, and space per bird, with all monitoring systems agreeing on these optimal conditions without any contradictions. Conversely, an “extreme False paraconsistent state” could describe a situation where all indicators point to unacceptable conditions for the broilers. This would mean that temperature, relative humidity, ventilation, and space conditions are far from the ideal requirements, with every measurement confirming these poor conditions without contradictory data. “Extremes Paraconsistent” refers to situations that embody both true and false states simultaneously to some degree.
Applied to broiler housing, this might describe a scenario where certain conditions are ideal (e.g., perfect temperature and ventilation) while others are poor (e.g., overcrowding or inadequate humidity). The paraconsistent logic allows these conflicting assessments to coexist without negating the validity of the overall evaluation of the housing conditions. This reflects the reality of broiler housing, where conditions might not be uniformly good or bad. “Inconsistent” typically refers to contradictions in the information available. In the broiler house context, this could mean receiving contradictory information about the conditions—for example, one particular sensor indicating that the temperature is within the optimal range. At the same time, another suggests it is too high.
Traditional logic would struggle to make sense of this, potentially leading to incorrect conclusions or inaction. However, paraconsistent logic allows these inconsistencies to be acknowledged and managed without rendering the decision-making process ineffective.
Adding the weights, the following ranges were adopted for paraconsistent classification: Paracomplete μ ≥ 0.5 and λ ≤ 0.8, True μ > 0.8, False μ ≤ 0.3, and Inconsistent μ > 0.3 and λ < 0.5. Each classification of the variables (DBT, RH, AV, CO2, NH3) received a weight according to the impact it excerpts in the resultant environment (Unacceptable= −0.4, Poor: −0.3–0.2, Acceptable = 0.0, Good = 0.2, and Excellent = +0.4). After obtaining the results of the paraconsistent analysis, we analyzed the dataset correlation with the production on the 42nd day at slaughter (Table 3).

Table 3.
Data on broiler productivity at the 42nd day of growth.
The feed-to-gain ratio (FC) was calculated using Equation (1). The Viability is calculated using Equation (2) [32], and the Production Efficiency Index (PI) is calculated using Equation (3).
where PI = Production Index; AWG = Animal Weight Gain (g); V = Viability (%); M = Mortality (%); FG = Feed Given (g); and FC = Feed Conversion (g/g).
FC = FG/AWG
V = 100 − M
PI = (AWG × V)/(FC × 10) [adm]
Data were organized in Excel® (Microsoft Office, v. 365), and the processing was performed using Python® (v.3.11) [37]. The accuracy was checked using the area of the Receiver Operating Characteristic (ROC) curve and Cohen Kappa statistics. To calculate the accuracy, we used a binary classification suitable for ROC curve analysis from the DBT classification’ and Paraconsistent classification columns, aggregating the classes as follows: “Poor” and “Unacceptable” conditions were considered to be one negative class, coded as 0. “Excellent”, “Good”, and “Acceptable” were considered to be a positive class, coded as 1.
3. Results
The Cohen’s Kappa statistics for each environmental parameter classification compared to the paraconsistent classification were DBT = 0.78 (Good agreement), RH = 0.56 (Slight agreement), AV = 0.71 (Good agreement), CO2 = 0.53 (Slight agreement), and NH3 = 0.52 (Slight agreement).
The area under the ROC curve (AUC) results were DBT = 0.76, suggesting a fair separation between the positive and negative classes. The AUC result for RH was 0.53, indicating that the RH classification has a slightly better than random chance ability to discriminate between the positive and negative classes as defined by the paraconsistent binary classification. However, it is not a solid discriminative performance. The AUC result of AV was 0.67, suggesting a moderate classifier. The AUC of the CO2 variable was 0.51, indicating no discriminative ability between the positive and negative classes since it was slightly higher than random guessing. For the NH3 variable, the AUC is approximately 0.54, suggesting a slight ability to discriminate between the classes.
3.1. Boxplot of the Variables from the Paraconsistent Results
Paraconsistent Results
Figure 3 shows the box plot of the environmental and productivity variables as a function of the broiler age using the extreme True paraconsistent state. Figure 4 displays the Boxplot of the environmental variables associated with productivity as a function of the broiler age using the extreme False paraconsistent state, and Figure 5 and Figure 6 show the Boxplot of the environmental variables associated with productivity and as a function of the broiler age using the extremes Paraconsistent and Inconsistent, respectively.
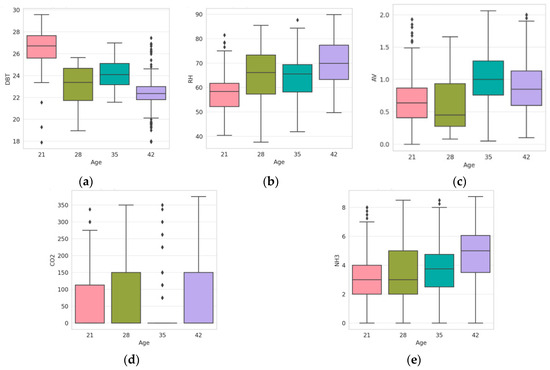
Figure 3.
Boxplot of the environmental variables (DBT—Dry Bulb Temperature, ppm, (a); RH—Relative Humidity, %, (b); AV—Air Velocity, m/s, (c); CO2—Carbon Dioxide Concentration, pp, (d), and NH3—Ammonia Concentration, ppm, (e)) considering the productivity and as a function of the broiler’ age using the extreme True paraconsistent state.
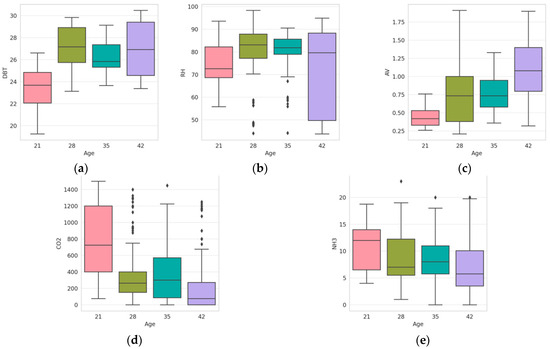
Figure 4.
Boxplot of the environmental variables (DBT—Dry Bulb Temperature, ppm, (a); RH—Relative Humidity, %, (b); AV—Air Velocity, m/s, (c); CO2—Carbon Dioxide Concentration, pp, (d), and NH3—Ammonia Concentration, ppm, (e)) considering the productivity and as a function of the broiler’ age using the extreme False paraconsistent state.
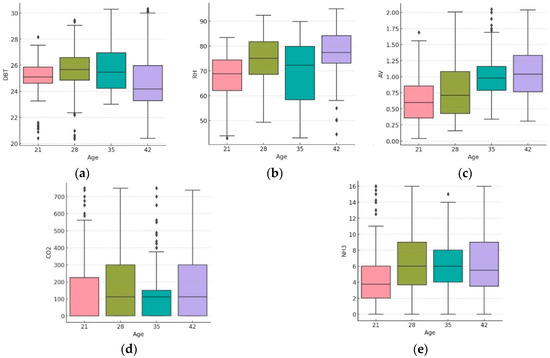
Figure 5.
Boxplot of the environmental variables (DBT—Dry Bulb Temperature, ppm, (a); RH—Relative Humidity, %, (b); AV—Air Velocity, m/s, (c); CO2—Carbon Dioxide Concentration, pp, (d), and NH3—Ammonia Concentration, ppm, (e)) considering the productivity and as a function of the broiler’ age using the extreme Paraconsistent state.
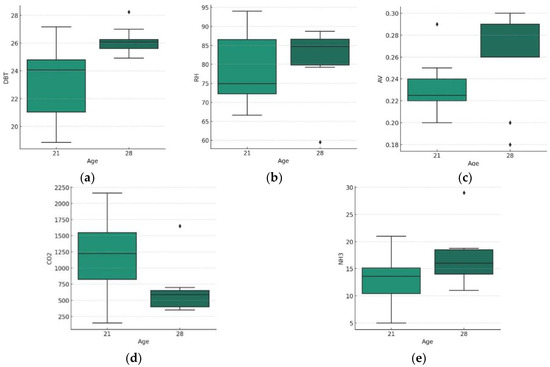
Figure 6.
Boxplot of the environmental variables (DBT—Dry Bulb Temperature, ppm, (a); RH—Relative Humidity, %, (b); AV—Air Velocity, m/s, (c); CO2—Carbon Dioxide Concentration, pp, (d), and NH3—Ammonia Concentration, ppm, (e)) considering the productivity and as a function of the broiler’ age using the extreme Inconsistent state.
The results in Figure 3 indicate that the appropriate climatic conditions of production temperature tend to reduce as the birds grow [34,36], while relative humidity and speed tend to increase, depending on the birds’ metabolism (RH) and also the intensification of the evaporative refrigeration system (RH and AV). The concentration of CO2 tends to remain constant due to air exchange in the ventilation system. In contrast, NH3 increases due to high-density housing, chicken litter material, and climate issues inside poultry houses [35]. An important observation is that we consider 280 ppm to be the CO2 amount in the atmosphere. When measured with properly calibrated equipment, it can reach zero near the air inlets inside the poultry houses (as the calibration considers 280 ppm as the starting point of measurement) and up to 5000 ppm near the air outlets (exhaust fans), especially considering the proper functioning of ventilation systems [38,39].
Figure 4 presents the false paraconsistent results, which makes sense considering the broiler rearing conditions during growth, which indicates that the temperature (Figure 4a) increases proportionally with age. However, as the birds grow, they need milder temperatures than birds that have just been housed. As the broiler grows, its metabolism increases; therefore, there is an increase in heat production and CO2 concentration inside the housing, which in turn is maintained in smaller proportions thanks to the increase in air ventilation (Figure 4c). However, it is possible to notice that as the birds grow, there is an increase in the amount of excreta and, consequently, higher levels of ammonia concentration at the end of the batch.
The ideal environmental conditions for broiler production are crucial for maximizing growth and productivity. It is possible to observe that the best productivity occurs when the temperature is close to 25 °C (Figure 5a) in the last weeks of breeding and the relative humidity is close to 75% (Figure 5b) with airspeed above 1 m/s (Figure 5c). As for noxious gas concentrations, it is necessary to have a maximum limit close to 300 ppm for carbon dioxide and 6 ppm for ammonia (Figure 5d,e).
The results of the inconsistent state indicate that the environmental conditions provoke a higher impact for broilers at the ages of 21 and 28 days. The quality of the housing environment is linked to animal well-being, weight gain, and adequate feed-to-gain ratio, guaranteeing productivity for the producer. For this reason, productivity is a function of environments with greater environmental control at milder temperatures (Figure 6a) and relative humidity control between 50 and 70% (Figure 6b). Airspeed helps with thermal comfort and helps to bring the effective temperature close to the ideal (Figure 6c). A properly functioning ventilation system provides lower concentrations of gases, resulting from good air renewal (Figure 6d,e).
3.2. Pearson Correlation Analysis
Pearson’s correlation provides valuable insights by quantifying the linear association between variables, which can support decision-making processes and identify critical factors affecting production outcomes [38,40]. Pearson’s correlation was applied to validate the output paraconsistent results. Pearson’s correlation coefficient is widely utilized to quantify the strength and direction of the relationship between two variables, with its values ranging from −1 to 1. This statistical measure elucidates how features impact a prediction model by assigning a value to the features’ contributions. A positive coefficient indicates that the variables synergistically affect the model’s predictions, whereas a negative coefficient suggests an antagonistic effect.
Various colors signify the strength of correlation, where a deeper shade of red indicates a stronger positive correlation, and a deeper shade of blue denotes a more robust negative correlation. The magnitude of this coefficient reveals the extent of the influence: the larger the absolute value, the more significant the impact on model predictions, as shown in Figure 7.
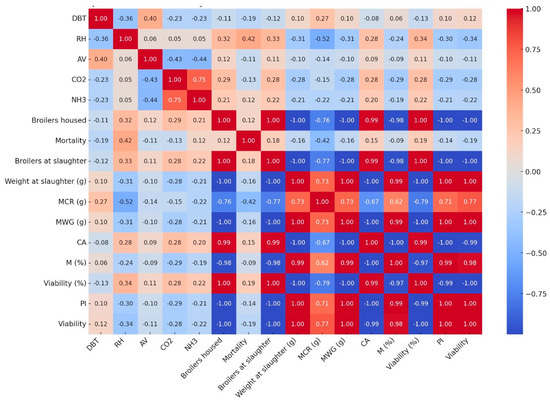
Figure 7.
Matrix of correlation among the environmental variables (DBT—Dry Bulb Temperature, ppm; RH—Relative Humidity, %; AV—Air Velocity, m/s; CO2—Carbon Dioxide Concentration, pp; and NH3—Ammonia Concentration, ppm; and productivity indexes studied (MCR—mean conversion rate; MWG—mean weight gain; FC—feed-to-gain ratio; and PI—Productive Efficiency Index).
Correlation analysis between environmental variables (DBT, RH, AV, CO2, and NH3) and productivity indicators (Broilers housed, Mortality, Broilers at slaughter, Age, Weight at slaughter (g), MCR (g), MWG (g), FC, M (%), Viability (%), and PI) reveal some relationships. Temperature (DBT) has a moderate positive correlation with Viability, suggesting that higher temperatures may be associated with greater Viability. Relative humidity (RH) negatively correlates with Viability and Weight at slaughter, indicating that higher humidity may be associated with lower Viability and lower weight at slaughter. Air Speed (AV), CO2, and NH3 show smaller and mixed correlations with productivity indicators, suggesting that their effects may be more complex or influenced by other factors. There is a negative correlation with Viability, which is expected, as higher mortality leads to lower Viability. The Productive Efficiency Index (PI) strongly correlates with several productivity variables, reflecting its nature as a comprehensive performance indicator.
4. Discussion
The challenges in broiler housing are multifaceted, encompassing environmental control, disease management, air quality, and the impact of extreme temperatures. Addressing these issues requires a holistic approach that includes optimizing litter materials, managing gut health through dietary interventions, improving air quality, and adopting technological solutions to dynamically monitor and adjust housing conditions. Adopting such strategies is essential for improving the well-being of broilers, enhancing production efficiency, and ensuring the sustainability of the broiler industry.
Optimal indoor temperature declines as the birds age, as shown in Figure 3, agreeing with previous studies [5,7]. In contrast, relative humidity and airflow velocity show an upward trend, influenced by the birds’ metabolic rates (RH) and the increase in the use of evaporative cooling systems (RH and AV) [17]. CO2 levels generally stay uniform, which is attributed to the air renewal process of the ventilation system. Conversely, the concentration of NH3 escalates, driven by factors such as high flock density, the composition of the litter, and climatic challenges indoors.
Maintaining optimal thermal conditions within broiler houses becomes more complex and energy-intensive as global temperatures rise. Broilers are particularly sensitive to heat stress, which can impair growth, feed conversion efficiency, and survival rates. Elevated temperatures can increase ventilation requirements, raising energy consumption and operational costs [10,32].
The concentration of NH3 (Figure 3) tends to escalate, a phenomenon ascribed to high-density occupancy conditions, the nature of the bedding materials used within the poultry house, and prevailing climatic conditions therein. These factors collectively accelerate the breakdown of uric acid, as detailed in [16]. Research on the ideal climatic conditions inside broiler housing has highlighted the need for optimal designs to ensure indoor climate suitability, stability, and uniformity [7,10]. This includes maintaining specific temperature, humidity, and wind speed parameters.
Research on air quality in broiler production has shown that it can significantly impact bird performance and energy consumption [14]. Factors such as ventilation rate, air purifiers, and antibiotics can improve broiler weight gain and reduce mortality [15]. However, air filtration did not significantly improve broiler performance, although it did reduce dust and bacteria concentrations [13]. The choice of housing floor can also influence air quality, with slatted floors being found to maintain better air quality and enhance growth traits and immunity [36].
Climate change can exacerbate air quality issues inside broiler houses by increasing the concentration of harmful gases such as ammonia and carbon dioxide. Proper ventilation is essential for diluting and removing these gases, but as external temperatures rise, the effectiveness of natural ventilation methods may decrease, necessitating more reliance on mechanical systems. Kpomasse [18] discusses the challenges of broiler production in the tropics, including the impact of heat stress on feed intake and metabolism and various strategies to combat these challenges. These commented values corroborate the values of the ideal environmental conditions in the literature and are applied to find the optimal housing conditions in the present study.
The negative impact of high ambient temperatures on broiler physiology, feed intake, and efficiency has been previously discussed [41,42], and mitigation strategies were applied to the present solution, combining adiabatic cooling and increased airflow. Current literature highlights the importance of an indoor housing environment to improve broiler weight gain, feed efficiency, and carcass yield [43,44].
Adapting to climate change may require significant investments in infrastructure, such as upgraded housing, cooling systems, and water management facilities. The presented correlations (Figure 7) can provide valuable insights into how environmental conditions affect productivity in poultry farms. However, it is crucial to consider that correlations do not necessarily indicate causal relationships and can be influenced by various factors. However, it might help select the proper variables to invest in strategies for mitigating heat stress [18,26].
Climate change impacts agricultural production systems globally. Extreme weather events can disrupt supply chains, leading to volatility in feed prices and availability. This issue requires adaptive management strategies to ensure nutritional adequacy while minimizing costs. The efficiency of animal product synthesis is compromised during the summer heat, and it is estimated that a 1.0 °C increase in ambient temperature during the hot months leads to a 4.5% reduction in production [11,12].
These challenges emphasize the need for adaptive management strategies, research, and technology development to enhance the resilience of broiler production systems in the face of climate change. Efforts should focus on improving thermal comfort, air quality, water efficiency, disease management, and overall sustainability of production practices. Collaboration between researchers, industry stakeholders, and policymakers is essential to develop and implement strategies addressing climate change’s multifaceted impacts on broiler housing.
5. Conclusions
We presented a balanced combination of broiler housing indoor conditions to optimize production by applying Paraconsistent Annotated Logic Eτ. This proposed solution might help farmers optimize indoor environmental conditions and reduce economic losses during broiler production.
The outcomes of the modeling exercise indicate to broiler farmers the requisite interval for maintaining optimal indoor conditions and gas concentrations, thereby enabling the birds to exhibit peak performance in alignment with the provided nutrition and genetics. This might facilitate enhanced precision in farmers’ decision-making processes. Furthermore, the study reveals that the model is flexible to integrate with environmental control systems employed in commercial poultry farming operations, augmenting real-time decision-making capabilities.
Author Contributions
Conceptualization, A.A.G.M. and I.d.A.N.; methodology, A.A.G.M., I.d.A.N. and J.M.A.; software, A.A.G.M. and I.d.A.N.; validation, A.A.G.M., I.d.A.N. and J.M.A.; formal analysis, A.A.G.M. and I.d.A.N.; investigation, A.A.G.M., I.d.A.N. and T.M.R.d.C.-C.; data curation, A.A.G.M., I.d.A.N. and T.M.R.d.C.-C.; writing—original draft preparation, I.d.A.N. and T.M.R.d.C.-C.; writing—review and editing, I.d.A.N., T.M.R.d.C.-C. and J.M.A.; supervision, I.d.A.N. and J.M.A. All authors have read and agreed to the published version of the manuscript.
Funding
This research received no external funding.
Data Availability Statement
Data can be provided by the corresponding author.
Acknowledgments
We thank the Coordination of Superior Level Staff Improvement—CAPES for the doctoral scholarship of the first author and the National Council for Scientific and Technological Development-CNPQ for the Research Scholarship PQ1 of the second author.
Conflicts of Interest
The authors declare no conflicts of interest.
References
- Dawkins, M.; Donnelly, C.A.; Jones, T.A. Chicken welfare is influenced more by housing conditions than by stocking density. Nature 2004, 427, 342–344. [Google Scholar] [CrossRef] [PubMed]
- Fancher, C.; Zhang, L.; Kiess, A.; Adhikari, P.A.; Dinh, T.T.; Sukumaran, A.T. Avian pathogenic Escherichia coli and Clostridium perfringens: Challenges in no antibiotics ever broiler production and potential solutions. Microorganisms 2020, 8, 1533. [Google Scholar] [CrossRef] [PubMed]
- ABPA. Brazilian Association of Animal Protein. Annual Report 2023. Available online: https://abpa-br.org/wp-content/uploads/2023/04/ABPA.-Annual-Report-2023.pdf (accessed on 3 April 2024).
- Sohail, M.U.; Hume, M.E.; Byrd, J.A.; Nisbet, D.J.; Ijaz, A.; Sohail, A.; Shabbir, M.Z.; Rehman, H. Effect of supplementation of prebiotic mannan-oligosaccharides and probiotic mixture on growth performance of broilers subjected to chronic heat stress. Poult. Sci. 2012, 91, 2235–2240. [Google Scholar] [CrossRef] [PubMed]
- Chang, Q.; Lu, Y.; Lan, R. Chitosan oligosaccharide as an effective feed additive to maintain growth performance, meat quality, muscle glycolytic metabolism, and oxidative status in yellow-feather broilers under heat stress. Poult. Sci. 2020, 99, 4824–4831. [Google Scholar] [CrossRef] [PubMed]
- Rodrigues, J.A.M.; Viola, M.R.; Alvarenga, L.A.; de Mello, C.R.; Chou, S.C.; de Oliveira, V.A.; Uddameri, V.; Morais, M.A.V. Climate change impacts under representative concentration pathway scenarios on streamflow and droughts of basins in the Brazilian Cerrado biome. Int. J. Climatol. 2020, 40, 2511–2526. [Google Scholar] [CrossRef]
- Wasti, S.; Sah, N.; Mishra, B. Impact of heat stress on poultry health and performances, and potential mitigation strategies. Animals 2020, 10, 1266. [Google Scholar] [CrossRef]
- Moura, D.J.; Nääs, I.A.; Pereira, D.F.; Silva, R.; Camargo, G. Animal welfare concepts and strategy for poultry production: A review. Braz. J. Poult. Sci. 2006, 8, 137–147. [Google Scholar] [CrossRef]
- Pereira, D.F.; Nääs, I.A. Estimating the thermoneutral zone for broiler breeders using behavioral analysis. Comput. Electron. Agric. 2008, 62, 2–7. [Google Scholar] [CrossRef]
- Nascimento, G.R.; Nääs, I.A.; Pereira, D.F.; Baracho, M.S.; Garcia, R. Assessment of broiler surface temperature variation when exposed to different air temperatures. Braz. J. Poul. Sci. 2011, 13, 259–263. [Google Scholar] [CrossRef]
- Johnson, J.S.; Abuajamieh, M.; Fernandez, M.V.S.; Seibert, J.T.; Stoakes, S.K.; Nteeba, J.; Keating, A.F.; Ross, J.W.; Rhoads, R.P.; Baumgard, L. Thermal Stress Alters Postabsorptive Metabolism During Pre- and Postnatal Development. In Climate Change Impact on Livestock: Adaptation and Mitigation; Sejian, V., Gaughan, J., Baumgard, L., Prasad, C., Eds.; Springer: New Delhi, India, 2015. [Google Scholar] [CrossRef]
- Souza, A.V.; Abreu, M.T.; Mesquita, N.F.; Ferreira, R.A. How much does heat stress cost in poultry and swine production? Nutritime 2020, 17, 1–7. Available online: https://www.nutritime.com.br/wp-content/uploads/2020/01/Artigo-508.pdf (accessed on 20 February 2024).
- García, M.C.; León, C.; Delgado, M.D. Characteristics of Broiler Litter Using Different Types of Materials (Straw, Wood Shavings and Rice Hulls). A Castilla y Leon (Spain) Case Study. In Proceedings of the International Symposium on Air Quality and Waste Management for Agriculture, Broomfield, CO, USA, 16–19 September 2007. [Google Scholar]
- Zhang, M.H.; Li, S.Y. Ammonia concentration and relative humidity in poultry houses affect the immune response of broilers. Genet. Mol. Res. 2015, 14, 3160–3169. [Google Scholar] [CrossRef]
- Miles, D.M.; Branton, S.L.; Lott, B.D. Atmospheric ammonia is detrimental to the performance of modern commercial broilers. Poult. Sci. 2004, 83, 1650–1654. [Google Scholar] [CrossRef] [PubMed]
- Al Homidan, A.; Robertson, J.F.; Petchey, A.M. Review of the effect of ammonia and dust concentrations on broiler performance. Worlds Poult. Sci. J. 2003, 59, 340–349. [Google Scholar] [CrossRef]
- Saeed, M.; Abbas, G.; Alagawany, M.; Kamboh, A.A.; Abd El-Hack, M.E.; Khafaga, A.F.; Chao, S. Heat stress management in poultry farms: A comprehensive overview. J. Therm. Biol. 2019, 84, 414–425. [Google Scholar] [CrossRef] [PubMed]
- Kpomasse, C.C.; Oke, O.; Houndonougbo, F.; Tona, K. Broiler production challenges in the tropics: A review. Vet. Med. Sci. 2021, 7, 831–842. [Google Scholar] [CrossRef] [PubMed]
- Mangan, M.; Siwek, M. Strategies to combat heat stress in poultry production—A review. J. Anim. Physiol. Anim. Nutr. 2024, 1, 20. [Google Scholar] [CrossRef]
- Jackman, P.; Penya, H.; Ross, R. The role of information and communication technology in poultry broiler production process control. Agric. Eng. Int. CIGR J. 2020, 22, 284–299. [Google Scholar]
- Abe, J.M. Paraconsistent Intelligent Based-Systems: New Trends in the Applications of Paraconsistency; Springer: Dordrecht, The Netherlands, 2015; p. 306. [Google Scholar]
- Abe, J.M.; Akama, S.; Nakamatsu, K. Introduction to Annotated Logics-Foundations for Paracomplete and Paraconsistent Reasoning, 1st ed.; Springer: Dordrecht, The Netherlands, 2015; p. 190. [Google Scholar]
- Abe, J.M.; Nakamatsu, K.; da Silva Filho, J.I. Three decades of paraconsistent annotated logics: A review paper on some applications. Procedia Comput. Sci. 2019, 159, 1175–1181. [Google Scholar] [CrossRef]
- Da Silva, J.P.; Nääs, I.A.; Abe, J.M.; Cordeiro, A.F.d.S. Classification of piglet (Sus Scrofa) stress conditions using vocalization pattern and applying paraconsistent logic Eτ. Comput. Electron. Agric. 2019, 166, 105020. [Google Scholar] [CrossRef]
- Fonseca, F.N.; Abe, J.M.; Nääs, I.A.; Cordeiro, A.F.d.S.; Amaral, F.V.D.; Ungaro, H.C. Automatic prediction of stress in piglets (Sus Scrofa) using infrared skin temperature. Comput. Electron. Agric. 2019, 168, 105–148. [Google Scholar] [CrossRef]
- Martinez, A.A.G.; Nääs, I.d.A.; de Carvalho-Curi, T.M.R.; Abe, J.M.; da Silva Lima, N.D. A Heuristic and Data Mining Model for Predicting Broiler House Environment Suitability. Animals 2021, 11, 2780. [Google Scholar] [CrossRef]
- Tzanidakis, C.; Simitzis, P.; Arvanitis, K.; Panagakis, P. An overview of the current trends in precision pig farming technologies. Livest. Sci. 2021, 249, 104530. [Google Scholar] [CrossRef]
- Peng, S.; Zhu, J.; Liu, Z.; Hu, B.; Wang, M.; Pu, S. Prediction of ammonia concentration in a pig house based on machine learning models and environmental parameters. Animals 2022, 13, 165. [Google Scholar] [CrossRef]
- Xie, Q.; Zheng, P.; Bao, J.; Su, Z. Thermal environment prediction and validation based on deep learning algorithm in closed 611 pig house. Trans. Chin. Soc. Agric. Mach. 2020, 51, 353–361. [Google Scholar]
- Zamansky, A. On recent applications of paraconsistent logic: An exploratory literature review. J. Appl. Non-Class. Log. 2019, 29, 382–391. [Google Scholar] [CrossRef]
- da Costa, N.C.; Béziau, J.Y.; Bueno, O.A. Aspects of paraconsistent logic. Log. J. IGPL 1995, 3, 597–614. [Google Scholar] [CrossRef]
- Cobb. Broiler Management Guide. Cobb-Vantress. Available online: www.Cobb-vantress.com/contactus/brochures/Broiler_Mgmt_Guide_2008.pdf (accessed on 10 December 2023).
- Carvalho-Curi, T.M.R.D.; Conti, D.; Vercellino, R.D.A.; Massari, J.M.; de Moura, D.J.; de Souza, Z.M.; Montanari, R. Positioning of sensors for control of ventilation systems in broiler houses: A case study. Sci. Agric. 2017, 74, 101–109. [Google Scholar] [CrossRef]
- Yahav, S.; Goldfeld, S.; Plavnik, I.; Hurwitz, S. Physiological response of chickens and turkeys to relative humidity during exposure to high ambient temperature. J. Therm. Biol. 1995, 20, 245–253. [Google Scholar] [CrossRef]
- Nicholson, F.A.; Chambers, B.J.; Walker, A.W. Ammonia emissions from broiler litter and laying hen manure management systems. Biosyst. Eng. 2004, 89, 175–185. [Google Scholar] [CrossRef]
- Figueiredo, E.A.P. Broiler Production; EMBRAPA: Concórdia, Brazil, 2003; Available online: https://www.infoteca.cnptia.embrapa.br/infoteca/bitstream/doc/1148818/1/final10028.pdf (accessed on 17 January 2024).
- Van Rossum, G.; Drake, F.L., Jr. Python Reference Manual; Centrum voor Wiskunde en Informatica: Amsterdam, The Netherlands, 1995. [Google Scholar]
- Albright, L.D. Environment Control for Animals and Plants; American Society of Agricultural Biological Engineers, ASABE: St. Joseph, MO, USA, 1990; p. 450. [Google Scholar]
- ASHRAE. Handbook of Fundamentals; ASHRAE: Atlanta, GA, USA, 2001. [Google Scholar]
- Li, Z.; Yang, Y.; Li, L.; Wang, D. A weighted Pearson correlation coefficient based multi-fault comprehensive diagnosis for battery circuits. J. Energy Storage 2023, 60, 106584. [Google Scholar] [CrossRef]
- Nawaz, A.H.; Amoah, K.; Leng, Q.Y.; Zheng, J.H.; Zhang, W.L.; Zhang, L. Poultry response to heat stress: Its physiological, metabolic, and genetic implications on meat production and quality including strategies to improve broiler production in a warming world. Front. Vet. Sci. 2021, 8, 699081. [Google Scholar] [CrossRef] [PubMed]
- Khan, R.U.; Naz, S.; Hammad Ullah, H.; Ullah, Q.; Laudadio, V.; Qudratullah; Bozzo, G.; Tufarelli, V. Physiological dynamics in broiler chickens under heat stress and possible mitigation strategies. Anim. Biotechnol. 2021, 34, 438–447. [Google Scholar] [CrossRef] [PubMed]
- Arowolo, M.A.; He, J.H.; He, S.P.; Adebowale, T. The implication of lighting programmes in intensive broiler production system. World Poultry Sci. J. 2019, 1, 17–28. [Google Scholar] [CrossRef]
- Donkoh, A. Ambient temperature: A factor affecting performance and physiological response of broiler chickens. Int. J. Biometeorol. 1989, 33, 259–265. [Google Scholar] [CrossRef] [PubMed]
Disclaimer/Publisher’s Note: The statements, opinions and data contained in all publications are solely those of the individual author(s) and contributor(s) and not of MDPI and/or the editor(s). MDPI and/or the editor(s) disclaim responsibility for any injury to people or property resulting from any ideas, methods, instructions or products referred to in the content. |
© 2024 by the authors. Licensee MDPI, Basel, Switzerland. This article is an open access article distributed under the terms and conditions of the Creative Commons Attribution (CC BY) license (https://creativecommons.org/licenses/by/4.0/).