Article

RisDes_Index: An Index for Analysing the Advance of Areas Undergoing Desertification Using Satellite Data

by
Thieres George Freire da Silva
1,2,*,
José Francisco da Cruz Neto
2,
Alexandre Maniçoba da Rosa Ferraz Jardim
3,
Carlos André Alves de Souza
2,
George do Nascimento Araújo Júnior
2,
Marcos Vinícius da Silva
2,
Jhon Lennon Bezerra da Silva
4,
Ailton Alves de Carvalho
2,
Abelardo Antônio de Assunção Montenegro
2 and
Luciana Sandra Bastos de Souza
1
1
Academic Unit of Serra Talhada, Federal Rural University of Pernambuco, Serra Talhada 56909-535, PE, Brazil
2
Department of Agricultural Engineering, Federal Rural University of Pernambuco, Recife 52171-900, PE, Brazil
3
Department of Biodiversity, Institute of Biosciences, São Paulo State University, Rio Claro 13506-900, SP, Brazil
4
Cerrado Irrigation Graduate Program, Goiano Federal Institute, Campus Ceres, Ceres 76300-000, GO, Brazil
*
Author to whom correspondence should be addressed.
AgriEngineering 2024, 6(2), 1150-1174; https://doi.org/10.3390/agriengineering6020066
Submission received: 6 January 2024 / Revised: 23 February 2024 / Accepted: 15 April 2024 / Published: 26 April 2024
(This article belongs to the Section Remote Sensing in Agriculture)

Abstract

:
The proposal for a method of identifying the occurrence of desertification that has a strong association with in situ data leads to more assertive results when analysing the contribution of climate and social and economic factors to advancing the process. This study aimed to develop a methodology called the RisDes_Index to evaluate the evolution of the desertification process based on satellite data. The concept of the RisDes_Index method was based on the reflectance variables of the R, B and G bands, albedo and LAI of the Landsat 5/TM and Landsat 8/OLI satellites. Principal component analysis was used to assess the biophysical basis of the RisDes_Index by associating the results with micrometeorological data, physical and chemical properties, and vegetation cover data collected from five experimental sites in the semi-arid region of Brazil. These sites included one from a seasonally dry forest (i.e., the Caatinga), an agricultural cactus plantation, an area undergoing desertification, and two irrigated sugarcane crops (wetlands), one with and one without straw cover. The RisDes_Index was applied to all pixels of the images from 5 December 1991, 14 November 2001, 20 November 2009 and 6 October 2016 of an important desertification nucleus (DN) in the semi-arid region of Brazil, i.e., the DN of Cabrobó. The proposed RisDes_Index was able to identify areas with significant processes of desertification, which mainly occur in areas of sandy, acidic, bare soils with a high β value (Bowen ratio) and high soil temperature. The results of the RisDes_Index showed that in 5 December 1991, desertified areas comprised 38% of the total area of the DN of Cabrobó, expanding to 51% in 2016. Application of the RisDes_Index confirmed the advance of desertification in the DN of Cabrobó. This was due to a consequent increase in the water deficit and intensified deforestation to increase the areas of livestock farming. The RisDes_Index proved to be a robust method, as its estimation based on simple satellite products exhibited a strong association with biophysical variables of areas with different land uses and degradation levels. Thus, it is suggested that the RisDes_Index be applied in various regions of the world, with the idea of directing action to meet the advance of desertification.

1. Introduction

Desertification is an environmental problem that occurs throughout the world and has been increasingly discussed over the last 50 years due to its impact on the environment, the economy and society [1,2,3]. Desertification is characterised as land degradation in arid, semi-arid and dry sub-humid areas, resulting from climate factors and human activity. Desertification currently affects more than one-third of the world’s surface, including such countries as China, South Africa, the United States of America, Mexico, Marrocos, Australis Argentina and Brazil [4,5,6].
In Brazil, desertification is more evident in the semi-arid region of the northeast, where the nuclei of desertification (DNs) are found [7] and where the processes of degradation are considered irreversible [8]. The DNs are areas of large patches of bare soil, with or without vegetation, and with clear signs of soil erosion [9]. Six areas are characterised as DNs: the Nucleus of Gilbués in Piauí, Irauçuba in Ceará, Cabrobó in Pernambuco, Seridó in Rio Grande do Norte, Cariris Velhos in Paríba, and Sertão do São Francisco in Bahia, which together covers an area of 55,000 km2 [4,10].
However, there is much controversy concerning the cause of desertification, which is due to the different factors leading to its occurrence [11,12]. In Brazil, for example, desertification may have arisen in some regions due to the misuse of natural resources, such as deforestation to use wood as a source of energy and to build fences and houses, inadequate irrigation as a water supply for crops, and the lack of proper soil management [13,14] and for reasons of climate, where the high atmospheric demand together with the low rainfall regime generate an excessive water deficit, and cause deciduous behaviour in the vegetation [9,15]. Desertification promotes a loss of soil fertility, a reduction in water resources, a fall in biodiversity and a loss in soil productivity, which culminates in the land being abandoned by producers due to its inability to produce [3,12,16,17].
For these reasons, it is essential to monitor and assess changes in the environment [14]. Careful evaluation based on indicators that detect the process of desertification allows for proper planning and decision-making for control or adaptation [4,16]. Research is carried out to measure and mitigate the effects of desertification using methodologies that use remote sensing techniques, which allow greater scope and precision in monitoring the progress of the desertification process [2,5,18,19].
One work that has become a reference in studies of desertification is that by Kosmas et al. [20], who use indices to identify desertified areas around the Mediterranean and their effects. This method by Kosmas et al. [20], shows good results in identifying desertified areas [2,13,21] but comes up against the large number of necessary variables, which tends to limit its use in other regions of the planet. As such, other methods that are efficient and require a smaller number of variables must be developed to evaluate the desertification process [4,6].
In this respect, remote sensing is a very useful tool for identifying environmental variables that are associated with desertified areas and has become more and more popular over the last 30 years [6,22,23]. In a study carried out on the Mongolian Plateau, Wei et al. [24] developed a method for studying desertification based on the NDVI (Normalised Difference Vegetation Index), α (land surface albedo), MSAVI (Modified Soil-Adjusted Vegetation Index) and TGSI (Topsoil Grain Size Index). In this study, it was found that these variables explain around 86% of the occurrence of desertification. The model that considered only the albedo and NDVI showed good accuracy in regions with larger types of vegetation cover. According to the authors, the efficiency of the proposed models is low in semi-arid regions due to fluctuations in the leaf density of the vegetation throughout the year. Another model that uses satellite products to identify areas in the process of desertification is proposed by Pan and Li [25]; this considers the surface albedo and characteristics of the vegetation but requires the albedo to be adjusted for the areas where the template is applied. The characteristics of the caatinga vegetation compromise the applicability of various models that are used to identify areas in the process of desertification [15,26].
Although there are methods for assessing the level of desertification of an area using satellite products, none show their association with surface biophysical data that prove the level of environmental degradation. The proposal of indicators that combine orbital products that are in line with surface data can improve accuracy in identifying areas in an advanced process of desertification, thereby helping to mitigate environmental degradation. We hypothesise that proposing a method for identifying the occurrence of desertification, which is associated with in situ data, leads to more assertive results in judging the evolution of this process and the contribution of climate and socio-economic factors. This study aimed to develop a methodology for evaluating the evolution of the desertification process based on satellite data. The specific objectives were: (i) to define an index based on orbital products that are associated with micrometeorological data and biophysical data of the vegetation and soil found in areas of the semi-arid region of Brazil (Caatinga, agricultural cactus cultivation, irrigated crops and areas in the process of desertification); (ii) to compare methods for analysing the sensitivity of areas to desertification; and (iii) to carry out a case study with the application of the new method in an important desertification nucleus (DN, i.e., DN of Cabrobó in the State of Pernambuco) in the semi-arid region of Brazil.

2. Materials and Methods

2.1. Experimental Sites

In situ and satellite data from five experimental sites under different types of land use were used to validate the model RisDes_Index. The database used was collected during the years 2015, 2016, 2017 and 2018. The first three sites are located in the municipality of Floresta in the state of Pernambuco in the semi-arid region of Brazil (Figure 1), comprising an area of Caatinga (native vegetation), a plantation of cactus (Opuntia stricta (Haw.) Haw.) (agricultural cultivation under rainfed) and a deforested area in the process of desertification. The climate of the municipality is semi-arid, with an annual air temperature of 26.1 °C, rainfall of around 489.3 mm year−1 and seasonal rains concentrated from December to April. The mean annual potential evapotranspiration is 1646 mm per year, with an annual water deficit of 1023 mm. The predominant soil is classified as a Chromic Luvisol. The other two sites are located in the municipality of Juazeiro in the state of Bahia in the semi-arid region of Brazil (Figure 1) and are composed of irrigated sugarcane crops with and without the maintenance of straw above ground. The climate of the municipality is semi-arid, with rainfall of 513 mm year−1, mainly distributed between December and April, and atmospheric demand of 1887 mm year−1. The soil is classified as a Vertisol.
The area of Caatinga (CAA) (9°30′36″ S; 40°22′5″ W; 401 m) includes a wide variety of species, which comprise the herbaceous, shrub and arboreal strata, often with a height of less than 7 m, where the vegetation is sparse with a predominance of endemic and deciduous species. It is worth noting that in the past, this area underwent various cycles of selective wood extraction for domestic consumption and the construction of corrals and fences. An area of 10 ha was considered in this study (Figure 2). The second experimental site (9°30′36″ S; 40°22′15″ W; 401 m) is located 1.5 km from the first site and 0.5 km from the third. It is composed of a cultivated area of cactus (CAC), in this case, the clone ‘Orelha de Elefante Mexicana’, genus Opuntia. The crop was established in August 2014 at a spacing of 2.0 × 0.50 m. Crop management is systematic and includes weeding and fertilising whenever necessary, with harvesting carried out annually. The CAC site has an area of 1.1 ha.
The third experimental site (9°30′36″ S; 40°22′15″ W; 401 m), with an area of 3 ha under desertification (DES), previously consisted of Caatinga vegetation, deforested for agricultural activity more than 80 years earlier. It currently comprises low grasses and exposed soil (Figure 2). More details of the three experimental sites can be obtained from Queiroz et al. [27]. The fourth and fifth sites, with sugarcane, are composed of two adjacent experimental plots (Figure 2), each with 5.0 ha, harvested manually; the first (9°30′36″ S; 40°22′15″ W; 401 m) immediately after burning (CANENS), and the second with ‘raw sugarcane’ (no burning) (CANEWS) (9°30′43″ S; 40°22′20″ W; 401 m). More details of the two experimental sites can be obtained from Souza et al. [28].

2.2. Data In Situ Collected from the Experimental Sites

Micrometeorological data were collected for the energy balance above the surface, and soil samples were obtained to determine the physical and chemical properties. For this, the five experimental sites were equipped with towers including low-frequency measurement systems for measuring the temperature (Tair, °C), relative humidity (RH, %), soil heat flux (G, MJ m−2 day−1), net radiation (Rn, MJ m−2 day−1) and rainfall (R, mm). For Tair and RH, thermo-hygrometers (HMP155A, Campbell Scientific, Inc., Logan, UT, USA) were installed at two heights above the vegetated surface, the first at 0.50 m and the second at 2.0 m. To measure G, a heat flux plate (HFT3-REBS, Campbell Scientific, Inc., Logan, UT, USA) was placed in the ground at a depth of 0.05 m. Furthermore, soil temperature was measured above and below the heat flux plate at 0.02 and 0.07 m, respectively. The average soil temperature (Tsoil) was obtained by averaging the values at the two depths. The net radiometer (RNLITE, Campbell Scientific, Inc., Logan, UT, USA) for measuring the Rn and the rain gauge (TE525-L, Campbell Scientific, Inc., Logan, UT, USA) were installed at the top of the micrometeorological towers. Data were collected every 60 s, and the mean values were stored in a datalogger (CR1000, Campbell Scientific, Inc., Logan, UT, USA) every 10 min.
The effects of advection, energy storage in the canopy and biomass, and the energy used in photosynthesis were not considered [29]. Therefore, based on the principle of energy conservation, the surface partition can be estimated using Equation (1) [30]:
R n = LE + H + G s o i l
where Rn—net radiation (W m−2); LE—latent heat flux (W m−2); H—sensible heat flux (W m−2) and Gsoil—soil heat flux (W m−2).
LE and H were estimated using the surface energy balance based on the Bowen ratio. These estimates were made using Equations (2) and (3) [30].
LE = R n - G s o i l 1 + β
H = β   ( R n - G s o i l ) 1 + β
where β is the Bowen ratio.
β was calculated from Equation (4) [31].
β = H LE = γ T e C p λ 0.622 T e
where λ is the latent heat of vaporisation; γ is the psychrometric constant; ΔT and Δe are the differences in temperature and water vapour pressure at the two measuring heights above the surface, respectively; Cp is the specific heat at constant pressure (1004.67 J kg−1 K−1); 0.622 represents the molecular weight ratio of water and dry air.
Bowen ratio, LE and H values were submitted to quality control, seeking to meet the criteria described by Perez et al. (1999). The values of LE and H were estimated for the period of positive available energy (Rn − Gsoil > 0), according to Silva et al. [31].
The physical and chemical properties of the soil were determined for the five sites from disturbed and undisturbed samples collected every 0.10 m to a depth of 0.60 m, as described by Silva et al. [32]. Sampling was carried out in the five experimental areas from January 2015 to August 2018, over an average period of three months, aiming to characterise the soil properties in the dry and rainy periods and in the dry–rainy transition, and which also included dates representative of satellite images. The physical properties of the soil were field capacity at a pressure of 0.03 MPa (FC, dag kg−1), permanent wilting point at 15 MPa (WP, dag kg−1), bulk density and particle density (BD and PD, kg dm−3), total porosity (TP, %) and the total sand (Sand, g kg−1), silt (Silt, g kg−1) and clay (Clay, g kg−1) fractions [33]. The chemical properties of the soil were electrical conductivity (EC, dS m−1), hydrogen potential in water (pH) and organic carbon content (OC, g kg−1), the levels of available phosphorus (P, mg dm−3), potassium (K+, cmolc kg−1) and sodium (Na+, cmolc kg−1), copper (Cu2+, mg kg−1), iron (Fe, mg kg−1), manganese (Mn, mg kg−1) and zinc (Zn2+, mg kg−1), calcium (Ca2+, cmolc kg−1) and magnesium (Mg2+, cmolc kg−1), potential acidity (H++Al3+, cmolc kg−1), bases saturation (V, %) sum of bases (SB, cmolc kg−1) and cation exchange capacity (CEC, cmolc kg−1) [33].

2.3. Collecting and Processing the Orbital Data from the Experimental Sites

In the present study, images from the Landsat 5/TM and 8/OLI satellites were used. The characteristics of the images from both satellites can be found in Table 1. The images covering the experimental sites during the years of in situ data collection (2015 to 2018) are presented in Table 2. Only the dates that met the following criteria were considered: clouds smaller than 10%, consistent data from Bowen ratio, LE and H, and dates close to the days of soil collection for analysis of physical and chemical properties. The projection is Datum WGS 1984/UTM/Zone 24 South. Image collection, processing of orbital products and index calculations for the experimental sites were operated for twenty pixels around each micrometeorological tower via cloud processing of the Google Earth Engine (GEE) platform, according to the script available in Software availability. The extracted raster file was processed using QGis software version 3.12, as described by Melo et al. [34].

2.4. Satellite Products from the Experimental Sites

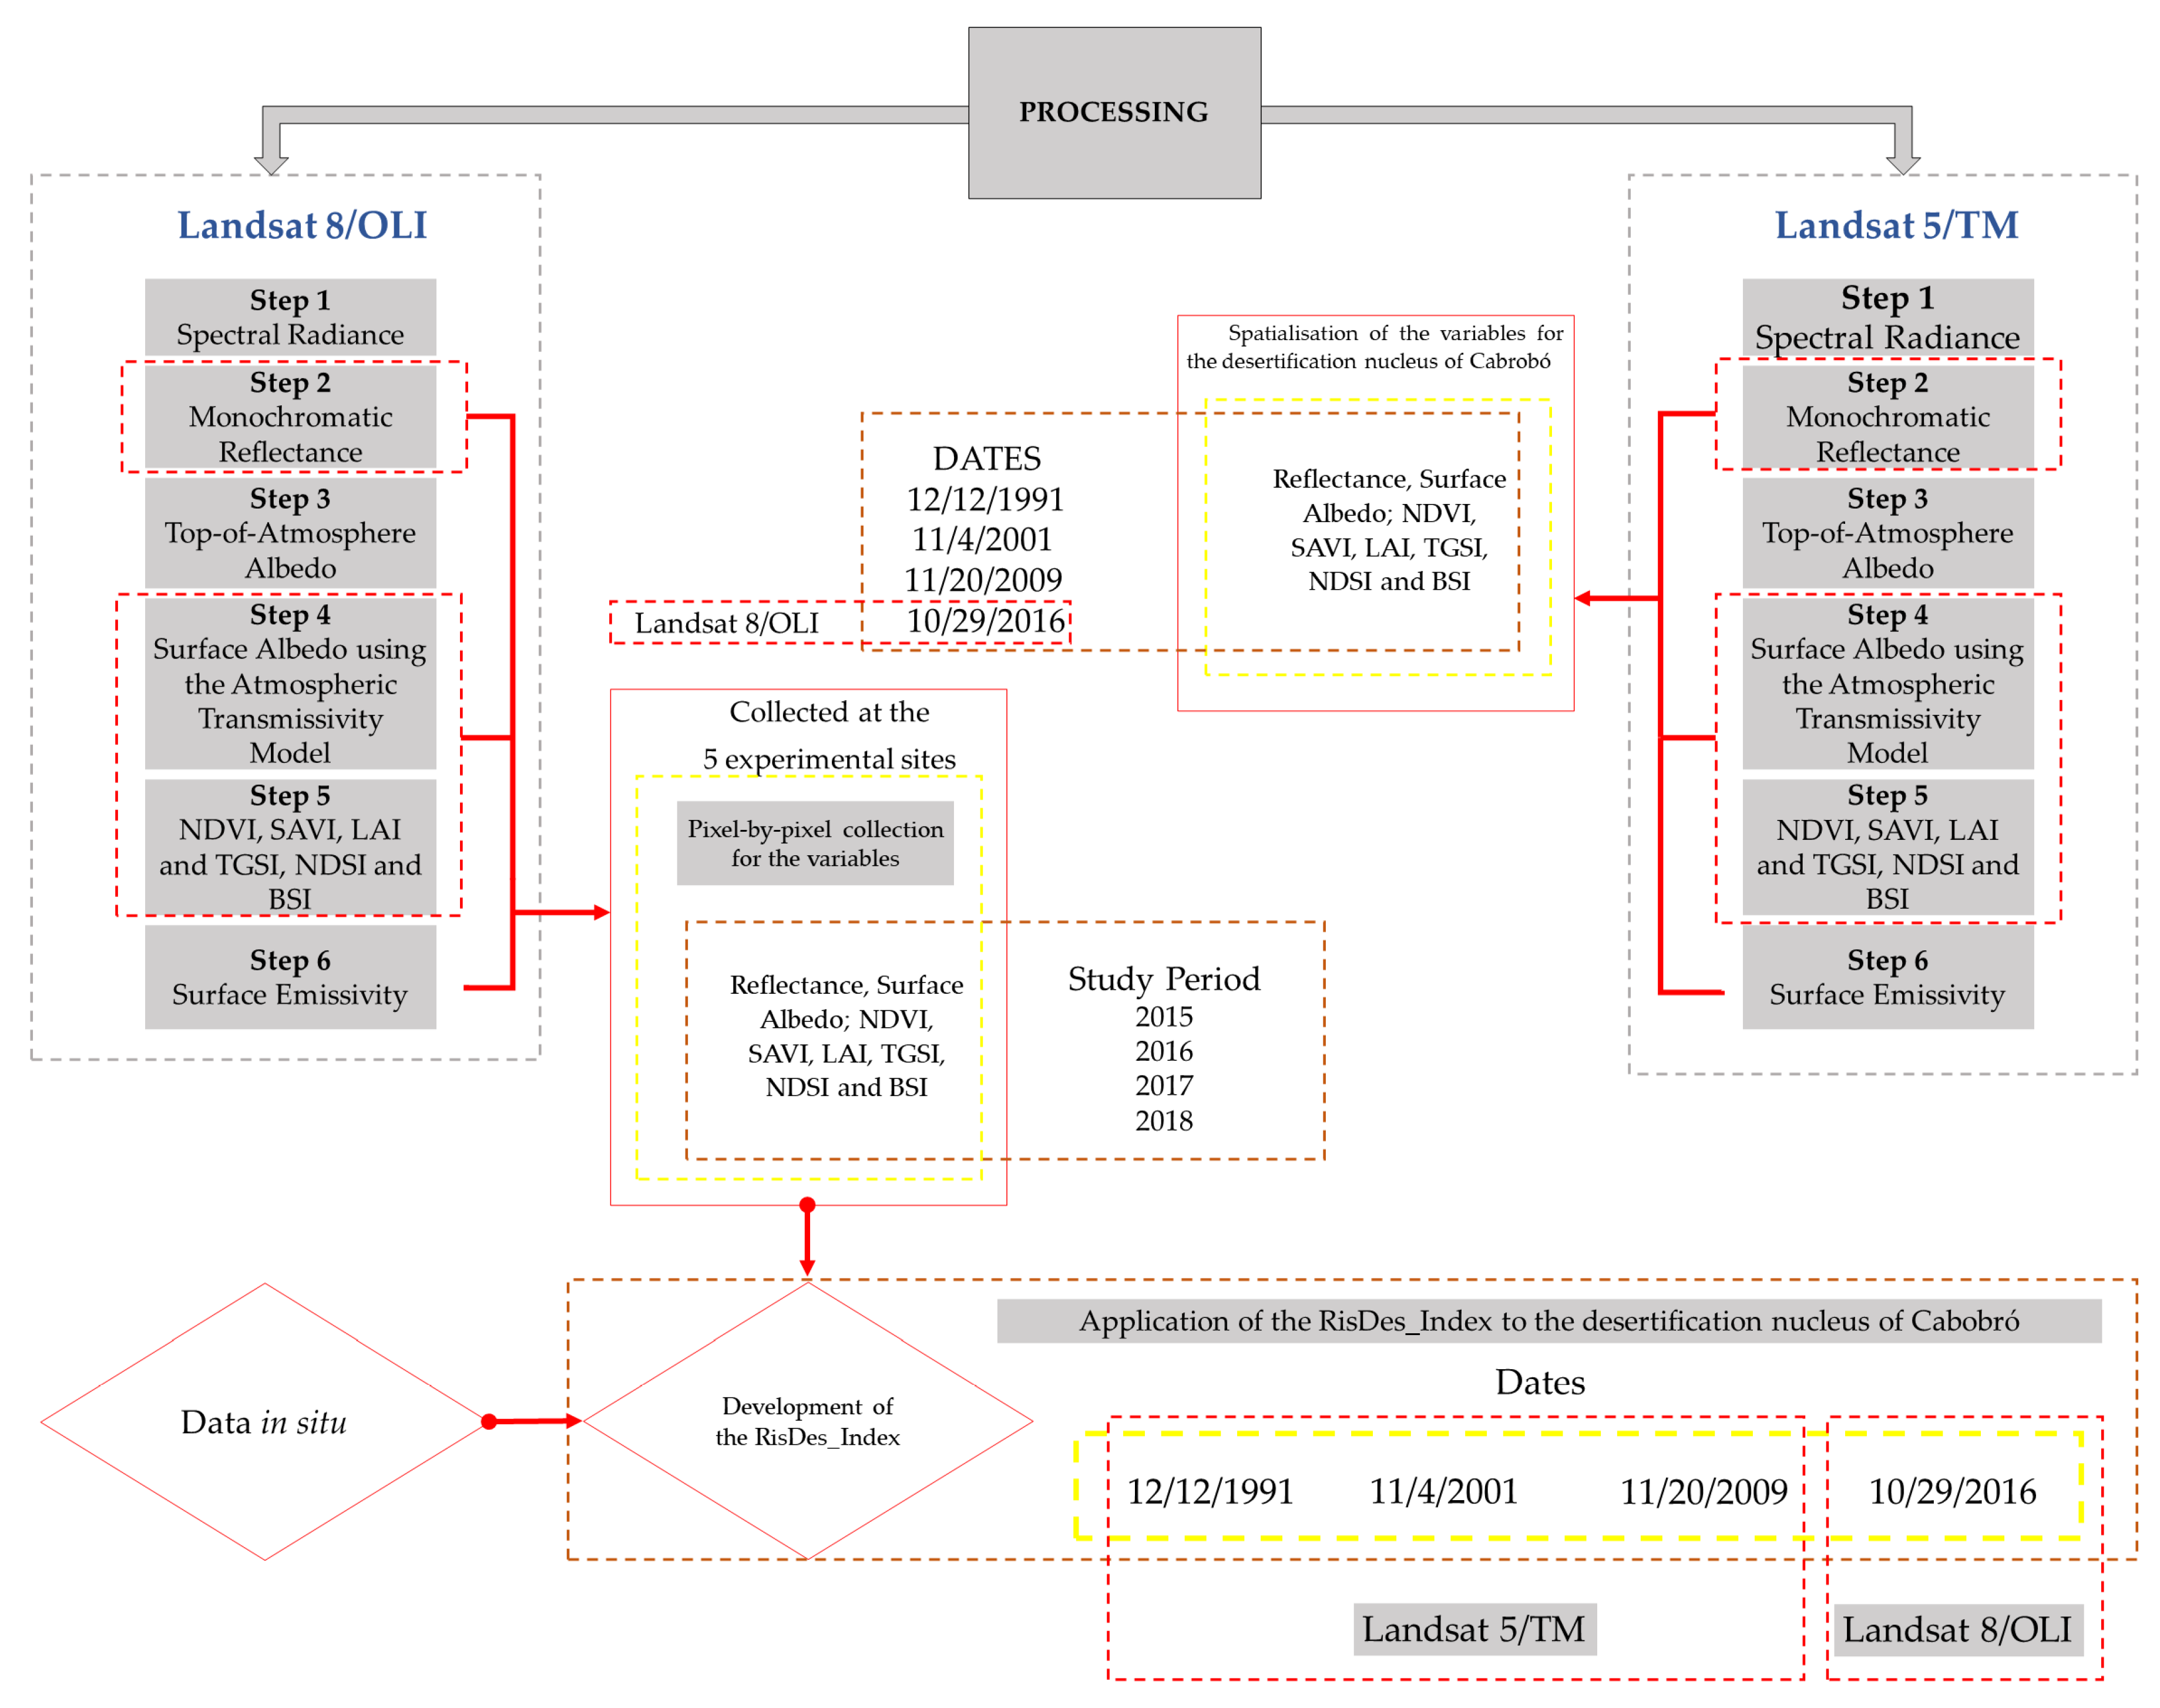
All the steps for image processing and product generation using the Landsat 5/TM and Landsat 8/OLI images are shown in Figure 3.
From the image data, radiances at the level of each band of the Landsat 5/TM and Landsat 8/OLI sensor systems were quantified using radiometric coefficients relating to radiance, available in the metadata files for each of the images.
The process of converting grey levels (digital number—DN = 255 grey levels) into spectral radiance was carried out in front of the Landsat 5/TM sensor. The conversion process was in accordance with the minimum and maximum radiance calibration coefficients, and spectral solar irradiances of each band at the top-of-atmosphere (TOA) proposed by Chander and Markham [35] and Chander et al. [36].
Equation (5) was used for the spectral radiance in each band of the Landsat 8/OLI [36,37]:
  L b   Land   8 = Add rad   b + Mult rad   b × DN
where Addrad b—additive term, and Multrad b—multiplicative term, both relative to radiance, extracted from the metadata files of each OLI image; DN—digital number, i.e., the intensity of each pixel and band (4096 grey levels). The reflectance (OLI) was determined as per Equation (6).
r b   Land   8 = Add ref   b   +   Mult ref   b × DN cos θ × d r  
where rb Land 8 (W m−2 sr−1 μm−1)—monochromatic reflectance for each pixel in each band; the terms Addref b and Multref b belong to the radiometric rescaling group, specifically reflectance Add band (equal to −0.1) and reflectance_mult_band (equal to 0.00002), respectively, presented in the metadata of each Landsat 8/OLI image; DN—digital number, i.e., the intensity of each pixel and band, θ—is the solar zenith angle at the data acquisition time, and dr—is the Earth–Sun distance in astronomical units, as per Equation (7) [38]:
d r = 1 + 0.033 × c o s DSA × 2 × π 365  
where DSA—Julian date. The annual mean value of dr is equal to 1 and ranges from 0.97 to 1.03. The cosine of the solar zenith angle (θ, dimensionless) was obtained from the solar elevation (E, degrees), available in the image metadata files, as shown in Equation (8).
cos   θ = c o s π   2 -   E = sin E
The weighting coefficients for each image band were then determined as per the methodology proposed by Chander and Markham [35], Chander et al. [36] and Silva et al. [37]. This requires the solar constant (W m−2 μm−1) associated with each of the OLI reflective bands, which is calculated from Equation (9).
k b   Land 8   = π ×   L b   Land 8     r b   Land 8 × cos   θ × d r
where kb Land 8 (W m−2 μm−1) corresponds to the solar spectral irradiance of each of the respective top-of-atmosphere (TOA) reflective bands of the Landsat 5/TM and Landsat 8/OLI.
The weighting (wb Land 8, dimensionless) of each OLI band was calculated using the ratio between the kb Land 8 of that band and the sum of all the kb Land of the Landsat 5/TM and Landsat 8/OLI [35,36,39,40], as seen in Equation (10). This weighting is used in calculating the planetary albedo.
w b   Land 8   =   k b   Land 8   Σ   k b   Land 8
The calculated weightings were used to determine the planetary albedo relating to the image-processing step. It should be noted that this process is similar to that routinely carried out in the SEBAL and METRIC algorithm by various authors [36,37,41,42] using TM images from Landsat 5.
The top-of-atmosphere albedo ( α toa ) represents the amount of radiation reflected from each pixel with no atmospheric correction, i.e., the linear combination of the spectral reflectance of TM bands 1 to 5 and 7, and a combination of OLI bands 2 to 7, with the respective OLI weightings (wb Land 8) as calculated by the previous equation. Therefore, the planetary albedo is obtained by a similar estimation to that carried out by Silva et al. [37] for the Landsat 8/OLI, as per the study by Silva et al. [40] for the Landsat 5/TM, Equations (11) and (12), respectively.
α toa   = w 2   ·   r 2   + w 3   ·   r 3   + w 4   ·   r 4   + w 5   ·   r 5   + w 6   ·   r 6   + w 7   · r 7
α toa   =   0.293 r 1 + 0.274 r 2 + 0.233 r 3 + 0.157 r 4 + 0.033 r 5 + 0.011 r 7  
where numerical values are the Landsat 5/TM weight coefficients [40]; w2, w3, w4, w5, w6 and w7 Land 8—weighting for each band; r2, r3, r4, r5, r6 and r7 Land 8—respective reflectance of each band.
To better estimate the albedo values, they were corrected [37,40,41], as per Equation (13).
α sup = α toa   - α atm τ s w 2
where α s u p —surface albedo corrected for atmospheric effects; α atm —atmospheric reflectance, obtained from a radiative transfer model, and varies between 0.025 and 0.04 [43]. For the SEBAL model, a value of 0.03 has been recommended and was adopted in this study [44]. τ sw is the atmospheric transmissivity of solar radiation for days with clear skies [43,45], calculated using Equation (14).
τ sw = 0.35 + 0.627 × exp -   0.00146   ×   P o Kt ×   cos   θ 0.075 W cos   θ 0.4
where Po is the instantaneous atmospheric pressure (kPa); Kt is the atmospheric turbidity coefficient (Kt = 1.0 for a bright and clear sky, and Kt = 0.5 for extremely turbid or polluted air), as per Allen et al. [43,46]. For the present study, a value of Kt = 1.0 was used, as suggested in various studies [37]; W is the precipitable water (mm), obtained as a function of the instantaneous relative humidity Equation (15).
W = 0.14   ×   e a × P o   + 2.1  

2.5. Vegetation and Soil Indices from the Experimental Sites

Three vegetation and/or biophysics indices were adopted: NDVI (Normalised Difference Vegetation Index), SAVI (Soil-Adjusted Vegetation Index) and LAI (Leaf Area Index). Using the classification proposed by Li et al. [47], the NDVI and SAVI indicate values that characterise the degree of desertification (>0.6 none; 0.45–0.6 little; 0.25–0.45 moderate; 0.15–0.25 serious and 0–0.15 very serious). According to the classification proposed by the same author, the LAI presents ranges that characterise desertification (>0.45 none; 0.35–0.45 little; 0.25–0.35 moderate; 0.10–0.25 serious; <0.10 very serious).
The NDVI was obtained from the ratio between the difference in reflectance in the near-infrared ( ρ I V ) and the red ( ρ V ), by summing both values, as per Allen et al. [43] (Equation (16)):
NDVI = ρ I V - ρ V ρ I V + ρ V
where ρ I V and ρ V correspond to the reflectances of the Landsat 8/OLI bands 5 and 4 and the Landsat 5/TM bands 4 and 3, respectively.
The SAVI, which seeks to mitigate the background effects of the soil, was estimated using Equation (17) [48]:
SAVI = ( 1 + L ) ( ρ I V - ρ V ) ( L + ρ I V + ρ V )
where ρ I V and ρ V correspond to reflective bands 5 and 4 of the Landsat 8/OLI and Landsat 5/TM, respectively; L is the soil adjustment constant, which depends on the type of soil, the most used value being 0.5 [40,49,50]. Allen et al. [46] and Silva et al. [51] employed a value of 0.1; here, a value of L = 0.5 was used.
The LAI, which is related to surface biomass, was estimated using the SAVI. The LAI was calculated using the method proposed by Allen et al. [46] and described by Equation (18):
LAI = - ln 0.69   -   SAVI 0.59 0.91
The Topsoil Grain Size Index (TGSI) was developed by Xiao et al. [52] to characterise the physical properties of topsoil. It is derived from the mean or effective diameter of individual grains or mineral particles. The TGSI reflects the increase in topsoil grain size, which has a positive correlation with the fine sand content of the topsoil. The more severe the desertification, the coarser the grains. High values for TGSI are found in areas with a high fine-sand content in the topsoil or a low proportion of clay–silt grains. The TGSI is obtained with Equation (19).
TGSI = R   -   B   ( R + B + G )
where R corresponds to the reflectance of the red bands of the sensor, B is the blue band, and G is the green band.
The normalised difference salinity index (NDSI) represents the surface characteristics of the soil and takes into account the IRthermal and IRmid infrared bands. Negative values or values close to zero supposedly show a susceptibility to soil salinisation, which is one of the processes that occur in desertified environments [53] (Equation (20)).
NDSI = IVthermal   -   IVmid IVmid + IVthermal
In this study, the bare soil index (BSI) replaces the vegetation index, which is unreliable in situations where the vegetation covers less than half the area [53] (Equation (21)).
BSI = IVthermal + IVnear   -   IVnear + R IVthermal + IVnear + IVmid + G 0 < BSI < 200
For all the results obtained via satellite images, values were collected pixel by pixel for temporal analysis of the variables. The value of the pixel was collected at the same geographic coordinate of the micrometeorological monitoring towers. An exploratory analysis of the data was conducted using a boxplot, and the index data were then compared with the in situ data to analyse their associations using principal component analysis (PCA) and to then identify the satellite products that best explain the differences between the areas.

2.6. Exploratory Analysis of the Data

Exploratory analysis of the in situ set of data and the satellite indices was carried out by boxplot, following the routine suggested by Ferreira et al. [14]. For the boxplot, the minimum values or 1st quartile ‘Q1’ were calculated; the medians or 2nd quartile ‘Q2’ and the maximum or 3rd quartile ‘Q3’. Q1, therefore, indicates that 25% of the data are equal to or less than Q1, and Q3 indicates that 25% of the data are equal to or greater than Q3. The difference between Q1 and Q3 is the amplitude of the boxplot, called the Interquartile Range (IQR). Q2 envisages a central trend in the data, indicating the midpoint of the distribution. Outliers occur outside the range of the lower (Li = Q1 − 1.5 × IQR) and upper (Ls = Q3 − 1.5 × IQR) limits of the boxplot and were maintained in the study.

2.7. Association between the Satellite Products and the In Situ Data from the Experimental Sites

PCA was used to analyse the association between the in situ data and the satellite indices, according to Jardim et al. [54]. The in situ data comprised the micrometeorological data Rn, In and β. The soil data included CE, pH, OM, Ca, P, K, Na, C, Mg, Fe, Cu, V and CEC (chemical), and FC, WP, BD, Sand, Silt and Clay. The satellite indexes data considered the NDVI, α, TGSI, LAI, NDSI and BSI (physical) was from the average of values from nine pixels around the towers. PCA was used to identify the variables that best explain the RisDes_Index and, therefore, the occurrence of desertification. With PCA, the covariance matrix is calculated, and the data are self-scaled. The eigenvectors display the weightings for one principal component (PC) and the eigenvalues give the amount of variance explained by their respective PC, such that PC1 > PC2 > PC3 and so on.

2.8. Proposal for the Model

Combining the variables from satellite images from 18 dates (Table 2) and the data around the towers on the dates of each image in 2015, 2016, 2017 and 2018, those variables from satellite images that best represented the study sites using the RisDes_Index were the albedo and LAI. Furthermore, the reflectance variable was selected as it well represents the characteristics of the soil concerning its structure in the red, green and blue bands [52], prime data used in various indices (e.g., NDVI and BSI). The proposed model, i.e., RisDex_Index, and its respective variables can therefore be described by Equation (22):
RisDes Index = R   -   B + R + B R + B + G ×   LAI α sup
where R—reflectance in the red band; B—reflectance in the blue band; G—reflectance in the green band; LAI—Leaf Area Index; αsup—surface albedo.
The LAI represents the level of ground cover, and the albedo represents the surface reflectance capacity [25]. Table 3 shows the range of values of the RisDes_Index used to identify the risk of desertification.

2.9. Intercomparison between Methods and Evolution of the Desertification Process: A Case Study

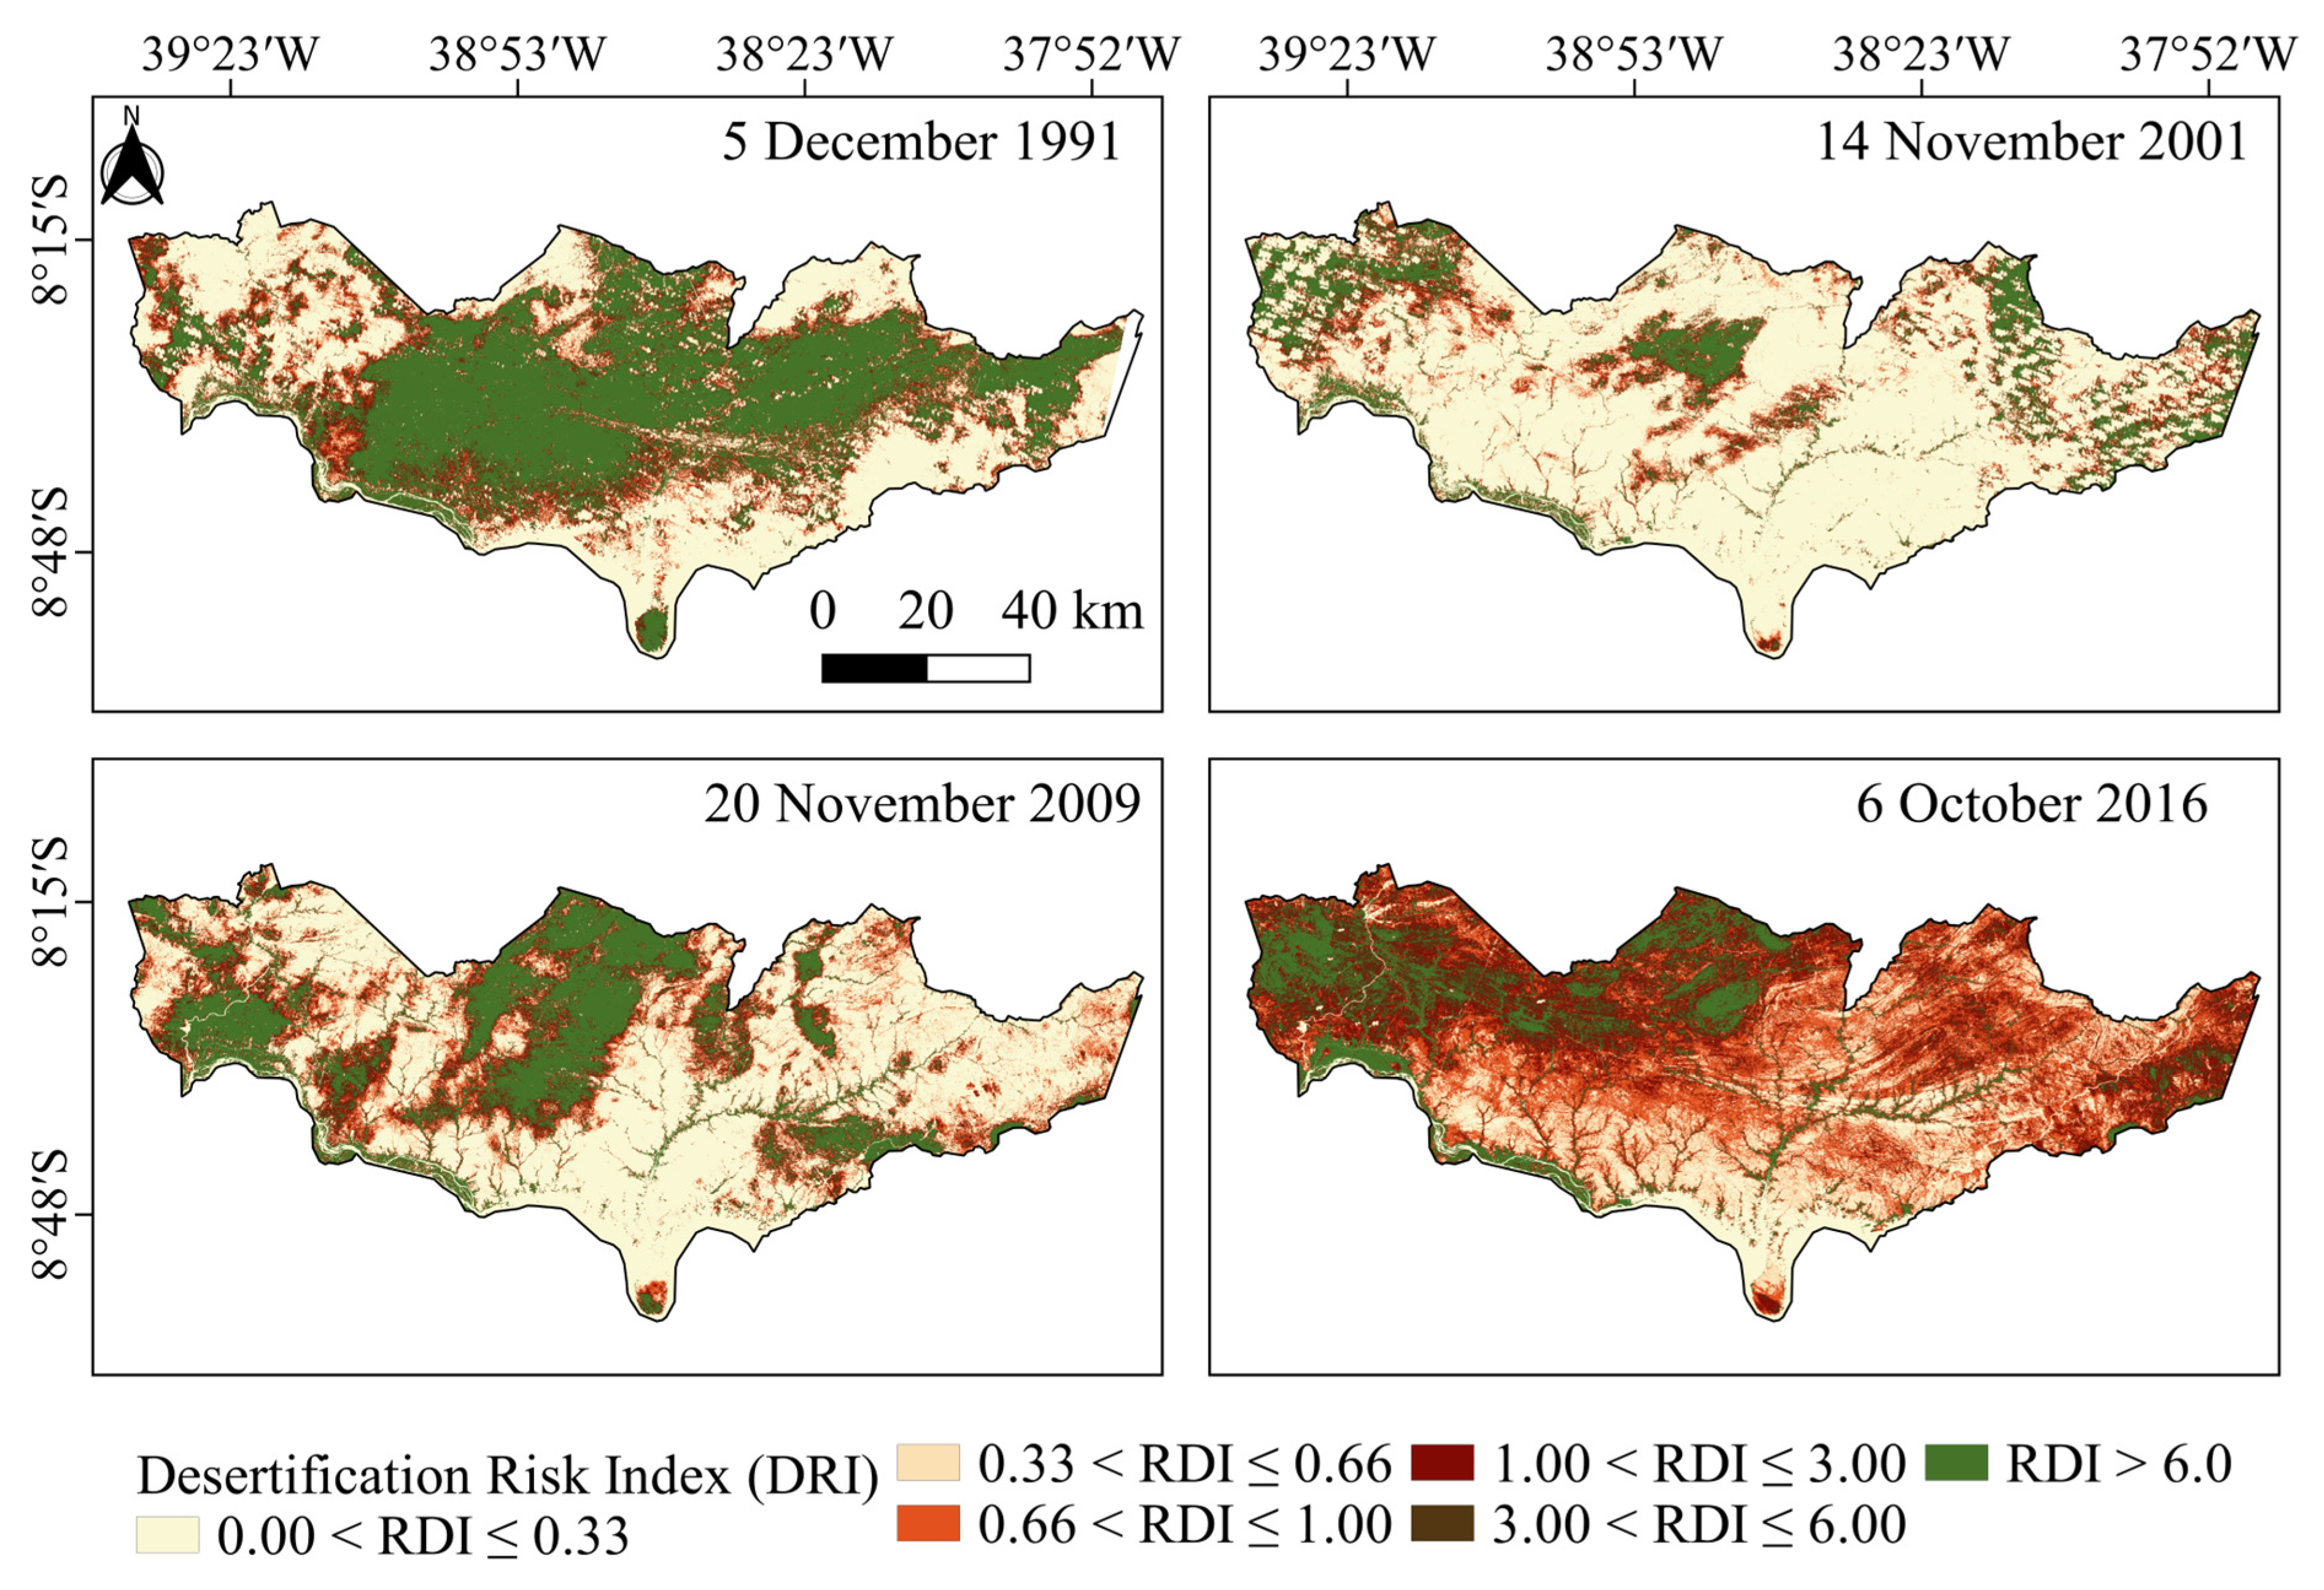
For intercomparison of desertification risk assessment methods and to evaluate the evolution of the desertification process in the DN of Cabrobó, the RisDes_Index model and the other three methods were applied to all pixels of the images from 5 December 1991, 14 November 2001, 20 November 2009 and 6 October 2016 of the DN of Cabrobó. The images were collected for the driest period of the year, aiming to minimise the effect of rain on the vegetation cover (monthly precipitation less than 30 mm). The DN of Cabrobó is located in the Sertão do São Francisco in the State of Pernambuco (Figure 1). The results of the proposed RisDes_Index were compared using the DDI (Desertification Determination Index) method suggested by Wei et al. [24]. This method indicates five levels of desertification: severe, high, medium, low and no desertification, and can be described by Equation (23):
DDI = K × NDVI × α sup
where K is determined by the slope of the linear regression function in the feature space.
Another model compared to the RisDes_Index was the method proposed by Pan and Li [25], which characterises five different levels of desertification: no desertification, mild desertification, moderate, severe and extremely severe, and can be described by Equation (24):
I = a × LAI   - α sup
where a = (0.225) is a constant in the equation determined by linear regression between the albedo and the vegetation present on the surface, as per Pan and Li [25].
The third model compared to the RisDes_Index was the method proposed by Xu et al. [55], known as the Moving Standard Deviation Index (MSDI), which detects the changes and classification through a decision tree based on predefined rules for the NDVI, albedo and MSDI.
To evaluate the evolution of the desertification process in the DN of Cabrobó, the RisDes_Index model was also applied to all pixels of the images from 5 December 1991, 14 November 2001, 20 November 2009 and 6 October 2016, and then calculated the variation in the advancing desertification. These images were chosen to include years that most reflected climate change and the evolution of socio-economic indicators for the 80s, 90s, 2000s and 2010s in the case study region. The variables NDVI, LAI, SAVI, albedo, TGSI, BSI and NDSI were also calculated for the same dates. From the PCA, the results of the model were found to group with the climate data and socio-economic data for the DN of Cabrobó, according to Jardim et al. [54]. The climate data for the 1981–1991, 1992–2001, 2002–2009 and 2010–2016 series were taken from the digital platform of the Pernambuco Agency for Water and Climate (APAC), and the economic data from the censuses were extracted from the homepage of the Brazilian Institute of Geography and Statistics (IBGE). The climate data included the mean annual rainfall (R), reference evapotranspiration (ETo) [56] and the water balance W (W = P − ETo); the socio-economic data were the animal population (goats, sheep and cattle), planted areas and GDP (Gross Domestic Product).

3. Results

3.1. Exploratory Data Analysis

Figure 4 shows the boxplots of the variables obtained employing the satellite images and in situ data. When checking Figure 4a, the values found for DES are in Q1; the limit (Q3) was 0.5771, and Q1 was 0.1176; the median for this variable was 0.2491. The values seen in Figure 4d–f are related to the vegetation indices and characterise the surface DES, which has the lowest values about the other areas, with the values concentrated in Q1 for the three calculated indices NDVI, LAI and SAVI, with a median of 0.27, 0.32 and 0.25, respectively. The highest values for the three indices were found in CANEWS and CANENS, with values of 0.74, 3.77 and 0.32. The lowest values, 0.11, 0.04 and 0.13, were found in DES.
With the in situ data, low values were found for net radiation in the area of desertification (Figure 4i). Values at this site reached between 6.0 and 11.0 MJ m−2 day−1. For CAA, the values ranged from 12.5 to 17.5 MJ m−2 day−1. On the other hand, for CAC, CANEWS and CANENS, the values were all between 9.0 and 15.0 MJ m−2 day−1. Figure 4j shows a more homogeneous distribution of the LE data, falling within the IQR, except for CAA, CANENS and CANEWS, which show greater variation. The distribution of the DES data was similar to that of the CAC, with values below 5.0 MJ m−2 day−1. The median was 1.55 MJ m−2 day−1, and the maximum and minimum values were 16.30 and 0.0 MJ m−2 day−1, respectively.
Figure 4l shows the dispersion of the values of the RisDes_Index, which in DES had a median of 1.02 and minimum and maximum values of 0.26 and 7.98, respectively. These results reflect the higher percentage of bare soil and the higher surface albedo, as shown in Figure 4c,g. Together, this information reinforces the theory that the RisDes_Index is consistent in identifying areas at risk of desertification. All the values for CAC can be found within Q2, whereas CANEWS and CANENS showed the greatest magnitudes relative to the other surfaces.

3.2. Associating the Orbital Data with the In Situ Data

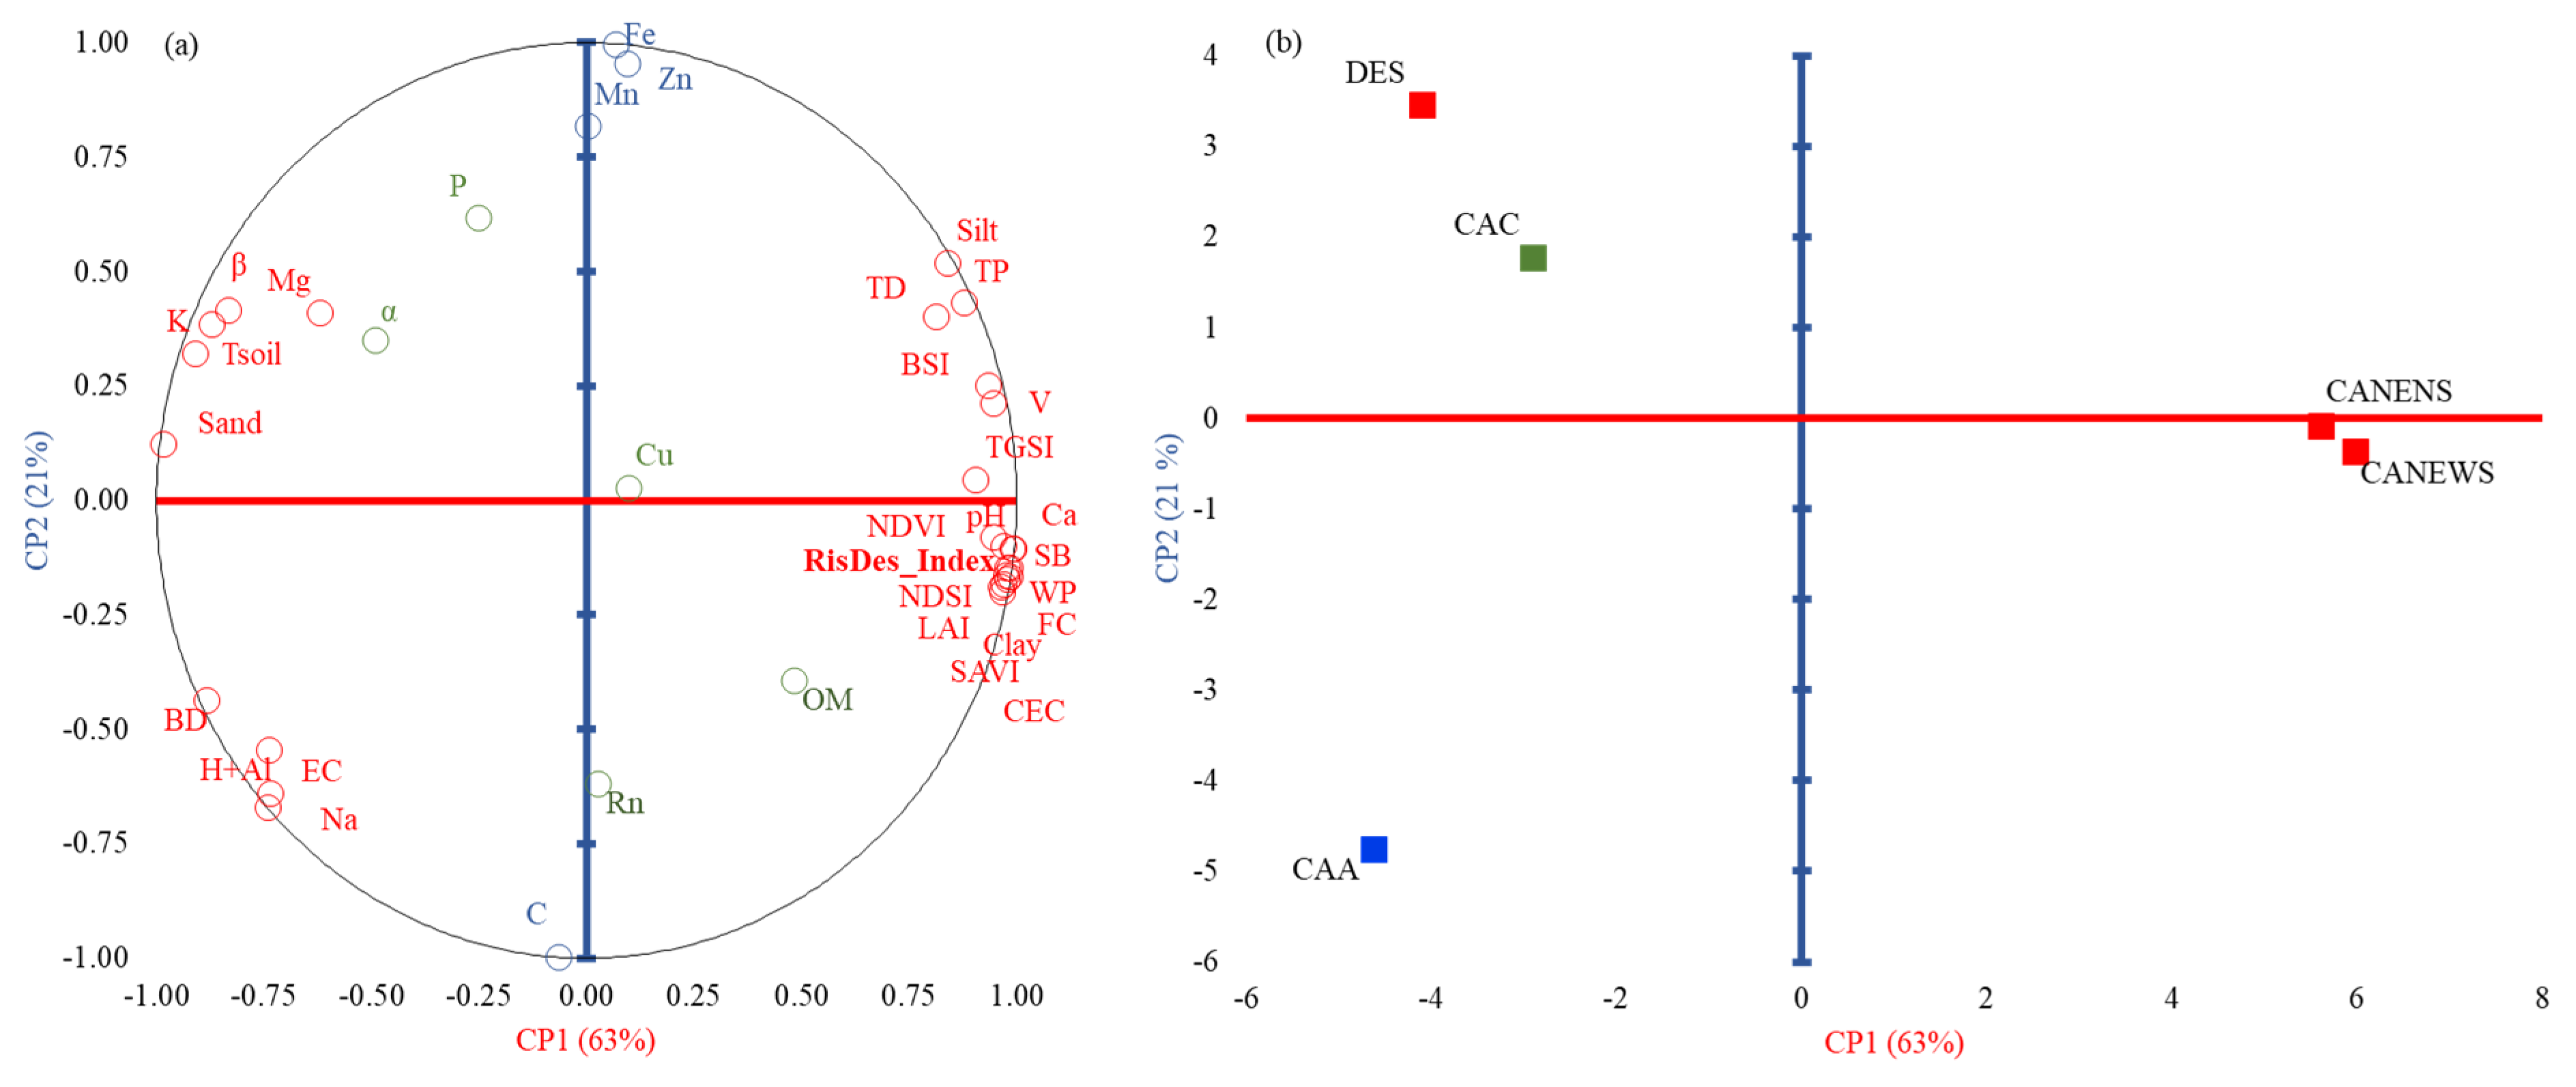
Using PCA, two components explained 84% of the variability in the data, with PC1 and PC2 accounting for 63% and 21%, respectively (Figure 5a,b). The red, blue and green circles refer to the variables with the greatest contribution to the PC1, PC2 and PC3 axes, respectively (axis not shown). Variables with the same colour show a high correlation with each other, whether positive or negative. Variables further from the centre have a greater contribution to their respective axis. Figure 5a shows that the RisDes_Index had a positive association with the satellite indices NDVI, LAI, SAVI, TGSI and BSI and a negative association with Tsoil, as well as with several physical properties of the soil (e.g., positive—Clay and Silt, negative—Sand and BD) and chemical properties of the soil (e.g., positive—pH, Ca and SB; negative—K, Mg and Na). Figure 5b shows a positive correlation between CANENS and CANEWS (wetlands) but a negative correlation between these and DES. Combining the results of Figure 5a,b, it can be seen that DES had a negative correlation with the RisDes_Index and a positive correlation with the β, Tsoil, K, Mg and Sand variables, i.e., environments with higher values for these variables and lower values for the RisDes_Index show a greater risk of desertification. CAA had a positive association with OC and a negative association with Fe, Mn and Zn, and the area of cactus with α, P, Cu, OM and Rn_In.

3.3. Identifying Areas under Desertification

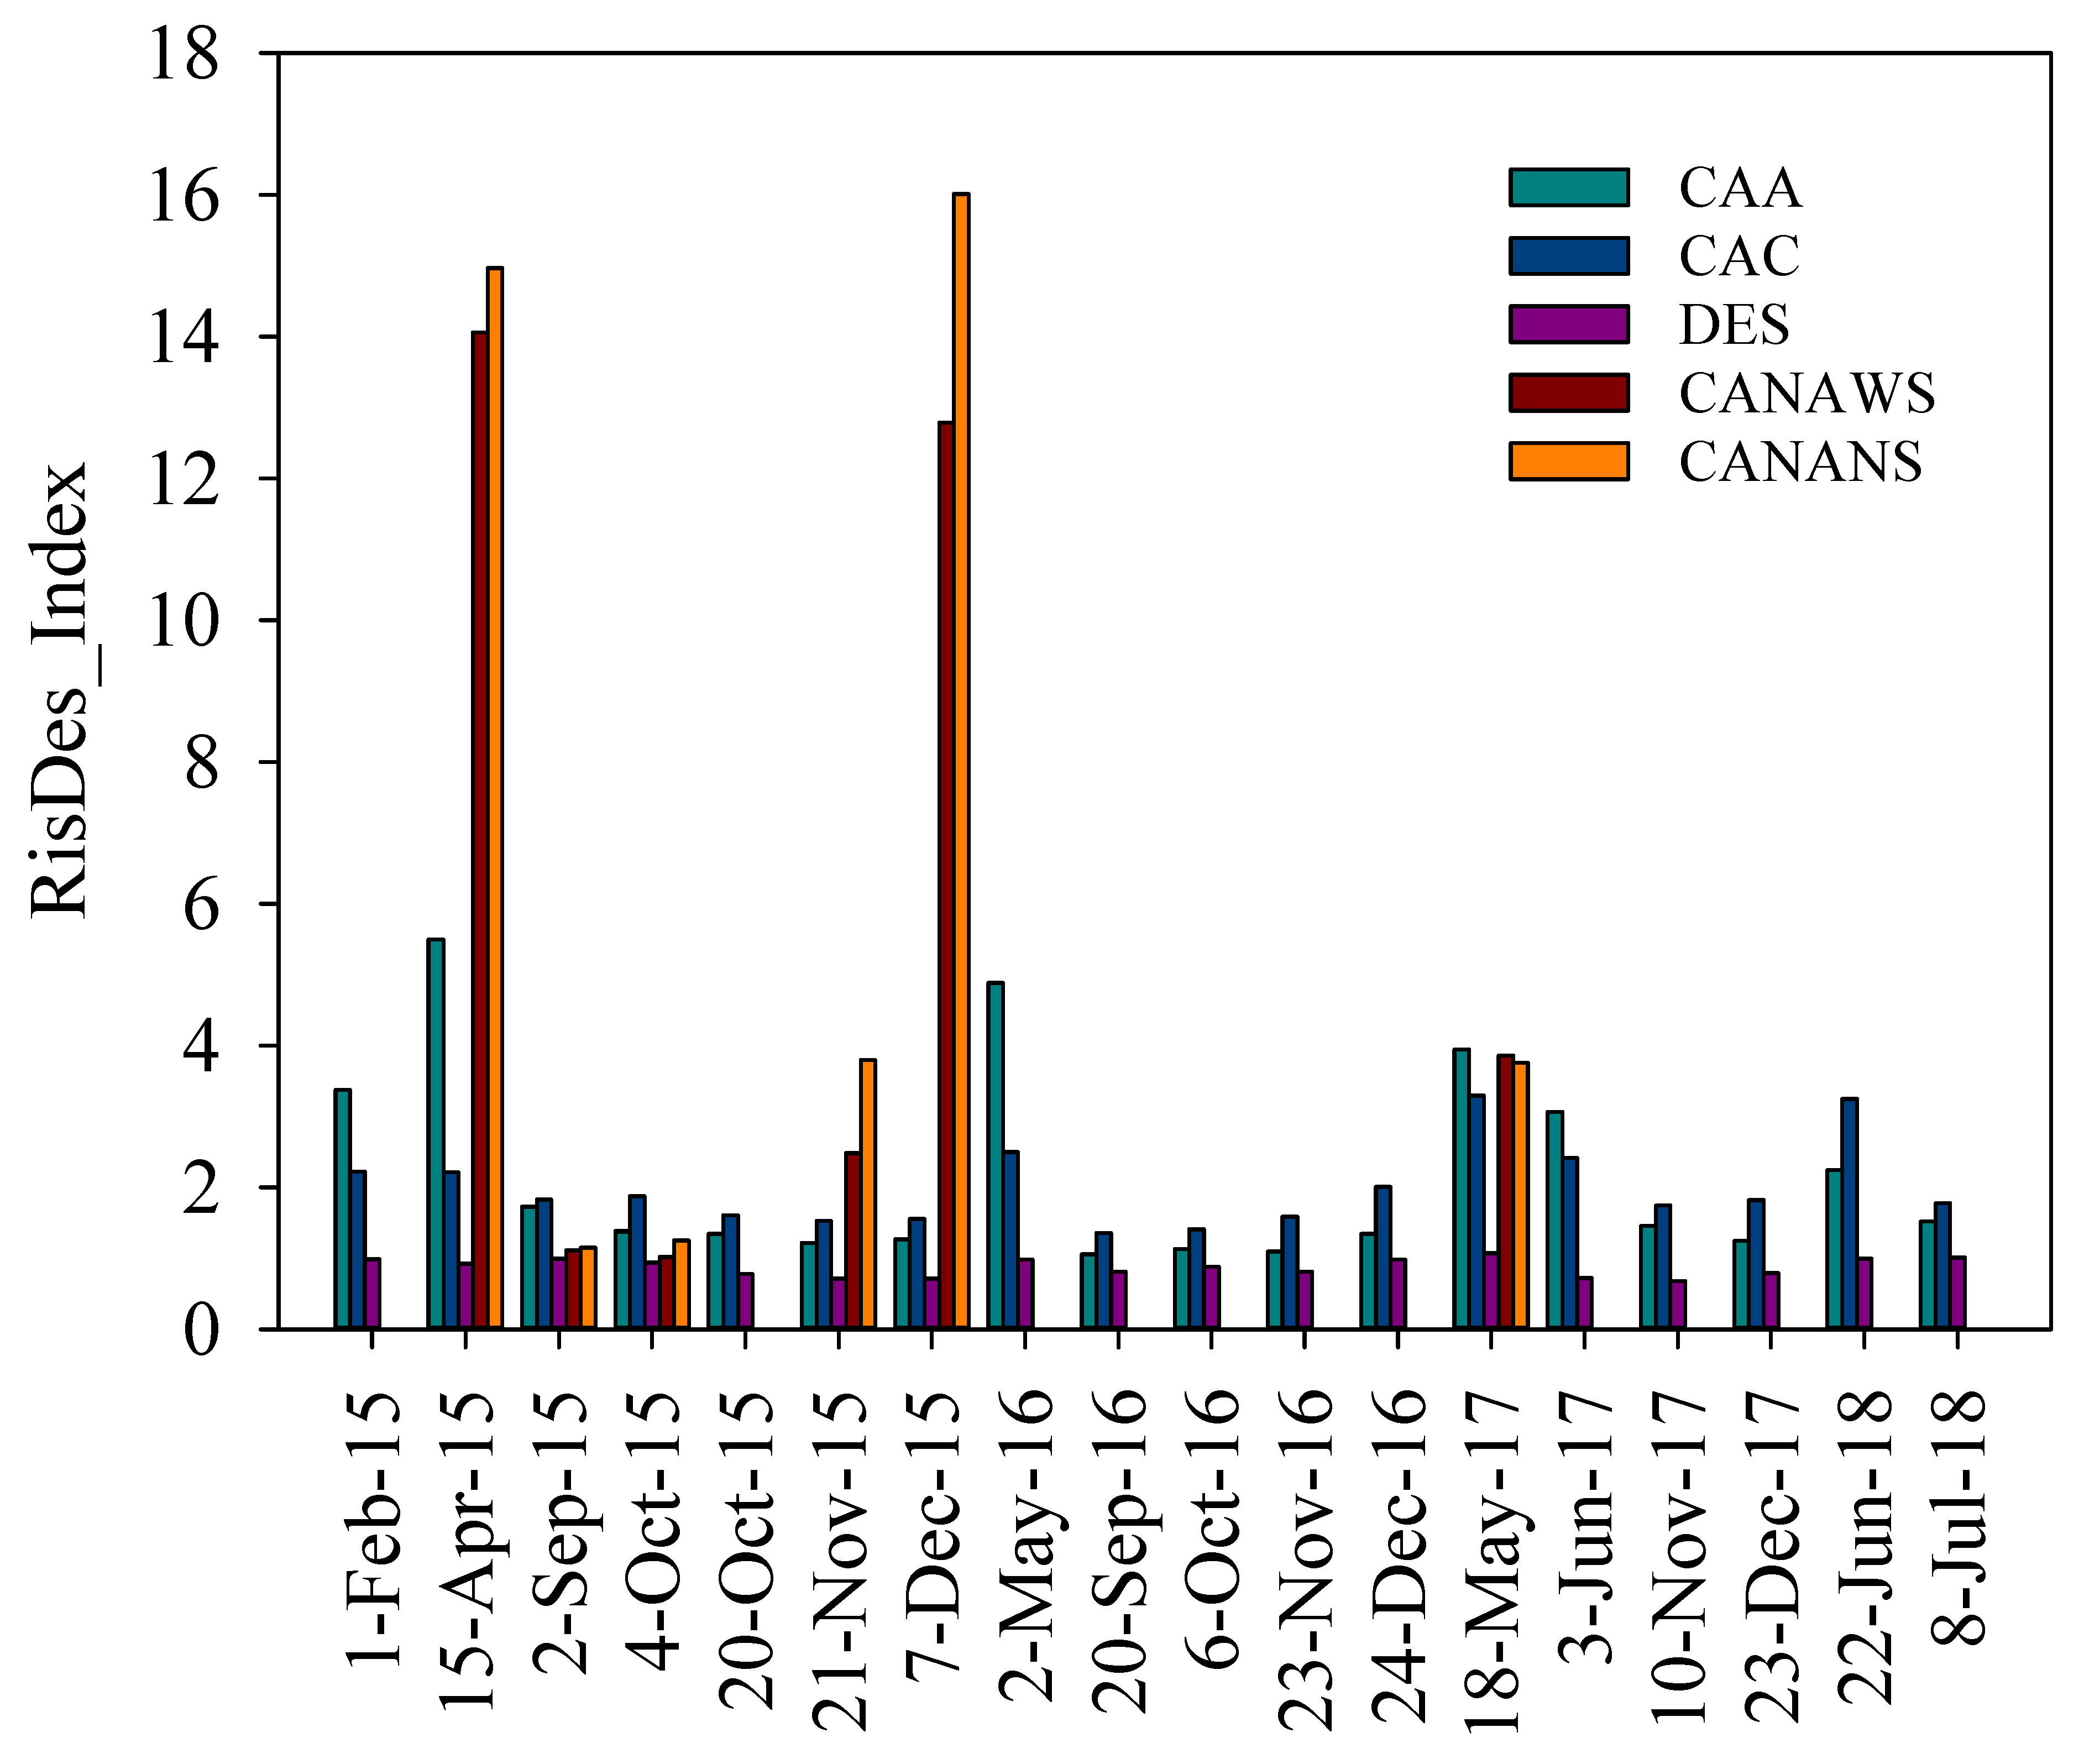
In Figure 6, the values of the RisDes_Index for the five sites can be seen. The RisDes_Index varies little in an environment under advancing desertification. For the desertified area, the values of the RisDes_Index do not exceed 1.0, even during the rainy season (January to May); however, during the drier months, the values of the RisDes_Index were slightly lower compared to the rainy months. As such, a range of 0.0 to 1.0 was used to characterise areas under advancing desertification, where the lower the value of the RisDes_Index, the more intensified the process since there is an indication of a marked reduction in LAI and an increase in albedo. Classes of advancing desertification were therefore defined as high (up to 0.33), medium (up to 0.66) and low (up to 1.0).
The values found for the areas of cacti and Caatinga were greater than 1.0, mostly exceeding 5.0 in the area of Caatinga on Date 2 (15 April 2015) (Figure 6). For the Caatinga, the values fell within the 1.23 to 5.49 range, which, depending on the time of year, can characterise an area of Caatinga with greater or lesser vegetation cover. Therefore, values between approximately 1.0 and 3.0 may indicate sparse Caatinga and from 3.0 to 6.0 dense Caatinga. Due to the low LAI, the risk of desertification in sparse Caatinga is greater when combined with climate and socio-economic factors. In the area of cacti, the values were mostly greater than 1.0 and less than 3.0, with the greatest seen on 3 June 2017. As the values for the cacti are similar to those of the sparse Caatinga, the same range can be used to identify this type of surface.
For areas of irrigated sugarcane with and without a ground cover of straw, the values of the RisDes_Index are greater than 6.0. The wetland class was therefore created to include values greater than 6.0. It is important to point out that, due to the sugarcane harvest between Date 3 (2 September) and Date 4 (4 October 2015) (Figure 6), values approached those noted for the surface under desertification since the soil is completely bare. This result shows that to judge the level of desertification of a region, it is recommended that different dates be used to analyse the stability of the data. An exploratory assessment of the data can ensure complete identification of the areas of interest.

3.4. Intercomparison between the RisDes_Index and the Other Methods Using Satellite Products

When comparing the results of the RisDes_Index with the model by Wei et al. (2018), it was found that for 5 December 1991, 14 November 2001, 20 November 2009 and 6 October 2016 there was an increase in the desertified areas of 6% using the RisDes_Index and 8% using the methodology proposed by Wei et al. [24] (Table 4). The greatest differences between the two methods were found for the class of sparse Caatinga. For the wetlands, the values remained stable throughout the study period. With both models, the highest index values were found for the image dated 29 October 2016. The model proposed by Xu et al. [55] gave very similar results to the RisDes_Index and to the Wei et al. [24] method, but with the RisDes_Index showing a higher % of the area at risk of desertification. The Pan and Li [25] model showed the greatest disparity with the RisDes_Index.

3.5. Vegetation Indicators and Evolution of the Desertification Process in the DN of Cabrobó

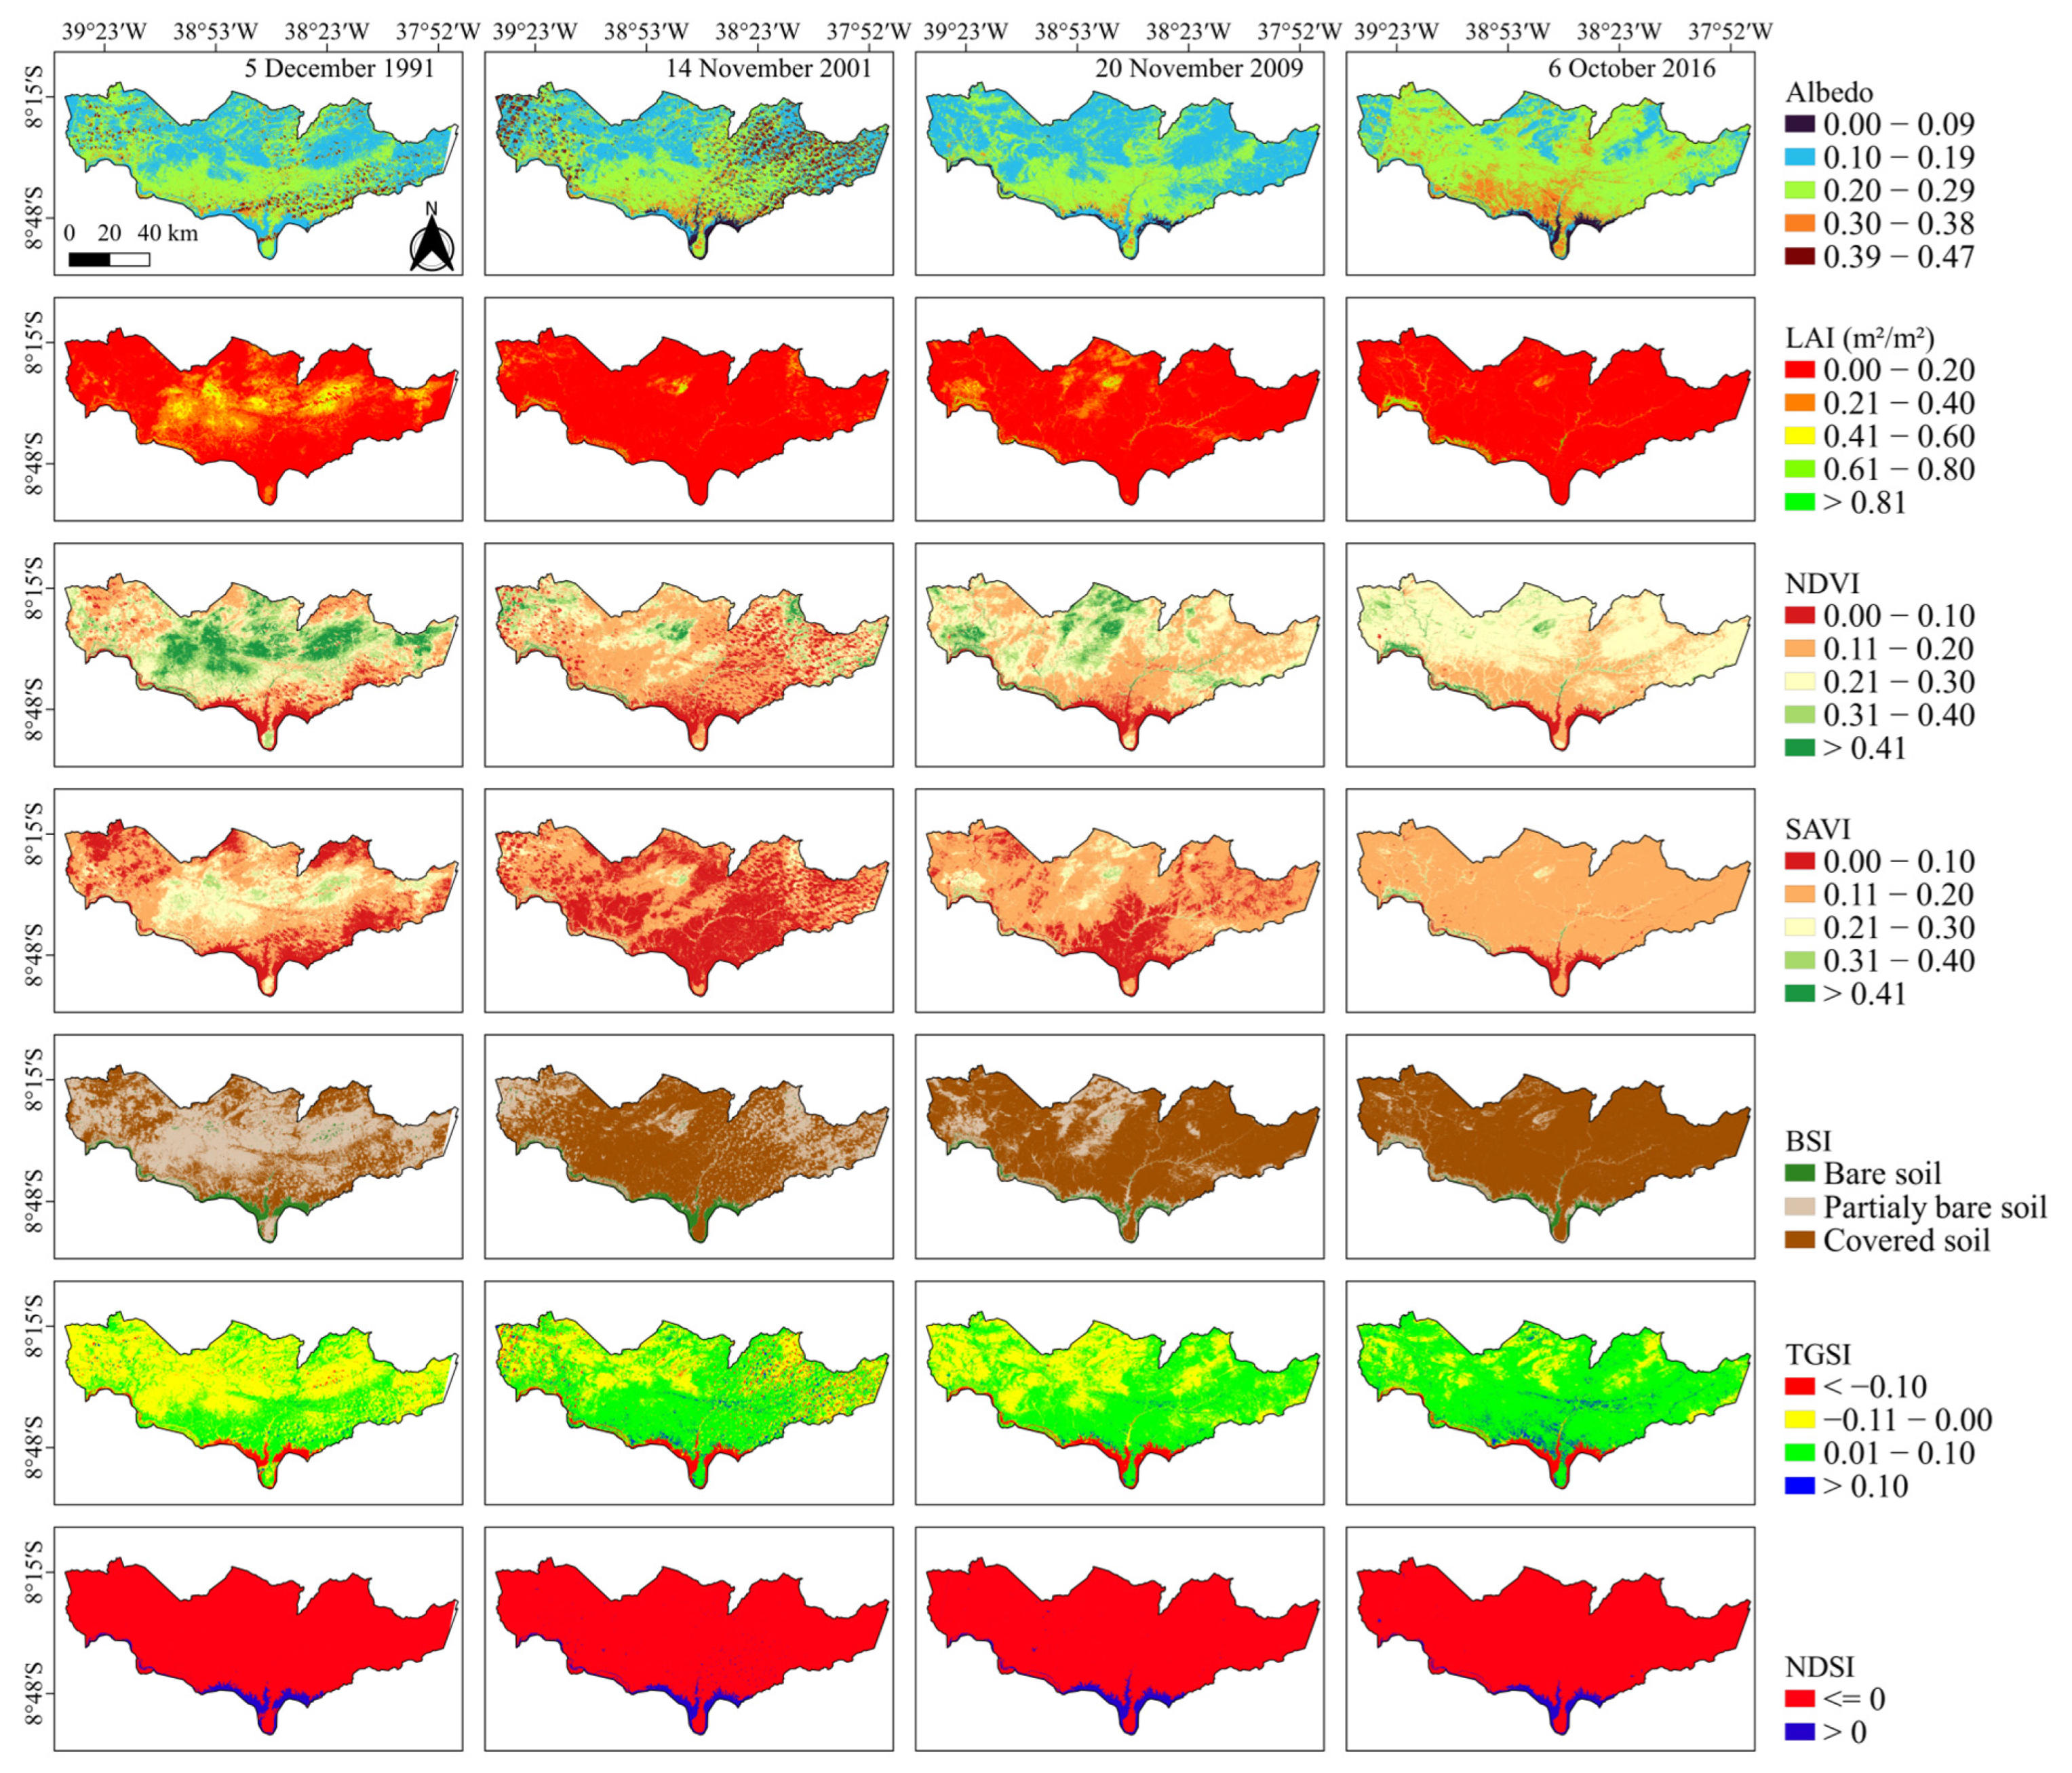
The spatio-temporal analysis carried out on 5 December 1991, 14 November 2001, 20 November 2009 and 6 October 2016 sought to check the variation in the indices of vegetation and albedo in the DN of Cabrobó. Knowing this information makes it possible to judge the intensity of the desertification process in the area. Looking at the albedo maps (Figure 7), the values increase between 5 December 1991 and 6 October 2016. Albedo values that were in the 0.2 to 0.3 range increased by 40%; in the 0.1 and 0.2 range, they decreased by 5% over the study period, indicating an increase in the areas of soil with little or no vegetation. As stated in various studies of the semi-arid region of Brazil [51], an increase in the areas with little or no vegetation helps to advance the desertification process.
When the LAI maps were analysed, a variation of between 0.0 and 0.9 m2 m−2 was seen, as well as a considerable reduction in vegetation cover in the region, especially in the districts of Floresta, Itacuruba, and Belém do São Francisco. For the observed dates, the LAI in around 70% of the area is in the 0.5 to 0.1 range, showing little vegetation cover for the desertification nucleus of Cabrobó. The highest values for the LAI are found in agricultural areas and areas of denser caatinga, which correspond to 9% of the area under study. Values for the SAVI of between 0.05 and 0.9 were found.
From the maps in Figure 7, a reduction can be seen in the values of SAVI over the years, except for 2009, when values reached 0.6 in around 80% of the area on that date. These results may be associated with a greater rainfall depth. Rainfall is one of the factors that most interfere with this type of analysis in the caatinga biome [10]. Both 2001 and 2009 were the wettest in the region between the years under evaluation (1991, 2001, 2009 and 2016). In 2009, the districts of Cabrobó, Orocó, and Belém do São Francisco were the wettest. A rainfall depth of 159.1 mm was found for the region (during three months). These depths affect the LAI, NDVI, SAVI and albedo. Taking the rainfall volume into account is very important when intending to verify the variability of the Caatinga vegetation since the response of this vegetation to the presence of water is very dynamic.
The NDVI, as well as the LAI and SAVI, showed a reduction over time in the study region and, consequently, an increase in albedo. The highest values were seen on 5 December 1991, with around 70% of the area showing a value between 0.3 and 0.9. On the other hand, for 6 October 2016, 67% of the area had NDVI values in the 0.1 and 0.2 range. The bare soil, TGSI and NDSI indices showed an increasing trend, with the bare soil index showing the highest values, with increases reaching 15% between 1991 and 2016. The TGSI, which identifies the amount of fine sand on the surface, increased by 13%, with the greatest values in 2016.
From applying the model to the dates (5 December 1991, 14 November 2001, 20 November 2009 and 6 October 2016), changes in the surface pattern were identified for the DN of Cabrobó (Figure 8). The results show that the desertified areas, 38% on 5 December 1991, increased to 51% in 6 October 2016, corresponding to an area of 1185.99 km2. A reduction in the areas of Caatinga of the order of 20% was identified over this period.

3.6. Association between the Progress of Desertification, Climate, and Socio-Economic Data

Based on the PCA, it was found that two components were sufficient to explain 83% of the variability in the data. PC1 and PC2 accounted for 60% and 23%, respectively (Figure 9). The red, blue and green circles refer to the variables with the greatest contribution to the PC1, PC2 and PC3 axes. Variables with the same colour show a high correlation with each other, whether positive or negative. In 5 December 1991, a positive correlation can be seen between R and W, indicating that at that time, the amount of rainfall and available water were greater and that the areas of Caatinga were larger. On the other hand, in 6 October 2016, there was a positive correlation between GDP, AreasDesert and PopAnimal and a negative correlation with AreasCAA, R and W, revealing that between 5 December 1991 and 6 October 2016, the increase in areas under desertification was caused by climate and socio-economic factors and by a reduction in the area of Caatinga. However, based on the contributions of these factors to PC1, the order of importance is as follows: reduction in R, reduction in AreasCAA, reduction in water availability (W), and increase in PopAnimal.

4. Discussion

In the present research, we found that for the area of desertification under study, there was a strong association of micrometeorological variables (i.e., the Bowen ratio—β) and the soil surface temperature (Tsoil_Sat) with physical and chemical properties (e.g., total sand and pH, respectively) and vegetation cover, indicating that environments with sandy, acidic, barer soils with a high β value and high soil temperature are more prone to desertification. These results made it possible to validate the ability of the RisDes_Index method to identify areas where desertification occurs. Then, the application of this method was carried out in a desertification nucleus (DN), the Cabrobó DN, well known in the Sertão Central region of Brazil, one of the most important dry areas in the world due to the size of its population, the presence of endemic vegetation, the Caatinga, and the use of irrigated crops.
The proposal for the RisDes_Index was based on the reflectance variables of the R, B and G bands, albedo and LAI of the Landsat 5/TM and Landsat 8/OLI satellites, with the results tending to be similar to those of the methods of Wei et al. [24], Pan and Li [25] and Xu et al. [55], but, in addition to identifying areas of desertification, having the advantage of including risk assessment, classifying other types of surface, and being based on associations with micrometeorological data, the physical and chemical properties of soil and the vegetation cover. The reflectances of the bands provide information regarding solar radiation incident on the surface [55], whereas the albedo corresponds to the capacity for reflecting incident energy, where areas with little or no vegetation tend to have a higher value. The LAI responds to the presence of vegetation on the surface, distinguishing the vegetation cover by the variation over time. The albedo is widely used to identify desertified areas [10]. According to Wu et al. [57], high albedo values characterise a greater level of severity in the desertification process. This same trend was found by other authors [4,10,58].
The proposal for the RisDes_Index can extend its application to different study regions, as it considers biophysical variables that are associated with independent surface data (e.g., micrometeorological data, vegetation, and the physical and chemical properties of the soil). Due to the design of the RisDes_Index, it appears to be an excellent option for judging areas in the process of desertification. Studies of this nature have been carried out in various regions of the world using methodologies that are often limited to local evaluations [24,52,55,59] that require calibration.
The variation in the values of the RisDes_Index accompanied the variation in the soil indices (TGSI, BSI and NDSI). According to Xiao et al. [52], the TGSI index, which is related to desertified areas, reflects the characteristics of the particles on the soil surface in such a way that the smaller the value, the finer the sand on the surface, and consequently, the more severe the degradation or desertification. The increase in desertification shown by the RisDes_Index was also in line with the reduction in the values of the vegetation indices on the dates under study (5 December 1991, 14 November 2001, 20 November 2009 and 6 October 2016) and with the reduced vegetation cover (LAI). In work carried out in Mongolia, Wei et al. [24] found that 81% of the study area, which showed signs of desertification, was covered by low levels of vegetation. This characteristic contributes directly to soil exposure and, therefore, to the action of weather conditions that favour the desertification process.
Application of the RisDes_Index in the DN of Cabrobó, our case study, confirmed the advance of the desertification process in the region. In the DN of Cabrobó, the reduction in the areas of Caatinga [60] and the increase in surface albedo are two indicators of increased degradation, which are closely associated with the process of desertification [1,61]. The inverse correlation between 5 December 1991 and 6 October 2016 showed that the process has always increased. In addition, climate change, through the reduction in rainfall that results in an increase in the water deficit, and through deforestation to increase the areas of livestock farming, were the factors that helped increase the size of desertified areas [2,7,18,62]. However, these authors report that the improper use of natural resources also triggers this process in various parts of the world, especially in drier environments. Leite et al. [10], in a study carried out in another DN in the semi-arid region of Brazil, also found an increase in the size of degraded areas when using the albedo and NDVI as classification criteria.
Thus, although there are methods for assessing the level of desertification of an area using satellite products (e.g., [24,25,55]), none show their association with surface biophysical data that prove the level of environmental degradation. The RisDes_Index proved to be a robust method, as its estimation based on simple satellite products exhibited a strong association with biophysical variables of areas with different land uses and degradation levels, including areas with significant processes of desertification (i.e., areas of sandy, acidic, bare soils with a high β value and high soil temperature).

5. Conclusions

This study raised the idea of proposing a method for identifying the occurrence of desertification, which was associated with in situ data, aiming to bring more assertive results about the contribution of climate change and social and economic factors to this process. The proposed RisDes_Index was able to identify areas with significant processes of desertification, having the advantage of including risk assessment, classifying other types of surfaces, and is based on associations with micrometeorological data, the physical and chemical properties of soil and the vegetation cover. Because the RisDes_Index was conceived as being based on remote sensing data, it can be applied in different areas even in the absence of sophisticated field measurements. Application of the RisDes_Index can confirm the advance of the desertification process as a result of the reduction in rainfall levels and, i.e., an increase in the water deficit, and from deforestation. It is suggested that the RisDes_Index be applied in various regions of the world with the idea of directing public policy to meet the advance of desertification.

Software Availability

Name of the software: Desertification Risk Index (RisDes_Index)
Phone: +55 64 992247907
First available: 2021
Minimum requirements: Any device with a web browsing capability
Platform: Any but with a web browsing capability
Availability through the GEE platform at:

Author Contributions

Conceptualisation, Methodology, Writing—Original Draft, Supervision, Project administration, Funding acquisition, T.G.F.d.S.; Formal analysis, Investigation, Writing—Original Draft, J.F.d.C.N.; Formal analysis, Investigation, A.M.d.R.F.J.; Formal analysis, Investigation, C.A.A.d.S.; Formal analysis, Investigation, G.d.N.A.J.; Formal analysis, Investigation, M.V.d.S.; Formal analysis, Investigation, J.L.B.d.S.; Formal analysis, Investigation, A.A.d.C.; Formal analysis, Investigation, A.A.d.A.M.; Formal analysis, Investigation, L.S.B.d.S. All authors have read and agreed to the published version of the manuscript.

Funding

Foundation for Science and Technology Development of the State of Pernambuco [APQ-0215-5.01/10, APQ-1159-1.07/14, APQ-0030-5.03/17 and IBPG-1623-5.03/16], the Coordination for the Improvement of Higher Level Personnel [Finance Code 001], the São Paulo Research Foundation (FAPESP—2023/05323-4), and the National Council for Scientific and Technological Development [309421/2018-7 and 152251/2018-9] for their financial support.

Data Availability Statement

The data presented in this study are available on request from the corresponding author.

Conflicts of Interest

The authors declare no conflicts of interest.

References

  1. Joseph, O.; Gbenga, A.E.; Langyit, D.G. Desertification Risk Analysis and Assessment in Northern Nigeria. Remote Sens. Appl. Soc. Environ. 2018, 11, 70–82. [Google Scholar] [CrossRef]
  2. Karavitis, C.A.; Tsesmelis, D.E.; Oikonomou, P.D.; Kairis, O.; Kosmas, C.; Fassouli, V.; Ritsema, C.; Hessel, R.; Jetten, V.; Moustakas, N.; et al. A Desertification Risk Assessment Decision Support Tool (DRAST). CATENA 2020, 187, 104413. [Google Scholar] [CrossRef]
  3. Li, S.; He, S.; Xu, Z.; Liu, Y.; von Bloh, W. Desertification Process and Its Effects on Vegetation Carbon Sources and Sinks Vary under Different Aridity Stress in Central Asia during 1990–2020. CATENA 2023, 221, 106767. [Google Scholar] [CrossRef]
  4. Briassoulis, H. Combating Land Degradation and Desertification: The Land-Use Planning Quandary. Land 2019, 8, 27. [Google Scholar] [CrossRef]
  5. Akbari, M.; Shalamzari, M.J.; Memarian, H.; Gholami, A. Monitoring Desertification Processes Using Ecological Indicators and Providing Management Programs in Arid Regions of Iran. Ecol. Indic. 2020, 111, 106011. [Google Scholar] [CrossRef]
  6. Rivera-Marin, D.; Dash, J.; Ogutu, B. The Use of Remote Sensing for Desertification Studies: A Review. J. Arid Environ. 2022, 206, 104829. [Google Scholar] [CrossRef]
  7. Vasconcelos Sobrinho, J. Processos de Desertificação No Nordeste Do Brasil: Sua Gênese e Sua Contenção; SEMA/SUDENE: Recife, Brazil, 1982. [Google Scholar]
  8. de Oliveira Silva, A.K.; de Barros Silva, H.P. O Processo de Desertificação e Seus Impactos Sobre Os Recursos Naturais e Sociais No Município de Cabrobó—Pernambuco—Brasil. PRACS Rev. Eletrônica Humanid. Curso Ciênc. Sociais UNIFAP 2015, 8, 203–215. [Google Scholar]
  9. Perez-Marin, A.M.; Cavalcante, A.M.B.; Medeiros, S.S.; Tinôco, L.B.M.; Salcedo, I.H. Núcleos de Desertificação No Semiárido Brasileiro: Ocorrência Natural Ou Antrópica? Parcerias Estratégicas 2012, 17, 87–106. [Google Scholar]
  10. Leite, A.C.d.S.; Bezerra, U.A.; de Oliveira, L.M.M. Behavior of the Albedd and NDVI in the Gilbués–Piauí (Brazil) Desertification Core, Using Landsat Satellite Images. Rev. Bras. Meio Ambient. 2019, 7, 19–28. [Google Scholar] [CrossRef]
  11. Yang, Z.; Gao, X.; Lei, J.; Meng, X.; Zhou, N. Analysis of Spatiotemporal Changes and Driving Factors of Desertification in the Africa Sahel. CATENA 2022, 213, 106213. [Google Scholar] [CrossRef]
  12. Shao, W.; Wang, Q.; Guan, Q.; Zhang, J.; Yang, X.; Liu, Z. Environmental Sensitivity Assessment of Land Desertification in the Hexi Corridor, China. CATENA 2023, 220, 106728. [Google Scholar] [CrossRef]
  13. Vieira, R.M.S.P.; Tomasella, J.; Alvalá, R.C.S.; Sestini, M.F.; Affonso, A.G.; Rodriguez, D.A.; Barbosa, A.A.; Cunha, A.P.M.A.; Valles, G.F.; Crepani, E.; et al. Identifying Areas Susceptible to Desertification in the Brazilian Northeast. Solid Earth 2015, 6, 347–360. [Google Scholar] [CrossRef]
  14. Ferreira, T.R.; di Pace, F.T.; da Silva, B.B.; Delgado, J.R. Identification of Desertification-Sensitive Areas in the Brazilian Northeast through Vegetation Indices. Eng. Agríc. 2017, 37, 1190–1202. [Google Scholar] [CrossRef]
  15. de Araújo, J.A.; de Souza, R.F. Abordagens Sobre o Processo de Desertificação: Uma Revisão Das Evidências No Rio Grande Do Norte. Geosul 2017, 32, 122–143. [Google Scholar] [CrossRef]
  16. Zongfan, B.; Ling, H.; Xuhai, J.; Ming, L.; Liangzhi, L.; Huiqun, L.; Jiaxin, L. Spatiotemporal Evolution of Desertification Based on Integrated Remote Sensing Indices in Duolun County, Inner Mongolia. Ecol. Inform. 2022, 70, 101750. [Google Scholar] [CrossRef]
  17. dos Santos, W.R.; Jardim, A.M.d.R.F.; de Souza, C.A.A.; de Souza, L.S.B.; da Silva, G.Í.N.; de Morais, J.E.F.; da Silva, M.J.; Alves, C.P.; Montenegro, A.A.d.A.; da Silva, T.G.F. Carbon and Nutrient Dynamics in Landscapes under Different Levels of Anthropogenic Intervention in the Semi-Arid Region of Brazil. Agric. Ecosyst. Environ. 2024, 368, 109020. [Google Scholar] [CrossRef]
  18. Oikonomou, P.D.; Tsesmelis, D.E.; Waskom, R.M.; Grigg, N.S.; Karavitis, C.A. Enhancing the Standardized Drought Vulnerability Index by Integrating Spatiotemporal Information from Satellite and in Situ Data. J. Hydrol. 2019, 569, 265–277. [Google Scholar] [CrossRef]
  19. Xue, J.; Gui, D.; Lei, J.; Sun, H.; Zeng, F.; Mao, D.; Jin, Q.; Liu, Y. Oasification: An Unable Evasive Process in Fighting against Desertification for the Sustainable Development of Arid and Semiarid Regions of China. CATENA 2019, 179, 197–209. [Google Scholar] [CrossRef]
  20. Kosmas, C.; Ferrara, A.; Briasouli, H.; Imeson, A. The Medalus Project: Mediterranean Desertification and Land Use: Manual on Key Indicators of Desertification and Mapping Environmentally Sensitive Areas to Desertification; European Communities: Luxembourg, 1999. [Google Scholar]
  21. Salvati, L.; Bajocco, S.; Ceccarelli, T.; Zitti, M.; Perini, L. Towards a Process-Based Evaluation of Land Vulnerability to Soil Degradation in Italy. Ecol. Indic. 2011, 11, 1216–1227. [Google Scholar] [CrossRef]
  22. Gad, A.; Lotfy, I. Use of Remote Sensing and GIS in Mapping the Environmental Sensitivity Areas for Desertification of Egyptian Territory. eEarth Discuss. 2008, 3, 41–85. [Google Scholar] [CrossRef]
  23. Verón, S.R.; Blanco, L.J.; Texeira, M.A.; Irisarri, J.G.N.; Paruelo, J.M. Desertification and Ecosystem Services Supply: The Case of the Arid Chaco of South America. J. Arid Environ. 2018, 159, 66–74. [Google Scholar] [CrossRef]
  24. Wei, H.; Wang, J.; Cheng, K.; Li, G.; Ochir, A.; Davaasuren, D.; Chonokhuu, S. Desertification Information Extraction Based on Feature Space Combinations on the Mongolian Plateau. Remote Sens. 2018, 10, 1614. [Google Scholar] [CrossRef]
  25. Pan, J.; Li, T. Extracting Desertification from Landsat TM Imagery Based on Spectral Mixture Analysis and Albedo-Vegetation Feature Space. Nat. Hazards 2013, 68, 915–927. [Google Scholar] [CrossRef]
  26. Soares, D.B.; Nóbrega, R.S.; Filho, F.d.O.M. Sobre o Processo de Desertificação. Rev. Bras. Geogr. Física 2011, 4, 174–188. [Google Scholar] [CrossRef]
  27. de Queiroz, M.G.; da Silva, T.G.F.; Zolnier, S.; Jardim, A.M.d.R.F.; de Souza, C.A.A.; Araújo Júnior, G.d.N.; de Morais, J.E.F.; de Souza, L.S.B. Spatial and Temporal Dynamics of Soil Moisture for Surfaces with a Change in Land Use in the Semi-Arid Region of Brazil. CATENA 2020, 188, 104457. [Google Scholar] [CrossRef]
  28. de Souza, C.A.A.; da Silva, T.G.F.; de Souza, L.S.B.; de Moura, M.S.B.; Silva, P.P.; Marin, F.R. Straw Management Effects on Sugarcane Growth, Nutrient Cycling and Water Use in the Brazilian Semiarid Region. Bragantia 2020, 79, 525–533. [Google Scholar] [CrossRef]
  29. Sun, G.; Noormets, A.; Gavazzi, M.J.; McNulty, S.G.; Chen, J.; Domec, J.C.; King, J.S.; Amatya, D.M.; Skaggs, R.W. Energy and Water Balance of Two Contrasting Loblolly Pine Plantations on the Lower Coastal Plain of North Carolina, USA. For. Ecol. Manage. 2010, 259, 1299–1310. [Google Scholar] [CrossRef]
  30. Jardim, A.M.R.F.; Morais, J.E.F.; Souza, L.S.B.d.; Souza, C.A.A.; Araújo Júnior, G.N.; Alves, C.P.; Silva, G.I.N.; Leite, R.M.C.; Moura, M.S.B.; Lima, J.L.M.P.; et al. Monitoring Energy Balance, Turbulent Flux Partitioning, Evapotranspiration and Biophysical Parameters of Nopalea Cochenillifera (Cactaceae) in the Brazilian Semi-Arid Environment. Plants 2023, 12, 2562. [Google Scholar] [CrossRef]
  31. da Silva, T.G.F.; de Moura, M.S.B.; Zolnier, S.; Soares, J.M.; de Souza, L.S.B.; Brandão, E.O. Variação Do Balanço de Radiação e de Energia Da Cana-de-Açúcar Irrigada No Semiárido Brasileiro. Rev. Bras. Eng. Agríc. Ambient. 2011, 15, 139–147. [Google Scholar] [CrossRef]
  32. da Silva, T.G.F.; de Queiroz, M.G.; Zolnier, S.; de Souza, L.S.B.; de Souza, C.A.A.; de Moura, M.S.B.; de Araújo, G.G.L.; Steidle Neto, A.J.; dos Santos, T.S.; de Melo, A.L.; et al. Soil Properties and Microclimate of Two Predominant Landscapes in the Brazilian Semiarid Region: Comparison between a Seasonally Dry Tropical Forest and a Deforested Area. Soil Tillage Res. 2021, 207, 104852. [Google Scholar] [CrossRef]
  33. EMBRAPA Empresa Brasileira de Pesquisa Agropecuária. Banco de Dados Climáticos Do Brasil. Available online: https://www.bdclima.cnpm.embrapa.br/resultados/balanco.php?uf=&cod=141 (accessed on 25 February 2023).
  34. de Melo, M.V.N.; de Oliveira, M.E.G.; de Almeida, G.L.P.; Gomes, N.F.; Montalvo Morales, K.R.; Santana, T.C.; Silva, P.C.; Moraes, A.S.; Pandorfi, H.; da Silva, M.V. Spatiotemporal Characterization of Land Cover and Degradation in the Agreste Region of Pernambuco, Brazil, Using Cloud Geoprocessing on Google Earth Engine. Remote Sens. Appl. Soc. Environ. 2022, 26, 100756. [Google Scholar] [CrossRef]
  35. Chander, G.; Markham, B. Revised Landsat-5 TM Radiometrie Calibration Procedures and Postcalibration Dynamic Ranges. IEEE Trans. Geosci. Remote Sens. 2003, 41, 2674–2677. [Google Scholar] [CrossRef]
  36. Chander, G.; Markham, B.L.; Helder, D.L. Summary of Current Radiometric Calibration Coefficients for Landsat MSS, TM, ETM+, and EO-1 ALI Sensors. Remote Sens. Environ. 2009, 113, 893–903. [Google Scholar] [CrossRef]
  37. Silva, B.B.; Braga, A.C.; Braga, C.C.; de Oliveira, L.M.M.; Montenegro, S.M.G.L.; Barbosa Junior, B. Procedures for Calculation of the Albedo with OLI-Landsat 8 Images: Application to the Brazilian Semi-Arid. Rev. Bras. Eng. Agríc. Ambient. 2016, 20, 3–8. [Google Scholar] [CrossRef]
  38. Iqbal, M. An Introduction to Solar Radiation; Academic Press: London, UK, 1983. [Google Scholar]
  39. Starks, P.J.; Norman, J.M.; Blad, B.L.; Walter-Shea, E.A.; Walthall, C.L. Estimation of Shortwave Hemispherical Reflectance (Albedo) from Bidirectionally Reflected Radiance Data. Remote Sens. Environ. 1991, 38, 123–134. [Google Scholar] [CrossRef]
  40. Silva, B.B.; Lopes, G.M.; Azevedo, P.V. Balanço de Radiação Em Áreas Irrigadas Utilizando Imagens Landsat 5—TM. Rev. Bras. Meteorol. 2005, 20, 243–252. [Google Scholar]
  41. Bastiaanssen, W.G.M.; Menenti, M.; Feddes, R.A.; Holtslag, A.A.M. A Remote Sensing Surface Energy Balance Algorithm for Land (SEBAL). 1. Formulation. J. Hydrol. 1998, 212–213, 198–212. [Google Scholar] [CrossRef]
  42. Oliveira, L.M.M.; Montenegro, S.M.G.L.; Da Silva, B.B.; De Moura, A.E.S.S. Balanço de Radiação Por Sensoriamento Remoto Em Bacia Hidrográfica Da Zona Da Mata Nordestina. Rev. Bras. Meteorol. 2015, 30, 16–28. [Google Scholar] [CrossRef]
  43. Allen, R.; Waters, R.; Bastiaanssen, W.; Tasumi, M.; Trezza, R. SEBAL (Surface Energy Balance Algorithms for Land)—Idaho Implementation, Advanced Training and Users Manual, Version 1.0; Idaho Department of Water Resources: Boise, ID, USA, 2002. [Google Scholar]
  44. Bastiaanssen, W.G.M.; Molden, D.J.; Makin, I.W. Remote Sensing for Irrigated Agriculture: Examples from Research and Possible Applications. Agric. Water Manag. 2000, 46, 137–155. [Google Scholar] [CrossRef]
  45. ASCE-EWRI. The ASCE Standardized Reference Evapotranspiration Equation; Allen, R.G., Walter, I.A., Elliott, R.L., Howell, T.A., Itenfisu, D., Jensen, M.E., Snyder, R.L., Eds.; American Society of Civil Engineers: Reston, VA, USA, 2005; ISBN 9780784408056. [Google Scholar]
  46. Allen, R.G.; Tasumi, M.; Trezza, R. Satellite-Based Energy Balance for Mapping Evapotranspiration with Internalized Calibration (METRIC)—Model. J. Irrig. Drain. Eng. 2007, 133, 380–394. [Google Scholar] [CrossRef]
  47. Li, X.; Lei, S.; Cheng, W.; Liu, F.; Wang, W. Spatio-Temporal Dynamics of Vegetation in Jungar Banner of China during 2000–2017. J. Arid Land 2019, 11, 837–854. [Google Scholar] [CrossRef]
  48. Huete, A.R. A Soil-Adjusted Vegetation Index (SAVI). Remote Sens. Environ. 1988, 25, 295–309. [Google Scholar] [CrossRef]
  49. Accioly, L.J.d.O.; Pachêco, A.; Costa, T.C.e.C.d.; Lopes, O.F.; Oliveira, M.A.J.d. Relações Empíricas Entre a Estrutura Da Vegetação e Dados Do Sensor TM/LANDSAT. Rev. Bras. Eng. Agríc. Ambient. 2002, 6, 492–498. [Google Scholar] [CrossRef]
  50. Boegh, E.; Soegaard, H.; Thomsen, A. Evaluating Evapotranspiration Rates and Surface Conditions Using Landsat TM to Estimate Atmospheric Resistance and Surface Resistance. Remote Sens. Environ. 2002, 79, 329–343. [Google Scholar] [CrossRef]
  51. Silva, H.P.; Ribeiro, M.R.; de Luna Galindo, I.C.; Bezerra da Silva, H.D.; de Melo, A.L. Utilização de Técnicas de Sensoriamento Remoto Na Identificação de Áreas Sob Risco de Desertificação No Estado de Pernambuco. In Proceedings of the XV Simpósio Brasileiro de Sensoriamento Remoto—SBSR, Curitiba, PR, Brasil, 30 April–5 May 2011; Universidade Federal de Roraima: Curitiba, Brazil, 2011; pp. 9144–9151. [Google Scholar]
  52. Xiao, J.; Shen, Y.; Tateishi, R.; Bayaer, W. Development of Topsoil Grain Size Index for Monitoring Desertification in Arid Land Using Remote Sensing. Int. J. Remote Sens. 2006, 27, 2411–2422. [Google Scholar] [CrossRef]
  53. Rikimaru, A.; Roy, P.; Miyatake, S. Tropical Forest Cover Density Mapping. Trop. Ecol. 2002, 43, 39–47. [Google Scholar]
  54. Jardim, A.M.d.R.F.; da Silva, M.V.; Silva, A.R.; dos Santos, A.; Pandorfi, H.; de Oliveira-Júnior, J.F.; de Lima, J.L.M.P.; de Souza, L.S.B.; Araújo Júnior, G.d.N.; Lopes, P.M.O.; et al. Spatiotemporal Climatic Analysis in Pernambuco State, Northeast Brazil. J. Atmos. Solar-Terrestrial Phys. 2021, 223, 105733. [Google Scholar] [CrossRef]
  55. Xu, D.; Kang, X.; Qiu, D.; Zhuang, D.; Pan, J. Quantitative Assessment of Desertification Using Landsat Data on a Regional Scale—A Case Study in the Ordos Plateau, China. Sensors 2009, 9, 1738–1753. [Google Scholar] [CrossRef]
  56. Allen, R.G.; Pereira, L.S.; Raes, D.; Smith, M. Crop Evapotranspiration: Guidelines for Computing Crop Water Requirements; FAO Irrigation and Drainage Paper 56; FAO: Rome, Italy, 1998; Volume 56, ISBN 9251042195. [Google Scholar]
  57. Wu, Z.; Lei, S.; Bian, Z.; Huang, J.; Zhang, Y. Study of the Desertification Index Based on the Albedo-MSAVI Feature Space for Semi-Arid Steppe Region. Environ. Earth Sci. 2019, 78, 232. [Google Scholar] [CrossRef]
  58. Wang, J.; Ding, J.; Yu, D.; Teng, D.; He, B.; Chen, X.; Ge, X.; Zhang, Z.; Wang, Y.; Yang, X.; et al. Machine Learning-Based Detection of Soil Salinity in an Arid Desert Region, Northwest China: A Comparison between Landsat-8 OLI and Sentinel-2 MSI. Sci. Total Environ. 2020, 707, 136092. [Google Scholar] [CrossRef]
  59. Lamchin, M.; Lee, W.K.; Jeon, S.W.; Lee, J.Y.; Song, C.; Piao, D.; Lim, C.H.; Khaulenbek, A.; Navaandorj, I. Correlation between Desertification and Environmental Variables Using Remote Sensing Techniques in Hogno Khaan, Mongolia. Sustainability 2017, 9, 581. [Google Scholar] [CrossRef]
  60. da Silva, J.N.B.; da Silva, J.L.B.; dos Santos, A.M.; da Silva, A.C.; Galvíncio, J.D. Índice de Vegetação Como Subsídio Na Identificação de Áreas Com Potenciais a Desertificação. J. Environ. Anal. Prog. 2017, 2, 358–367. [Google Scholar] [CrossRef]
  61. Jiang, M.; Lin, Y. Desertification in the South Junggar Basin, 2000–2009: Part II. Model Development and Trend Analysis. Adv. Sp. Res. 2018, 62, 16–29. [Google Scholar] [CrossRef]
  62. Prăvălie, R.; Patriche, C.; Săvulescu, I.; Sîrodoev, I.; Bandoc, G.; Sfîcă, L. Spatial Assessment of Land Sensitivity to Degradation across Romania. A Quantitative Approach Based on the Modified MEDALUS Methodology. CATENA 2020, 187, 104407. [Google Scholar] [CrossRef]
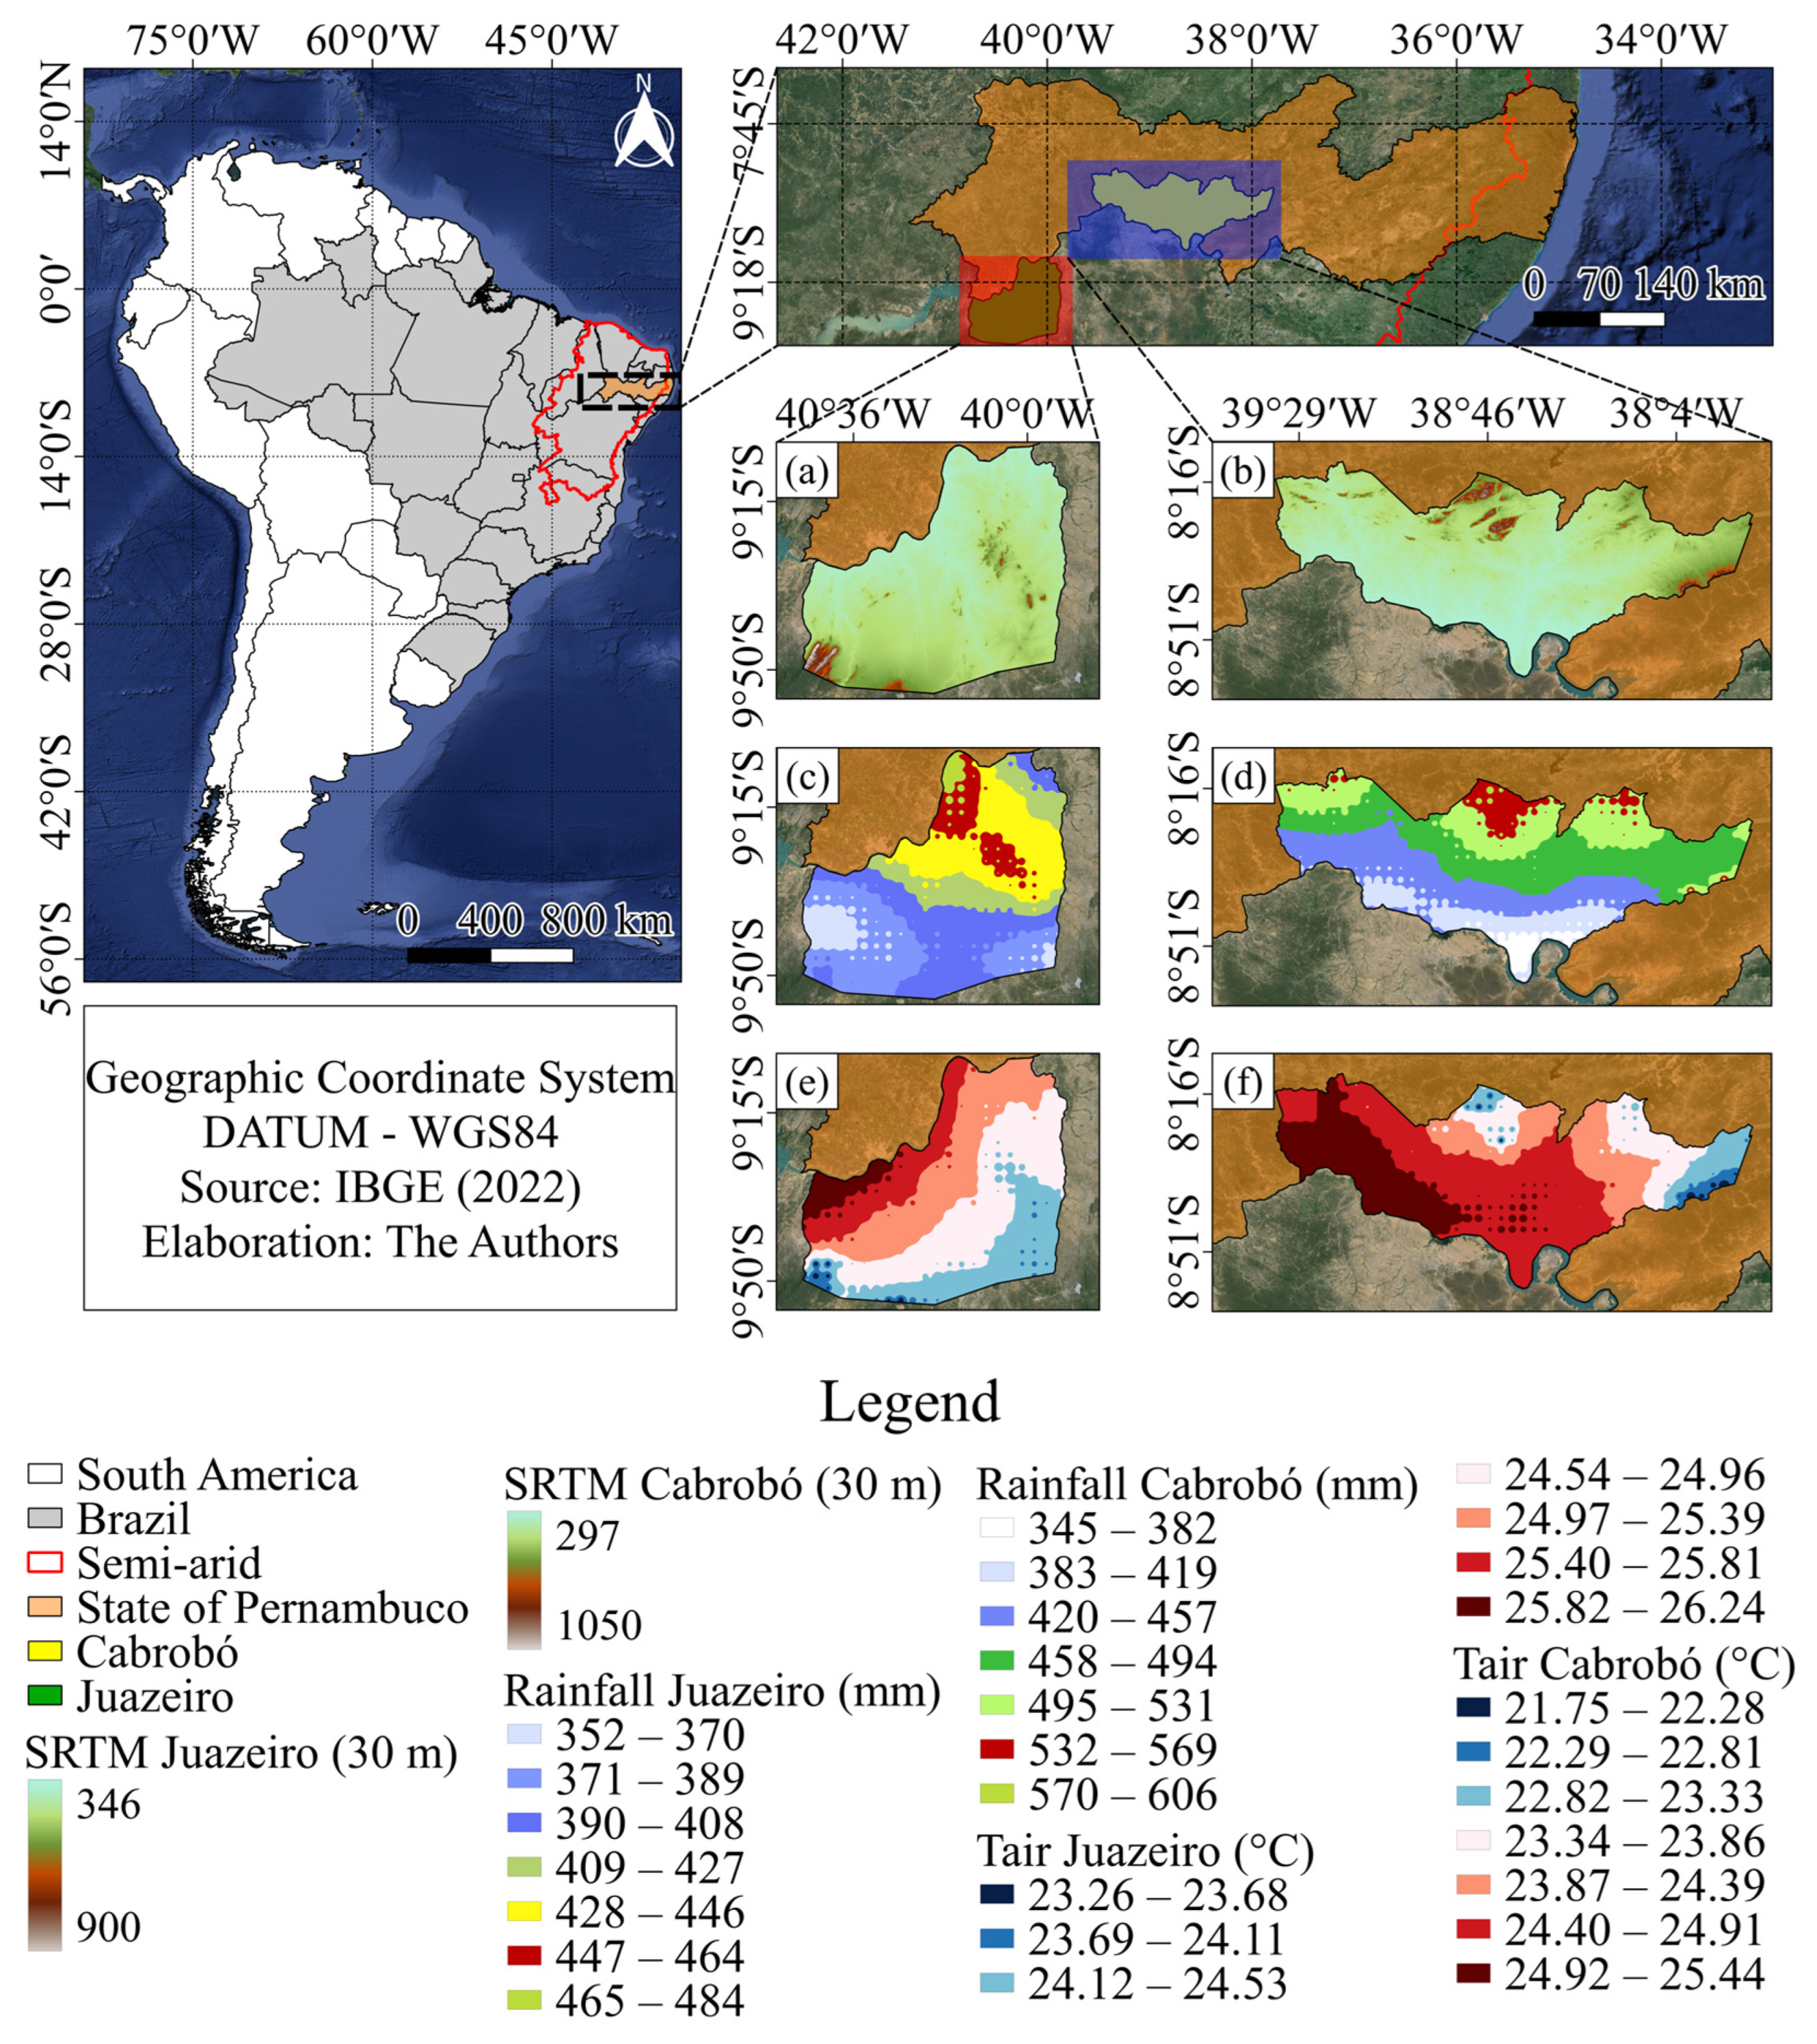
Figure 1. Spatial locations of the districts of Floresta in the state of Pernambuco and Juazeiro in the state of Bahia, Brazil, where the in situ data were collected. SRTM is the Shuttle Radar Topography Mission, and Tair is the air temperature. (a,b)—digital elevation from STRM, (c,d)—annual rainfall, and (e,f)—air temperature.
Agriengineering 06 00066 g001
Figure 2. Location of the experimental areas (a,e) of Caatinga (CAA, (b)) and cactus (CAC, (c)), an area under desertification (DES, (d)) in the district of Floresta, Pernambuco, and an area of sugarcane with a ground cover of straw (CANEWS, (f)) and with no ground cover (CANENS, (g)) in the district of Juazeiro, Bahia, Brazil.
Agriengineering 06 00066 g002
Figure 3. Flowchart of image processing and product generation using Landsat 5/TM and Landsat 8/OLI images (Grey levels—DN; Leaf Area Index—LAI; Soil-Adjusted Vegetation Index—SAVI; Normalised Difference Vegetation Index—NDVI; Surface Albedo).
Agriengineering 06 00066 g003
Figure 4. Boxplot of the variables from satellite images and in situ data ((a). Topsoil Grain Size Index—TGSI; (b). BSI—bare soil; (c). NDSI—normalised difference salinity index; (d). NDVI—Normalised Difference Vegetation Index; (e). LAI—Leaf area index; (f). SAVI—Soil-Adjusted Vegetation Index; (g). αsup —surface albedo; (h). Tsoil—soil temperature; (i). Rn—net radiation; (j). LE—latent soil heat flux; (k). Bowen—Bowen ratio; and (l). RisDes_Index—proposed model) for the areas under study (desertified area—DES, area of CAM plants—CAC, Caatinga—CAA, irrigated sugarcane with straw—CANEWS, and irrigated sugarcane with no straw—CANENS).
Agriengineering 06 00066 g004
Figure 5. (a) Multivariate principal component analysis of the in situ data (Electrical Conductivity—EC, pH, Calcium—Ca, Organic matter—OM, Phosphorus—P, Potassium—K, Sodium—NA, Carbon—C, Magnesium—Mg, Base Saturation—V, sum of bases—SB, Cation Exchange Capacity—CEC, Copper—Cu, Iron—Fe, organic matter—OM, Field Capacity—FC, Wilting Point—WP, Particle Density—PD, Bulk Density—BD, Clay, Silt, Sand, total porosity—TP, Tsoil—soil temperature, RisDes_Index—proposed model, Rn—net radiation, LE—latent soil heat flux, and β—Bowen ratio) and the orbital products (Leaf Area Index—LAI, Soil Adjusted Vegetation Index—SAVI, Normalised Difference Vegetation Index—NDVI, Surface Albedo, Bare Soil—BSI, Topsoil Grain Size Index—TGSI, and Normalised Difference Salinity Index—NDSI) (b) for five experimental areas: Caatinga (CAA), cactus (CAC), an area under desertification (DES), an area of sugarcane with a ground cover of straw (CANEWS) and an area of sugarcane with no ground cover (CANENS).
Agriengineering 06 00066 g005
Figure 6. Variation in the values of the RisDes_Index model for the desertified area—DES, for the area of CAM plants—CAC, areas of Caatinga—CAA, irrigated sugarcane with straw—CANEWS, and irrigated sugarcane with no straw—CANENS) from 2015 to 2018.
Agriengineering 06 00066 g006
Figure 7. Spatio-temporal analysis of the vegetation indices for the desertification nucleus of Cabrobó, Pernambuco, Brazil (surface albedo, Leaf Area Index—LAI, Normalised Difference Vegetation Index—NDVI, Soil Adjusted Vegetation Index—SAVI, Bare Soil Index—BSI, Topsoil Grain Size Index—TGSI, and Normalised Difference Salinity Index—NDSI) for 5 December 1991, 14 November 2001, 20 November 2009 and 6 October 2016).
Agriengineering 06 00066 g007
Figure 8. Spatial-temporal analysis of the RisDes_Index (RDI) model for the desertification nucleus of Cabrobó, Pernambuco, Brazil for 5 December 1991, 14 November 2001, 20 November 2009 and 6 October 2016.
Agriengineering 06 00066 g008
Figure 9. Multivariate principal component analysis of environmental (R—rainfall) and socio-economic variables (AreasDesert—desertified areas; PopAnimal—animal population; GDP—gross domestic product; AreasCAA—areas of Caatinga; Wetlands—wet areas; AreasPlant.—planted areas, W—water balance, 1991—5 December 1991, 2001—14 November 2001, 2009—20 November 2009 and 2016—6 October 2016) for the desertification nucleus of Cabrobó, Pernambuco, Brazil.
Agriengineering 06 00066 g009
Table 1. Characteristics of the Landsat 5/TM and Landsat 8/OLI satellites.
LandsatSensorMultispectral BandSpectral ResolutionSpatial ResolutionTemporal ResolutionImaged AreaRadiometric Resolution
5TM
(Thematic Mapper)
Band 1—
Visible (Blue)
0.45–0.52 µm30 m16 days185 km8 bits
Band 2—
Visible (Green)
0.52–0.60 µm
Band 3—
Visible (Red)
0.63–069 µm
Band 4—
Near-Infrared (NIR)
0.76–0.90 µm
Band 5—
Short-Wave Infrared (SWIR)
1.55–1.75 µm
Band 6—
Thermal
10.4–12.5 µm120 m
Band 7—
Mid-Infrared (MIR)
2.08–2.35 µm30 m
8OLI (Operational Land Imager)Band 1—
Coastal/Aerosol
0.43–0.45 µm30 m16 days185 km12 bits
Band 2—
Visible (Blue)
0.45–0.51 µm
Band 3—
Visible (Green)
0.53–0.59 µm
Band 4—
Visible (Red)
0.64–0.67 µm
Band 5—
Near-Infrared (NIR)
0.85–0.88 µm
Band 6—
Short-Wave Infrared (SWIR 1)
1.57–1.65 µm
Band 7—
Short-Wave Infrared (SWIR 2)
2.11–2.29 µm
Band 8—
Panchromatic (PAN)
0.50–0.68 µm15 m
Band 9—
Cirrus
1.36–1.39 µm30 m
Table 2. Dates of the collected images for the Landsat 8/OLI and Landsat 5/TM satellites. * Images used for the application of the RisDes_Index model for intercomparison between methods and to evaluate the evolution of the desertification process in the DN of Cabrobó.
Landsat 8/OLIImage1234
Date1 January 201515 April 20152 September 20154 October 2015
Image5678
Date20 October 201521 November 20157 December 20152 May 2016
Image9101112
Date20 September 20166 October 2016 *23 November 201624 December 2016
Image13141516
Date18 May 20176 March 201710 October 201723 December 2017
Image1718
Data22 June 20188 July 2018
Landsat 5/TMImage123
Date5 December 1991 *4 November 2001 *20 November 2009 *
Table 3. Value classes of the RisDes_Index.
IntervalClass
0.0 < RisDes_Index ≤ 0.33High level of desertificationDesertification
0.33 < RisDes_Index ≤ 0.66Medium level of desertification
0.66 < RisDes_Index ≤ 1.0Low level of desertification
1.0 < RisDes_Index ≤ 3.0With some risk of desertification
3.0 < RisDes_Index ≤ 6.0No risk
RisDes_Index > 6.0No risk
Table 4. Intercomparison between the RisDes_Index and the models by Wei et al. [24], Xu et al. [55] and Pan and Li [25] expressed as a % of desertified areas (DA), sparse Caatinga (SC), dense Caatinga (DC) and wetlands (WL).
RisDes_IndexWei et al. [24]
YearDA SC DC WL DA SC DC WL
19903740220132382802
20013539240233392602
20093732290235342902
20164328280140392001
Xu et al. [55]Pan and Li [25]
AnoDA SC DC WL DA SC DC WL
19903436300028403200
20013337280231392802
20093932270230392902
20164035250036392500
Disclaimer/Publisher’s Note: The statements, opinions and data contained in all publications are solely those of the individual author(s) and contributor(s) and not of MDPI and/or the editor(s). MDPI and/or the editor(s) disclaim responsibility for any injury to people or property resulting from any ideas, methods, instructions or products referred to in the content.