
Validation of Criteria for Predicting Tractor Fuel Consumption and CO2 Emissions When Ploughing Fields of Different Shapes and Dimensions


Abstract
:1. Introduction
2. Materials and Methods
2.1. Equipment and Experimental Procedure
2.2. Data Collection and Calculations
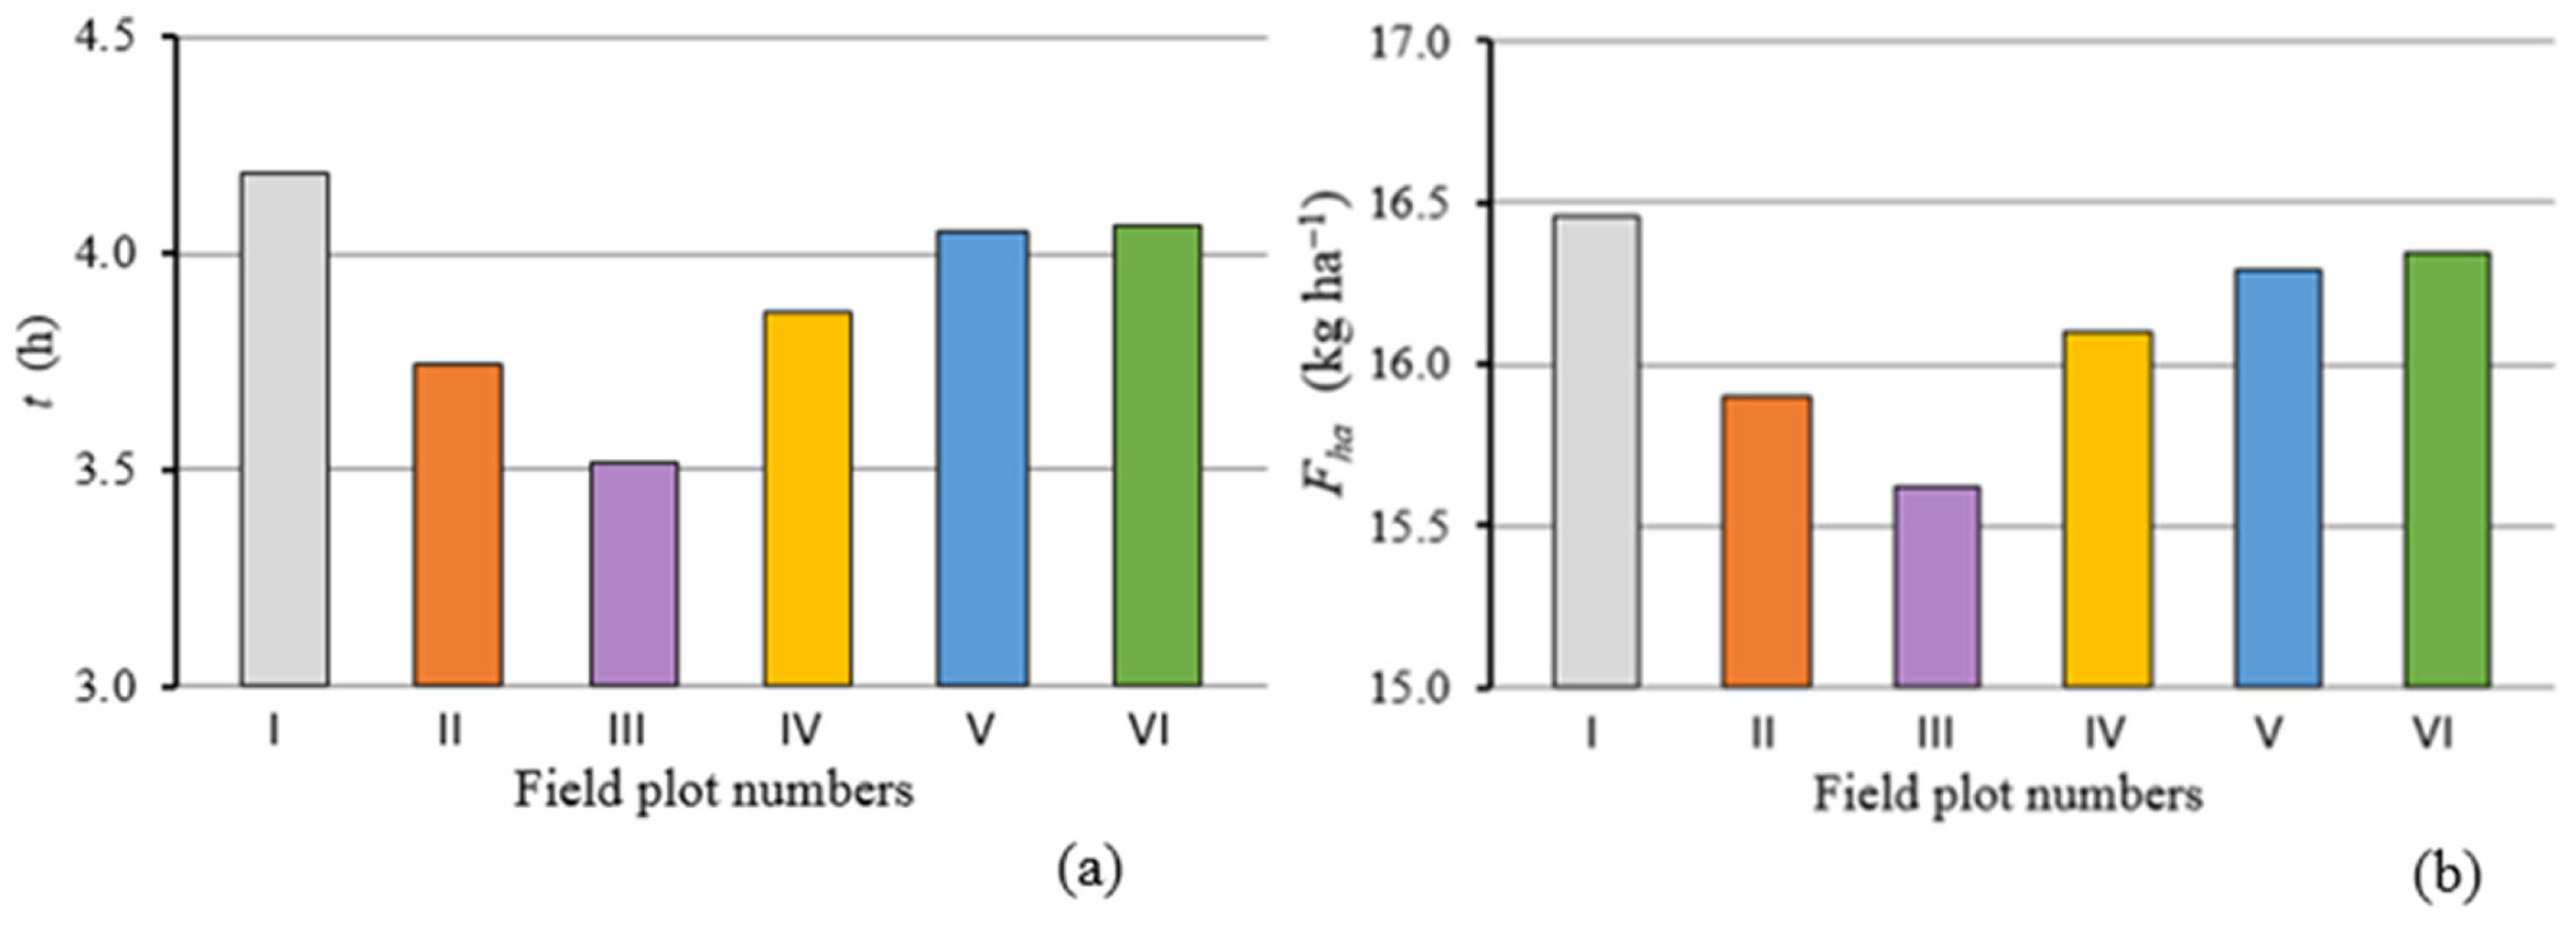
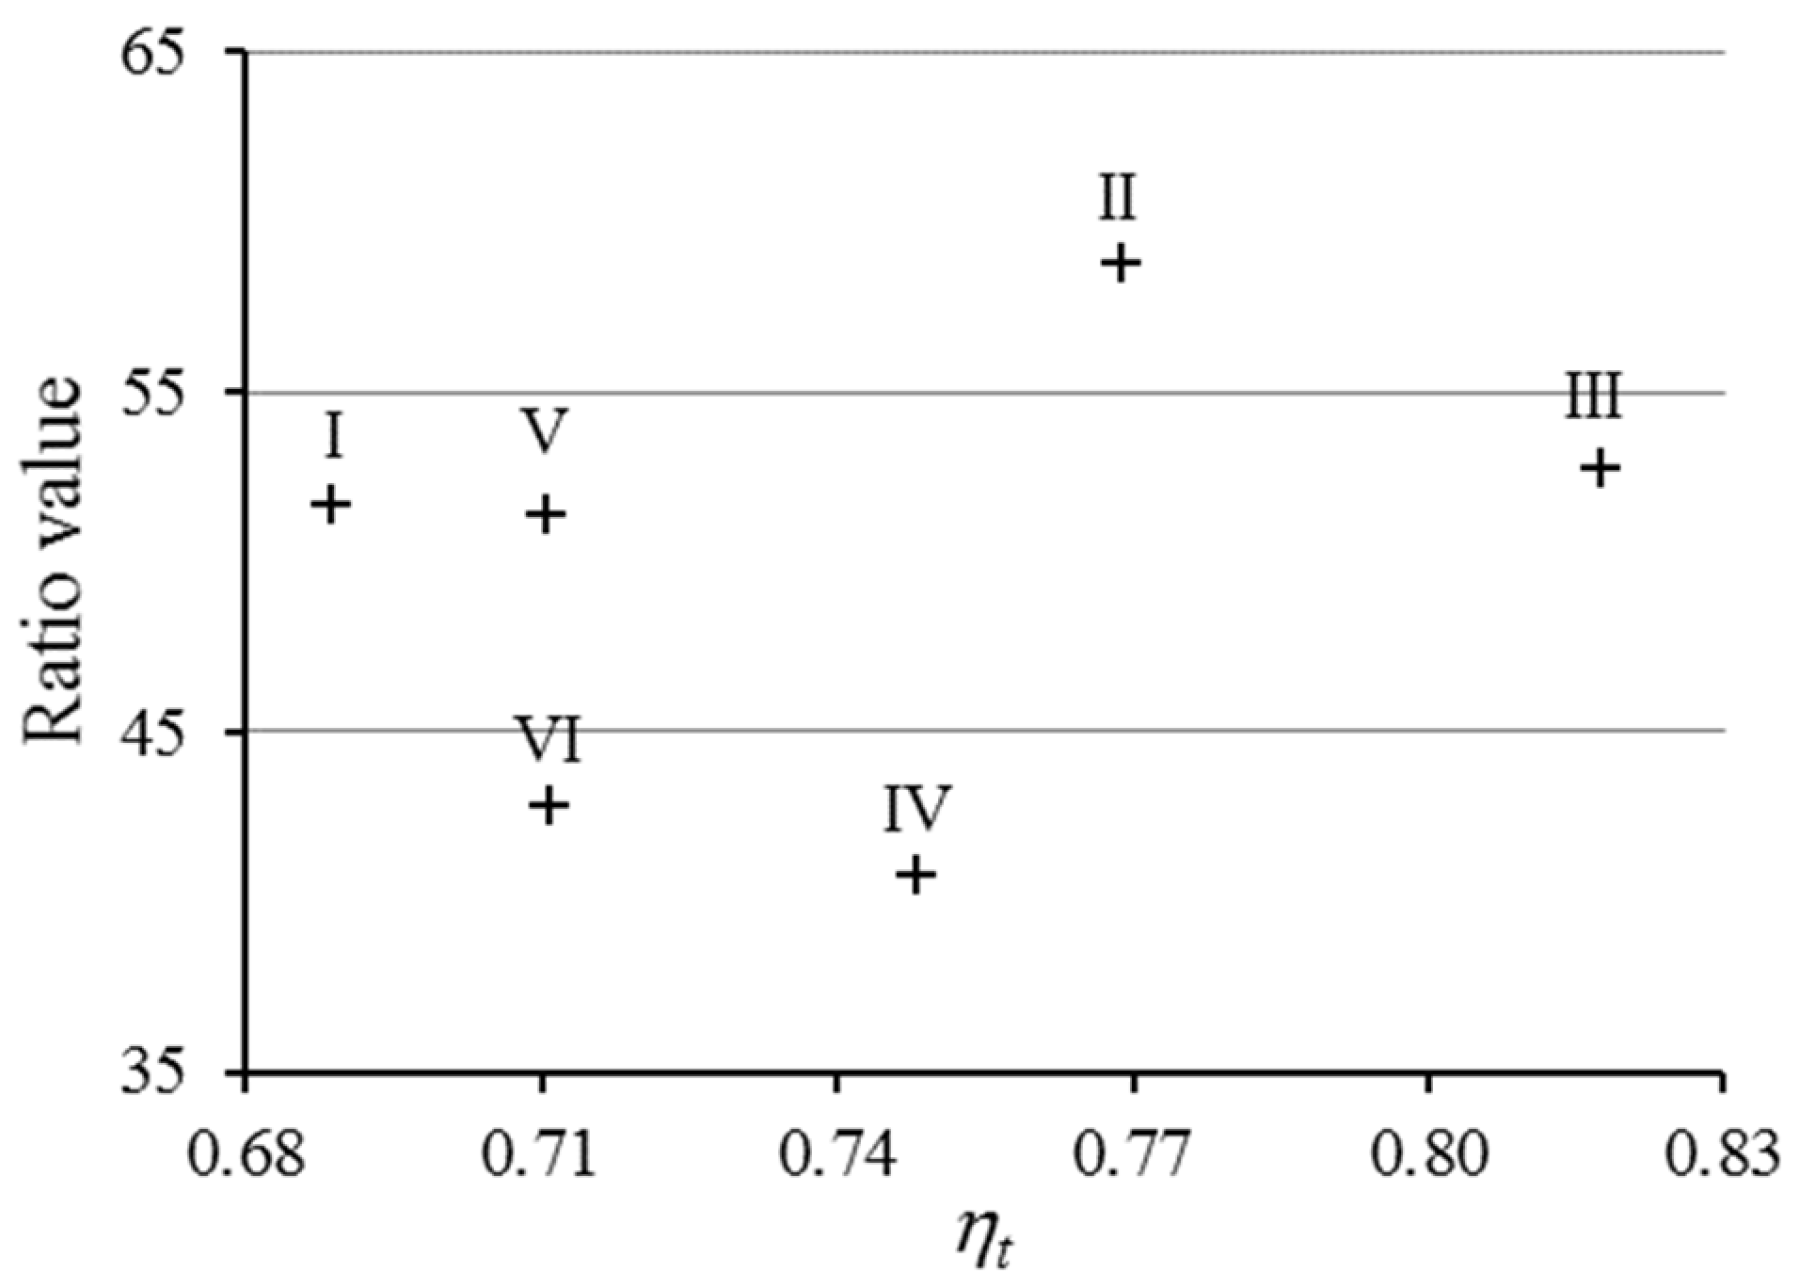
3. Results and Discussion
4. Conclusions
Author Contributions
Funding
Institutional Review Board Statement
Informed Consent Statement
Data Availability Statement
Acknowledgments
Conflicts of Interest
References
- Varani, M.; Mattetti, M.; Molari, G.; Biglia, A.; Comba, L. Correlation between power harrow energy demand and tilled soil aggregate dimensions. Biosyst. Eng. 2023, 225, 54–68. [Google Scholar] [CrossRef]
- Lee, J.W.; Kim, J.S.; Kim, K.U. Computer simulations to maximise fuel efficiency and work performance of agricultural tractors in rotovating and ploughing operations. Biosyst. Eng. 2016, 142, 1–11. [Google Scholar] [CrossRef]
- Lovarelli, D.; Bacenetti, J.; Fiala, M. Effect of local conditions and machinery characteristics on the environmental impacts of primary soil tillage. J. Clean. Prod. 2017, 140, 479–491. [Google Scholar] [CrossRef]
- Moitzi, G.; Haas, M.; Wagentristl, H.; Boxberger, J.; Gronauer, A. Energy consumption in cultivating and ploughing with traction improvement system and consideration of the rear furrow wheel-load in ploughing. Soil Tillage Res. 2013, 134, 56–60. [Google Scholar] [CrossRef]
- Bacenetti, J.; Lovarelli, D.; Facchinetti, D. An environmental comparison of techniques to reduce pollutants emissions related to agricultural tractors. Biosyst. Eng. 2018, 171, 30–40. [Google Scholar] [CrossRef]
- Janulevičius, A.; Damanauskas, V. Prediction of tractor drive tire slippage under different inflation pressures. J. Terramechanics 2022, 101, 23–31. [Google Scholar] [CrossRef]
- Lacour, S.; Burgun, C.; Perilhon, C.; Descombes, G.; Doyen, V. A model to assess tractor operational efficiency from bench test data. J. Terramechanics 2014, 54, 1–18. [Google Scholar] [CrossRef]
- Abdullah Al-Amin, A.K.M.; Lowenberg DeBoer, J.; Franklin, K.; Behrendt, K. Economics of field size for autonomous crop machines. In Proceedings of the 15th International Conference on Precision Agriculture, Minneapolis, MN, USA, 26–29 June 2022; pp. 1–15. [Google Scholar]
- Guerrieri, M.; Fedrizzi, M.; Antonucci, F.; Pallottino, F.; Sperandio, G.; Pagano, M.; Figorilli, S.; Menesatti, P.; Costa, C. An innovative multivariate tool for fuel consumption and costs estimation of agricultural operations. Span. J. Agric. Res. 2016, 14, e0209. [Google Scholar] [CrossRef]
- Paris, B.; Vandorou, F.; Balafoutis, A.T.; Vaiopoulos, K.; Kyriakarakos, G.; Manolakos, D.; George Papadakis, G. Energy use in open-field agriculture in the EU: A critical review recommending energy efficiency measures and renewable energy sources adoption. Renew. Sustain. Energy Rev. 2022, 158, 112098. [Google Scholar] [CrossRef]
- Lowenberg-DeBoer, J.; Franklin, K.; Behrendt, K.; Godwin, R. Economics of autonomous equipment for arable farms. Precis. Agric. 2021, 22, 1992–2006. [Google Scholar] [CrossRef]
- Clough, Y.; Kirchweger, S.; Kantelhardt, J. Field sizes and the future of farmland biodiversity in European landscapes. Conserv. Lett. 2020, 13, e12752. [Google Scholar] [CrossRef] [PubMed]
- Martin, E.A.; Dainese, M.; Clough, Y.; Baldi, A.; Bommarco, R.; Gagic, V.; Steffan-Dewenter, I. The interplay of landscape composition and configuration: New pathways to manage functional biodiversity and agroecosystem services across Europe. Ecol. Lett. 2019, 22, 1083–1094. [Google Scholar] [CrossRef] [PubMed]
- Latruffe, L.; Piet, L. Does land fragmentation affect farm performance? A case study from Brittany, France. Agric. Syst. 2014, 129, 68–80. [Google Scholar] [CrossRef]
- Han, X.; Kim, H.-J.; Jeon, C.W.; Kim, J.H. Study to Develop Implement Control and Headland Turning Algorithms for Autonomous Tillage Operations. J. Biosyst. Eng. 2019, 44, 245–257. [Google Scholar] [CrossRef]
- Varani, M.; Perez Estevez, M.A.; Renzi, M.; Alberti, L.; Mattetti, M. Controlling idling: A ready-made solution for reducing exhaust emissions from agricultural tractors. Biosyst. Eng. 2022, 221, 283–292. [Google Scholar] [CrossRef]
- Bulgakov, V.; Ivanovs, S.; Adamchuk, V.; Nadykto, V. Theoretical investigation of turning ability of machine and tractor aggregate on basis of ploughing and intertilling wheeled tractor. Eng. Rural Dev. 2016, 1077–1084. [Google Scholar]
- Bulgakov, V.; Pascuzzi, S.; Adamchuk, V.; Nadykto, V.; Ivanovs, S.; Aboltins Kaletnik, A.H.; Santoro, F.; Vicino, F.; Nowak, J. Theoretical study of the trajectory of movement of a ploughing aggregate with a reversible plough on the headlands. In Proceedings of the International Symposium on Farm Machinery and Processes Management in Sustainable Agriculture 2022; Lecture Notes in Civil Engineering; Springer: Cham, Switzerland, 2022; Volume 289, pp. 27–35. [Google Scholar] [CrossRef]
- Fedrizzi, M.; Antonucci, F.; Sperandio, G.; Figorilli, S.; Pallottino, F.; Costa, C. An artificial neural network model to predict the effective work time of different agricultural field shapes. Span. J. Agric. Res. 2019, 17, e0201. [Google Scholar] [CrossRef]
- Seyyedhasani, H.; Dvorak, J.S. Reducing field work time using fleet routing optimization. Biosyst. Eng. 2018, 169, 1–10. [Google Scholar] [CrossRef]
- Gołasa, P.; Wysokinski, M.; Bienkowska-Gołasa, W.; Gradziuk, P.; Golonko, M.; Gradziuk, B.; Siedlecka, A.; Gromada, A. Sources of Greenhouse Gas Emissions in Agriculture, with Particular Emphasis on Emissions from Energy Used. Energies 2021, 14, 3784. [Google Scholar] [CrossRef]
- Janulevičius, A.; Damanauskas, V. Validation of relationships between tractor performance indicators, engine control unit data and field dimensions during tillage. Mech. Syst. Signal Process. 2023, 191, 110201. [Google Scholar] [CrossRef]
- Janulevičius, A.; Šarauskis, E.; Čiplienė, A.; Juostas, A. Estimation of farm tractor performance as a function of time efficiency during ploughing in fields of different sizes. Biosyst. Eng. 2019, 179, 80–93. [Google Scholar] [CrossRef]
- Bochtis, D.D.; Vougioukas, S.G. Minimising the non-working distance travelled by machines operating in a headland field pattern. Biosyst. Eng. 2008, 101, 1–12. [Google Scholar] [CrossRef]
- Tu, X.; Tang, L. Headland turning optimisation for agricultural vehicles and those with towed implements. J. Agric. Food Res. 2019, 1, 100009. [Google Scholar] [CrossRef]
- ASABE ASAE S313.3; Soil Cone Penetrometer. American Society of Agricultural and Biological Engineers: St. Joseph, MI, USA, 2004.
- ASAE EP496.3; Agricultural Machinery Management. American Society of Agricultural and Biological Engineers: St. Joseph, MI, USA, 2006; pp. 384–390.
- Abdullah Al-Amin, A.K.M.; Lowenberg DeBoer, J.; Franklin, K.; Behrendt, K. Economics of field size and shape for autonomous crop machines. Precis. Agric. 2023, 24, 1738–1765. [Google Scholar] [CrossRef]
- Exhaust and Crankcase Emission Factors for Nonroad Engine Modeling: Compression-Ignition; EPA-420-R-10-018, NR-009d; US Environmental Protection Agency: Washington, DC, USA, 2010.
- Janulevičius, A.; Čiplienė, A. Estimation of engine CO2 and NOx emissions and their correlation with the not-to-exceed zone for a tractor ploughing fields of various sizes. J. Clean. Prod. 2018, 198, 1583–1592. [Google Scholar] [CrossRef]
- Pishgar-Komleh, S.H.; Ghahderijani, M.; Sefeedpari, P. Energy consumption and CO2 emissions analysis of potato production based on different farm size levels in Iran. J. Clean. Prod. 2012, 33, 183–191. [Google Scholar] [CrossRef]
- Shin, C.S.; Kim, K.U. CO2 Emissions by Agricultural Machines in South Korea. Appl. Eng. Agric. 2018, 34, 311–315. [Google Scholar] [CrossRef]
- Janulevičius, A.; Juostas, A.; Čiplienė, A. Estimation of carbon-oxide emissions of tractors during operation and correlation with the not-to-exceed zone. Biosyst. Eng. 2016, 147, 117–129. [Google Scholar] [CrossRef]
- API Compendium of Greenhouse Gas Emissions Methodologies for the Natural Gas and Oil Industry; American Petroleum Institute: Washington, DC, USA, 2021; p. 20001.
- Filipovic, D.; Kosutic, S.; Gospodaric, Z.; Zimmer, R.; Banaj, D. The possibilities of fuel savings and the reduction of CO2 emissions in the soil tillage in Croatia. Agric. Ecosyst. Environ. 2006, 115, 290–294. [Google Scholar] [CrossRef]
- Šarauskis, E.; Vaitauskienė, K.; Romaneckas, K.; Jasinskas, A.; Butkus, V.; Kriaučiūnienė, Z. Fuel consumption and CO2 emission analysis in different strip tillage scenarios. Energy 2017, 118, 957–968. [Google Scholar] [CrossRef]
- Ettl, J.; Bernhardt, H.; Pickel, P.; Remmele, E.; Thuneke, K.; Emberger, P. Transfer of agricultural work operation profiles to a tractor test stand for exhaust emission evaluation. Biosyst. Eng. 2018, 176, 185–197. [Google Scholar] [CrossRef]
- Soysal, A.; Ozturk, H.H. Energy Saving Measures for Soil Tillage. Eur. J. Agric. Food Sci. 2023, 5, 590. [Google Scholar] [CrossRef]


| Criterion | Basic Data | Unit |
|---|---|---|
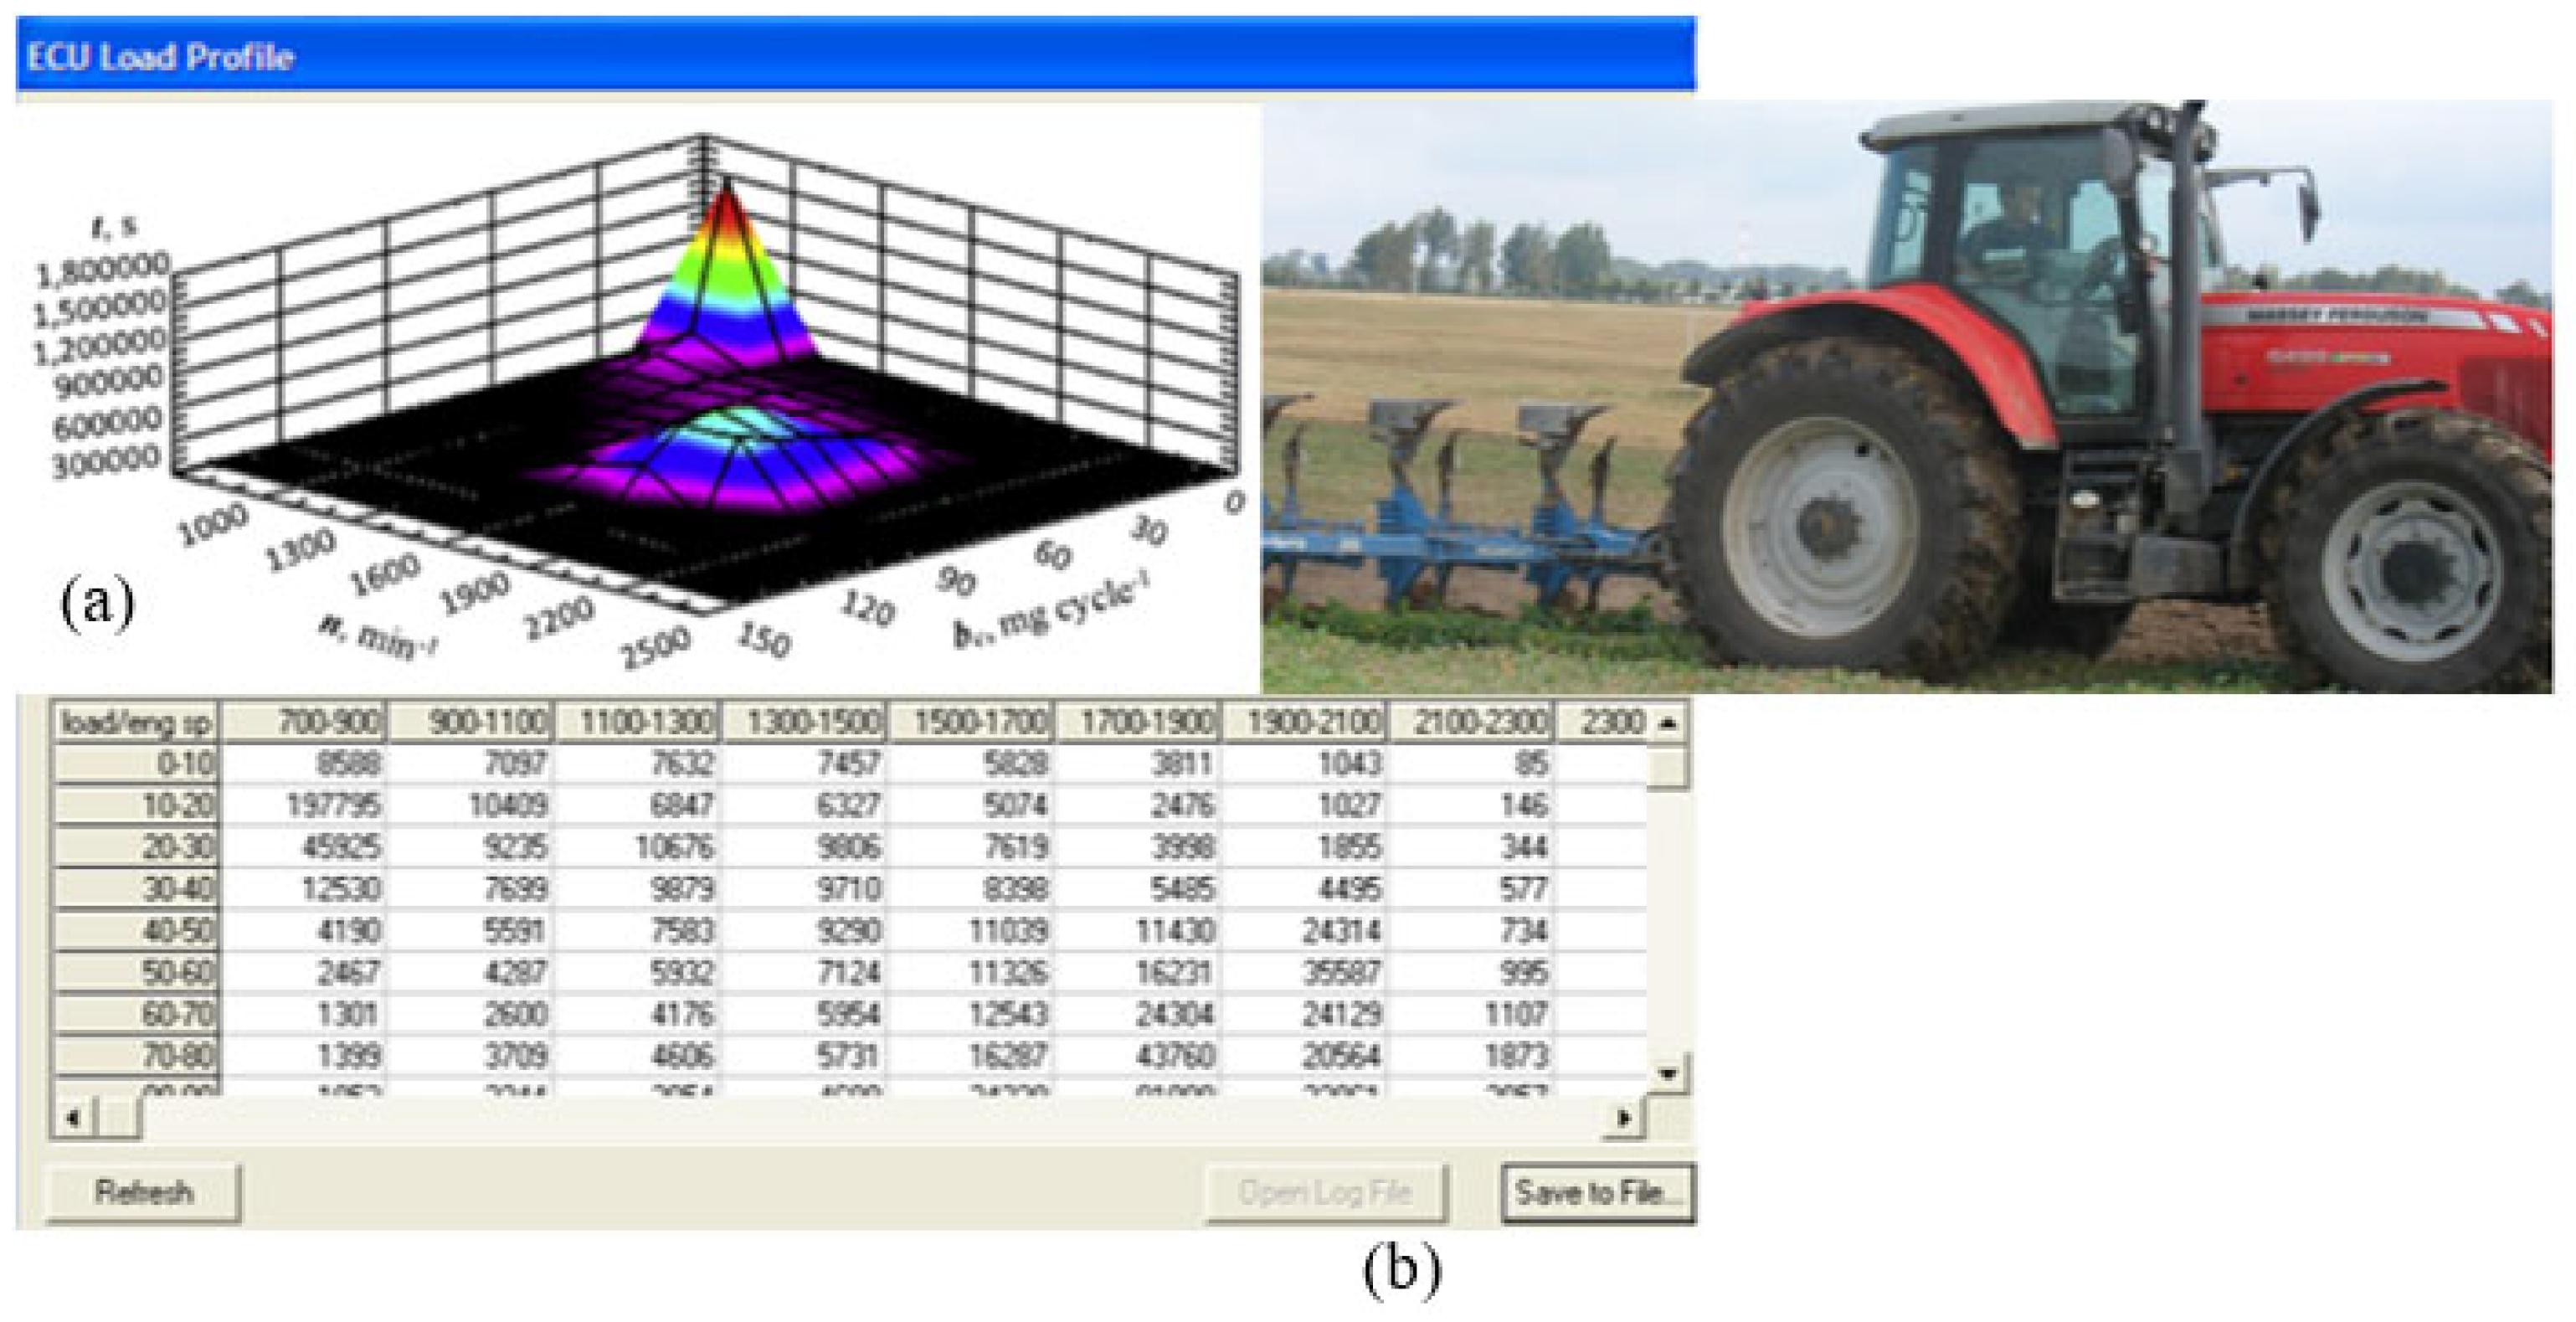
| Engine | Sisu Diesel 74 CTA, 6-cylinder, in-line, liquid-cooled, turbocharged intercooled diesel | − |
| Fuel supply system | Common rail, high-pressure system | − |
| Emissions standard | Tier 3 (Intermediate) | − |
| Rated RPM | 2200 | min−1 |
| Power (gross) | 160.3 | kW |
| Torque (maximum) | 950 (at 1450 min−1) | Nm |
| Transmission | Six power shift gears in four speed ranges | − |
| Gears | 24 forward and reverse | − |
| Tires standard | 14.9 R 30 (front tires) 18.4 R 42 (rear tires) | − − |
| Weight: Operating Ballasted | 7919 10,850 | kg kg |
| Rear lift | 7121 | kg |
| Parameters | Test Field Plot Numbers | |||||
|---|---|---|---|---|---|---|
| I | II | III | IV | V | VI | |
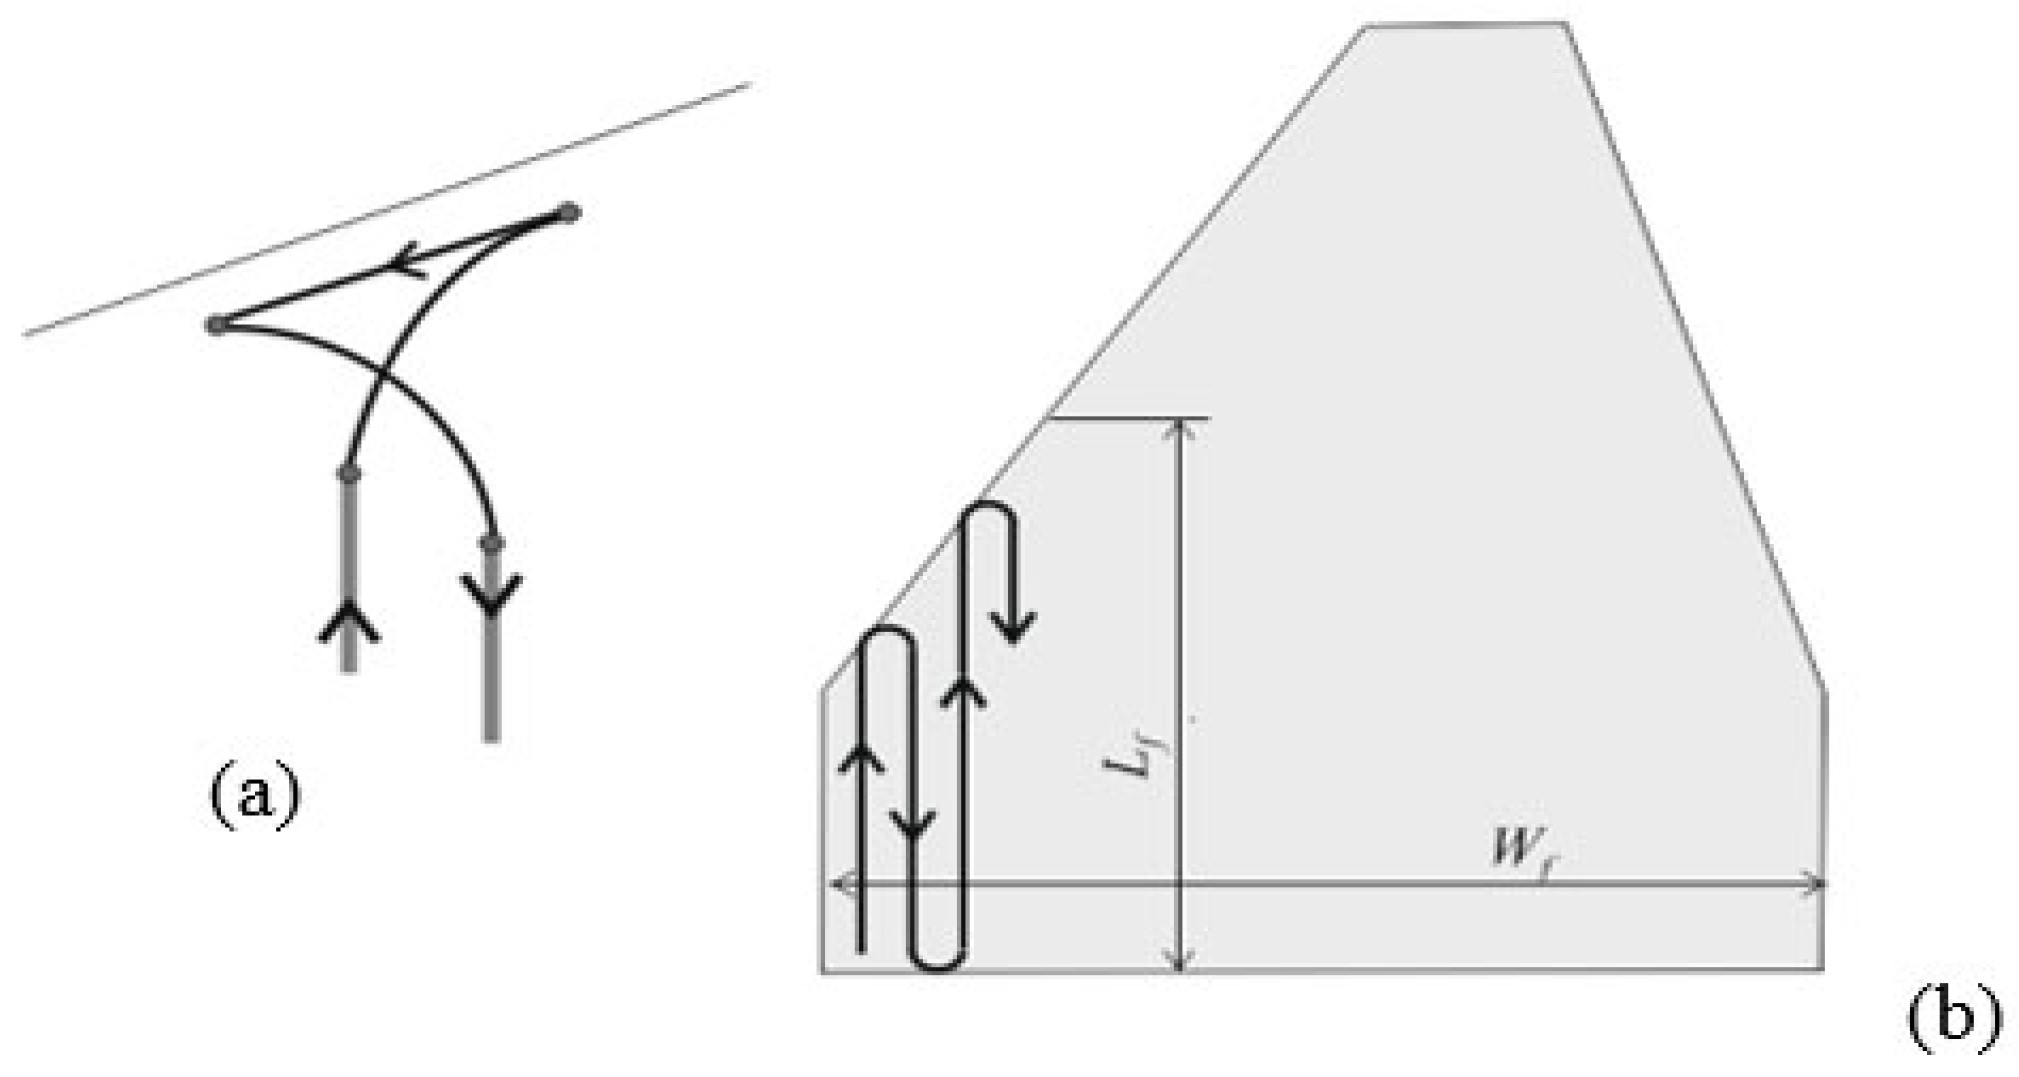
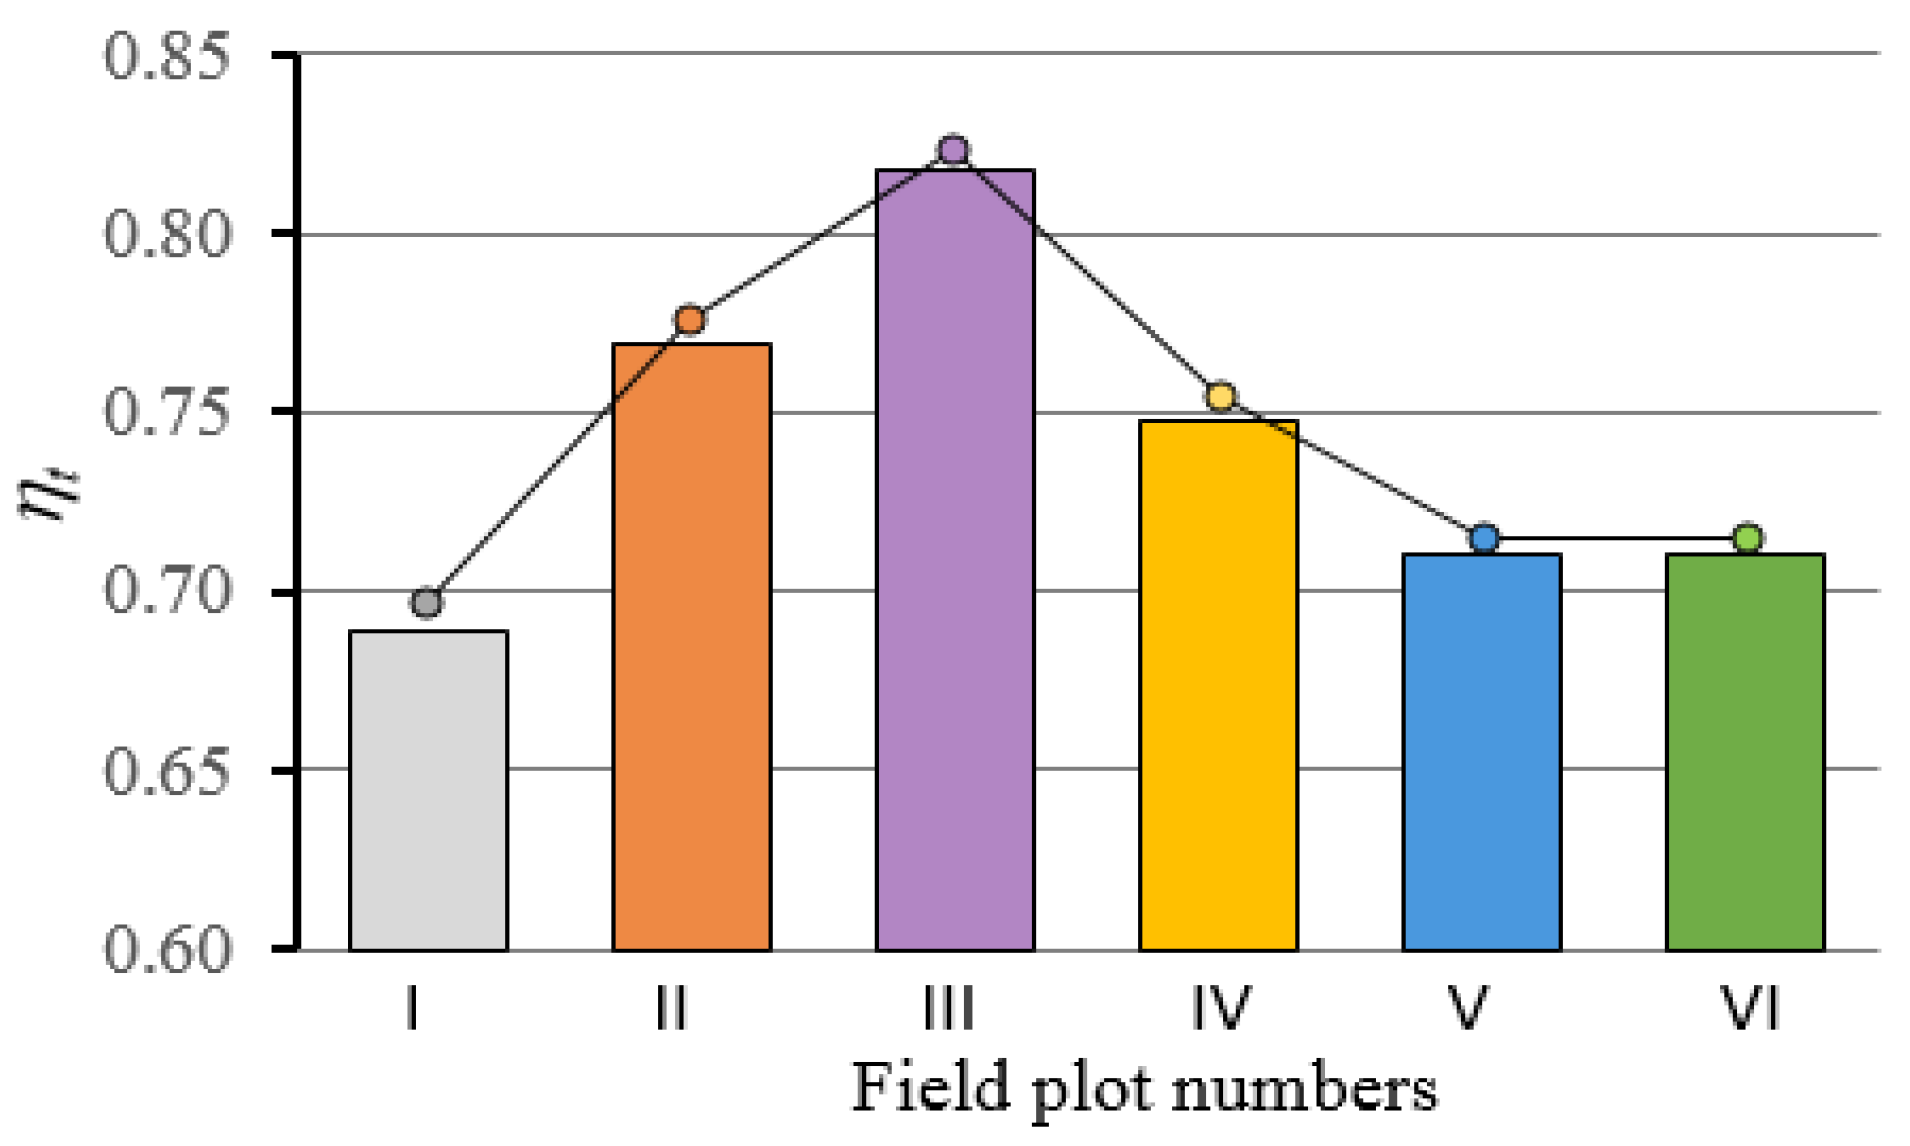
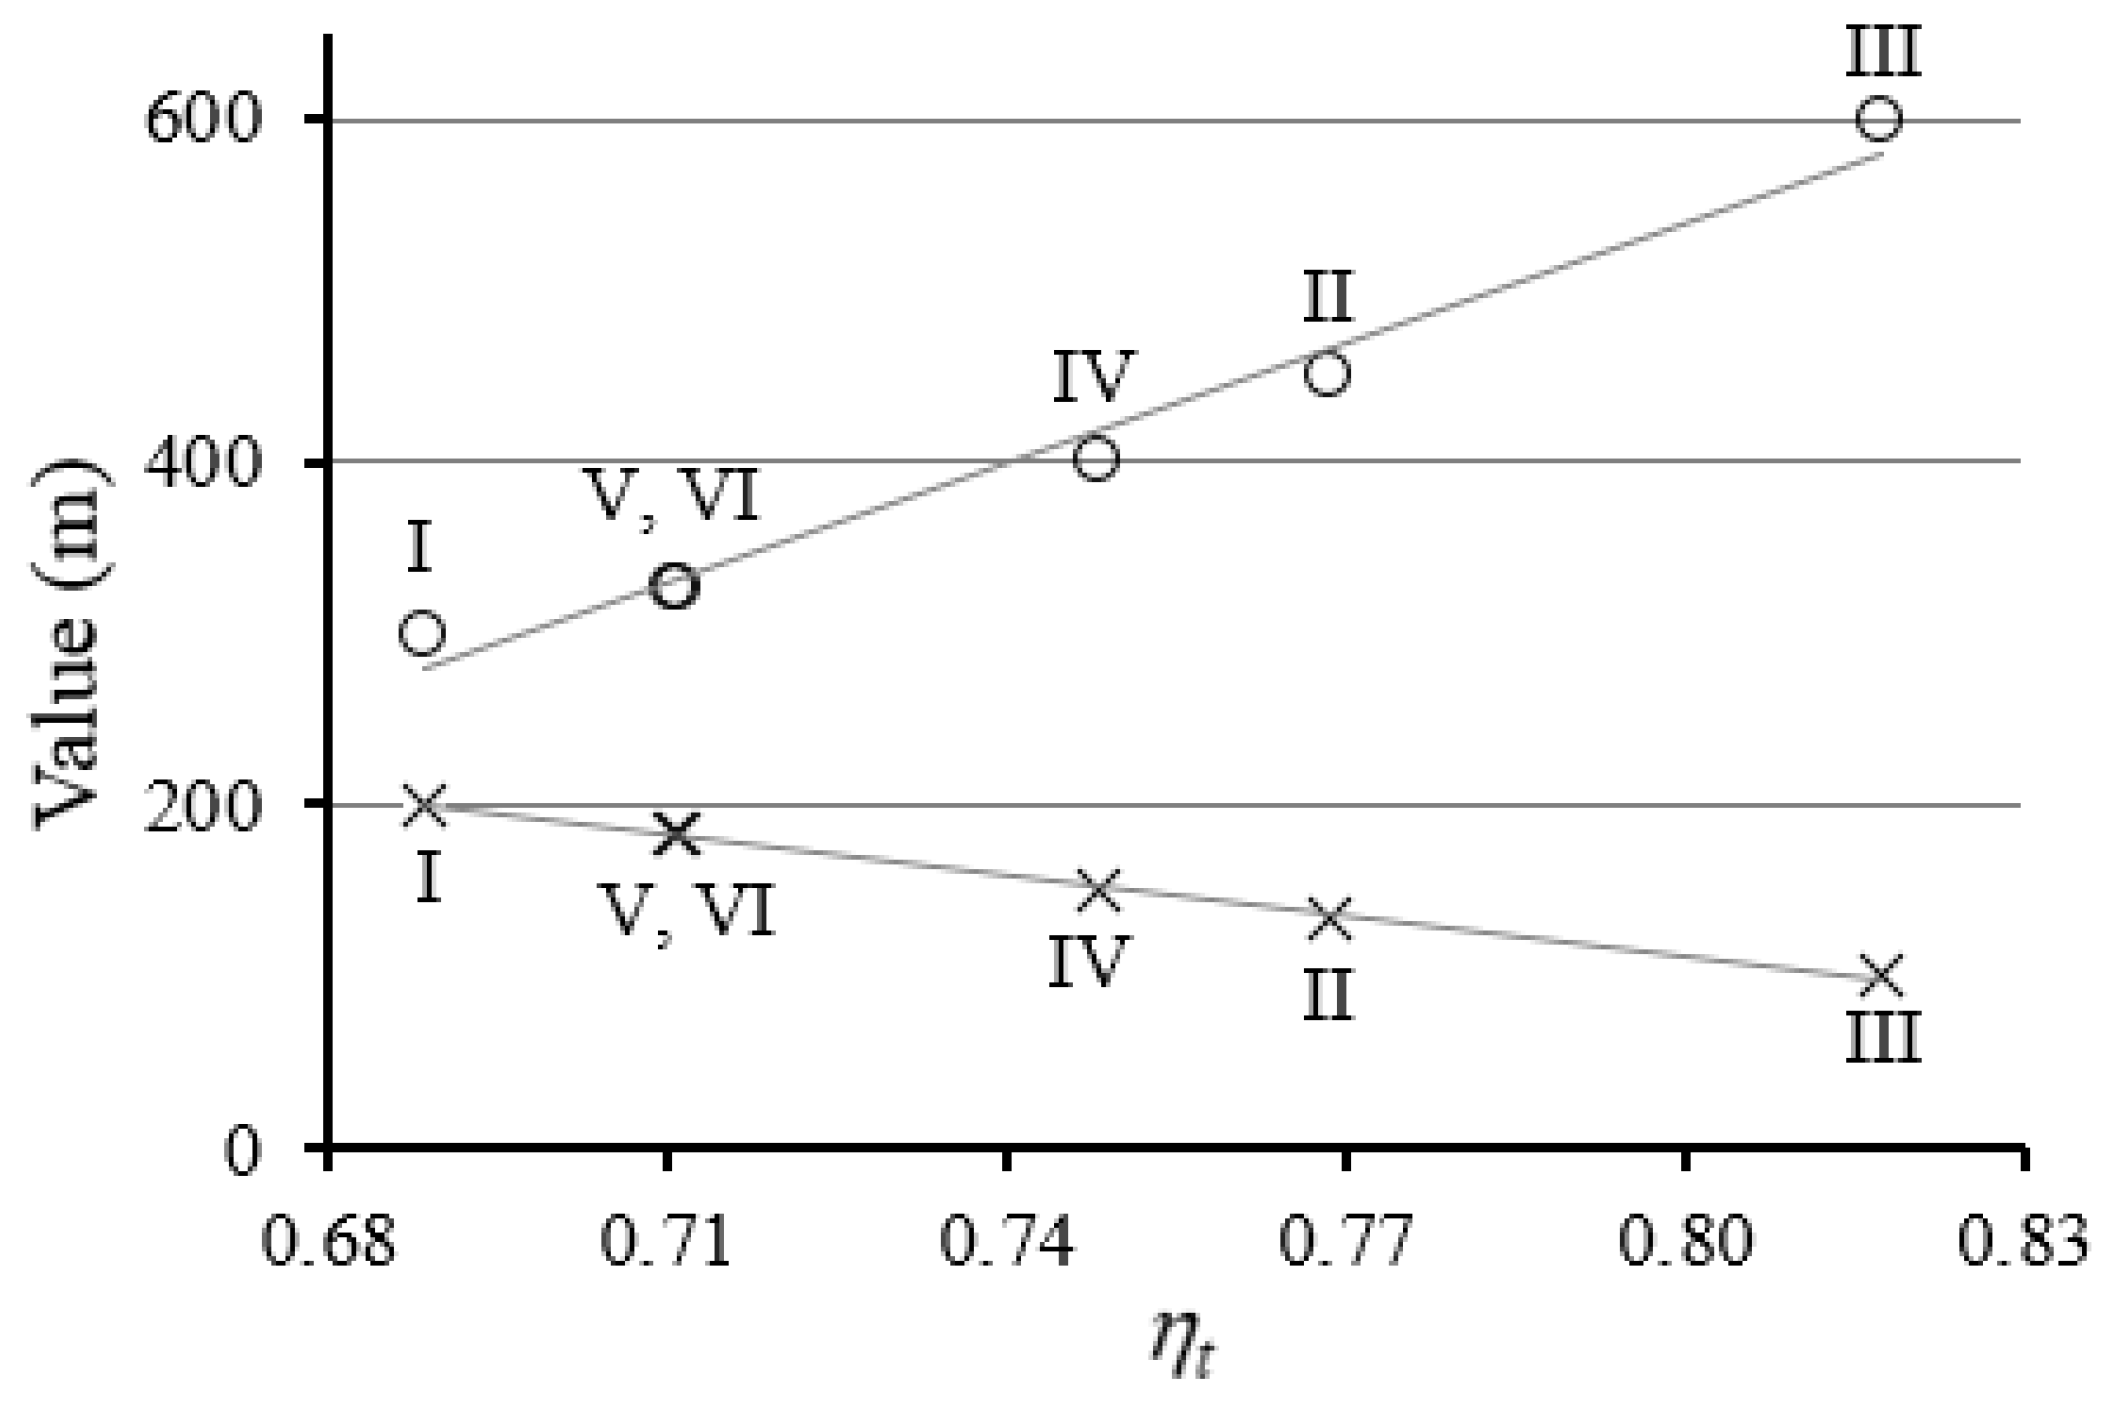
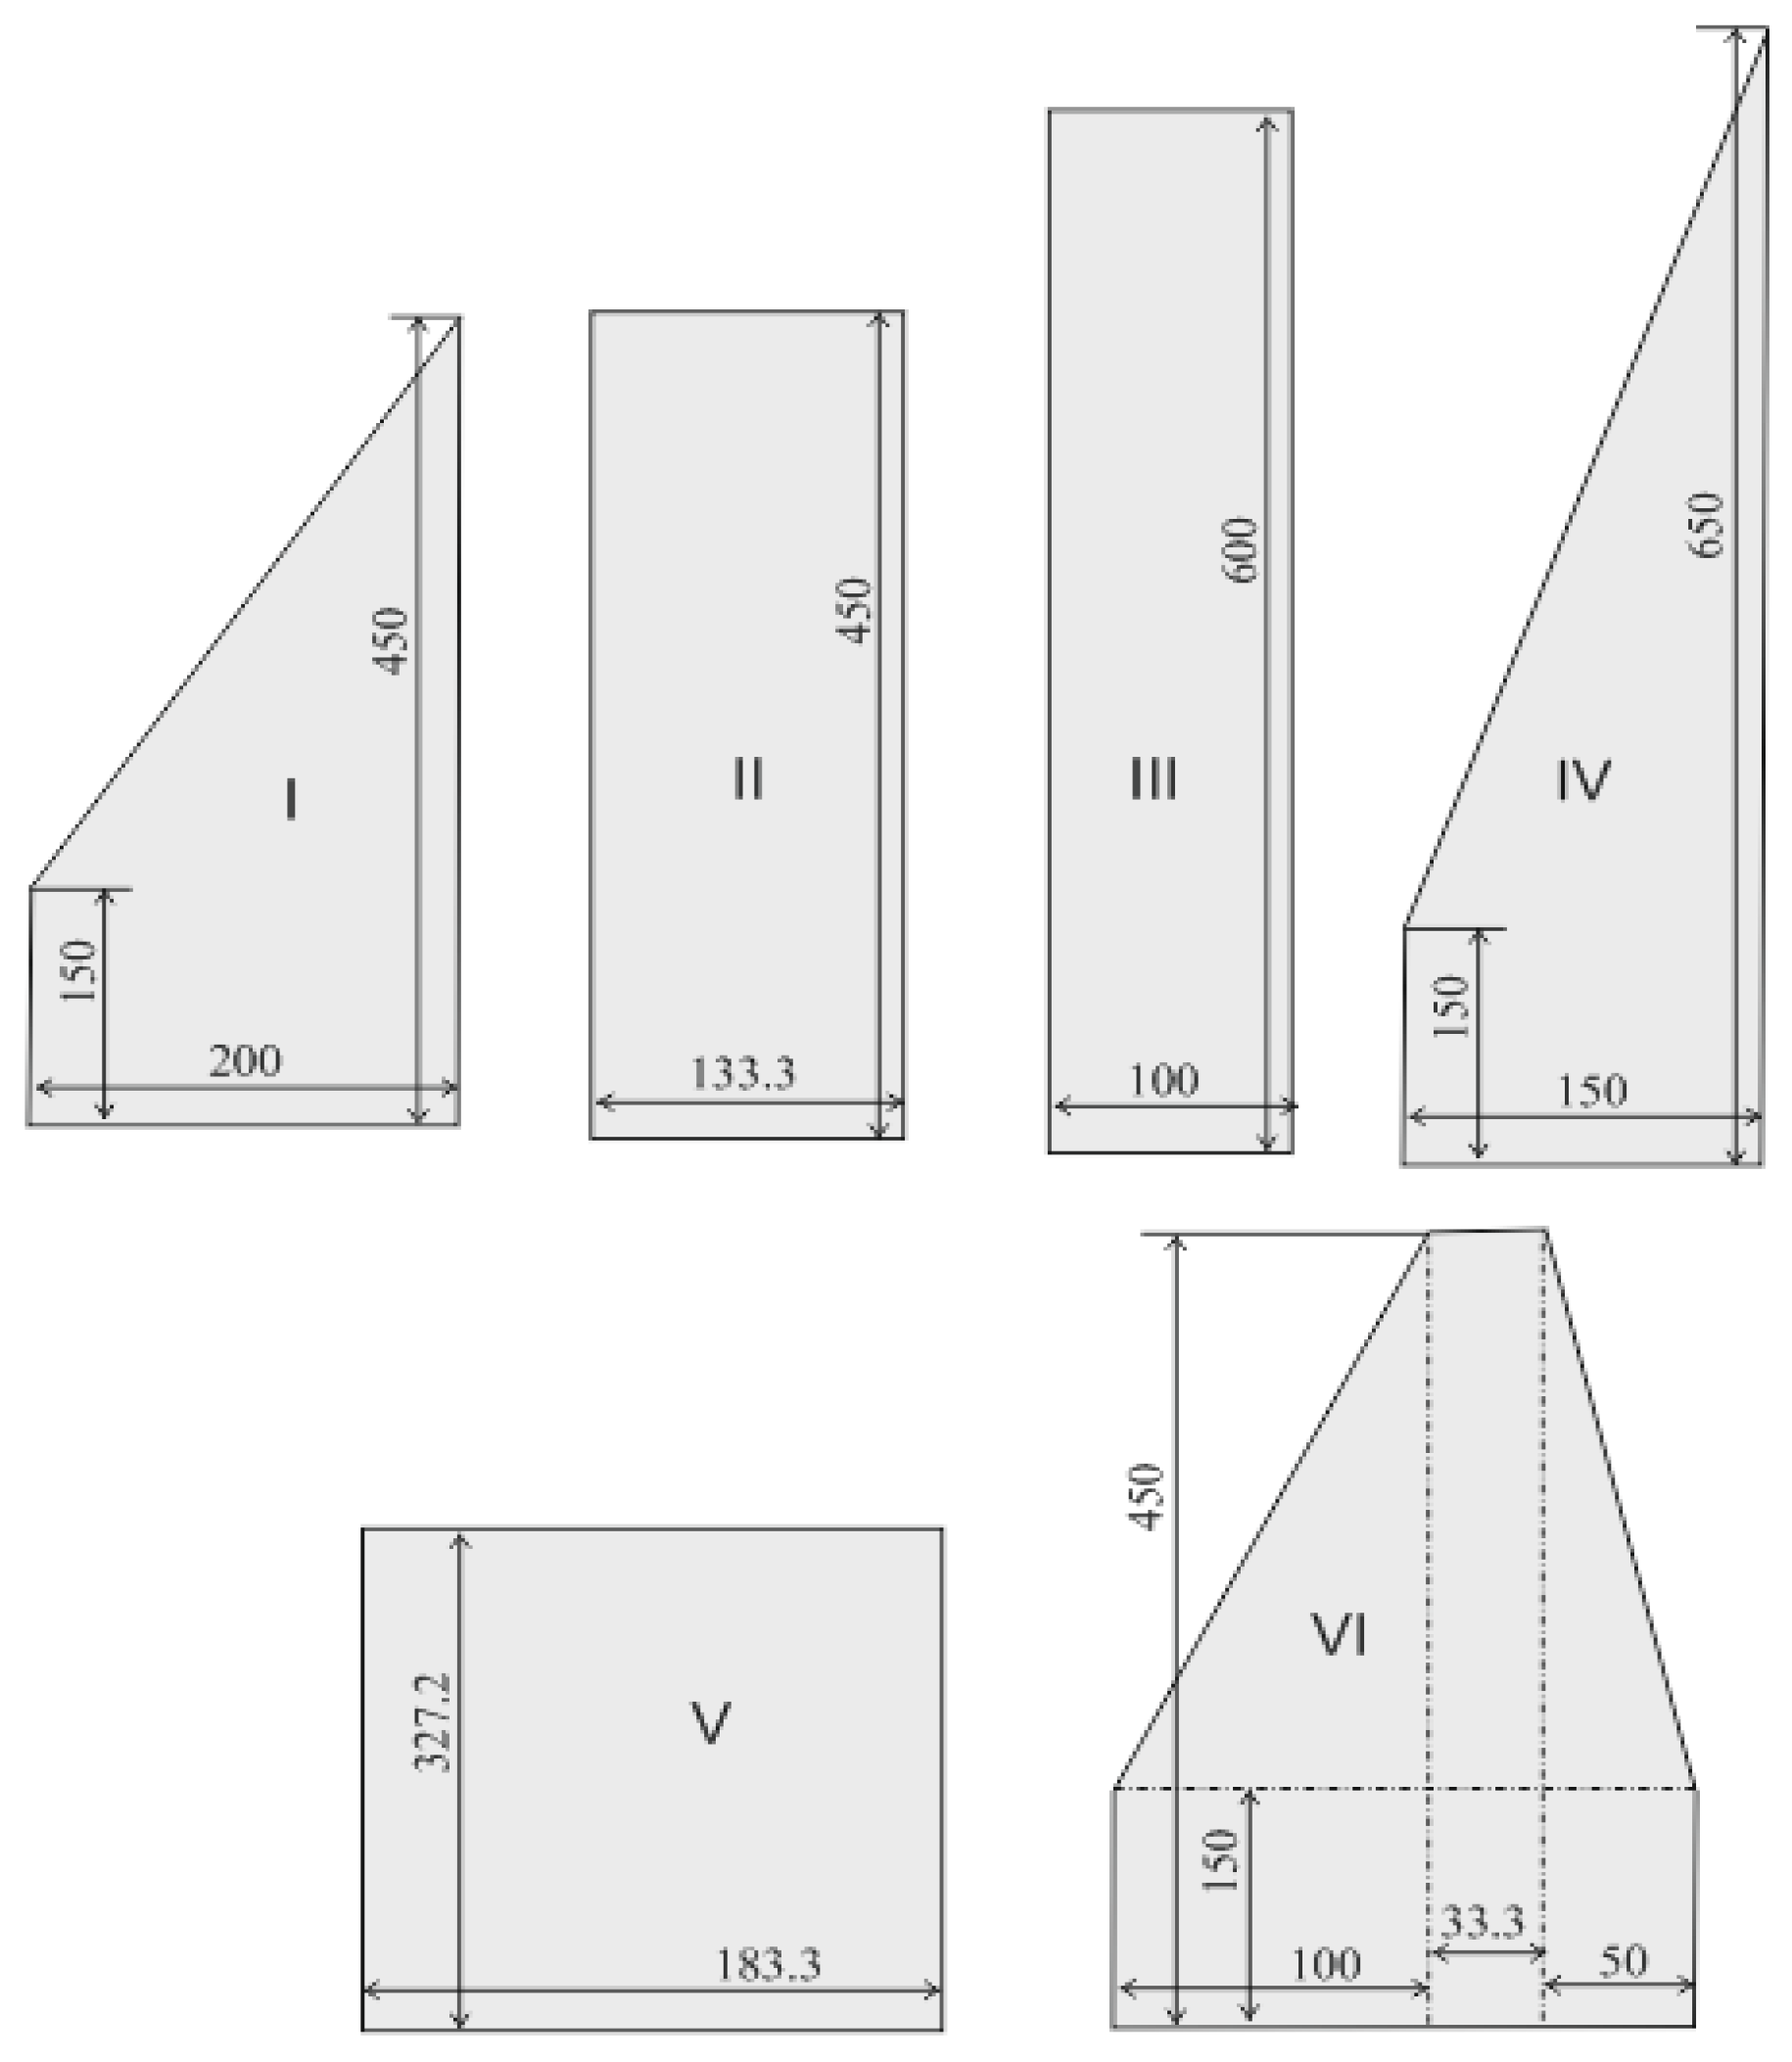
| Average plot length in ploughing direction, m | 300 | 450 | 600 | 400 | 327.2 | 327.2 |
| Maximum plot width for perpendicular ploughing, m | 200 | 133.3 | 100 | 150 | 183.3 | 183.3 |
| Ratio of field area to perimeter | 51.7 | 51.4 | 42.8 | 40.8 | 58.8 | 52.8 |
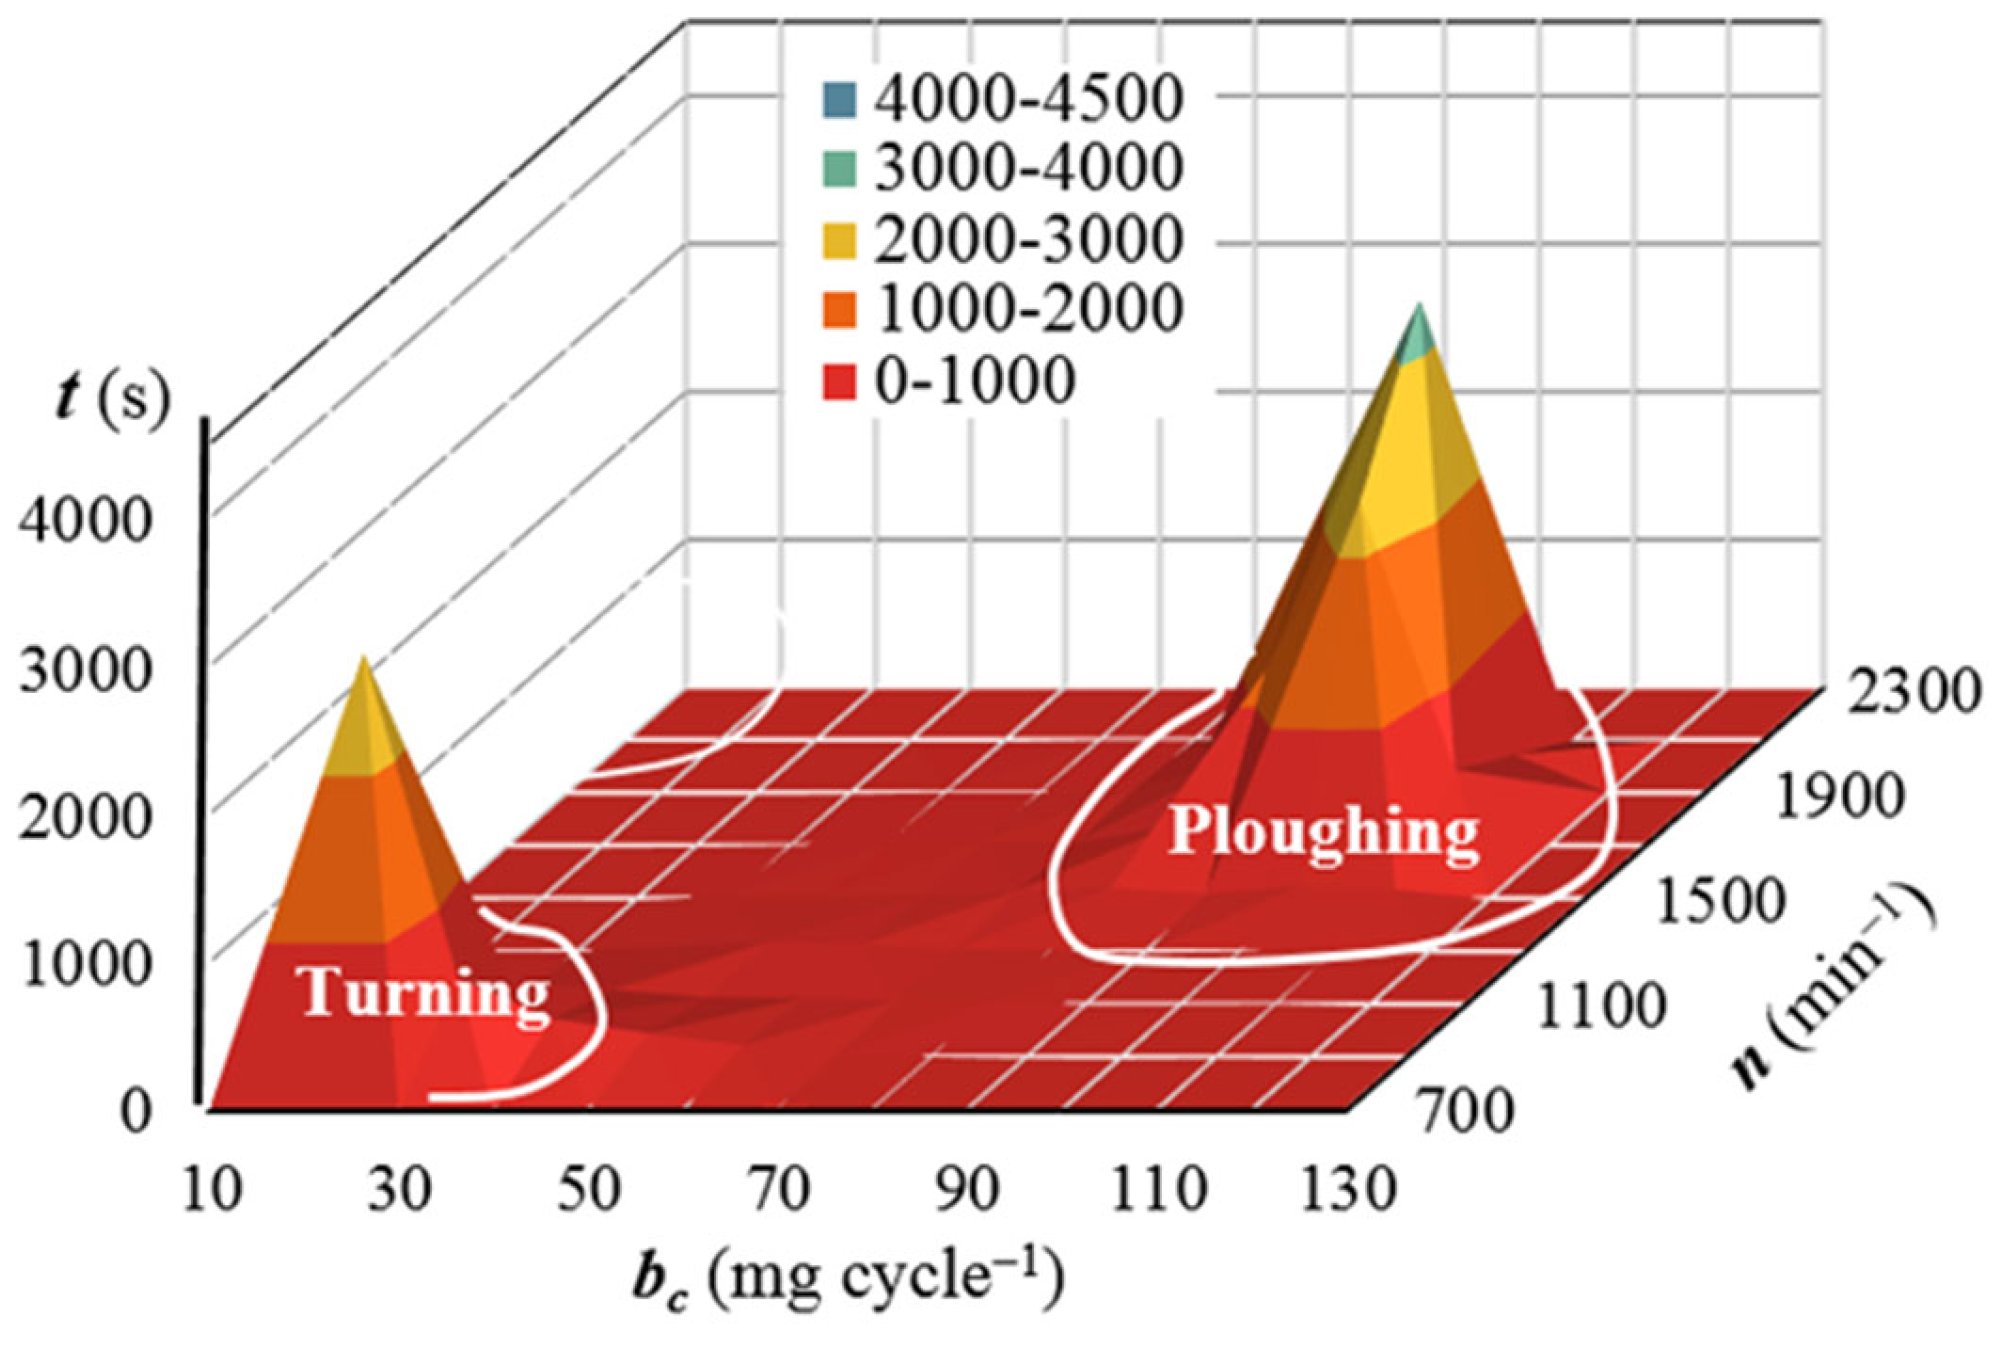
| Total productive ploughing time, s | 10,369 | 10,357 | 10,349 | 10,401 | 10,256 | 10,402 |
| Total time of non-productive activities, s | 4689 | 3116 | 2311 | 3505 | 4221 | 4231 |
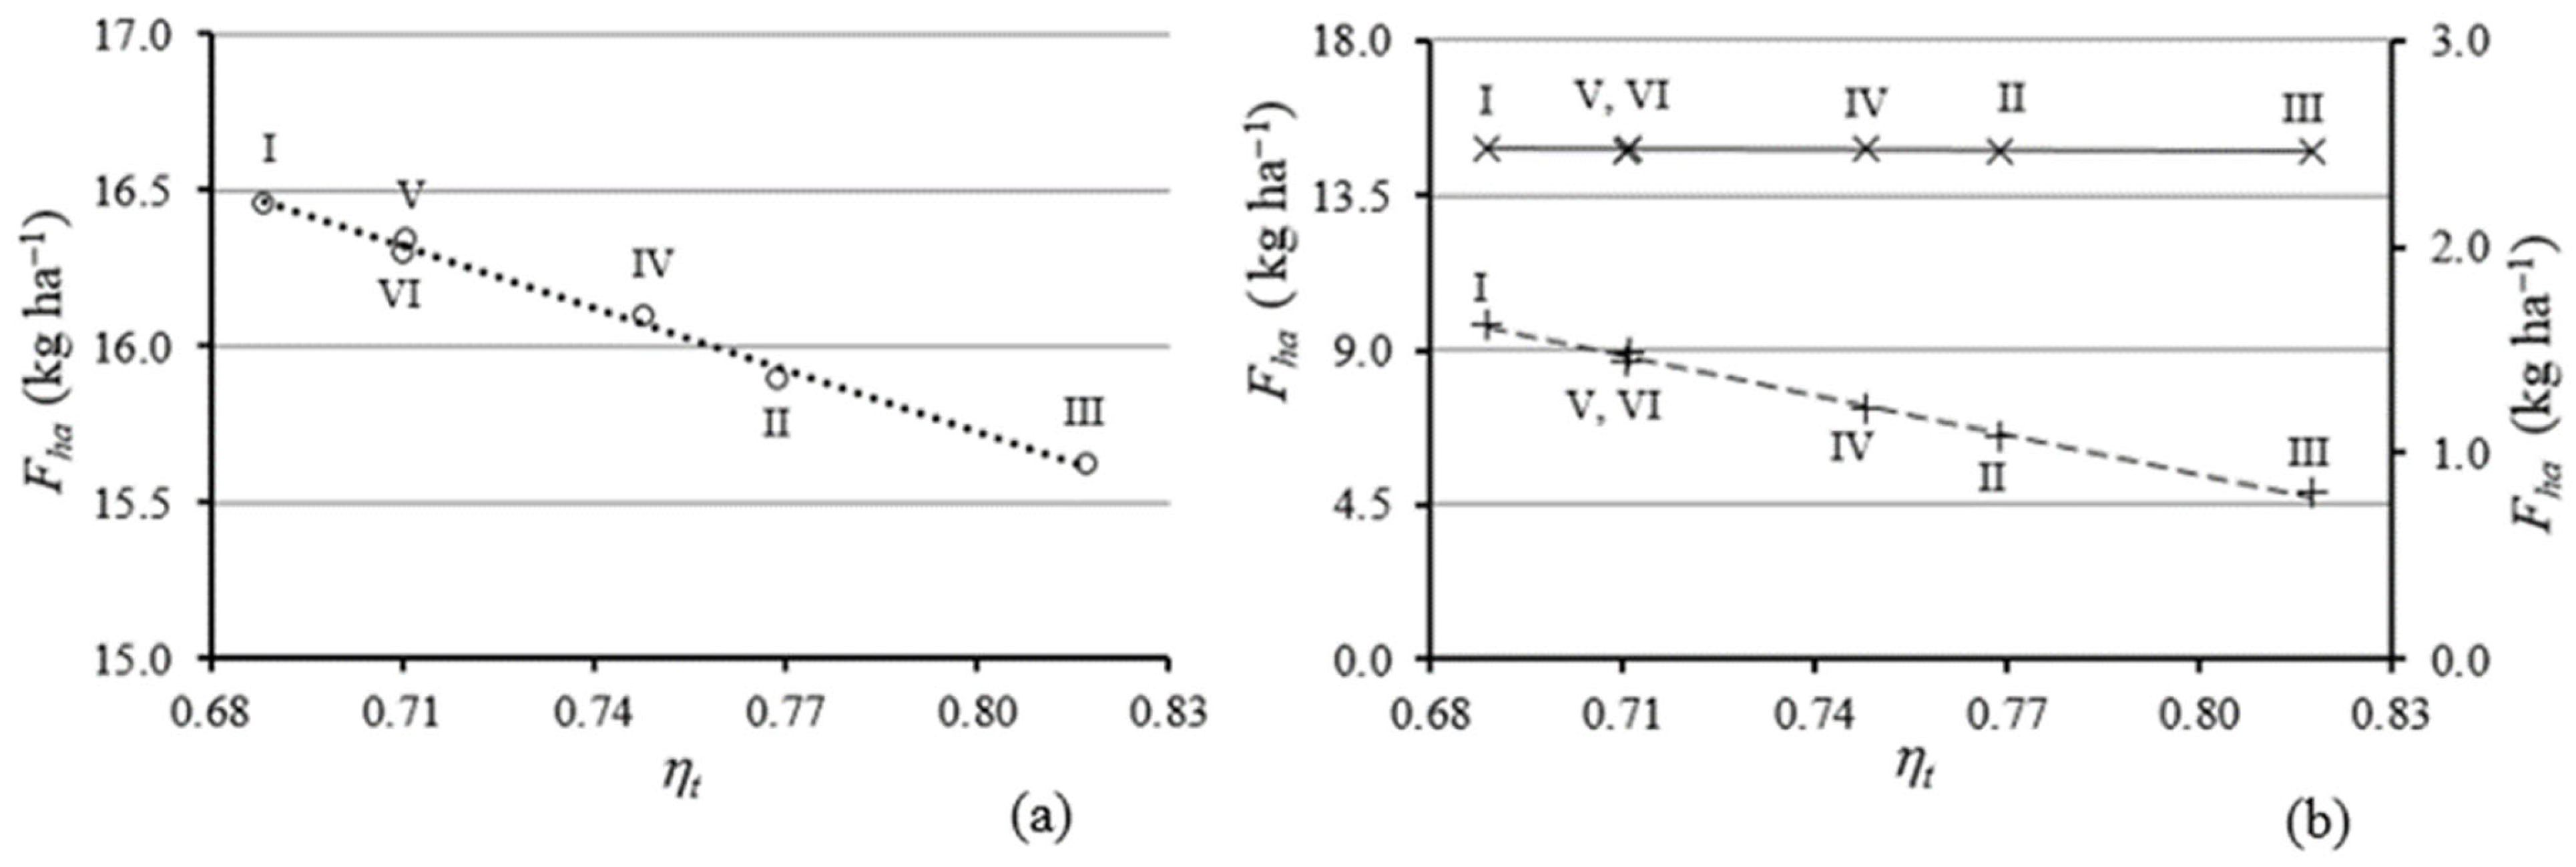
| Total fuel consumption during productive ploughing, kg | 89.11 | 88.97 | 88.90 | 89.35 | 88.09 | 89.06 |
| Total fuel consumption during non-productive activities, kg | 9.72 | 6.48 | 4.87 | 7.29 | 8.89 | 8.94 |
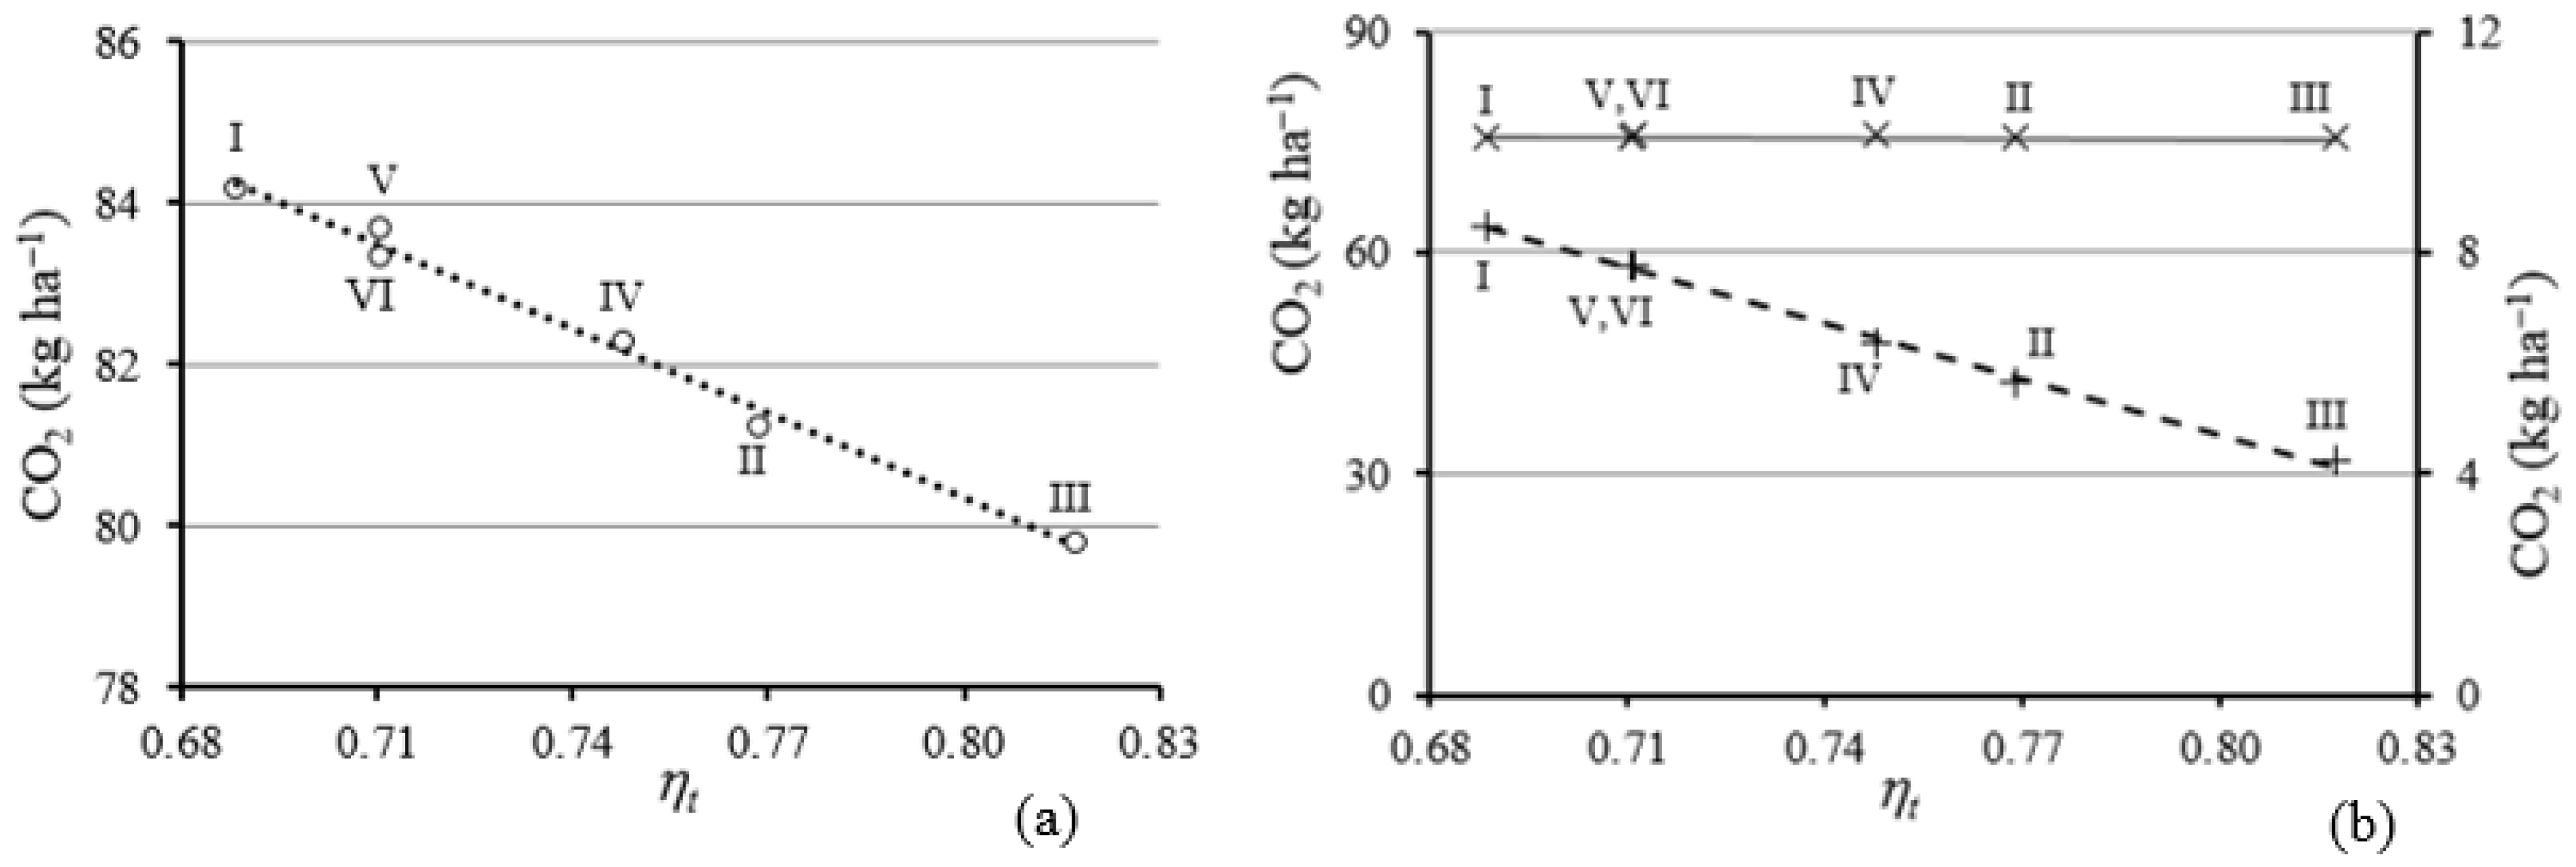
| Total CO2 emissions during productive ploughing, kg | 378.4 | 377.9 | 377.6 | 379.7 | 377.8 | 379.5 |
| Total CO2 emissions during non-productive activities, kg | 42.44 | 28.28 | 21.22 | 31.83 | 38.89 | 38.98 |
Disclaimer/Publisher’s Note: The statements, opinions and data contained in all publications are solely those of the individual author(s) and contributor(s) and not of MDPI and/or the editor(s). MDPI and/or the editor(s) disclaim responsibility for any injury to people or property resulting from any ideas, methods, instructions or products referred to in the content. |
© 2023 by the authors. Licensee MDPI, Basel, Switzerland. This article is an open access article distributed under the terms and conditions of the Creative Commons Attribution (CC BY) license (https://creativecommons.org/licenses/by/4.0/).
Share and Cite
Damanauskas, V.; Janulevičius, A. Validation of Criteria for Predicting Tractor Fuel Consumption and CO2 Emissions When Ploughing Fields of Different Shapes and Dimensions. AgriEngineering 2023, 5, 2408-2422. https://doi.org/10.3390/agriengineering5040148
Damanauskas V, Janulevičius A. Validation of Criteria for Predicting Tractor Fuel Consumption and CO2 Emissions When Ploughing Fields of Different Shapes and Dimensions. AgriEngineering. 2023; 5(4):2408-2422. https://doi.org/10.3390/agriengineering5040148
Chicago/Turabian StyleDamanauskas, Vidas, and Algirdas Janulevičius. 2023. "Validation of Criteria for Predicting Tractor Fuel Consumption and CO2 Emissions When Ploughing Fields of Different Shapes and Dimensions" AgriEngineering 5, no. 4: 2408-2422. https://doi.org/10.3390/agriengineering5040148
APA StyleDamanauskas, V., & Janulevičius, A. (2023). Validation of Criteria for Predicting Tractor Fuel Consumption and CO2 Emissions When Ploughing Fields of Different Shapes and Dimensions. AgriEngineering, 5(4), 2408-2422. https://doi.org/10.3390/agriengineering5040148