1. Introduction
Growing crops using strip-till (ST) is gaining ground worldwide [
1,
2]. This concept is a compromise between conventional tillage (CT) and no-till (NT). In ST technology, tillage is carried out in a continuous strip across the entire width of the field. Alternative NT technology does not provide for soil loosening at all. Its slight grinding by the working bodies of the seeder takes place when sowing an agricultural crop.
Two technologies perform ST. The essence of the first (strip-till one-pass technology) is that for its implementation a machine is used that combines the loosening of strips with the simultaneous sowing of crops in them [
3,
4]. The second ST technology (strip-till two-pass) consists of two stages. In the first, special machines perform tillage in strips 20–30 cm wide and up to 35 cm deep [
5]. In the second stage, crops are sown in loosened strips [
6,
7]. This is done with conventional row planters.
On the one hand, strip-till one-pass technology eliminates the problem of the seeder’s working bodies not falling into the middle of the loosened strip. On the other hand, sowing seeds in loosened but not yet settled soil creates air pockets in it. In the future, this can lead to undesirable cutting off of the cultivated plants’ root shoots [
8]. In addition, loosened soil may not be warm enough, adversely affecting the sown crop vegetation [
9]. If the seeds are planted in high-humidity soil, then a significant modernization of the seeder is required [
10]. In summary, we add that machines for implementing strip-till one-pass technology have a rather complex design [
11] and, therefore, are labour-intensive in technical and technological maintenance and quite expensive [
12].
As a rule, the implementation of the strip-till two-pass technology begins in the autumn period with the laying of loosened strips. To do this, extraordinary cultivators are either equipped with mechanical markers, or a GPS device is installed on the tractor [
13]. Using navigation systems is all the more necessary when sowing crops. They are needed to ensure the strict positioning of the seeder sowing sections in previously loosened strips [
14] and for the precise application of mineral fertilizers [
15].
Given the preceding, we think strip-till two-pass technology is preferable in soil–climatic zones with annual precipitation of no more than 500 mm. In this case, there is a certain probability of the soil strips moisture saturation being in a loosened state since autumn. Such zones include, in particular, the south of Ukraine, where annual precipitation practically does not exceed 450 mm. Because of this, loosening the soil in strips to a relatively large depth in spring leads to lumps up to 10 cm in diameter. As a result, it practically eliminates the quality sowing of seeds.
However, it should be noted that the machines’ designs for implementing the first stage of the strip-till two-pass technology are also quite complex. They include a set of working bodies designed to perform the following five technological operations: (1) cutting plant residues and soil with a disk; (2) cleaning a strip of soil from plant residues; (3) deepening the machine’s working bodies into the soil; (4) deep loosening of the soil in strips; and (5) crushing and levelling loosened soil [
4,
16].
Of all the working bodies of a machine for this purpose, the main ones loosen the soil to a given depth. Various kinds of shanks with chisels, tips, flat-cutting sweeps, etc., are used for this. But they are all far from ideal. For cultivating the soil with a strip of a given width, the latter should, in our opinion, deform the soil forward, upward, but not sideways.
Arcs meet these requirements—U-like working bodies [
17]. Their working surface has undercutting, crumbling and loosening elements corresponding to the phases of the working body interaction with the soil. The layer cut out from the monolith with an arc is preliminarily compressed in the soil in the longitudinal direction to lose bonds and induce zones of intense cracking in it. Such stresses correspond to the geometric shape and location of the arc’s front part and its cutting edge extended forward—the ploughshare. The layer cut off by the front part of the arc is completely separated from the monolith by the side posts of the arc, then undergoes the opposite effect on the main deformer. Such deformation is particularly effective since the formation has already undergone a slight compressive (in the upper part) and tensile (in the lower part) stress. When the formation passes to the main deforming surface, the latter’s shape causes the stresses to change in longitudinal and transverse directions. Such a variation of impacts in two directions on a layer previously formed in a monolith brings an intense loss of bonds and, as a result, abundant cracking. The loosening of the soil monolith by a complex of equidirectional impacts is the most rational. As shown by preliminary field tests of these arcs, the formation after their interaction has a maximum fluffiness and is well infiltrated. The presence of fractions eroded by water and air in it is insignificant.
A compromise option is V-shaped working bodies, in which the width of the loosened strip decreases somewhat as the depth of its processing increases [
18]. Their main disadvantage is working satisfactorily at soil density, which does not exceed 1.3 kg·cm
−3.
With a larger value of this parameter, a blocked soil cutting takes place. It is characterized by forming soil blocks of such dimensions that block soil passage between the left and right walls of the V-shaped working body.
V-shaped working bodies are designed [
19]. The experimental setup consisted of two flat disks inclined to each other in the horizontal and vertical planes. This slope was such that the distance between the upper leading edges of the disks was greater than between the lower rear ones. When the disks moved in the soil, the layer was pinched between them, broke away from the bottom of the furrow, rose slightly upwards, and laid back in a loosened state. With a disk diameter of 850 mm, an inclination angle of 9° and a distance between 300 and 500 mm disks, soil loosening was quite effective at an operating depth of 25 cm. When testing these bodies, their traction resistance was significantly less than rippers with toothed working bodies. However, significant vertical loads were required to deepen the discs.
This work aimed to find an option to perform the first stage of the strip-till two-pass technology without using machines, which are highly specialized, have high metal consumption and a complex design. To carry this out, we have created a particular combined unit. It consists of a wheeled tractor on the front hitch linkage system of which a disc harrow is mounted, and on the rear one—a chisel plough. A disc harrow set in the “push” mode is designed for fine tillage (up to 6 cm) with simultaneous chopping of the previous crop stubble. This simple and inexpensive machine allows you to perform the first two of the above five technological operations.
The working bodies of a chisel plough, simple in design, carry out deep strip loosening of the soil with simultaneous (if necessary) levelling. The relatively large weight of the chisel plough contributes to the self-deepening of its working bodies to a given depth. Thus, implementing the three remaining technological operations of the above five is realized.
It should be noted that we did not find analogues of such a machine–tractor unit. In this regard, it is relevant to determine its actual performance indicators. First, this concerns the assessment of the loosened strips’ non-straightness and the depth stability of their processing. Equally crucial for this study is the issue of adjacent passages’ stability of such a tillage unit. The results of these problems’ experimental studies are presented in this article.
2. Materials and Methods
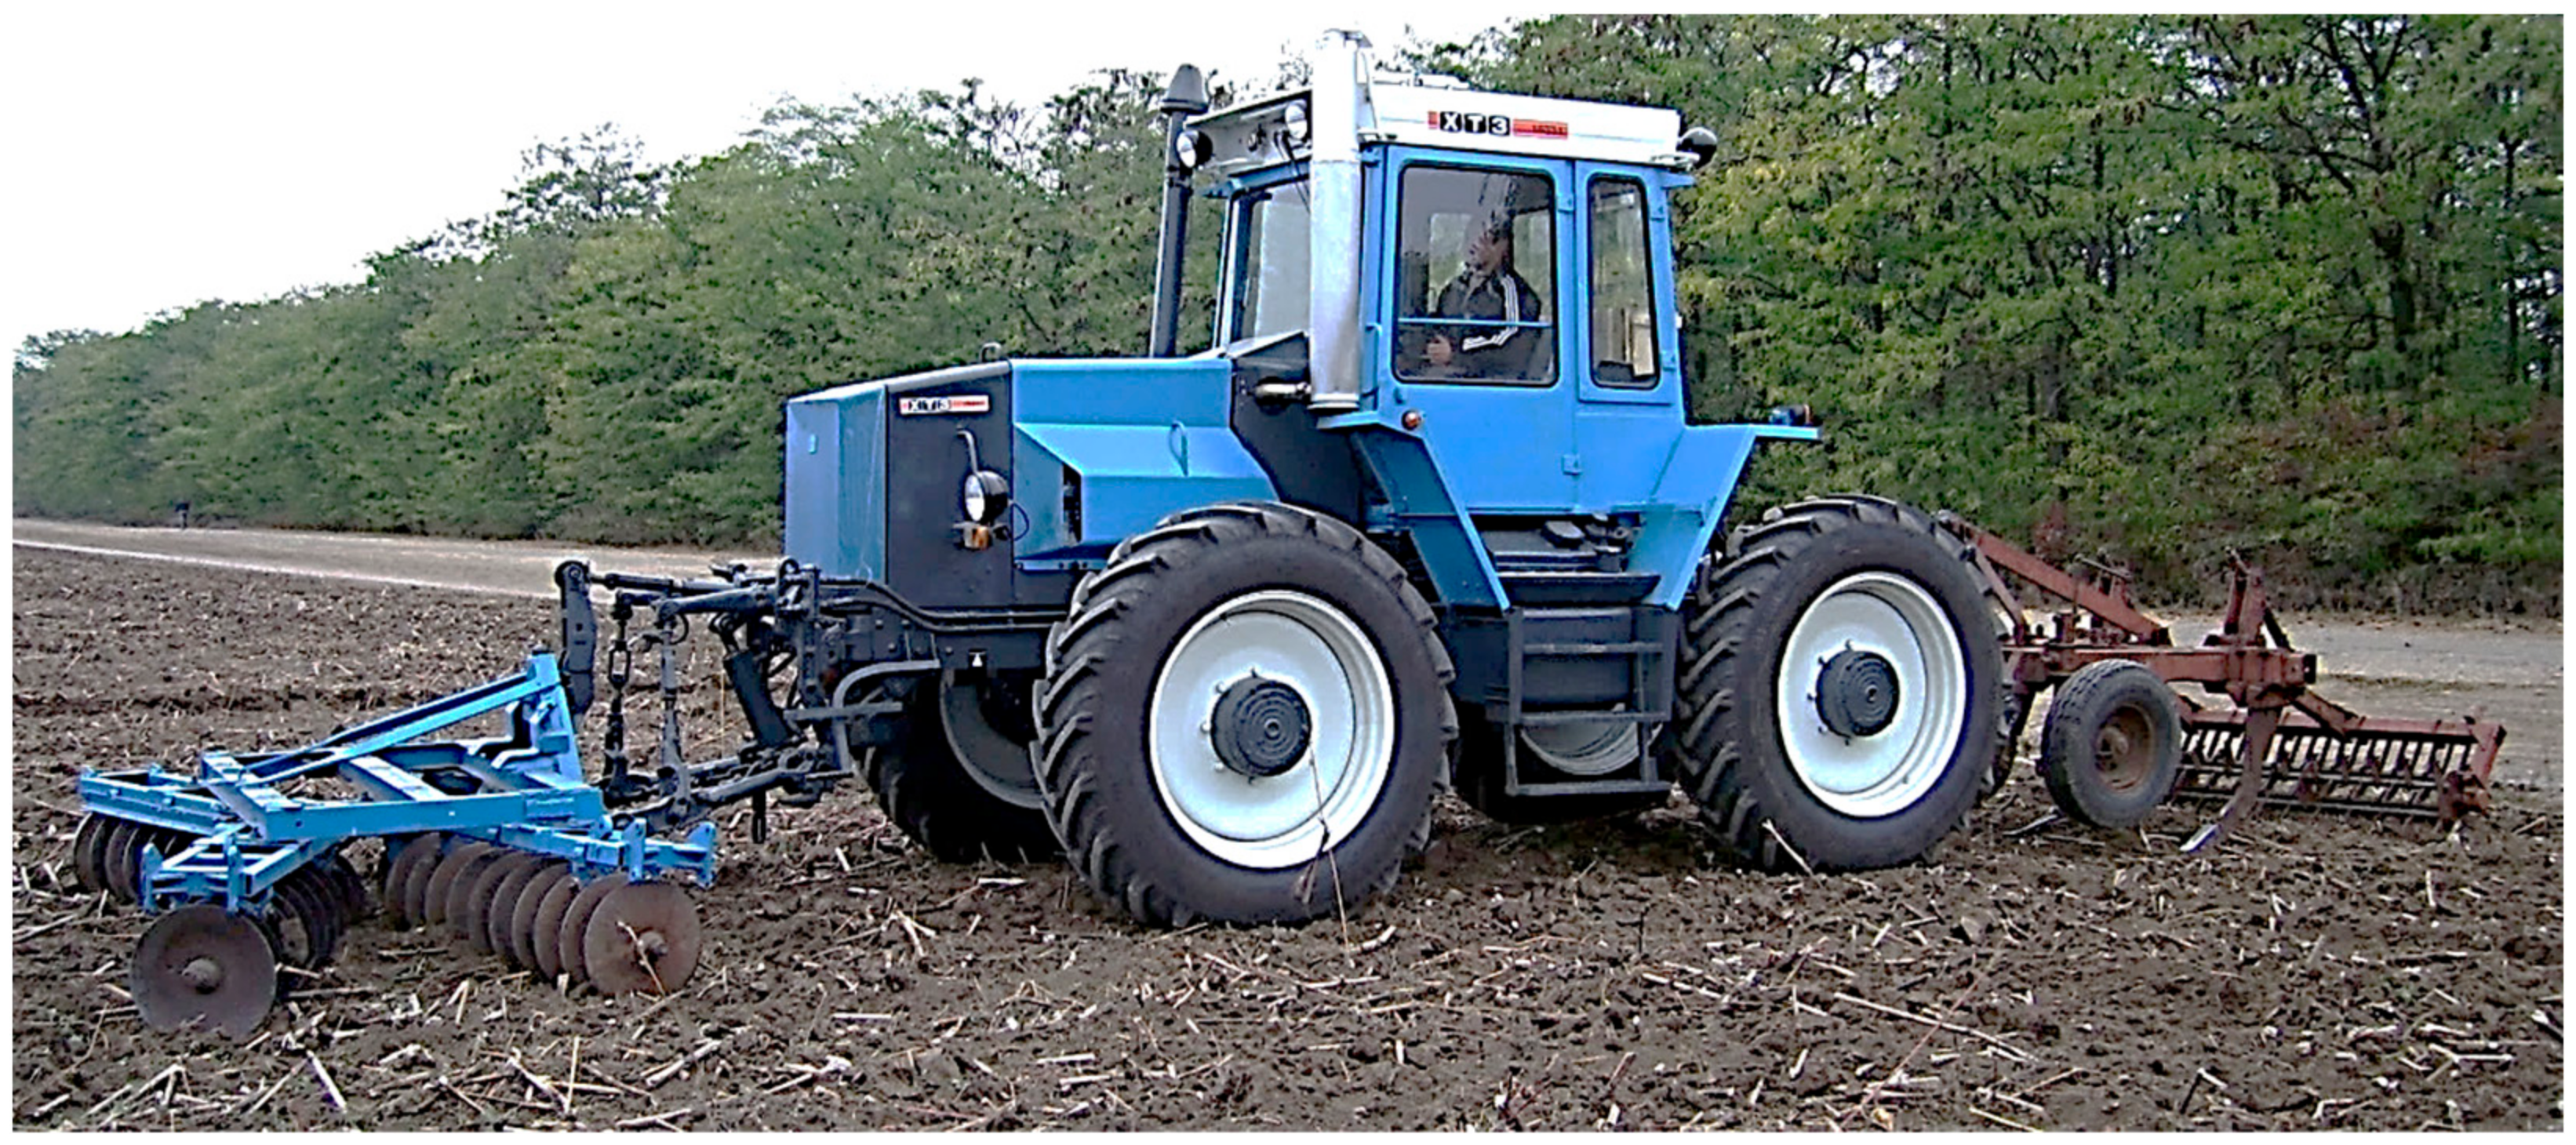
The physical object of the research consisted of a KhTZ-16132 wheeled tractor (Kharkiv, Ukraine), an experimental frontal disc harrow, and a modernized chisel plough (
Figure 1). A brief technical description of this machine–tractor unit is presented in
Table 1.
The modernization of the serial chisel plough was as follows. On the frame of the serial machine, there were 9 working bodies installed with a step of 500 mm. As a result, 6 working bodies were left, set to a tillage depth of 25 cm with a step of 700 mm (
Figure 2).
At the same time, it was assumed that in the 6 strips loosened since autumn, the seeds of row crops would be sown in the spring with a 6-row serial seeder, the sowing sections of which are installed with a step of 700 mm. In the front harrow, the disc sections were rearranged to work in the “push” mode. The attachment of this machine to the tractor was fixed relative to it in a horizontal plane.
The field was divided into scoring sets, each 300 m long, for experimental studies. The first 50 m was used to accelerate the unit. At the next 250 m, the time () of its passage by the unit was recorded. We used a KHP PC3860 electronic stopwatch (Nanjing, China) with a measurement error of 0.01 s. The tillage unit movement velocity in the scoring set () was calculated by the formula: .
In the process of the soil-cultivating unit experimental studies, the following parameters were determined: (i) soil moisture and density in the 0–25 cm layer; (ii) longitudinal field profile; (iii) soil-loosening depth in the strips; (iv) non-straightness of loosened soil strips; and (v) stability of spacings between unit adjacent passes.
The instruments used and the methodology for determining soil moisture and density are described in [
20]. The soil-loosening depth in the strips was determined using a measuring kit (
Figure 3), which we created based on the Arduino Uno measuring board (Turin, Italy). The measuring kit uses an ultrasonic sensor US-025 (Manorshi Electronic, Jiangsu, China), the measurement error of which does not exceed 3 mm.
During the measurement process, the device is installed with support 2 on the processed background. Measuring probe 3 is lowered to the tillage depth (). Arduino Uno 1 measures the distance. Since , the value of is reflected on the device screen.
Measurements of this parameter in the amount of 200 were carried out in duplicate with a step of 0.2 m. The experimental data obtained in this case were used to calculate the mean, variance, normalized correlation functions, and spectral densities in the tillage depth oscillations. In addition, the deviation frequency of these oscillations (
) from their tolerance value was estimated. For this, we used the equation [
21]:
where:
Δ—tolerance value of tillage depth oscillations, ±cm;
—standard deviation of the soil tillage depth, ±cm;
—oscillations half-period mean of the soil tillage depth changing process’ normalized correlation function.
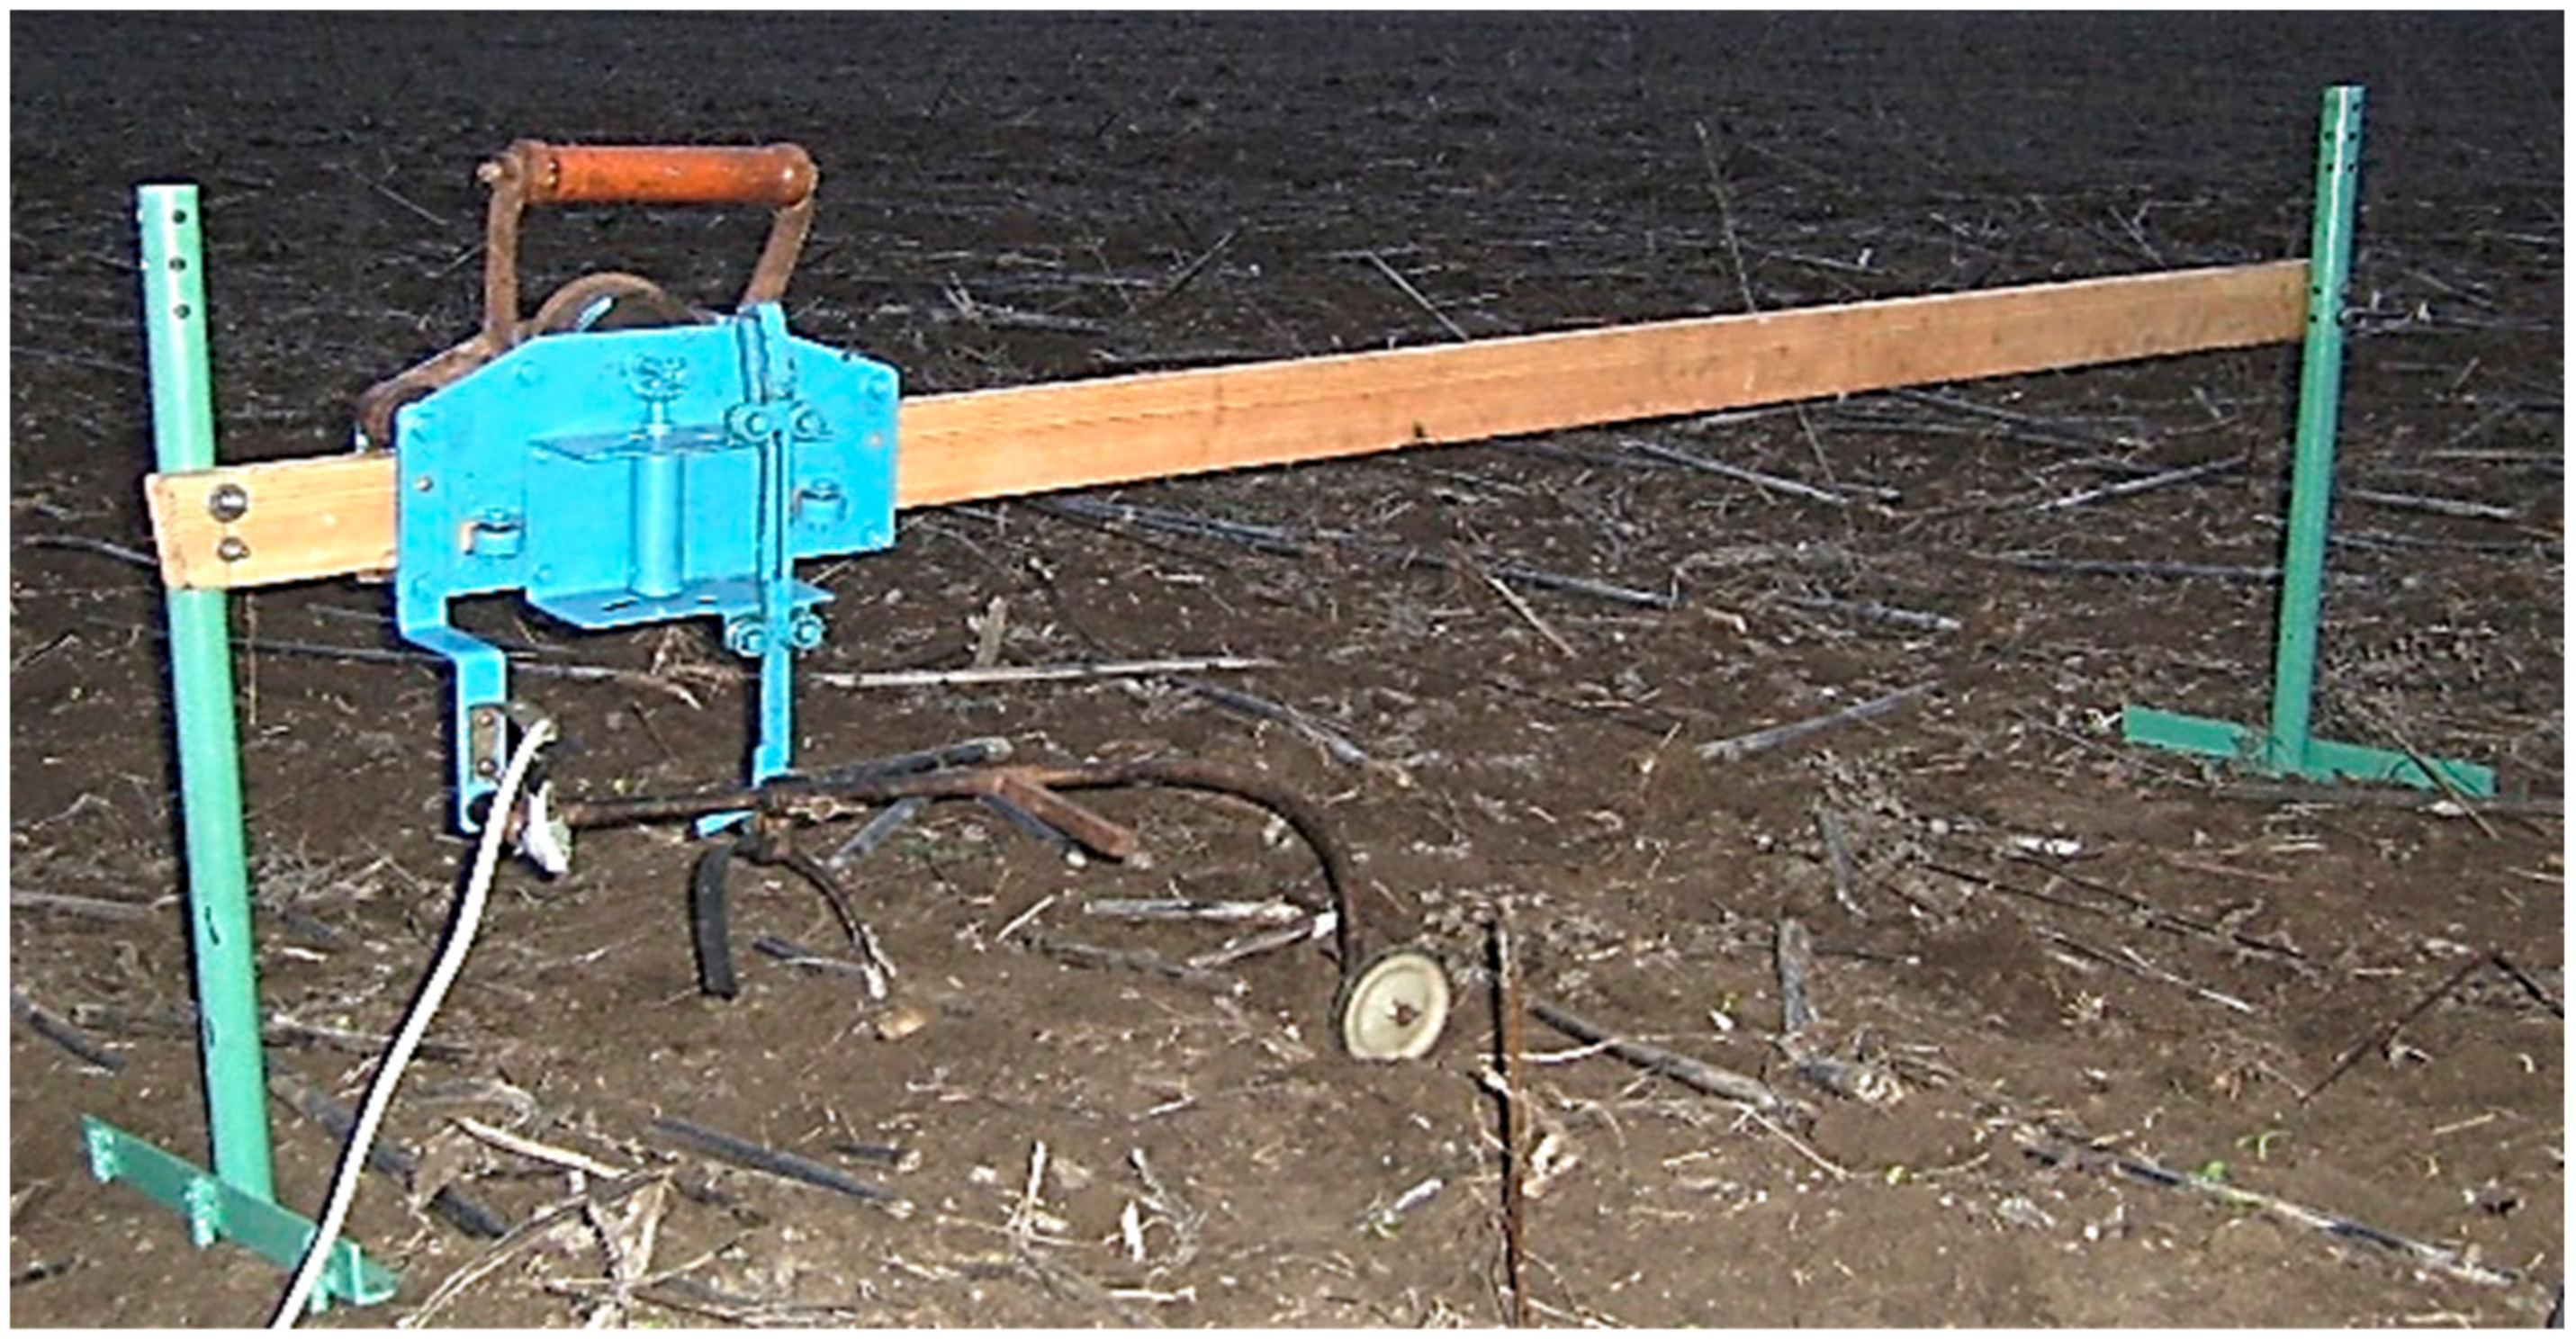
A unique device we developed was used to measure the longitudinal profile (
Figure 4).
Its basic element is a wooden bar parallel to the field’s surface under study. The lever of the device at one end contacts the field profile, and at the other, it is pivotally fixed on an axis connected to a variable resistance SP-3A with a nominal value of 470 Ohm. The letter A indicates that this resistance has a linear characteristic.
When moving the device along the wooden bar, the lever makes oscillatory movements in the longitudinal-vertical plane, thereby changing the value of the resistance SP-3A. The electrical signal generated in this case is fed to the Arduino Uno’s analogue input, then to the computer, followed by its conversion for processing in the Microsoft Excel 2016 (v.16) environment. The oscillations of the field longitudinal profile were recorded in triplicate with a measurement step of 0.1 m. This made it possible to obtain at least 350 points with a bar length of 4 m. The measurement error of field profile oscillations with this device does not exceed ±0.5 cm.
The non-straightness of the loosened strips (process 1) was evaluated as follows. Parallel to the track of the chisel plough outside the working body, a cord was pulled at a spacing of 50 cm from it, 300 m long. The spacing from the cord to the centre of the loosened strip was measured with a ruler with an error of ±0.5 cm. The measurement step was 1 m, and their number was 250.
The unit’s adjacent passes stability (process 2) in the direction “there” and “back” was evaluated by measuring the spacing between the traces of the chisel plough’s outside working bodies. For this, a ruler 1 m long was used with a measurement error of ±0.5 cm. The measurement step was 1 m, and their number was 250.
The last two parameters were measured in duplicate. Based on the measurement results, the following statistical characteristics of the estimated parameters were calculated: (i) mean value; (ii) variance; (iii) normalized correlation function; and (iv) normalized spectral density.
3. Results and Discussion
The place of the field experiments was Ukraine, Melitopol (46°50′56″ north latitude, 35°21′55″ east longitude, altitude: 37 m). The description of the soil: dark chestnut, medium loam soil with a humus content of 2.8% in the 0–25 cm layer. The same layer contains (for kg of soil): (i) 21.9 mg of total nitrogen; (ii) 35.8 mg of phosphorus; and (iii) 298.0 mg of potassium. The minimum moisture-holding capacity of the soil is at a level of 18–22%, its withering point—10%. The mean soil moisture value in the 0–25 cm layer was 18.5%, and the soil density was 1.23 g·cm−3.
The tillage unit moved at a mean velocity of 2.1 m·s−1 during the study. The mean value of the strips’ loosening depth was 24.8 ± 0.2 cm. The oscillations variance of this parameter was relatively small and was at the level of 1.44 cm2.
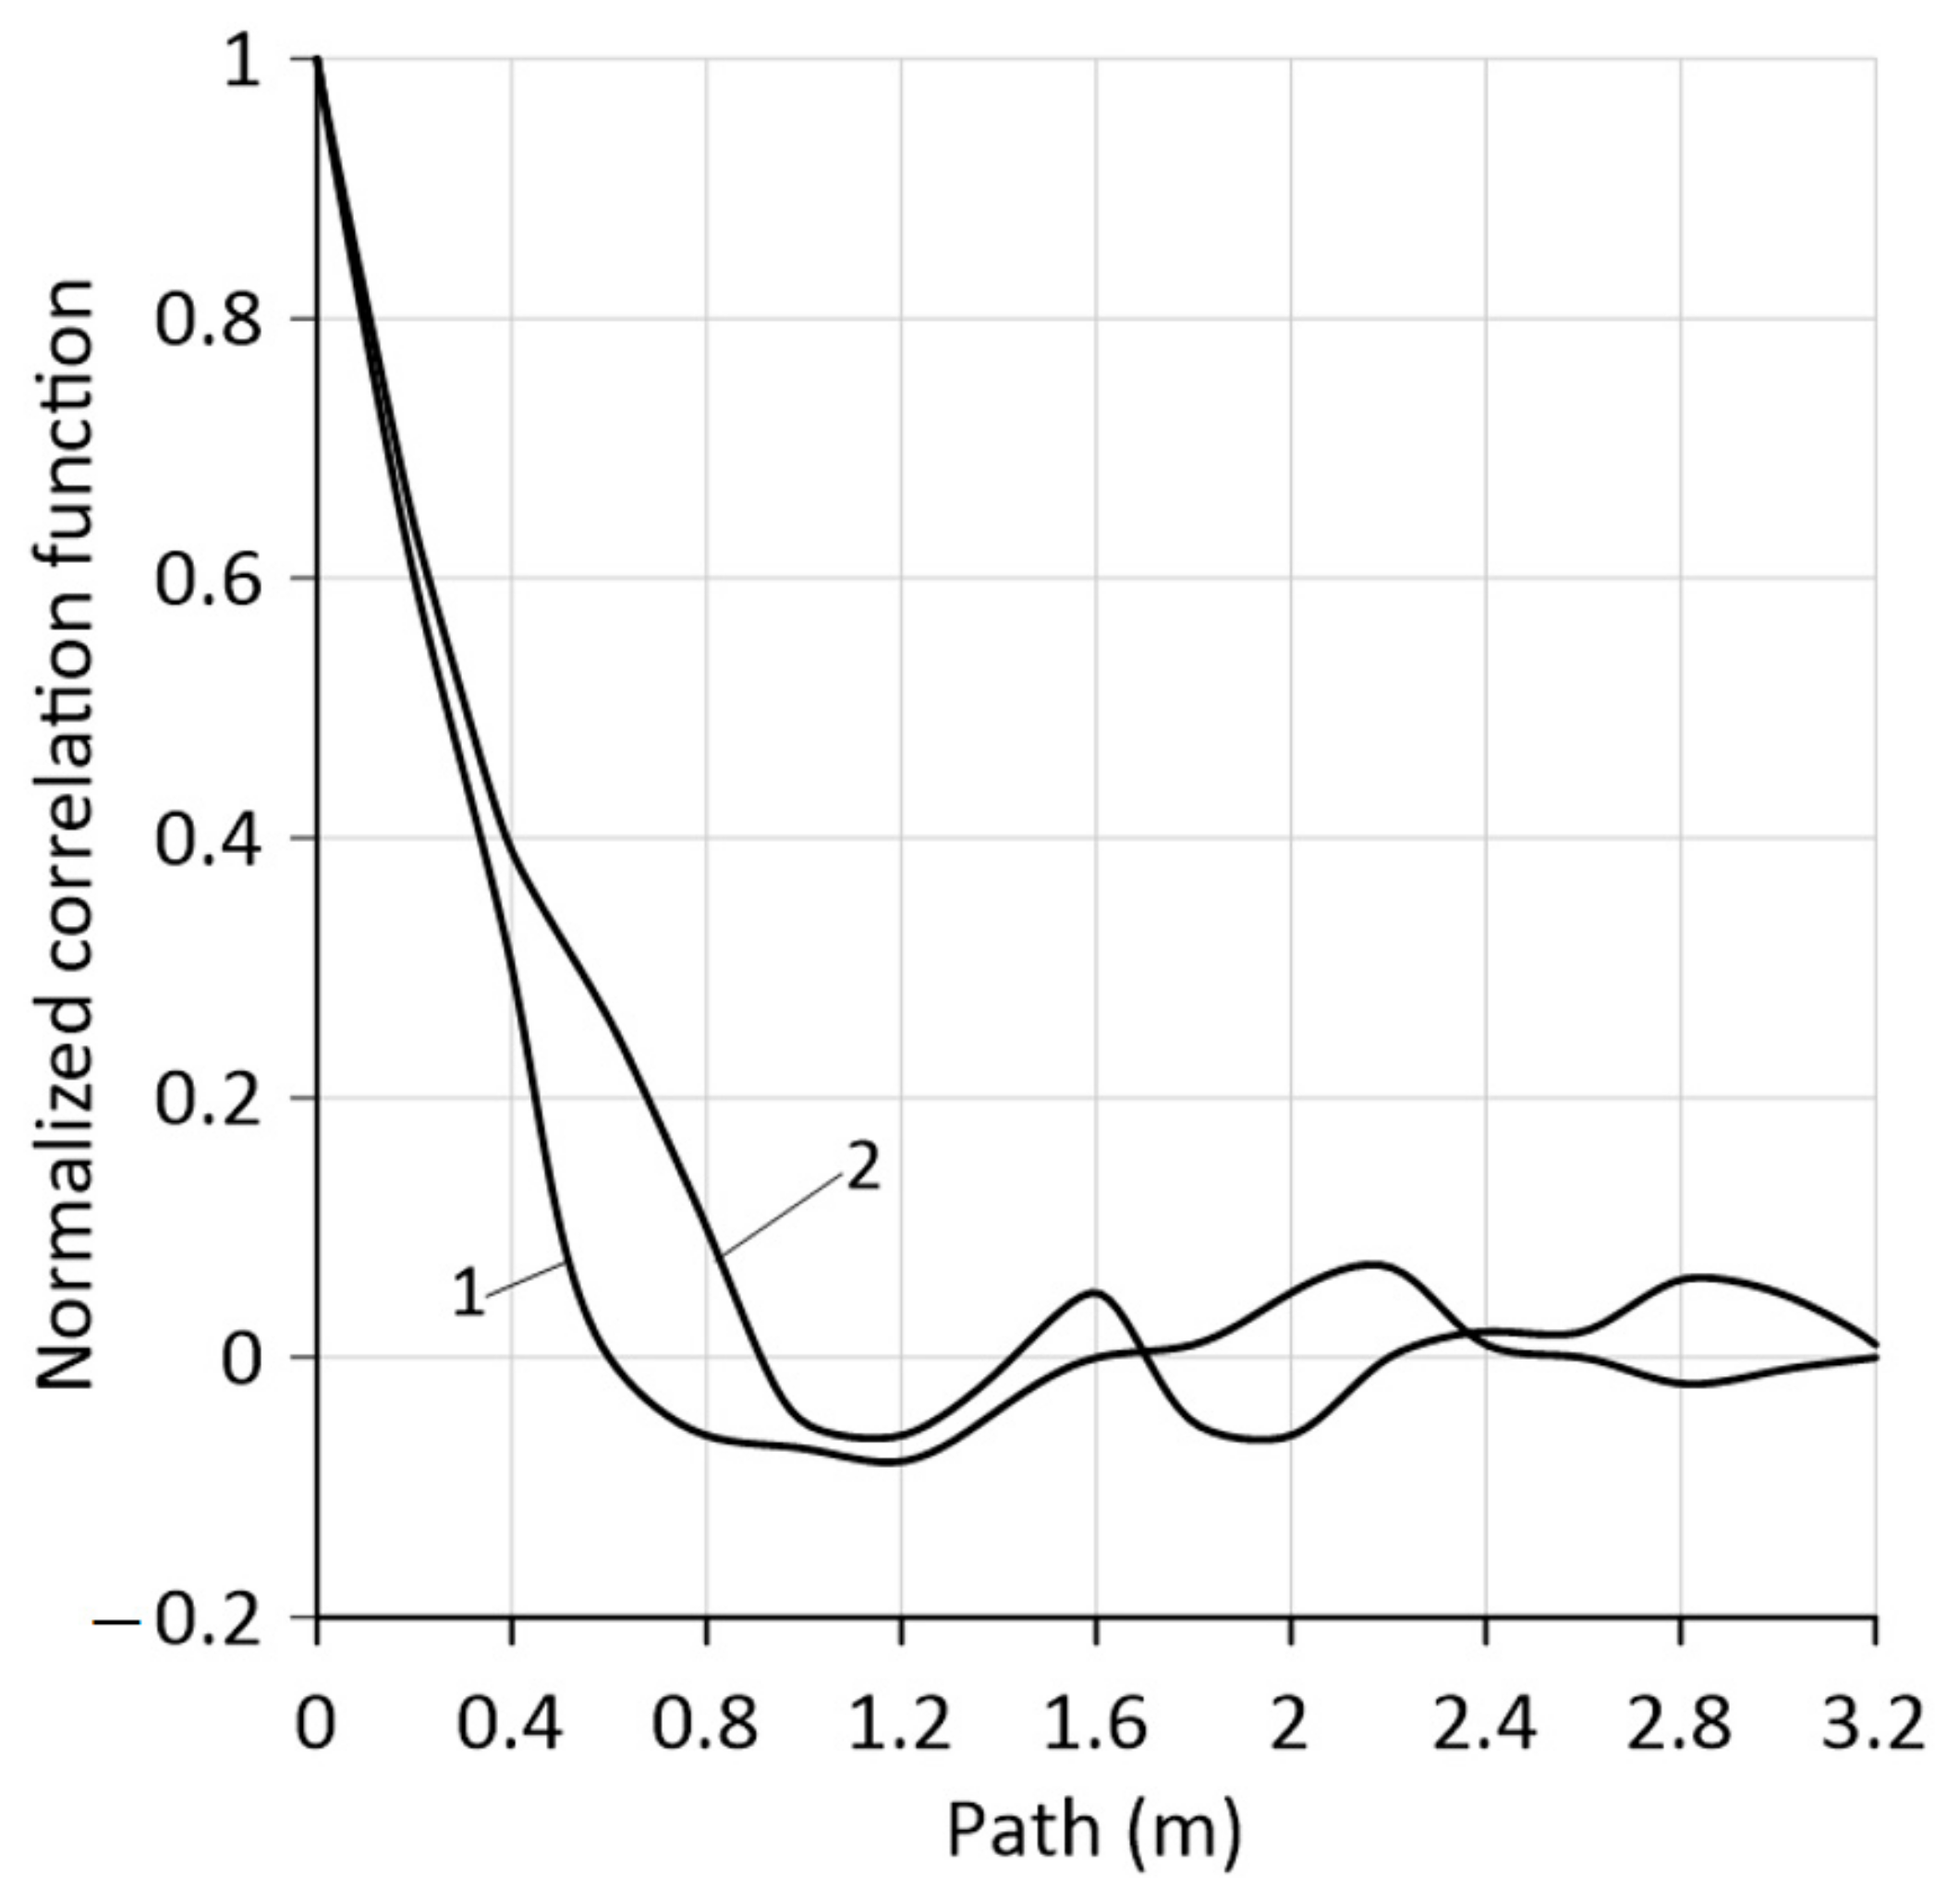
From the normalized correlation function analysis of oscillations in the soil-loosening depth, it follows that the correlation between the ordinates of this process disappears after 0.9 m (
Figure 5). Recall that the length of the correlation between the ordinates of any random process is the abscissa of the first achievement of the zero mark by the correlation function.
For the oscillations process of the field longitudinal profile, this abscissa (the length of the correlation) is 0.6 m (curve 1,
Figure 5). Compared to curve 2, this is 0.3 m less. Functionally, this means the following. Since the correlation of the correlation function 1 disappears earlier, the process of fluctuations in the field longitudinal profile is more high-frequency than the process of oscillations in the depth of soil loosening. The presence of some hidden periodic component is traced in the changing nature of the correlation function 1 (
Figure 5). However, the generator of these oscillations is unknown. Its definition requires special studies.
Note that the mean value of the oscillation half-period of the analysed correlation function 2 () is approximately 0.9 m.
The agrotechnically permissible oscillation in the soil-loosening depth (Δ) can be taken as for ploughing. In Ukraine, for example, this estimate is ±2 cm. Based on this, we take Δ = ± 2 cm. Considering that in our studies the value of the parameter 1.2 cm, from Equation (1), we obtain 0.14 m−1. In practice, this means that the soil-loosening depth in the strips can deviate from its mean value by ±2 cm once per 7.1 m of the unit’s path. With its movement mean velocity of 2.1 m·s−1, the frequency of the soil-loosening depth mean value exceeding ±2 cm is 0.14 · 2.1 = 0.29 s−1 or 0.05 Hz.
In general, approximately 95% of the oscillations’ variance in the strips’ loosening depth is concentrated in the frequency range of 0–8 m
−1 (curve 2,
Figure 6). At the soil tillage unit’s movement velocity of 2.1 m·s
−1, this is 0–16.8 s
−1 or 0–2.7 Hz.
Considering that the maximum oscillations variance in the soil-loosening depth in the strips is at a frequency of approximately 1.2 m−1 or 2.5 s (0.4 Hz), this oscillatory process can generally be considered rather low frequency.
At the same time, as noted above, it is lower frequency than the oscillations process of the longitudinal field profile. The same 95% of this parameter oscillations dispersion is concentrated in a wider frequency range equal to 0–11 m
−1 (curve 1,
Figure 6). At the same movement velocity of the tillage unit (2.1 m·s
−1), it is 0–23.1 s
−1 or 0–3.7 Hz. Moreover, the maximum oscillations dispersion of the field longitudinal profile falls on a higher frequency equal to 2 m
−1. Considering the high-speed movement mode of the soil cultivating unit, this is 4.2 s or 0.7 Hz.
The lower-frequency nature of the fluctuations in the depth of soil loosening compared to the oscillations process in the field profile can be explained as follows. During the movement of the soil cultivating unit, the front disc machine (harrow) loosens and levels the initial background of the field. The regular slipping of the tractor wheels accompanies the unit’s movement. The wheels of its front axle with their lugs increase the cut of the unevenness of the field profile. Due to this, the latter becomes more aligned in the longitudinal direction. Moving along a pre-aligned path, the tractor’s rear axle, if it makes vertical oscillations, will then do so with a minimal amplitude.
As a result, the tractor only moves the rear tillage machine (chisel plough) without causing its vertical vibrations. Because of this, the chisel plough makes only its movements in the longitudinal-vertical plane. But since they are small in amplitude and low in frequency, in the end, this has a positive effect on the course stability of this tillage machine in depth.
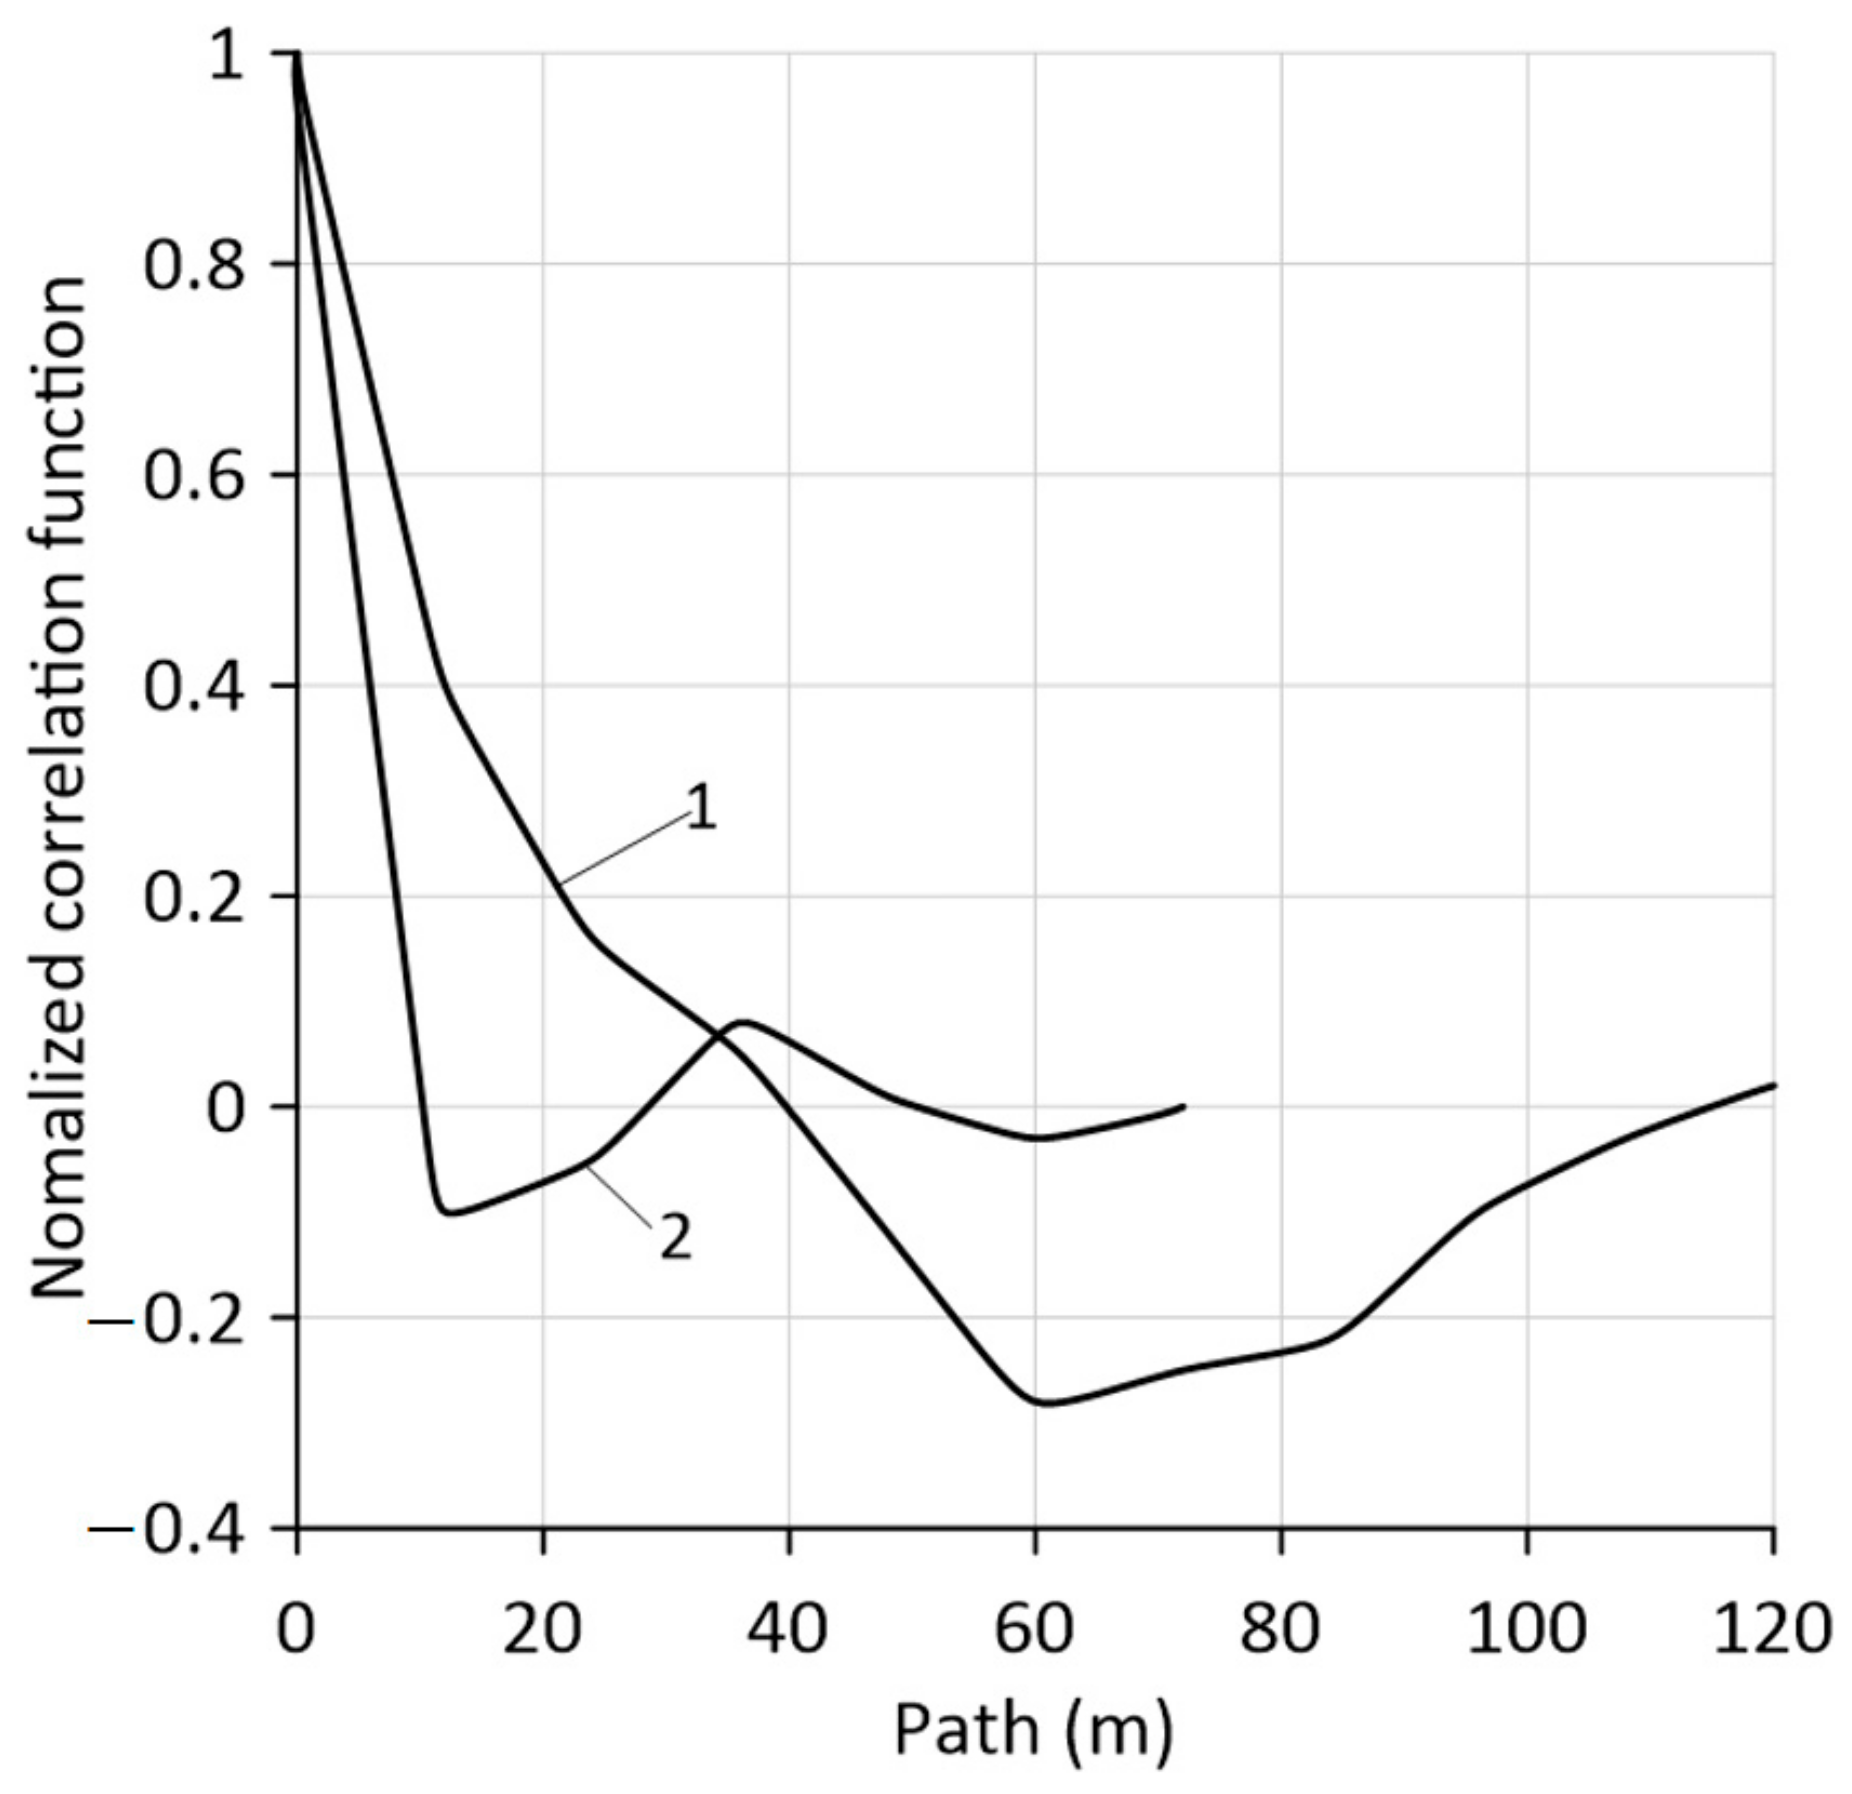
Important indicators of the investigated unit work quality are the non-straightness of the loosened strips and the stability of the spacing between their joints. As follows from the analysis of the study results, the mean value of the joint spacings between the unit’s adjacent passes was 71.1 ± 0.2 cm. The oscillations variance of this technological parameter is 1.84 cm
2. The correlation length for the process values under consideration is 10 m (curve 2,
Figure 7).
As follows from the analysis of the obtained correlation function, the process contains a latent periodic component. But if the oscillation period of the joint spacings is known and is approximately equal to 40 m, then the generator of their formation remains unclear. Special studies are required to determine this generator.
In contrast to the joint spacings, the loosened strips’ non-straightness oscillations are of lower frequency. Their variance is 1.08 cm
2. The correlation length of this process is approximately 40 m (curve 1,
Figure 7). It also contains some latent periodic component, the formation nature of which requires further study.
The corresponding normalized spectral densities (
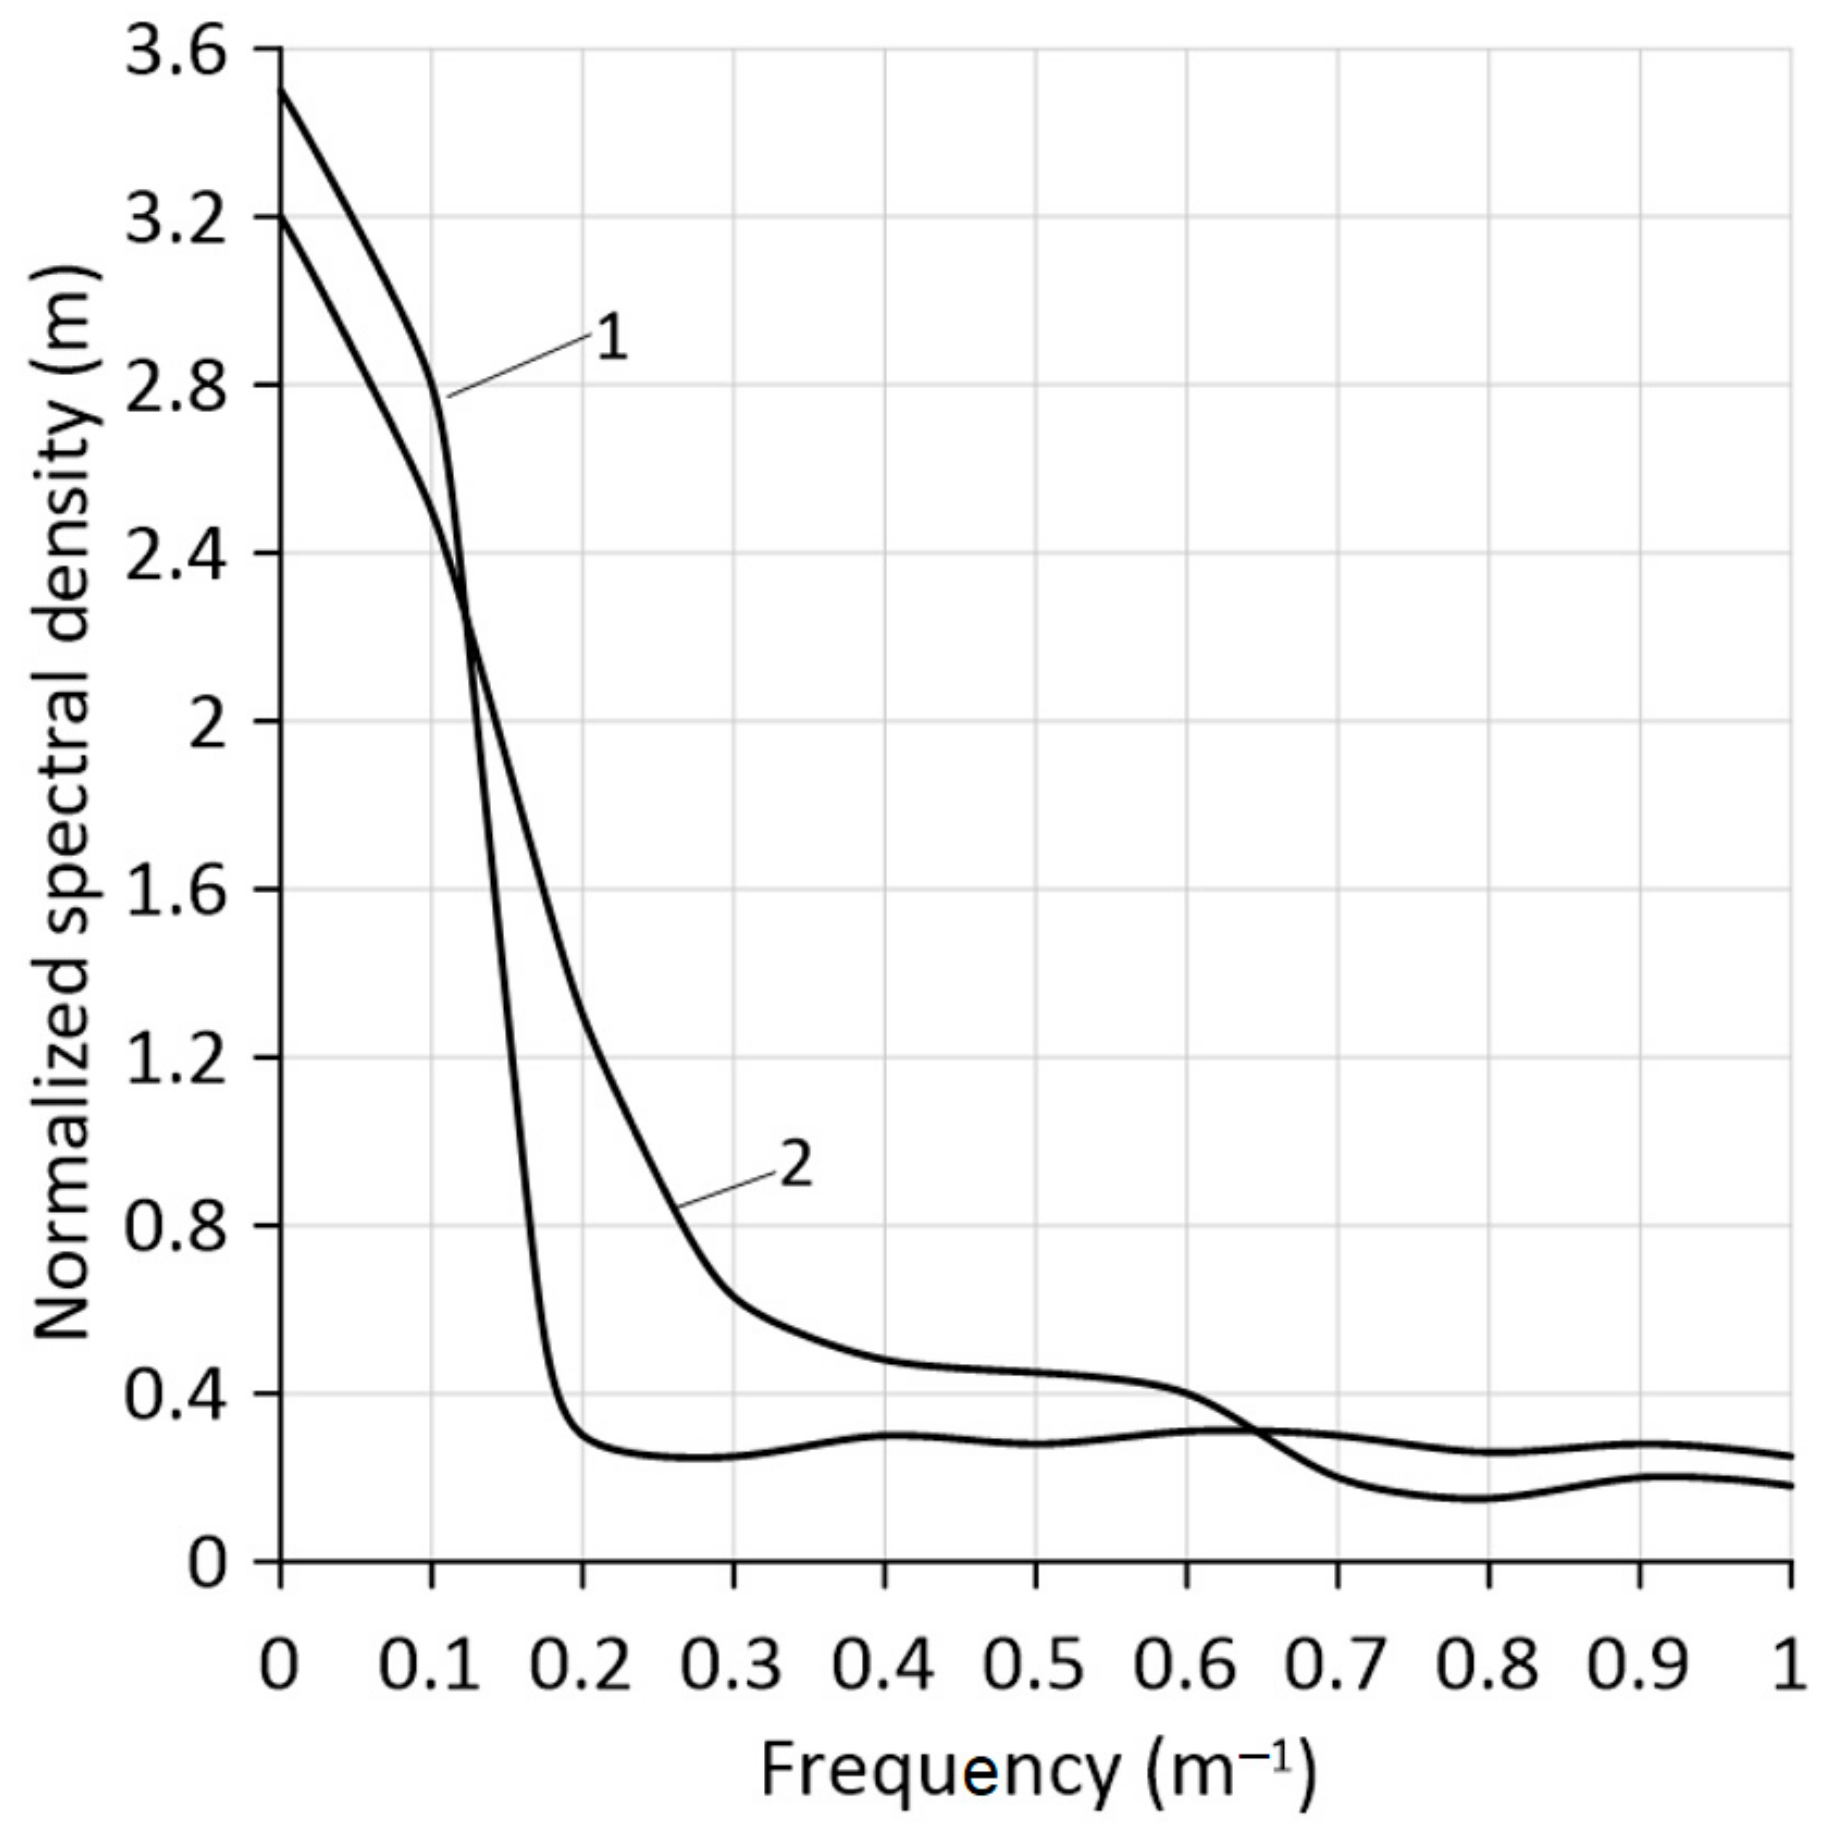
Figure 8) are direct evidence that the oscillations process of joint spacings is more high-frequency than the oscillations process of the loosened strips’ non-straightness.
As the analysis of these statistical characteristics shows, the main part of the oscillations’ variance (≥95%) in the non-straightness of the loosened strips is concentrated in a relatively narrow frequency range of 0–0.25 m
−1 (curve 1,
Figure 8).
At the same time, the frequency range, in which at least 95% of the variance of joint spacing oscillations is concentrated, is almost three times wider and is equal to 0–0.75 m
−1 (curve 2,
Figure 8).
Variance comparison of these two oscillatory processes (1.84 cm2 and 1.08 cm2) by the F-test shows that at a statistical significance level of 0.05, the null hypothesis of their equality is rejected. This result is explained by the excess of the actual F-test value, equal to 1.70, over the tabular value, which is 1.39.
Ideally, the same requirements for the loosened strips’ non-straightness should be met for the row crops’ rows. This is quite logical since these crops will be sown in the spring in the strips prepared in the fall. Therefore, the straighter the latter, the higher the probability of the sowing unit’s high-quality work.
In Ukraine, the sown crops’ non-straightness is considered satisfactory under the following conditions [
22]:
where:
The parameter
corresponds to the normalized spectral density value of the oscillatory process (
), which is equal to:
where:
Analysis of
Figure 8 shows that for process 1, the spectral density is
= 3.7 m, and for process 2,
= 3.2 m. In this case, from expression (4), we obtain that for process 1, the value of the spectral density
is equal to 0.19 m. For oscillatory process 2, the value of the parameter
is 0.16 m. The obtained values of parameters
correspond to the following cutoff frequencies: for process 1,
= 0.25 m
−1, and process 2,
= 0.75 m
−1.
As one can see, these are exactly the values of the cutoff frequencies that we have already mentioned in the above analysis (
Figure 8). Having analysed these cutoff frequencies, we conclude that the oscillations process in the non-straightness of the loosened strips corresponds to the condition (3). The oscillations process in joint spacings does not meet this condition since the actual value of the frequency
for it (
= 0.75 m
−1) is three times higher than the estimated one, equal to 0.25 m
−1. As for the variances, for both compared oscillatory processes, the values of these statistical parameters are within the requirements of condition (2).
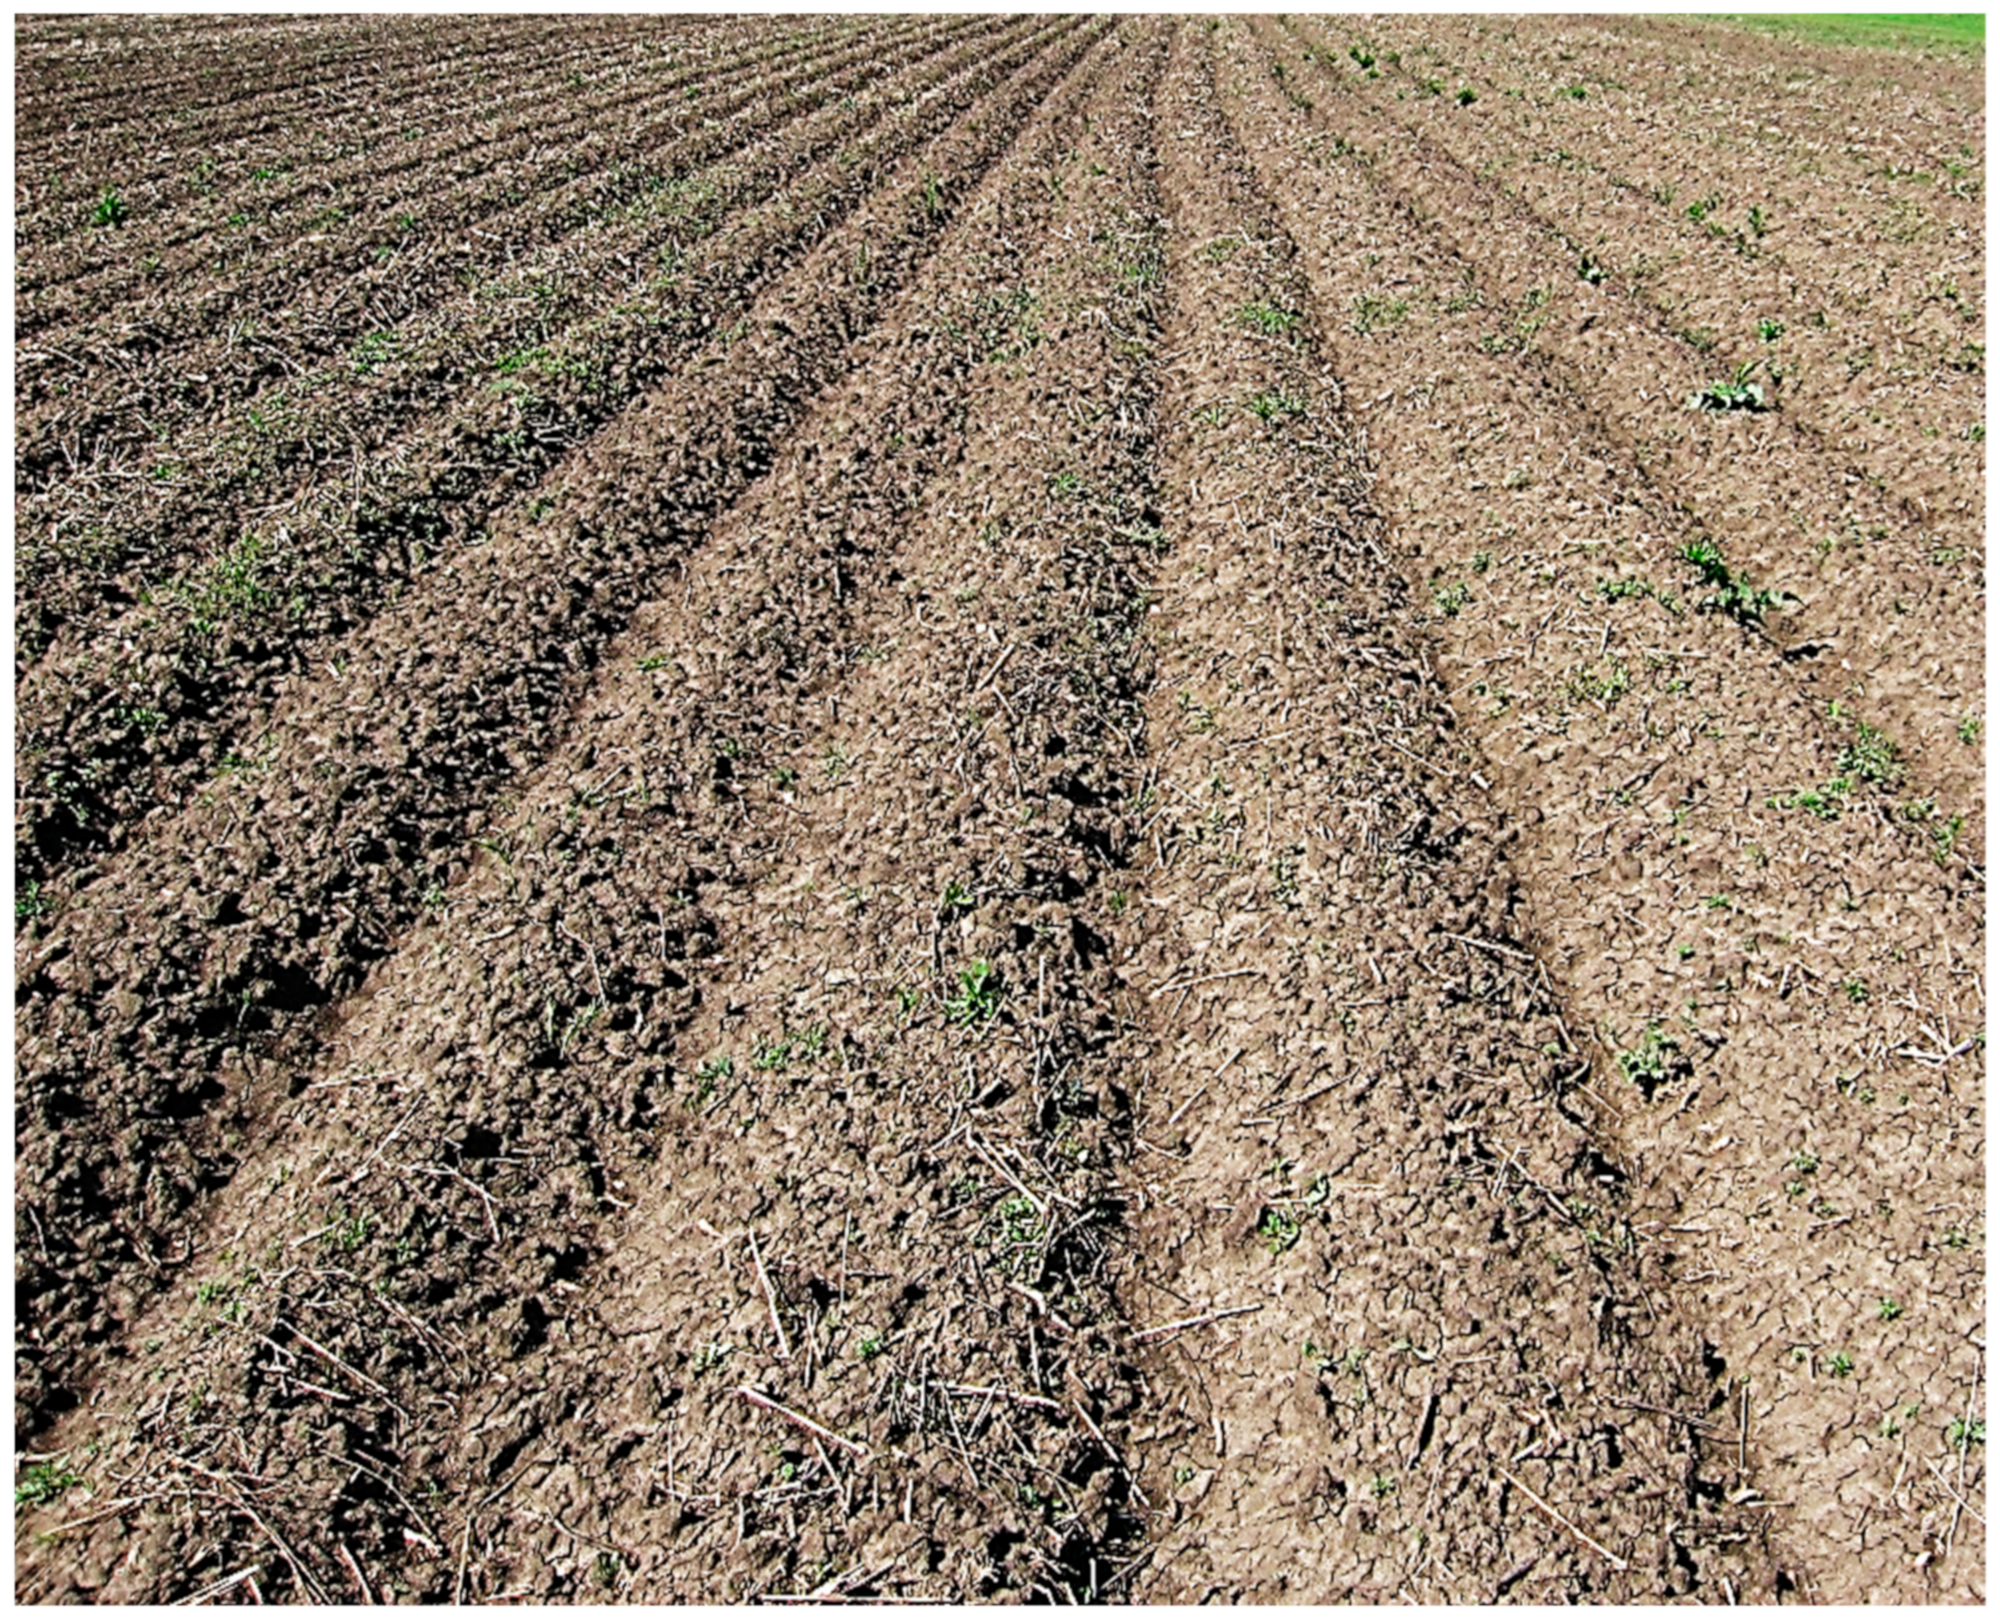
The field background, formed in the spring after the snow melted and the soil dried up, had the form shown in
Figure 9. Its characteristic feature is soil mounds (berms) 8–11 cm high. It should be noted that berms of approximately the same height (7–10 cm) have been obtained by other researchers using strip-till technology to grow maize in a corn–soybean rotation [
23].
However, these researchers did not loosen the strips with a chisel plough but with a special machine with rotary working bodies. They used a chisel plough with a spacing of 400 mm between the working bodies only for the primary tillage in autumn.
