Article

Use of Visible Spectral Index and Soybean Plant Variables to Study Hidden Nematicide Phytotoxicity

by
Ernane Miranda Lemes
1,*,
Maria Amélia dos Santos
1,
Lísias Coelho
1,
Samuel Lacerda de Andrade
2,
Aline dos Santos Oliveira
1,
Igor Diniz Pessoa
1 and
João Paulo Arantes Rodrigues Cunha
1
1
Institute of Agricultural Sciences (ICIAG), Federal University of Uberlândia (UFU), Uberlândia 38400-902, Brazil
2
Institute of Geography (IG), Federal University of Uberlândia (UFU), Monte Carmelo 38500-000, Brazil
*
Author to whom correspondence should be addressed.
AgriEngineering 2023, 5(4), 1737-1753; https://doi.org/10.3390/agriengineering5040107
Submission received: 2 August 2023 / Revised: 26 September 2023 / Accepted: 27 September 2023 / Published: 2 October 2023

Abstract

:
Significant crop losses are due to plant-parasitic nematodes. Nematicides are expensive and potentially toxic to men, the environment, and plants. This study evaluated the hidden phytotoxicity effects of nematicides in soybeans. Two soybean cultivars (8473RSF and M7198IPRO) were evaluated with five nematicide treatments (biological, cadusaphos, abamectin, fluensulfone, and an untreated control) for changes in chlorophylls, biometrics, and spectral (TGI visible spectral index captured with a smartphone camera) variables to determine and anticipate the identification of plant stresses. Evaluations occurred 33, 47, and 66 days after sowing (DAS). The a/b chlorophyll proportion was greatest for M7198IPRO and cadusaphos. The chlorophyll variables did not present significant interactions or differences at 47 DAS, indicating that possible nematicide effects were transient and should be evaluated earlier than 33 DAS. Leaf area, leaf mass, and shoot mass were smaller for 8473RSF and outstanding for abamectin and fluensulfone. The response of the spectral index did not present significant interaction among the factors; however, at 33 and 47 DAS, the index was low for 8473RSF and lowest for cadusaphos only at 33 DAS. The correlations between the spectral index and other variables were significant and moderate for soybean total leaf area. Although no apparent phytotoxicity symptoms caused by nematicides were observed, the visible vegetation index generated using a smartphone camera can still improve crop management solutions.

1. Introduction

Soybean is the leading agricultural commodity in Brazil due to its strategic value and multiple uses. Brazil is the top soybean producer in the world, with a cropping area of 44.1 million hectares and a grain production of 154.6 million tons [1]. This high production results from combined factors such as genetically improved cultivars and proper crop management associated with modern technologies. However, even using the best cultivars and cropping techniques during crop cultivation, agricultural production is constantly subjected to stresses that reduce crop performance and yield.
One of the leading causes of yield reduction is the occurrence of diseases in plants, either of edaphoclimatic or biological origin. Plant diseases caused by edaphoclimatic conditions—or abiotic diseases—are those that are not caused by microorganisms and are fundamentally due to nutritional disturbances (excesses or deficiencies), phytotoxicity caused by chemical products, insolation, and soil pH, temperature, moisture, and salinity extremes [2,3]. In contrast, biological or biotic diseases are caused by plant-pathogenic microorganisms [4,5,6].
Among the microorganisms that cause plant diseases are the nematodes, or phytonematodes, belonging to the phylum Nematoda [7]. More than 4100 nematode species are described as plant parasites [8], and new species are frequently reported. The occurrence, prevalence, and extension of damage caused by a plant-parasitic nematode are related to its initial population, susceptibility of the plant host, crop management practices, soil characteristics, and climate conditions [9,10]. However, early identification of an epidemic onset is a decisive factor in reducing the damage caused by phytonematodes, allowing the planning and execution of management measures.
Among the most damaging and destructive phytonematodes are the genus Meloidogyne (root-knot nematodes), whose crop losses are estimated at 5% worldwide [11] but easily cause greater losses under favorable conditions. More than 5500 plant species in all regions of the world host the 98 species of this genus, and the economic threshold of some of the Meloidogyne species can be as low as 1 egg per 100 cm3 of soil [12,13,14]. General symptoms of infection by root-knot nematode include deformation of host plant roots, stunting, leaf chlorosis (physiological alterations), early defoliation, severe reduction in production, and early death [15,16].
Control methods used for phytonematode management include eliminating crop residues, soil fallow and turning, balanced mineral nutrition, antagonist plants, biological control, organic fertilization, solarization, biofumigation, induction of plant resistance, exclusion, and seed biopriming [17,18,19,20,21]. In addition, planting resistant cultivars, crop rotation, and chemical control (nematicides) are frequently used to manage the phytonematodes. However, nematicides can be expensive, potentially toxic, and cause considerable environmental impacts.
Nematicide application can be via seed treatment [22], in the sowing furrow [23,24], or by leaf spraying [25,26], and its results are variable, suggesting that the application mode can affect plant physiology too. This plant’s physiological reaction can be due to the reduction in the phytonematode population or the phytotoxic effects caused by the nematicide, which is not always perceptible to the bare eye.
Phytotoxicity occurrence is an important aspect of nematicide application [27,28,29,30,31]. The evaluation of phytotoxicity occurrence and intensity is usually based on visual scales and damage caused [32]. This method can lead to “false negatives” when a plant is stressed but shows no apparent visual symptoms.
The detection of stressed plants can be improved by using images composed of separable electromagnetic spectrum bands. The spectral bands can be arithmetically combined to calculate spectral vegetation indexes (SVI). These indexes can express early alterations in the physiological and morphological parameters of the analyzed vegetation [33] and separate the foliage from other targets on the ground surface.
The SVI can indicate physiological processes, vegetation vigor, and unhealthy vegetation under stressful conditions [34,35,36,37,38,39,40,41]. The use of visible RGB (visible red-green-blue spectral bands) indexes, such as the triangular greenness index (TGI) [42,43], amplifies the range of sensors for plant monitoring, including smartphone cameras [44] and apps [45] as tools for crop monitoring and management.
Spectral vegetation indices can monitor the efficacy of phytonematode control through the symptoms observed on shoots and identify underlying phytotoxicity (not visible to the bare eye) caused by applied nematicides. Such early identification of stress in soybeans—caused by the root-knot nematode or its chemical treatment—might help control this pest and improve the chances of successful management [20,46,47,48]. Therefore, this study evaluated the correlation between the chemical and biological control of phytonematodes and the possible occurrence and intensity of underlying phytotoxicity through chlorophyll contents and biometric parameters (leaf area and biomass). Furthermore, this study intended to anticipate the detection of such stress through a visible vegetation spectral index using a smartphone in soybean varieties.

2. Materials and Methods

2.1. Experimental Area and Soybean Cultivars

The experiment was performed in a greenhouse covered with clear LDPE (low-density polyethylene) and sides protected with an anti-aphid screen at the Universidade Federal de Uberlândia, in Uberlândia, Brazil, located at 18°53.00’ S, 48°15.25’ W, at 938 m above sea level. No thermic or moisture control was present in the greenhouse. The region’s climate is Aw (tropical with a dry winter and a rainy summer) [49,50].
Two soybean cultivars were evaluated: 8473 RSF (BRASMAX®), susceptible to M. incognita, and M7198 IPRO (MONSOY®), resistant to M. incognita. Four seeds were sown after applying nematicide treatments per pot (4 L capacity, with four 1 cm diameter holes in the bottom) in December 2018. Seven days after sowing, the seedlings were thinned to two per pot. The average air temperature varied between 27 and 28 °C, and maximum daily temperatures were below 32 °C during the experiment (weatherspark.com, accessed on 2 April 2019).

2.2. Planting Substrate and Fertilization

The substrate used for growing soybeans was subsoil and sand (1:1 volume), homogenized, and sieved through a 0.4 cm mesh. Texture analysis of the substrate indicated 847, 8, and 145 g kg−1 of sand, silt, and clay, respectively. Approximately 4 kg of the substrate were used to fill each pot lined with filter paper (250 g m2). Nematological analysis of the substrate did not indicate the presence of plant-parasitic nematodes.
Ten days before sowing, fertilization equivalent to 500 kg ha−1 of 20-5-15 N-P-K (20% of N, 5% of P2O5, 15% of K2O) and 1100 kg ha−1 dolomitic lime were mixed with the substrate, filled in the pots, and watered until saturation. Five days before sowing and every 15 days after sowing, 30 mL of a nutrient solution containing macro and micronutrients (N, P, K, Ca, Mg, S: 15, 1, 6, 5, 2, and 2 mmol L−1, respectively; B, Cu, Fe, Mn, Mo, Zn: 46, 0.3, 90, 12.6, 0.1, and 1.3 μmol L−1, respectively) [51] were added to the pots. The pots were maintained over plates to retain excess solution and were watered daily, conserving moisture but not soaking them.
The necessary plant care regarding nutrition and watering was provided. Insects and weeds in the substrate were mechanically controlled. No significant soybean plant disease was detected during the plant cycle, and no bactericide or fungicide was applied. Therefore, any detectable alteration in plant variables (e.g., leaf chlorophyll contents, plant biometrics, spectral responses) should be caused by the only source of variation in the present study, the nematicide treatments.

2.3. Nematicide Treatments

Nematicide treatments included a neutral control (with no nematicide application), a biological control agent, and three chemical products. The description, application mode, and recommended dose for each treatment are listed in Table 1.
In-furrow treatments were applied using a backpack sprayer pressured with CO2 (0.2 MPa) 0.5 m above the pots, with flat jet nozzles model Magnojet BD 02 in each treatment.
The experimental design was randomized blocks as a 2 × 5 factorial, with two soybean cultivars [8473 RSF (Brasmax, Cambé, PR, Brazil) and M7198 IPRO (Monsoy, São Paulo, SP, Brazil)] and four nematicide treatments [control, biological (Rizoflora, Viçosa, MG, Brazil), cadusaphos (FMC, Campinas, SP, Brazil), abamectin (Syngenta, São Paulo, SP, Brazil), and fluensulfone (Adama, Londrina, PR, Brazil)] and an untreated control with 12 replications.

2.4. Evaluations

Each pot was photographed at 33 (beginning of flowering) and 47 (end of flowering) days after sowing, during a clear day (no clouds), between 10 and 13 h inside the greenhouse covered with LDPE. An easily accessible digital camera was used from a Samsung GT-I8552B® (RGB camera with 8 MP resolution) smartphone, which was positioned at 1.2 m above the planting media level and fixed horizontally flat over the soybean plant canopies.
The histogram of the images in RGB was equalized using the program Photoshop LightRoom® v.5.7. Equalized images were used for the composition of the images based on the TGI vegetation spectral index using the program ENVI® v.5.5. The TGI images of the soybean shoots were classified into five distinct colors using the program Quant® [52], which also allows the quantification of the image relative areas (cm2) according to the resulting colors. Lemes et al. [53] reported the image treatment procedures demonstrated in Figure 1.
Chlorophylls a and b were estimated on the same day the pictures were taken. Measurements were performed in duplicate in the middle leaflet of a trifolium of the middle third of the plant, in each of the two plants, in four chlorophyll measurements per experimental unit (pot). A digital chlorophyll meter (ClorofiLOG, model CFL1030—Falker) was used, and its reading is considered Falker’s Chlorophyll Index (FCI)—this unit indirectly determines the chlorophyll concentration by the intensity of the green color of the leaves [54]. The FCI values of a and b chlorophyll of the two plants were converted into their respective averages and added to obtain total chlorophyll (a + b) or divided to generate the chlorophyll proportion (a/b).
The total leaf area (cm2) of the two plants in each pot was determined with a digital leaf area meter (LI-3100C, Li-Cor Bioscience®, Lincoln, NE, USA) 66 days after sowing (February 2019). The leaves and the remaining parts of the shoots of the plants in each pot were dried in a forced air oven at 68 °C for 96 h to determine leaf and total shoot dry matter.
Correlations between the variables evaluated were computed to determine if there was a linear relationship between them [55].

2.5. Statistical Analysis

Boxplot graphs of the residues identified extreme values (outliers) in the data for each variable [56]. The boxplot graphs were generated in the SPSS Statistics® v. 20 software. The same software was used to confirm the basic assumptions for the analysis of variance (normality of residue distribution by Kolmogorov-Smirnov and homogeneity of variances by Levene, both at p > 0.01) and Pearson’s correlation coefficients between variables. To avoid errors associated with the computation and interpretation of Pearson’s correlation, it is fundamental that the data be normally distributed with no outliers (extreme values) [57].
After confirming the assumptions, the analysis of variance (F test) was performed. When significant differences were observed among treatments, Tukey’s test or t-test (LSD) comparisons were made at 0.05 significance. These analyses were performed using the SISVAR® statistical program. Sigma Plot® v.12 software generated the graphs.

3. Results

3.1. Analysis of Variance

Significant interactions (p < 0.05) were found between nematicide treatments and soybean cultivars for chlorophylls a, b, and total (a + b) at 33 days after sowing (Table 2). The biometric variables leaf area, leaf mass, and shoot mass presented significant differences (p < 0.05) between the factors ‘cultivar’ and ‘nematicides’. The spectral response of soybean shoots obtained by the TGI index did not present significant interactions between the factors; however, differences were observed between cultivars (p < 0.01) in both periods evaluated (33 and 47 days after sowing) and among the nematicides only at 33 days after sowing (p < 0.05).

3.2. Falker Chlorophyll Index

Chlorophylls a, b, and a + b of cultivar 8473 RSF, at 33 days after sowing, presented lower FCI compared to the control in the treatment with the nematicide Cadusaphos (p < 0.05) (Table 3). None of the nematicide treatments affected the chlorophyll evaluations (p > 0.05) of cultivar M7198 IPRO.
Falker’s chlorophyll index in the control treatment (no nematicides) indicated similar amounts of chlorophylls a and total (a + b) (p > 0.05) between both soybean cultivars; however, FCI also indicated 10.13% more chlorophyll b in this treatment (no nematicides) for cultivar 8473 RSF. In addition, for this cultivar, greater indices for chlorophyll b and total (a + b) were observed for the biological (14.37 and 5.64%, respectively) and abamectin (9.03 and 5.03%, respectively) treatments than for M7198 IPRO. Nematicide treatment with fluensulfone affected only chlorophyll a (p < 0.05) index, and FCI was smaller (3.88%) for cultivar 8473 RSF than for cultivar M7198 IPRO.
Treatment with the nematicide cadusaphos negatively affected the cultivar with no resistance against phytonematodes (8473 RSF), reducing total chlorophyll (a + b) by up to 4.8% compared to the cultivar with resistance against these pathogens (M7198 IPRO).
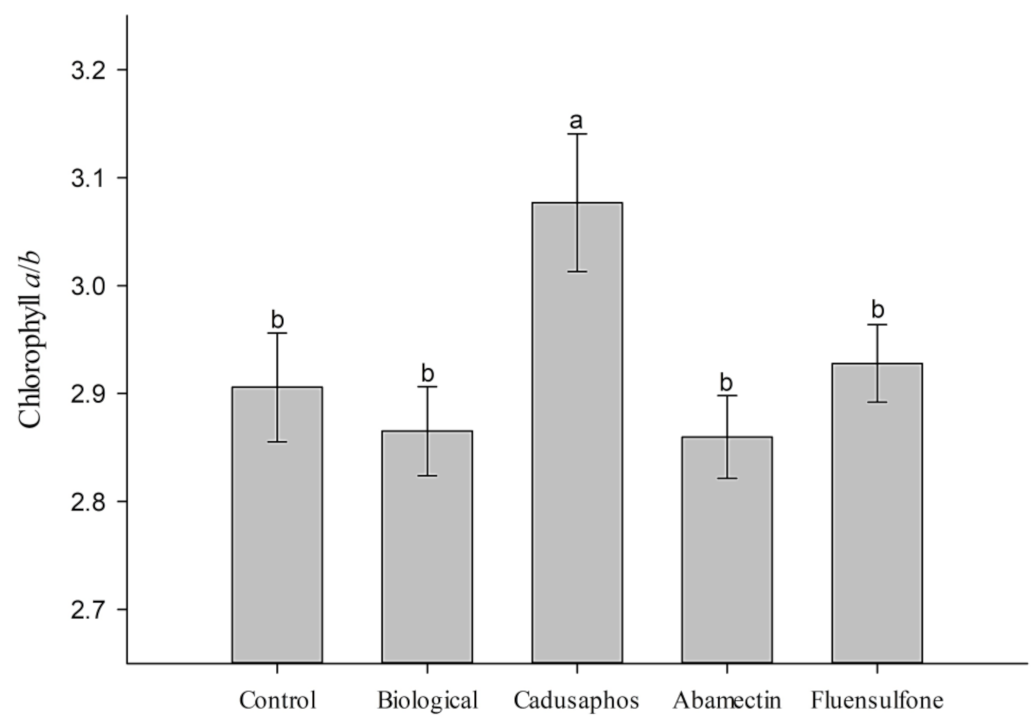
No significant correlation (p > 0.05) was observed for the proportion of chlorophylls a/b at 33 days after sowing but differed for the factors ‘cultivar’ and ‘nematicides’ (p < 0.05). The proportion of chlorophylls a, b, and (a/b) between the soybean cultivars was greater for M7198 IPRO (3.01) than for 8473 RSF (2.85). This proportion (a/b) was greater for the treatment with cadusaphos (3.08), which was 6.17% greater than all other treatments (average: 2.89) (Figure 2).
The FCI for the chlorophylls a, b, a + b, and a/b did not present significant interaction (p > 0.05) between the factors ‘cultivar’ and ‘nematicide’ or significant differences (p > 0.05) between the levels in each factor (Table 2) at 47 days after sowing. The average FCI of the cultivars 8473 RSF and M7198 IPRO were: 25.41 and 24.92 (chlorophyll a), 7.47 and 7.26 (chlorophyll b), 32.88 and 32.18 (chlorophylls a + b), and 3.41 and 3.45 (chlorophylls a/b), respectively.

3.3. Leaf Area, Mass, and Shoot Mass

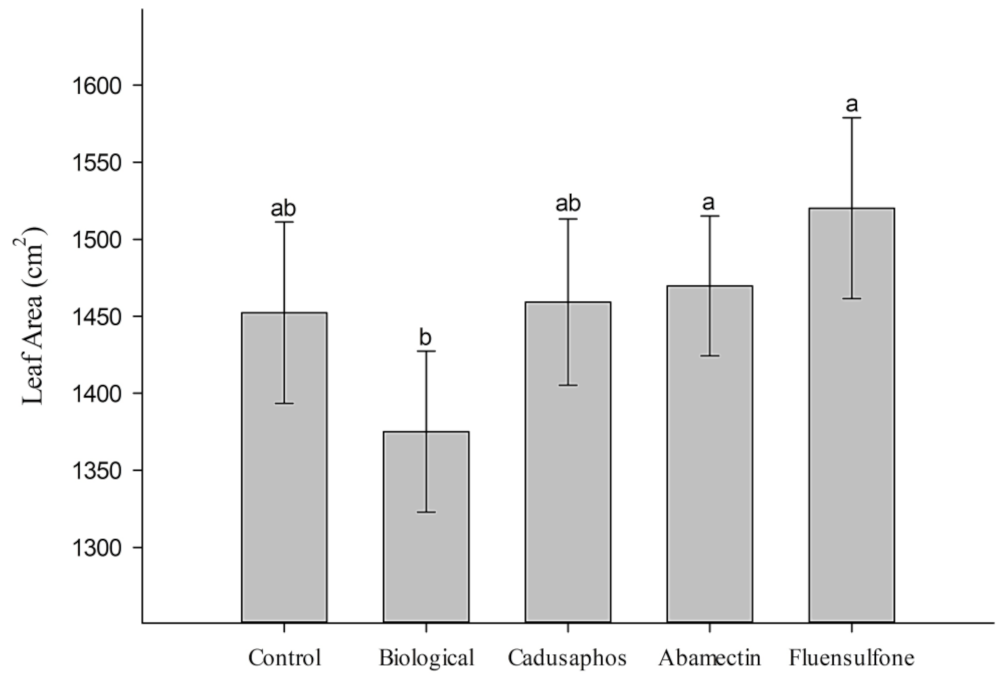
The leaf area of soybeans differed (p < 0.01) between the cultivars analyzed and among the levels of the factor ‘nematicide’ (p < 0.05) at 66 days after sowing (Table 2). The leaf area of cultivar 8473 RSF (1265 cm2) was 23.2% smaller than that of cultivar M7198 IPRO (1646 cm2). The leaf area of each nematicide treatment is shown in Figure 3. The biological nematicide (1375 cm2) treatment differed from the treatments with nematicides abamectin (1470 cm2) and fluensulfone (1520 cm2), which are 6.46 and 9.54% smaller, respectively.
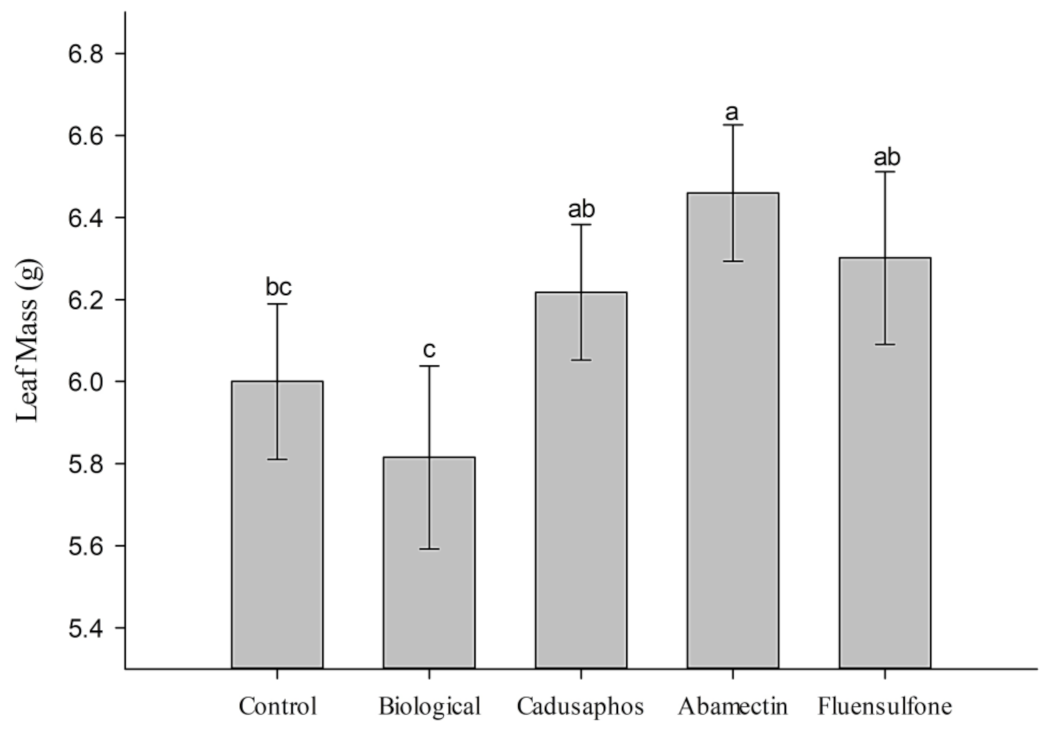
Similar to what was observed with leaf area at 66 days after sowing, dry leaf matter (g) also differed between the cultivars (p < 0.01), with cultivar 8473 BRS presenting 14.61% less dry matter than M7198 IPRO, which was 5.67 and 6.64 g per plant, respectively. Leaf dry matter for the nematicide treatments is shown in Figure 4. Treatments with cadusaphos, abamectin, and fluensulfone were similar (average: 6.33 g) and 8.21% greater than the treatment with the biological nematicide (5.82 g).
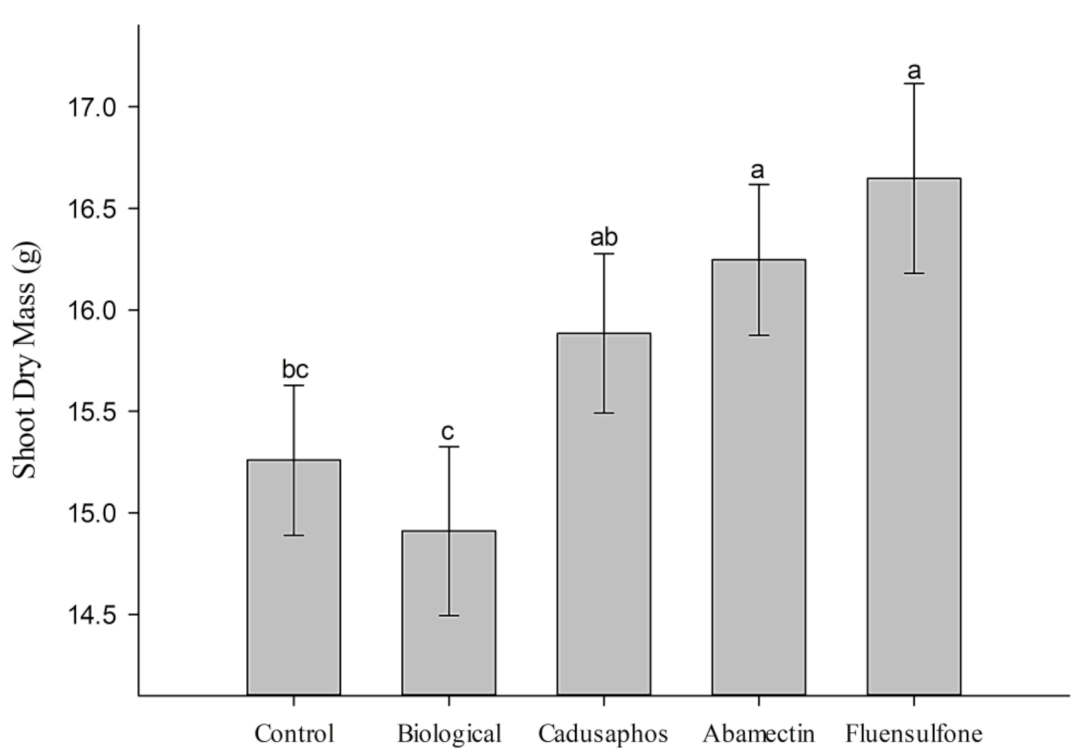
Shoot dry matter at 66 days after sowing (g) also differed between the cultivars (p < 0.01), with cultivar 8473 BRS presenting 9.53% less dry matter than M7198 IPRO, which was 15.00 and 16.58 g per plant, respectively. Shoot dry matter for nematicide treatments is presented in Figure 5.
The absolute control (no nematicides) and the biological one presented similar shoot dry matter (average: 15.09 g); the chemical treatments (cadusaphos, abamectin, and fluensulfone) were also similar to each other (average: 16.26 g). The greatest difference was observed between the biological control (14.91 g) and fluensulfone (16.65 g), corresponding to 9.91% more shoot dry matter in the plants treated with this nematicide.

3.4. Vegetation Spectral Indexes

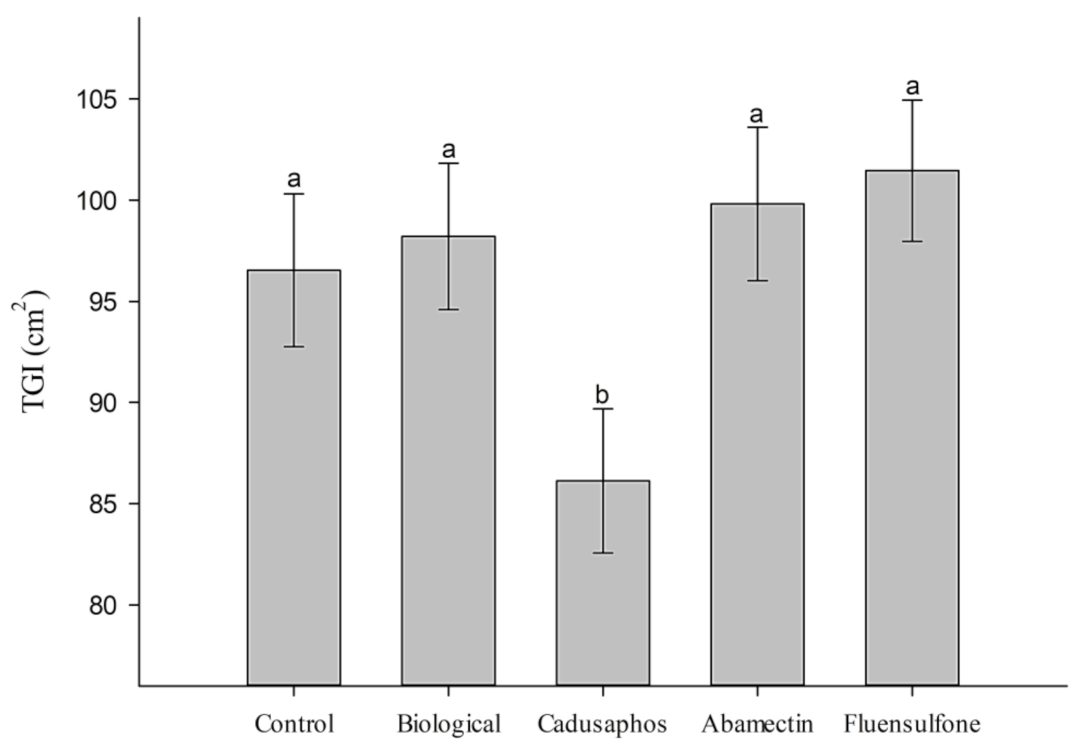
The interaction between the factors ‘cultivar’ and ‘nematicides’ was not significant (p > 0.05) for the response of the spectral index TGI at 33 days after sowing. The TGI distinction of the canopy area of the 8473 RSF soybean cultivar (90.69 cm2) was 12.64% lower than the TGI area observed for the M7198 IPRO soybean cultivar (102.15 cm2). The values observed for the index TGI (cm2) within the factor ‘nematicide’ at 33 days after sowing are presented in Figure 6. Among the nematicide treatments, the soybean shoot area distinguished by TGI for cadusaphos (86.12 cm2) was 13.01% lower than the other treatments (average: 99.00 cm2).
At 47 days after sowing, the spectral response obtained with the index TGI presented significant differences only between the two soybean cultivars. Cultivar 8473 RSF (150.54 cm2) was 27.58% smaller than M7198 IPRO (207.88 cm2).

3.5. Correlations

Pearson’s correlation coefficient (r) expresses how much of an association of quantitative variables can be described by a linear function. This correlation is computed through the relationship between the two variables’ grouped variance (covariance) and the product of their respective standard deviations.
To increase the precision of the computation and the interpretation of Pearson’s correlation, it is important that the data be normally distributed (Kolmogorov-Smirnov’s statistics, Table 2) and that outliers (extreme values) be removed [58]. The coefficients of correlation between all pairs of variables evaluated in this study are presented in Table 4.
Falker’s chlorophyll index for the chlorophylls a, b, and a + b, estimated at 47 days after sowing, presented a significant Pearson’s r coefficient (p < 0.05) with the leaf area at 66 days after sowing, a negative correlation; however, this was a weak correlation, according to the proposal of Callegari-Jacques [59]. Leaf area also correlated (p < 0.01) with leaf and shoot dry matter, and these correlations were strong and positive (0.6 < r < 0.9).
A significant correlation was found between the spectral index TGI at 33 days after sowing with the chlorophyll b, total (a + b), and proportion (a/b) of this period, and with leaf area (cm2) and dry leaf and shoot matter (g) at 66 days after sowing. All significant correlations with TGI at 33 days after sowing and the variables at 66 days after sowing were positive, weak, or moderate [59]. The index TGI, at 47 days after sowing, presented a significant correlation (p < 0.05), negative and weak, with chlorophyll a and the total (a + b) of that period. Significant correlations (p < 0.01), positive and moderate (0.3 < r < 0.6), were detected between leaf area (cm2) and dry matter (g) of leaves and shoots at 66 days after sowing (Figure 7).

4. Discussion

Chlorophyll contents reflect physiological aspects of a plant, such as its nitrogen content, photosynthetic rate, and potential yield; in this study, chlorophyll content was estimated due to its direct relation to the occurrence of natural or anthropogenic stresses [60,61,62]. The results consistently demonstrated that nematicide treatments did not affect the contents of chlorophyll a, b, and total (a + b) for either cultivar at 33 days after sowing or presented any effect at 47 days after sowing. These results show that if nematicide treatment affects soybean chlorophylls a, b, and total (a + b), such an effect should be evaluated earlier in the soybean development cycle.
Despite several reports of phytotoxicity levels with nematicide application [30,63,64,65,66], no reports of cadusaphos phytotoxicity in soybeans were found in the literature reviewed, even when the seedlings were evaluated 20 days after emergence [67]. In the present study, results obtained with FCI for chlorophylls a, b, and total (a + b) were lower (p < 0.01) for cadusaphos treatment in cultivar 8473 RSF compared to all other nematicide treatments and to cultivar M7198 IPRO. However, the proportion of chlorophyll a/b at 33 days after sowing for that treatment was greater than any other nematicide. This situation, associated with low total chlorophyll (a + b) indices, is similar to what is observed in plants directly exposed to sunlight (low total chlorophyll and high proportion a/b) [68,69]. According to Fritschi and Ray [70], the proportion of chlorophyll a/b has potential implications for management decisions, such as sowing density and distance between rows, whenever any condition or management alters this chlorophyll relation.
Similarly, at 47 days after sowing, no significant differences were observed for the chlorophyll proportion (a/b) estimates between any of the factors evaluated. This result indicates that any significant change that might occur in soybean chlorophylls observed at earlier stages is transient and less aggressive. As the plants grow, their eventual phytotoxic effects tend to dilute and become similar to the control (with no nematicide application). Therefore, the study of the potential phytotoxic effects of nematicides applied to soybeans should be performed at earlier stages of plant development, before 33 days after sowing.
The beneficial effects of nematicide application on biomass production by the crops, generally, are a consequence of the reduction in phytonematode populations in the soil or in the root system [23,24,71]. Studies in the absence of the phytonematode generally do not promote any additional effect on biomass production, and yield gains, whenever reported, are due to the cultivar effect [72,73]. However, positive biomass effects of chemical control were observed in the present study, with no artificial inoculation or any phytoparasitic nematode in the substrate.
Biometric evaluations of soybean leaf area, dry leaf, and shoot matter at 66 days after sowing did not indicate any phytotoxicity symptoms (yellowing, necrosis, leaf curling), similar to what was observed by Nunes et al. [74], Oriani [73], Santos [24], and Baggio [74], even when the nematode was present in the soil/substrate. In the present study, evaluations of leaf and shoot dry matter indicated that the chemical control, especially with abamectin and fluensulfone, increased the values of those variables compared to the treatments with a biological nematicide (P. chlamydosporia) and the untreated control.
The results found by Zambiazzi et al. [65] demonstrated that the presence of the nematicide abamectin negatively affected soybean shoot dry matter at the R1 (begin flowering) phenological stage; however, such a negative effect of the nematicide treatment could have been a consequence of an indirect effect on plant nodulation. Inoculation with diazotrophic bacteria (artificial nodulation) was not carried out in any of the treatments of the present study; therefore, it was not considered a source of variation for the shoot dry matter.
However, Silva et al. [17], evaluating the effects of soybean seed treatments 28 days after emergence, found that the treatment with abamectin positively affected plant height, shoot dry matter, and root volume compared to the control (with no seed treatment). Studies with other crops, such as papaya (Carica papaya L.) [75] and tomato (Solanum lycopersicum L.) [76], did not report the phytotoxic effects of abamectin treatment as a strategy for nematode control.
It was not expected that the biological control agent, P. chlamydosporia, would contribute directly to the production of soybean biomass since its development is not adequate in the plant’s rhizosphere [77]. Such expectation was confirmed by the biometric results (leaf area, dry matter of leaves, and shoots), which were similar to the control (with no nematicide application).
The evaluation of soybean shoots with a vegetation spectral index is aimed at using a widely accessible tool (a smartphone camera) and the fast application of RGB images (visible colors) for index composition. Moreover, the use of accessible spectral observations of plants can be successfully used in phenomics and phenotyping studies to accelerate plant breeding programs [78,79,80], for instance. The application of spectral vegetation indexes also allows early separation, in agricultural areas or plant parts, of healthy vegetation from stressed ones [34,36,37,81,82,83], or differences in pigment content [61,84], to support management decision-making processes.
The TGI index was initially validated by analyzing a whole experimental unit’s response through airborne evaluations, satellite (Landsat TM 5), and digital cameras. The development of this index was based on the triangle outlining the spectral plant signature for the wavelengths red (R), green (G), and blue (B) [42,43], and it is very sensitive to leaf chlorophyll content. However, in this study, no strong or consistent significant relationships were observed between chlorophylls estimated by Falker’s index and the TGI index. This inconsistency between the correlations of chlorophyll contents and the TGI index found in the present study and those observed by Hunt et al. [43] could be due to the dimensions evaluated. In the present study, chlorophyll content was estimated at two points in the middle third of each plant, while Hunt et al. [43] established the correlation between chlorophyll and TGI considering the response of soybean shoots in the complete experimental unit (6750 m2).
Correlations between the soybean quantified response (shoots, cm2) and TGI and the other variables were found, similar to the reports by Lemes et al. [53]. In addition to the strong and predictable correlations between chlorophylls and between biometric variables (leaf area and dry biomasses), responses of TGI were moderate and significant with leaf area and dry biomass at 66 days after sowing and, especially, with the TGI evaluations at 47 days after sowing.
A stronger correlation between biometric variables (66 DAS) and TGI at 47 days after sowing indicates that this index can predict biomass production and that the closer the evaluations are (TGI × biometry), the better the estimate precision. This trend can be observed in the dispersion graphs (scatter plot), where biometric responses (leaf area, dry matter of leaves, and shoots) increase with respective increases in quantified responses (cm2) of soybean shoot TGI. Similar results for the interaction between leaf area and TGI were found by Hunt et al. [53].
The quantified (cm2) response of soybean shoots by TGI was smaller for the treatment with cadusaphos at 33 days after sowing than for all others; an opposite response was observed in the same treatment and evaluation period (33 DAS) for the proportion of chlorophylls (a/b). The increase in the chlorophyll proportion a/b is associated with plants in full sunshine [68], with a high proportion of the chlorophylls related to photosystems I and II and a smaller proportion of chlorophylls associated with the light-harvest complex, where most of chlorophyll b is concentrated [70,85,86]. The index TGI generated a single response for the soybean canopy (shoots) and may be mimicking a full sunshine condition for the nematicide cadusaphos, which was not evident on the punctual estimate of chlorophyll (Falker’s chlorophyll index) in the middle third of the plant with a digital chlorophyll meter.
Spectral vegetation indices to evaluate plant responses allow early acquisition of data on plant development, physiology, nutrition, and health status, leading to a proper indication of crop management for situations like early identification of phytotoxicity [34,37,41]. This technique can aid decision-making based on more precise information about crop conditions and improve the success chances of the management strategy implemented, thus reducing yield losses and environmental impacts due to agricultural activity.

5. Conclusions

The observations in the present study presented no visible phytotoxicity in soybeans treated with the studied nematicides, indicating that hidden phytotoxicity might occur without evident symptoms.
Furthermore, cadusaphos led to a 6.17% higher a/b chlorophyll ratio; however, the impact of nematicides on chlorophylls was transient and occurred earlier in the soybean cycle, within 47 days after sowing. The soybean shoot dry mass of the control (no nematicides) and biological treatments were similar (15.09 g) and 7.75% lower than that of the chemical treatments (16.26 g).
Furthermore, moderate and significant correlations between the TGI spectral index and the total leaf area of the soybean plants were found. Integrating the TGI index into crop management practices holds promise for enhancing efficiency, potentially mitigating yield losses, and reducing environmental impacts.

Author Contributions

Conceptualization, E.M.L. and J.P.A.R.C.; investigation, A.d.S.O. and I.D.P.; methodology, E.M.L. and S.L.d.A.; project administration, E.M.L., A.d.S.O. and I.D.P.; resources, M.A.d.S., L.C. and J.P.A.R.C.; fund acquisition, J.P.A.R.C.; supervision, E.M.L.; writing original draft, E.M.L.; writing review and editing, E.M.L., M.A.d.S., L.C. and J.P.A.R.C. All authors have read and agreed to the published version of the manuscript.

Funding

This research was partially funded by the Coordenação de Aperfeiçoamento de Pessoal de Nível Superior—Brasil (CAPES)—Finance Code 001 and the Conselho Nacional de Desenvolvimento Científico e Tecnológico (CNPq).

Data Availability Statement

Publicly available datasets were analyzed in this study. This data can be found here: https://osf.io/3tgx5/?view_only=6743328eb34e4be9a9793405fbb47b43 (accessed on 1 August 2023).

Acknowledgments

We thank UFU, CAPES, and CNPq. We also thank Maria Francisca de Oliveira Santos for her helpful and kind assistance during data collection.

Conflicts of Interest

The authors declare no conflict of interest.

References

  1. Companhia Nacional de Abastecimento (CONAB). Acompanhamento da Safra—Grãos. Safra 2022–2023, 10° Levantamento. Available online: http://www.conab.gov.br (accessed on 23 July 2022).
  2. Ogle, H.J. Abiotic Diseases of Plants. In Plant Pathogens and Plant Diseases; Brown, J.F., Ogle, H.J., Eds.; University of New England Printery: Armidale, Australia, 1997; pp. 156–171. [Google Scholar]
  3. Santos, D.M.M.; Ferraz, R.L.S.; Chiconato, D.A.; Pizolato Neto, A. Estresses abióticos na cultura da soja. In Doenças da soja: Melhoramento Genético e Técnicas de Manejo (Soybean Diseases: Genetic Improvement and Management Techniques); Lemes, E.M., Castro, L., Assis, R., Eds.; Publisher Millennium: Campinas, Brazil, 2015; pp. 137–158. [Google Scholar]
  4. Agrios, G.N. Plant Pathology, 5th ed.; Elsevier Academic Press: Burlington, VT, USA, 2005; 952p. [Google Scholar]
  5. Sabato, E.O.; Nicésio, F.J.A.P.; Fernandes, F.T. Identificação e Controle de Doenças do Milho (Identification and Control of Corn Diseases), 2nd ed.; Embrapa Informação Tecnológica: Brasília, Brazil, 2013; 145p. [Google Scholar]
  6. Lemes, E.; Castro, L.; Assis, R. Doenças da Soja: Melhoramento Genético e Técnicas de Manejo (Soybean Diseases: Genetic Improvement and Management Techniques); Millennium: Campinas, Brazil, 2015; 384p. [Google Scholar]
  7. Ferraz, L.C.C.B.; Brown, D.J.F. Nematologia de Plantas: Fundamentos e Importância (Plant Nematology: Fundamentals and Importance); Norma Editora: Manaus, Brazil, 2016; 268p. [Google Scholar]
  8. Decraemer, W.; Hunt, D., Jr. Structure and classification. In Plant Nematology; Perry, R.N., Moens, M., Eds.; CABI Publishing: Wallingford, UK, 2006; pp. 3–32. [Google Scholar]
  9. Nicol, J.M. Important nematode pests. In Bread Wheat Improvement and Production; Curtis, B.C., Rajaram, S., Gómez, M., Eds.; FAO Plant Production and Protection Series; Food and Agriculture Organization of the United Nations: Rome, Italy, 2002; pp. 345–366. Available online: https://www.fao.org/3/y4011e/y4011e0p.htm#bm25 (accessed on 1 August 2023).
  10. Perry, R.N.; Moens, M. Plant Nematology; Biddles: Pondicherry, India, 2005. [Google Scholar]
  11. Taylor, A.L.; Sasser, J.N. Biology, Identification, and Control of Root-Knot Nematodes (Meloidogyne); North Carolina State University and the United States Agency for International Development: Raleigh, NC, USA, 1978. [Google Scholar]
  12. Greco, N.; Di Vito, M. Population dynamics and damage levels. In Root-Knot Nematodes; Perry, R.N., Moens, M., Starr, J.L., Eds.; CAB International: Wallingford, UK, 2009; pp. 246–274. [Google Scholar]
  13. Moens, M.; Perry, R.N.; Starr, J.L. Meloidogyne sp.: A Diverse Group of Novel and Important Plant Parasite. In Root-Knot Nematodes; Perry, R.N., Moens, M., Starr, J.L., Eds.; CAB International: Wallingford, UK, 2009; pp. 1–17. [Google Scholar]
  14. Ghule, T.M.; Singh, A.; Khan, M.R. Root knot nematodes: Threat to indian agriculture. Pop. Kheti 2014, 2, 126–130. [Google Scholar]
  15. Karssen, G. The Plant-Parasitic Nematode Genus Meloidogyne Goldi, 892 (Tylenchida) in Europe; Brill: Leiden, The Netherlands, 2002; 157p. [Google Scholar]
  16. Jones, J.; Haegeman, A.; Danchin, E.G.; Gaur, H.S.; Helder, J.; Jones, M.G.; Kikuchi, T.; Manzanilla-López, R.; Palomares-Rius, J.E.; Wesemael, W.M.; et al. Top 10 plant-parasitic nematodes in molecular plant pathology. Mol. Plant Pathol. 2013, 14, 946–961. [Google Scholar] [CrossRef] [PubMed]
  17. Silva, G.S. Métodos Alternativos de Controle de Fitonematoides (Alternative Methods of Controlling Phytonematodes); Luz, C.W., Ed.; RAPP: New York, NY, USA, 2011; Volume 19, pp. 81–152. Available online: https://nematologia.com.br/files/rapp/rapp09.pdf (accessed on 22 February 2020).
  18. Safeena, M.I.S.; Zakeel, M.C.M. Nanobiotechnology-driven management of phytonematodes. In Management of Phytonematodes: Recent Advances and Future Challenges; Ansari, R., Rizvi, R., Mahmood, I., Eds.; Springer: Singapore, 2020; pp. 1–33. [Google Scholar] [CrossRef]
  19. Berthon, J.-Y.; Michel, T.; Wauquier, A.; Joly, P.; Gerbore, J.; Filaire, E. Seaweed and microalgae as major actors of blue biotechnology to achieve plant stimulation and pest and pathogen biocontrol—A review of the latest advances and future prospects. J. Agric. Sci. 2021, 159, 523–534. [Google Scholar] [CrossRef]
  20. Mandahl, H.R.; Katel, S.; Subedi, S.; Shrestha, J. Plant parasitic nematodes and their management in crop production: A review. J. Agric. Nat. Res. 2021, 4, 327–338. [Google Scholar] [CrossRef]
  21. Maru, A.K.; Singh; Prajapati, A.B.; Patel, D.J. Management of phytonematodes in vegetable crops through seed bio-priming: A review. Front. Crop Improv. 2021, 9, 2001–2007. [Google Scholar]
  22. Vitti, A.J.; Rezende Neto, U.R.; Araujo, F.G.; Santos, L.C.; Barbosa, K.A.G.; Rocha, M.R. Effect of soybean seed treatment with abamectin and thiabendazole on Heterodera glycines. Nematropica 2007, 44, 74–80. [Google Scholar]
  23. Corte, G.D.; Pinto, F.F.; Stefanello, M.T.; Gulart, C.; Ramos, J.P.; Balardin, R.S. Tecnologia de aplicação de agrotóxicos no controle de fitonematoides em soja (Technology for applying pesticides to control phytonematodes in soybeans). Ciênc. Rural 2014, 44, 1534–1540. [Google Scholar] [CrossRef]
  24. Santos, P.S. Aplicação em sulco de nematicidas em soja (In-furrow application of nematicides in soybeans). Master’s Thesis, UFSM, Programa de Pós-Graduação em Engenharia Agrícola, Santa Maria, Brazil, 2015; 51p. [Google Scholar]
  25. Pedrozo, I.B.O.; Henning, A.A.; Homechin, M. Controle químico do nematoide de cisto da soja Heterodera glycines em casa de vegetação (Chemical control of soybean cyst nematode Heterodera glycines in greenhouse). Sem. Ciênc. Agr. 1999, 20, 59–63. Available online: https://ojs.uel.br/revistas/uel/index.php/semagrarias/article/view/4212 (accessed on 22 February 2020).
  26. Oliveira, F.S.; Rocha, M.R.; Reis, A.J.S.; Machado, V.O.F.; Soares, R.A.B. Efeito de produtos químicos e naturais sobre a população de nematóide Pratylenchus brachyurus na cultura da cana-de-açúcar (Effect of chemical and natural products on the nematode population Pratylenchus brachyurus in sugarcane crops). Pesq. Agrop. Trop. 2005, 35, 171–178. [Google Scholar]
  27. Tayal, M.S.; Agarwal, M.L. Phytotoxicity of two nematicides, oxamyl and EDB, and its interaction with GA3 on the process of germination and amylase activity in Solanum melongena L. Bull. Société Bot. Fr. Lett. Bot. 1982, 129, 277–281. [Google Scholar] [CrossRef]
  28. Gowen, S.; Quénéhervè, P. Nematode parasites of bananas, plantains and abaca. In Plant Parasitic Nematodes in Subtropical and Tropical Agriculture; Luc, M., Sikora, R.A., Bridge, J., Eds.; CAB International: Wallingford, UK, 1990; Available online: https://horizon.documentation.ird.fr/exl-doc/pleins_textes/2021-09/34401.pdf (accessed on 20 February 2020).
  29. Steffen, R.B.; Steffen, G.P.K.; Antoniolli, Z.I.; Jacques, R.J.S.; Eckhardt, D.P. Efeito da abamectina e carbofuran no controle de danos causados por Meloidogyne graminicola em plantas de arroz irrigado (Effect of abamectin and carbofuran on controlling damage caused by Meloidogyne graminicola in irrigated rice plants). Rev. FZVA 2011, 18, 56–69. [Google Scholar]
  30. Dan, L.G.M.; Dan, H.A.; Piccinin, G.G.; Ricci, T.T.; Ortiz, A.H.T. Tratamento de sementes com inseticida e a qualidade fisiológica de sementes de soja (Seed treatment with insecticide and the physiological quality of soybean seeds). Rev. Caatinga 2012, 25, 45–51. [Google Scholar]
  31. Giannakou, I.O.; Panopoulou, S. The use of fluensulfone for the control of root-knot nematodes in greenhouse cultivated crops: Efficacy and phytotoxicity effects. Cogent Food Agric. 2019, 5, 1643819. [Google Scholar] [CrossRef]
  32. Sociedade Brasileira da Ciência das Plantas Daninhas. Procedimentos Para Instalação, Avaliação e Análise de Experimentos com Herbicidas (Procedures for Setting up, Evaluating and Analyzing Herbicide Experiments); SBCPD: Londrina, Brazil, 1995; 42p. [Google Scholar]
  33. Tucker, C.J. Red and photographic infrared linear combinations for monitoring vegetation. Remote Sens. Environ. 1979, 8, 127–150. [Google Scholar] [CrossRef]
  34. Basso, B.; Cammarano, D.; De Vita, P. Remotely sensed vegetation indices: Theory and applications for crop management. Ital. J. Agrometeorol. 2004, 53, 36–53. [Google Scholar]
  35. Jensen, J.R. Sensoriamento Remoto do Ambiente: Uma Perspectiva em Recursos Terrestres (Remote sensing of the environment: A Perspective on Terrestrial Resources), 2nd ed.; Epiphanio, J.C.N., Ed.; INPE: São José dos Campos, Brazil, 2009. [Google Scholar]
  36. Yoshioka, H.; Miura, T.; Obata, K. Derivation of relationships between spectral vegetation indices from multiple sensors based on vegetation isolines. Remote Sens. 2012, 4, 583–597. [Google Scholar] [CrossRef]
  37. Mahlein, A.-K. Plant disease detection by imaging sensors—Parallels and specific demands for precision agriculture and plant phenotyping. Plant Dis. 2016, 100, 241–251. [Google Scholar] [CrossRef]
  38. Xue, J.; Su, B. Significant remote sensing vegetation indices: A review of developments and applications. J. Sens. 2017, 1353691. [Google Scholar] [CrossRef]
  39. Kurbanov, R.; Zakharova, N. Justification and Selection of Vegetation Indices to Determine the Early Soybean Readiness for Harvesting. E3S Web Conf.-IterAgroMash 2021, 273, 01008. [Google Scholar] [CrossRef]
  40. Zeng, Y.; Hao, D.; Huete, A.; Berry, J.; Chen, J.M.; Joiner, J.; Frankenberg, C.; Bond-Lamberty, B.; Ryu, Y.; Xiao, J.; et al. Optical vegetation indices for monitoring terrestrial ecosystems globally. Nat. Rev. Earth Environ. 2022, 3, 477–493. [Google Scholar] [CrossRef]
  41. Pasternak, M.; Pawluszek-Filipiak, K. The evaluation of spectral vegetation indexes and redundancy reduction on the accuracy of crop type detection. Appl. Sci. 2022, 12, 5067. [Google Scholar] [CrossRef]
  42. Hunt, E.R.; Daughtry, C.S.T.; Eitel, J.U.H.; Long, D.S. Remote sensing leaf chlorophyll content using a visible band index. Agron. J. 2011, 103, 1090–1099. [Google Scholar] [CrossRef]
  43. Hunt, E.R.; Doraiswamy, P.C.; Mcmurtrey, J.E.; Daughtry, C.S.T.; Perry, E.M. A visible band index for remote sensing leaf chlorophyll content at the canopy scale. Int. J. Appl. Earth Obs. Geoinf. 2013, 21, 103–112. [Google Scholar] [CrossRef]
  44. Che’Ya, N.N.; Mohidem, N.A.; Roslin, N.A.; Saberioon, M.; Tarmidi, M.Z.; Arif Shah, J.; Fazlil Ilahi, W.F.; Man, N. Mobile computing for pest and disease management using spectral signature analysis: A review. Agronomy 2022, 12, 967. [Google Scholar] [CrossRef]
  45. Costopoulou, C.; Ntaliani, M.; Karetsos, S. Studying mobile apps for agriculture. IOSR J. Mob. Comput. Appl. 2016, 3, 44–49. [Google Scholar]
  46. Brown, R.H.; Kerry, B.R. Principles and Practice of Nematode Control in Crops; Academic Press: Sydney, Australia, 1987; 447p. [Google Scholar]
  47. Whitehead, A.G. Plant Nematode Control; CABI Publishing: Wallingford, UK, 1998; 384p. [Google Scholar]
  48. De Waele, D.; Elsen, A. Challenges in tropical plant nematology. Annu. Rev. Phytopathol. 2007, 45, 457–485. [Google Scholar] [CrossRef]
  49. Alvares, C.A.; Stape, J.L.; Sentelhas, P.C.; Gonçalves, J.L.M.; Sparovek, G. Köppen’s climate classification map for Brazil. Meteorol. Zeitschrift 2014, 22, 711–728. [Google Scholar] [CrossRef]
  50. Beck, H.E.; Zimmermann, N.E.; Mcvicar, T.R.; Vergopolan, N.; Berg, A.; Wood, E.F. Present and future Köppen-Geiger climate classification maps at 1-km resolution. Sci. Data 2018, 5, 180214. [Google Scholar] [CrossRef]
  51. Tuite, J. Plant Pathological Methods: Fungi and Bacteria; Burguess: Minneapolis, MN, USA, 1969; 239p. [Google Scholar]
  52. Vale, F.X.R.; Fernandes Filho, E.I.; Liberato, J.R. Quantificação de Doenças—Quant, Version 1.0.1; UFV: Viçosa, Brazil, 2001. [Google Scholar]
  53. Lemes, E.M.; Coelho, L.; Andrade, S.L.; Oliveira, A.S.; Marques, M.G.; Nascimento, F.M.A.; Cunha, J.P.A.R. Triangular greenness index to evaluate the effects of dicamba in soybean. AgriEngineering 2022, 4, 758–769. [Google Scholar] [CrossRef]
  54. Falker Automação Agrícola. Manual do Medidor Eletrônico de Teor Clorofila (ClorofiLOG—CFL 1030) (Electronic chlorophyll content meter manual (ClorofiLOG—CFL 1030)); Falker Automação Agrícola: Porto Alegre, Brazil, 2008; 33p. (Portuguese). Available online: http://www.falker.com.br/produto_download.php?id=4 (accessed on 28 December 2018).
  55. Pearson, K. The Grammar of Science; Walter Scott: London, UK, 1892; 493p. [Google Scholar]
  56. Chambers, J.; Cleveland, W.; Kleiner, B.; Tukey, P. Graphical Methods for Data Analysis; Wadsworth e Brooks/Cole: Pacific Grove, CA, USA, 1983; 395p. [Google Scholar]
  57. Paranhos, R.; Figueiredo Filho, D.B.; Rocha, E.C.; Silva Júnior, J.A.; Neves, J.A.B.; Santos, M.L.W.D. Desvendando os mistérios do coeficiente de correlação de Pearson: O retorno (Unraveling the mysteries of the Pearson correlation coefficient: The comeback). Leviathan 2014, 8, 66–95. [Google Scholar] [CrossRef]
  58. Figueiredo Filho, D.B.; Silva, J.A., Jr. Desvendando os mistérios do coeficiente de correlação de Pearson (r) (Unraveling the mysteries of the Pearson correlation coefficient (r)). Rev. Política Hoje 2009, 18, 115–146. [Google Scholar]
  59. Callegari-Jacques, S.M. Bioestatística: Princípios e aplicações (Biostatistics: Principles and Applications); Artemed: Porto Alegre, Brazil, 2003; 255p. [Google Scholar]
  60. Croft, H.; Chen, J.M. Leaf pigment content. In Comprehensive Remote Sensing, 3rd ed.; Remote Sensing of Terrestrial Ecosystems; Chen, J.M., Liang, S., Eds.; Elsevier Inc.: Amsterdam, The Netherlands, 2018; pp. 117–142. [Google Scholar] [CrossRef]
  61. Li, Y.; He, N.; Hou, J.; Xu, L.; Liu, C.; Zhang, J.; Wang, Q.; Zhang, X.; Wu, X. Factors influencing leaf chlorophyll content in natural forests at the biome scale. Front. Ecol. Evol. 2018, 6, 64. [Google Scholar] [CrossRef]
  62. Kandel, Y.R.; Wise, K.A.; Bradley, C.A.; Tenuta, A.U.; Mueller, D.S. Effect of planting date, seed treatment, and cultivar on plant population, sudden death syndrome, and yield of soybean. Plant Dis. 2016, 100, 1735–1743. [Google Scholar] [CrossRef] [PubMed]
  63. Jones, J.G.; Kleczewski, N.M.; Desaeger, J.; Meyer, S.L.F.; Johnson, G.C. Evaluation of nematicides for southern root-knot nematode management in lima bean. Crop Prot. 2017, 96, 151–157. [Google Scholar] [CrossRef]
  64. Zambiazzi, E.V.; Bruzi, A.T.; Silva, F.D.S.; Silva, E.V.V.; Zuffo, A.M.; Guilherme, S.R.; Monteiro, F.F.; Mendes, A.E.S.; Carvalho, A.H.F.; Carvalho, M.L.M. Development of plants in combination of products associated with the inoculation in the soybean seeds treatment. J. Agric. Sci. 2017, 9, 123–130. [Google Scholar] [CrossRef]
  65. Ali, A.A.I.; Khairy, A.M.; El-Ashry, R.M. Nematicidal activity, oxidative stress and phytotoxicity of Virkon®S on tomato plants infected with root-knot nematode. Egypt J. Agronematology 2023, 22, 19–40. [Google Scholar] [CrossRef]
  66. Guarniere, C.C.O. Eficácia de Tiodicarbe, Cadusafós e Condicionador de Solo via Tratamento de Sementes e/ou Sulco de Plantio no Controle de Nematoides na Cultura de Soja (Efficacy of Thiodicarb, Cadusaphos and Soil Conditioner via Seed Treatment and/or Planting Furrow in Controlling Nematodes in Soybean Crops). Master’s Thesis, Universidade Estadual Paulista, Jaboticabal, Brazil, 2018; p. 73. [Google Scholar]
  67. Dale, M.P.; Causton, D.R. Use of the chlorophyll a/b ratio as a bioassay for the light environment of a plant. Funct. Ecol. 1992, 6, 190–196. [Google Scholar] [CrossRef]
  68. Kitajima, K.; Hogan, K.P. Increases of chlorophyll a/b ratios during acclimation of tropical woody seedlings to nitrogen limitation and high light. Plant Cell Environ. 2003, 26, 857–865. [Google Scholar] [CrossRef]
  69. Fritschi, F.B.; Ray, J.D. Soybean leaf nitrogen, chlorophyll content, and chlorophyll a/b ratio. Photos 2007, 45, 92–98. [Google Scholar] [CrossRef]
  70. Higaki, W.A. Bacillus subtilis e Abamectina no Controle de Rotylenchulus reniformis e Pratylenchus brachyurus e Alterações Fisiológicas em Algodoeiro em Condições Controladas (Bacillus subtilis and abamectin in the control of Rotylenchulus reniformis and Pratylenchus brachyurus and Physiological Changes in Cotton under Controlled Conditions). Master’s Thesis, Universidade do Oeste Paulista, Presidente Prudente, Brazil, 2012. [Google Scholar]
  71. Vitti, A.J.; Rezende-Neto, U.R.; Araújo, F.G.; Santos, L.C.; Barbosa, K.A.G.; Rocha, M.R. Efeito do tratamento de sementes de soja com abamectina e tiabendazol em Heterodera glycines (Effect of treating soybean seeds with abamectin and thiabendazole on Heterodera glycines). Nematropica 2014, 44, 74–80. [Google Scholar]
  72. Oriani, E.E. Metodologias de Aplicação de Sulfonamida Heterocíclica no Controle de Meloidogyne javanica e Pratylenchus brachyurus em soja (Methodologies for applying heterocyclic sulfonamide to control Meloidogyne javanica and Pratylenchus brachyurus in soybeans). Master’s Thesis, Universidade Estadual Paulista Júlio de Mesquita Filho, Faculdade de Ciências Agrárias e Veterinárias de Jaboticabal, Jaboticabal, Brazil, 2015; 64p. Available online: http://hdl.handle.net/11449/128105 (accessed on 25 February 2020).
  73. Nunes, H.T.; Monteiro, C.H.; Pomela, A.W.V. Uso de agentes microbianos e químicos para o controle de Meloidogyne incognita em soja. Acta Sci. Agron. Mar. 2010, 32, 403–409. [Google Scholar] [CrossRef]
  74. Baggio, L.G.; Ruffato, S.; Bonaldo, S.M. Nematicida biológico, fungicidas e inseticidas aplicados via semente, no desempenho da cultura da soja no Norte de Mato Grosso (Biological nematicide, fungicides and insecticides applied via seed, on the performance of soybean crops in the North of Mato Grosso). Sci. Electron. Arch. 2016, 9, 2. [Google Scholar]
  75. Vieira, A.; Ruggiero, C.; Marin, S.L.D. Fitotoxicidade de fungicidas, acaricidas e inseticidas, sobre o mamoeiro (Carica papaya L.) cultivar sunrise solo improved line 72/12 em condições de campo (Improved phytotoxicity of fungicides, acaricides and insecticides on papaya (Carica papaya L.) cultivar sunrise soil line 72/12 under field conditions). Rev. Bras. Frut. 2001, 23, 315–319. [Google Scholar] [CrossRef]
  76. Romano, M.J.; Correia, E.C.S.S.; Monteiro, R.N.F.; Fontana, L.F.; Silva, D.P. Intervalos de aplicação de abamectina na supressão de Meloidogyne enterolobii em tomateiro (Abamectin application intervals to suppress Meloidogyne enterolobii in tomato). Rev. Bras. Eng. Biossist. 2016, 10, 394–402. [Google Scholar] [CrossRef]
  77. Manzanilla-López, R.H.; Esteves, I.; Finetti-Sialer, M.M.; Hirsch, P.R.; Ward, E.; Devonshire, J.; Hidalgo-Díaz, L. Pochonia chlamydosporia: Advances and challenges to improve its performance as a biological control agent of sedentary endo-parasitic nematodes. J. Nematol. 2013, 45, 1–7. [Google Scholar]
  78. Tardieu, F.; Cabrera-Bosquet, L.; Pridmore, T.; Bennett, M. Plant Phenomics, from Sensors to Knowledge. Curr. Biol. 2017, 27, R770–R783. [Google Scholar] [CrossRef]
  79. Li, Z.; Guo, R.; Li, M.; Chen, Y.; Li, G. A review of computer vision technologies for plant phenotyping. Comput. Electron. Agric. 2020, 176, 105672. [Google Scholar] [CrossRef]
  80. Omari, M.K.; Lee, J.; Faqeerzada, M.A.; Joshi, R.; Park, E.; Cho, B.K. Digital image-based plant phenotyping: A review. Korean J. Agric. Sci. 2020, 47, 119–130. [Google Scholar] [CrossRef]
  81. Singh, V.; Misra, A.K. Detection of plant leaf diseases using image segmentation and soft computing techniques. Inf. Process. Agric. 2016, 4, 41–44. [Google Scholar] [CrossRef]
  82. Rao, A.; Kulkarni, S.B. A hybrid approach for plant leaf disease detection and classification using digital image processing methods. Int. J. Electr. Eng. Educ. 2020, 2845320, 1–19. [Google Scholar] [CrossRef]
  83. Er-Raki, S.; Chehbouni, A. Remote sensing in irrigated crop water stress assessment. Remote Sens. 2023, 15, 911. [Google Scholar] [CrossRef]
  84. Sims, D.A.; Gamon, J.A. Relationships between leaf pigment content and spectral reflectance across a wide range of species, leaf structures and developmental stages. Remote Sens. Environ. 2002, 81, 337–354. [Google Scholar] [CrossRef]
  85. Leong, T.-Y.; Anderson, J.M. Adaptation of the thylakoid membranes of pea chloroplasts to light intensities. I. Study on the distribution of chlorophyll protein complexes. Photos Res. 1984, 5, 105–115. [Google Scholar] [CrossRef] [PubMed]
  86. Green, B.R.; Durnford, D.G. The chlorophyll-carotenoid proteins of oxygenic photosynthesis. Ann. Rev. Plant Phys. Plant Mol. Biol. 1996, 47, 685–714. [Google Scholar] [CrossRef] [PubMed]
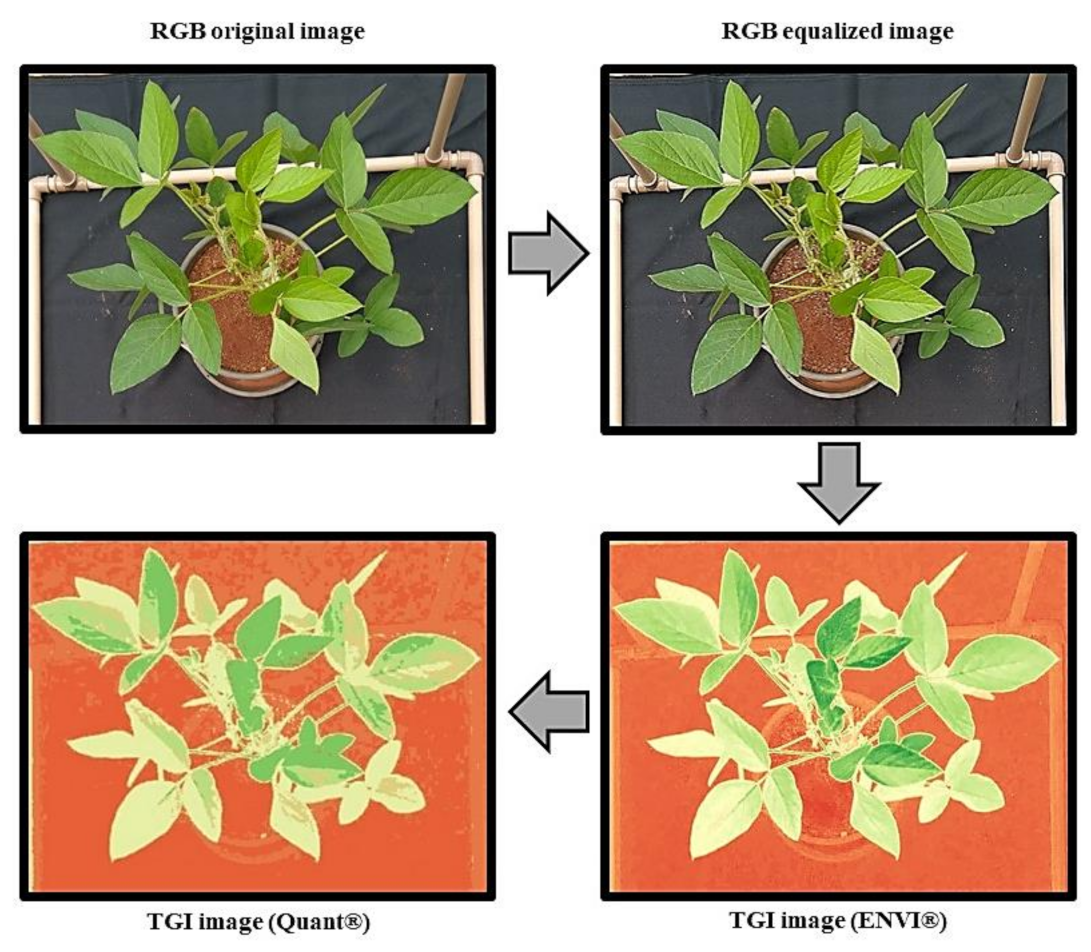
Figure 1. The sequence of image compositions used to estimate soybean canopy area (cm2) is expressed by the vegetation triangular greenness index (TGI). RGB: red, green, blue. Image source: [53].
Agriengineering 05 00107 g001
Figure 2. Chlorophyll ratio (a/b) at 33 days after soybean sowing. Similar letters positioned above columns indicate similar treatments according to the t-test (LSD) (p < 0.05). Vertical bars indicate the standard error of the respective treatment.
Agriengineering 05 00107 g002
Figure 3. Leaf area (cm2) at 66 days after soybean sowing. Similar letters positioned above columns indicate similar treatments according to the t-test (LSD) (p < 0.05). Vertical bars indicate the standard error of the respective treatment.
Agriengineering 05 00107 g003
Figure 4. Leaf dry mass (g) at 66 days after soybean sowing. Similar letters positioned above columns indicate similar treatments according to the t-test (LSD) (p < 0.05). Vertical bars indicate the standard error of the respective treatment.
Agriengineering 05 00107 g004
Figure 5. Shoot dry mass (g) at 66 days after soybean sowing. Similar letters positioned above columns indicate similar treatments according to the t-test (LSD) (p < 0.05). Vertical bars indicate the standard error of the respective treatment.
Agriengineering 05 00107 g005
Figure 6. Canopy color distinction (cm2) is indicated by the triangular greenness index (TGI) and estimated by the Quant® v. 1 software at 33 days after sowing. Similar letters positioned above columns indicate similar treatments according to the t-test (LSD) (p < 0.05). Vertical bars indicate the standard error of the respective treatment.
Agriengineering 05 00107 g006
Figure 7. Scatterplot between TGI at 33 (A) and 47 (B) days after sowing and biometric soybean variables at 66 days after sowing.
Agriengineering 05 00107 g007
Table 1. Nematicide treatments.
TreatmentActive IngredientCommercial
Concentration
Application
Technology
Commercial
Dose
Spray Volume
Applied
BiologicalPochonia chlamydosporia5.2 × 107
spores g−1
In-furrow spray3 kg ha−1200 L ha−1
Chemicalcadusaphos200 g kg−1In-furrow spray4 L ha−1200 L ha−1
abamectin500 g L−1Seed treatment1.25 mL kg−15 mL kg−1
fluensulfone480 g L−1In-furrow spray0.5 L ha−1200 L ha−1
Table 2. Analysis of variance (F test) and statistics of assumptions of the variables evaluated in soybean cultivars and nematicide treatments.
SVDFChlor.a1Chlor.b1Chlor.T1Chlor.a/b1Chlor.a2Chlor.b2Chlor.T2Chlor.a/b2Leaf cm2Leaf gShoot gTGI 1TGI 2
Soybean (S)10.47012.235 **1.69616.622 **3.6022.7283.8580.870168.475 **59.545 **32.690 **14.918 **30.224 **
Nematicide (N)46.021 **6.167 **7.784 **4.105 **2.0371.8742.1381.0822.517 *3.267 *5.238 **3.320 *1.689
S * N46.249 **3.295 *6.060 **0.6542.3311.5112.3720.6320.9810.1420.3332.2190.647
CV (%) 4.129.334.777.355.649.466.026.7611.0611.169.6116.8510.46
KS1190.052 +0.056 +0.062 +0.041 +0.036 +0.035 +0.048 +0.060 +0.056 +0.059 +0.042 +0.087 +0.056 +
L1192.2631.855 +2.5901.372 +0.958 +1.607 +0.993 +1.727 +0.860 +0.730 +0.964 +1.580 +1.389 +
Chlor.a1: Falker chlorophyll a index at 33 days after soybean sowing; Chlor.b1: Falker chlorophyll b index at 33 days after soybean sowing; Chlor.T1: Falker chlorophyll a + b index at 33 days after soybean sowing; Chlor.a/b1: Falker chlorophyll a/b ratio index at 33 days after soybean sowing; Chlor.a2: Falker chlorophyll a index at 47 days after soybean sowing; Chlor.b2: Falker chlorophyll b index at 47 days after soybean sowing; Chlor.T2: Falker chlorophyll a + b index at 47 days after soybean sowing; Chlor.a/b2: Falker chlorophyll a/b ratio index at 47 days after soybean sowing; Leaf cm2: total soybean leaf area at 66 days after soybean sowing; Leaf g: total soybean dry leaf mass at 66 days after soybean sowing; Shoot g: soybean dry shoot mass at 66 days after soybean sowing. TGI 1: triangular greenness index at 33 days after sowing; TGI 2: triangular greenness index at 47 days after sowing. *: significant differences at 0.05; **: significant differences at 0.01. CV (%): coefficient of variation. KS: Kolmogorov-Smirnov’s statistics for normality of the data residues (p > 0.01). L: Levene’s statistics for homogeneity of the data variances (p > 0.01). +: attendance (p > 0.01) of normality of residues (KS) or homogeneity of variances (L).
Table 3. Falker’s chlorophyll indexes at 33 days after soybean sowing. The nematicide treatments were applied at sowing.
SoybeanControlBiologicalCadusaphosAbamectinFluensulfone
Chlorophyll a
8473 RSF31.22 aA 131.88 aA29.15 bB32.18 aA30.99 bA
M7198 IPRO30.98 aA31.03 aA31.00 aA31.03 bA32.19 aA
Chlorophyll b
8473 RSF11.31 aA11.54 aA9.74 aB11.59 aA10.74 aAB
M7198 IPRO10.27 bA10.09 bA9.85 aA10.63 bA10.93 aA
Chlorophyll a + b
8473 RSF42.53 aA43.43 aA38.89 bB43.77 aA41.74 aA
M7198 IPRO41.25 aA41.11 bA40.85 aA41.65 bA43.11 aA
1: Averages followed by the same lowercase letters in columns and by capital letters in lines are similar according to Tukey’s test (p < 0.05).
Table 4. Pearson’s correlation (r) between the variables studied.
Chlor.a1Chlor.b1Chlor.T1Chlor.a/b1Chlor.a2Chlor.b2Chlor.T2Chlor.a/b2Leaf cm2Leaf gShoot gTGI 1TGI 2
Chlor.a110.616 **0.928 **−0.229 *−0.1080.049−0.060−0.1060.1260.1340.1740.1730.064
Chlor.b1 10.865 **−0.835 **−0.0060.199 *0.066−0.242 **−0.157−0.148−0.0440.228 *−0.061
Chlor.T1 1−0.541 **−0.0720.125−0.007−0.182 *0.0050.0150.0900.218 *0.012
Chlor.a/b1 1−0.038−0.183 *−0.0920.183 *0.289 **0.222 *0.105−0.191 *0.105
Chlor.a2 10.725 **0.970 **−0.263 **−0.231 *−0.174−0.1110.086−0.210 *
Chlor.b2 10.871 **−0.823 **−0.190 *−0.112−0.0580.212 *−0.125
Chlor.T2 1−0.478 **−0.232 *−0.163−0.1000.136−0.194 *
Chlor.a/b2 10.0990.0140.0090.198 *0.052
Leaf cm2 10.791 **0.719 **0.315 **0.571 **
Leaf g 10.852 **0.212 *0.355 **
Shoot g 10.308 *0.376 **
TGI 1 10.332 **
TGI 2 1
Chlor.a1: Falker’s chlorophyll a index at 33 days after soybean sowing; Chlor.b1: Falker’s chlorophyll b index at 33 days after soybean sowing; Chlor.T1: Falker’s chlorophyll a + b index at 33 days after soybean sowing; Chlor.a/b1: Falker’s chlorophyll a/b ratio index at 33 days after soybean sowing; Chlor.a2: Falker’s chlorophyll a index at 47 days after soybean sowing; Chlor.b2: Falker’s chlorophyll b index at 47 days after soybean sowing; Chlor.T2: Falker’s chlorophyll a + b index at 47 days after soybean sowing; Chlor.a/b2: Falker’s chlorophyll a/b ratio index at 47 days after soybean sowing; Leaf cm2: total soybean leaf area at 66 days after soybean sowing; Leaf g: total soybean dry leaf mass at 66 days after soybean sowing; Shoot g: soybean dry shoot mass at 66 days after soybean sowing. TGI 1: triangular greenness index at 33 days after sowing; TGI 2: triangular greenness index at 47 days after sowing. *: significant Pearson’s correlation at p < 0.05; **: significant Pearson’s correlation at p < 0.01.
Disclaimer/Publisher’s Note: The statements, opinions and data contained in all publications are solely those of the individual author(s) and contributor(s) and not of MDPI and/or the editor(s). MDPI and/or the editor(s) disclaim responsibility for any injury to people or property resulting from any ideas, methods, instructions or products referred to in the content.