Article

Spatial Variability of Soil Resistance to Penetration in Fruit Cultivation in Eastern Amazonia

by
Chayanne Costa Lopes
1,
Gislayne Farias Valente
2,
Daiane de Cinque Mariano
1,
Ricardo Shigueru Okumura
1,
Ismael de Jesus Matos Viégas
1,
Gabriel Araújo e Silva Ferraz
2,
Patrícia Ferreira Ponciano Ferraz
2 and
Sthéfany Airane Dos Santos
2,*
1
Departamento de Agronomia, Universidade Federal Rural da Amazônia, Campus Parauapebas, Belém 66077830, Brazil
2
Departamento de Engenharia Agrícola, Universidade Federal de Lavras, Campus Sede, Lavras 37203202, Brazil
*
Author to whom correspondence should be addressed.
AgriEngineering 2023, 5(3), 1302-1313; https://doi.org/10.3390/agriengineering5030082
Submission received: 27 April 2023 / Revised: 27 May 2023 / Accepted: 5 July 2023 / Published: 21 July 2023
(This article belongs to the Section Sensors Technology and Precision Agriculture)

Abstract

:
The application of precision agriculture in cocoa and papaya cultivation in Brazil is still incipient. This study aimed to evaluate the spatial variability of the physical attributes of soil cultivated with a consortium of papaya and cocoa. The study was conducted in two sampling grids of 50 points, in two areas cultivated with papaya and cocoa with different planting times (three and eleven months). The soil attributes soil resistance to penetration (RP) and soil gravimetric moisture (UG) were determined at soil depths of 0–20, 20–40 and 40–60 cm. The data were submitted to an exploratory and descriptive analysis. Subsequently, a geostatistical analysis was performed to quantify spatial dependence and then interpolation of the data through kriging. The maps showed weak spatial variability for the UG and RP. In the two areas, it was observed that the depth of 0–20 cm had a lower RP (1.7 Mpa) and a higher UG (40 g g−1), and as the depth was higher, had a higher RP (4.4 Mpa) and a lower UG (38 g g−1). Area 1 presented higher RP values in depth, showing greater susceptibility to compaction. The area characterized by the consortium of papaya and cocoa presented more susceptible to compaction. The mechanical resistance of the soil to penetration was more critical in the 40–60 cm layer for the two consortia evaluated, evidencing areas with possible restriction to plant growth.

1. Introduction

In Brazil, cocoa is a native species of the Amazon biome. Papaya is one of the most important commercial fruit crops, mainly concentrated in the northeast and southeast regions of the country [1,2]. Brazil is the second largest producer and exporter of papaya (Carica Papaya L.), and the seventh largest cocoa producer in the world [3]. Fruit growing is constantly evolving and therefore requires progress in monitoring to achieve high production efficiency and achieve expected profitability [4]. Advanced knowledge and proper characterization of Brazilian plantations depend on obtaining a series of information procedures that go beyond the traditional production model. Therefore, it is important that we use precision agriculture in the study of the spatial variability of factors that guide the production and can assist in the management of the crop [5].
Among the factors that guide the production, the evaluation of soil physical attributes, which are related to the maintenance of the soil’s physical quality and optimization of production, is included. Among the attributes that measure the soil’s physical quality are: soil mechanical resistance to penetration, soil moisture and texture [6]. The resistance to soil penetration is a parameter of easy determination and is directly related to the growth and production of plants; the soil resistance to penetration has been used as an indicator of soil compaction. Soil moisture, along with resistance to soil penetration, influences many physical, biological and chemical processes in the soil. Increased soil penetration resistance can reduce porosity and soil water infiltration [7]. Therefore, the spatial heterogeneity of these soil properties, that is, the soil moisture retention capacity, can drastically alter the soil moisture in a given field or area, which makes the determination of soil–vegetation interactions complicated.
Soil moisture is an important resource for vegetation growth and agricultural production, and it is highly dynamic temporally [8]. The complexity of the moisture dynamics is increased in mixed cultivation systems [9], as is the case for planting papaya and cocoa in consortium. Papaya is a culture sensitive to soil moisture variations, as it influences papaya vegetative growth, fruit set and quality parameters [10]. Cocoa depends on specific wet conditions varying between periods of drought and periods of precipitation suitable for high production [11]. Understanding spatiotemporal patterns and the functioning of soil moisture dynamics and soil penetration resistance is important [12] to optimize costs and management decision making.
In this context, precision agriculture is defined as an agricultural management system associated with a set of techniques and technologies that are based on the spatial and temporal variability of attributes related to soils and plants, as well as impacts on the environment [4,13]. Precision agriculture allows the management of agricultural production according to the characteristics and needs of small productive units [14]. For example, the use of the geostatistical tool in the evaluation of physical soil parameters is presented as a quantitative technique widely used due to the ease and speed of determination [15].
Agricultural soils with conventional fruit planting may present physical quality loss and problems in their structure, high density, greater soil mechanical resistance to root penetration and limitation of vegetable development and production [9]. The study of this soil property allows for the quantification of the magnitude and duration of changes caused by soil management systems [16]. However, variables such as penetration resistance can vary even in areas considered homogeneous and belonging to the same soil class [8]. Thus, the geostatistical tool can potentially evaluate these physical soil quality parameters to monitor the soil’s physical characteristics in a temporal and spatial preparation of thematic maps and semivariograms [17]. Thus, the objective of this study was to evaluate the spatial variability of soil mechanical resistance to penetration and soil gravimetric moisture under conventional planting of papaya and cocoa.

2. Materials and Methods
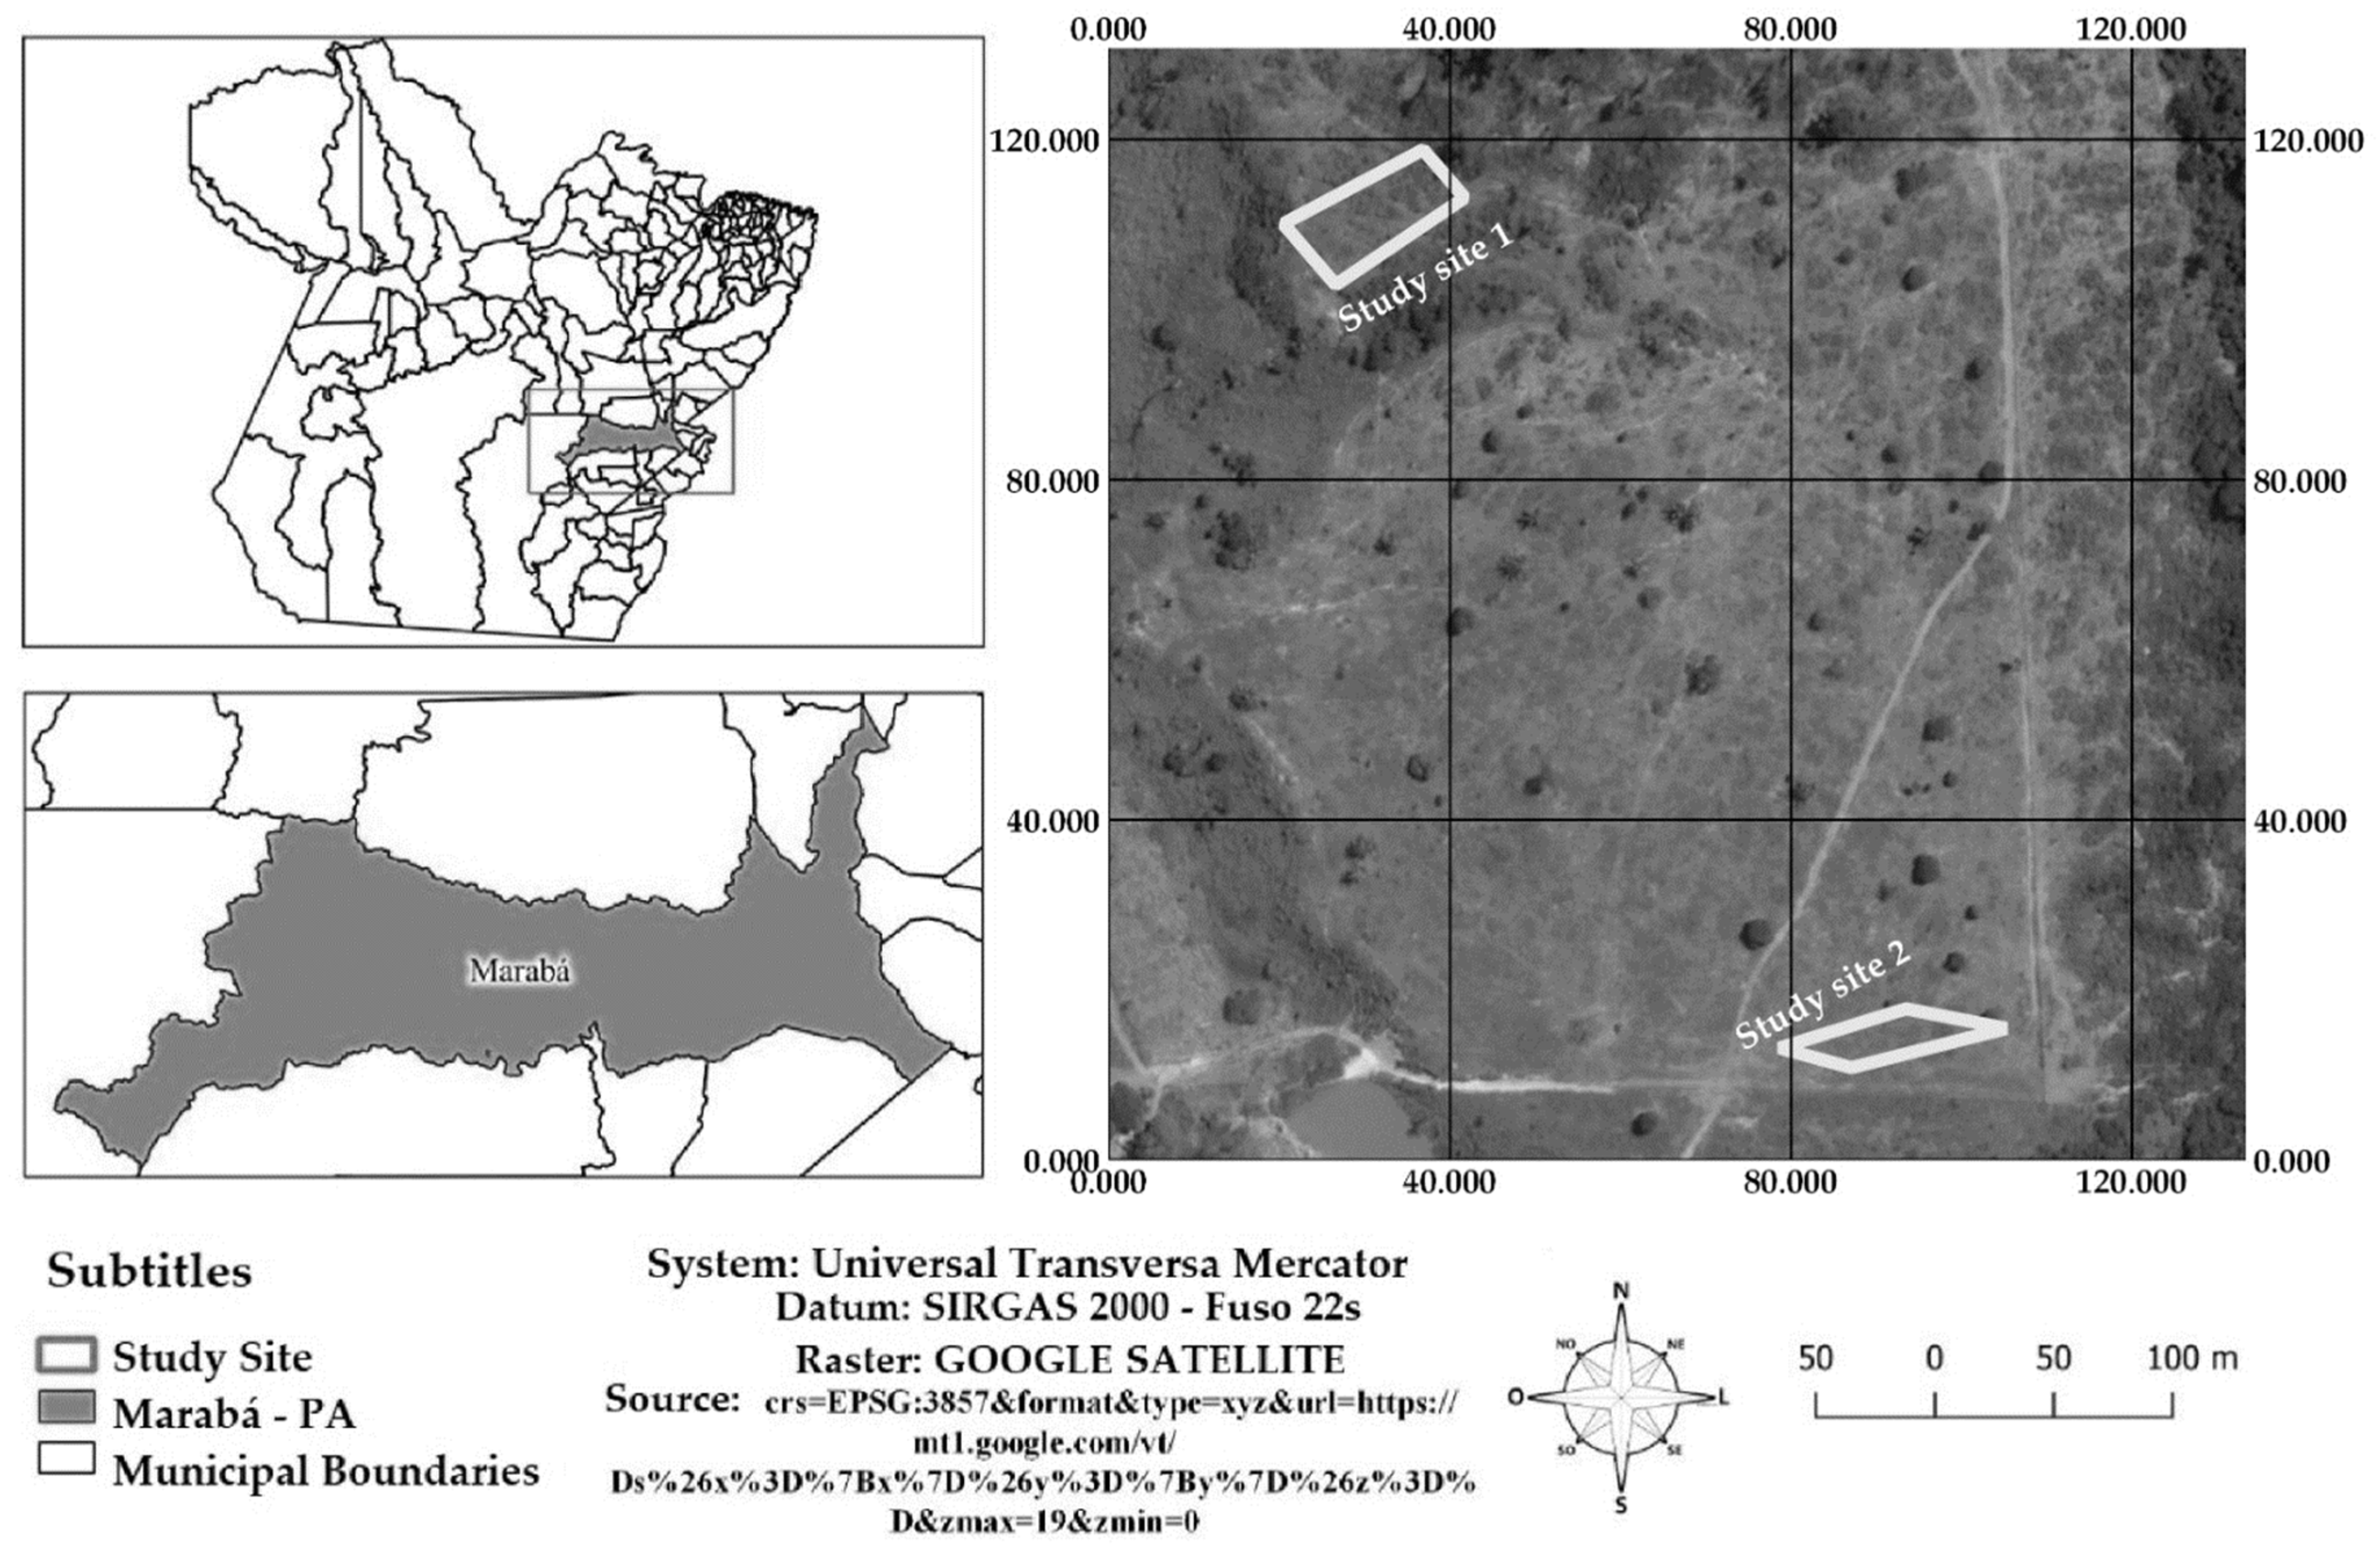
2.1. Study Site

The experiment was carried out on the Asa Boi Forte property located in the municipality of Marabá–PA, with geographic coordinates of 5°52′54.6” S latitude, 50°6′46.6” W longitude. The experimental area consists of planting papaya (Carica Papaya L.) and cocoa (Theobroma cacao L.). According to the Köppen classification, the region’s climate is classified as “Awi”, with rainfall concentrated in summer and dry season in winter. It can vary to “Aw” presenting summer and autumn rainfall, with an average annual rainfall of 1564 mm year−1, average relative humidity of 78.2% and average air temperature of 26.1 °C [18].
Two areas were selected: area 1, with a consortium of papaya and cocoa with 3 months of age, and area 2, with a consortium of papaya and cocoa with 11 months of age (Figure 1).
The area has been explored with pasture Panicum Maximum cv. Mombaça. The soil preparation for planting the fruit trees was of conventional management with plowing and liming of the soil. The planting was carried out in furrows and windrows, with a spacing of 2 m × 4 m for papaya culture and 2.5 m × 4 m for cocoa culture. The fertilization of planting was 3 L chicken manure + 300 g superphosphate simples (SS) + 30 g of DGF (micronutrients), and the fertilization post-planting in the 1st month consisted of 50 g ammonium sulfate, and 300 g super simple in the 2nd and in the 3rd month. Month onwards: 150 g of 20–00–20 (NPK).
The soil was classified as Red–Yellow Argisol with a sandy loam texture (Table 1 and Table 2).

2.2. Data Acquisition

Evaluations were conducted in April 2022. In each area, the sampling system was used in meshes with a total area of 80 m × 40 m and spacing between points of 8 m × 8 m, totaling 50 sampling points for each area. At each point of the mesh geographic coordinates were collected with a GPS device.
At each point of the mesh, the mechanical resistance of the soil to penetration and soil gravimetric moisture at soil depths 0–20, 20–40 and 40–60 cm were measured. The RP was measured with the Falker Electronic Soil Compaction Meter, model PLG1020. Deformed soil samples were collected to evaluate soil moisture and texture using the Dutch auger, at depths of 0–20; 20–40; and 40–60 cm. The soil gravimetric moisture and soil texture were determined according to [19].

2.3. Geostatistical Analysis

Field data collected were subjected to geostatistical analysis, performed to characterize the spatial variability of the RP and UG variables using the software SURFER version 11.0. These data were submitted to semivariance analysis to verify spatial dependence distance and data interpolation via ordinary kriging to create spatial variability maps. The semivariance calculation was performed using Equation (1), described by [20].
      γ   ^ h = 1 2 N h   i = 1 N ( h ) [ Z X i Z X i + h ] 2
where   γ   ^ h is estimated semivariance from a distance h; N(h) is number of experimental data pairs separated by a distance h; Z(Xi) is value determined at each sampled point; and Z (Xi + h) is value measured at a point plus a distance h.
The theoretical model was selected when it presented the highest coefficient of determination (R2) and the highest degree of spatial dependence (DSD). The models tested were the exponential, Gaussian and spherical. The parameters nugget effect (C0), sill variance (C0 + C1) and range (a) were obtained from the equation of semivariogram adjusted according to the behavior of the graphs.
The degree of spatial dependence (DSD) was defined by the ratio between the nugget effect (C0) and the sill variance (C0 + C1) according to the classification in [21], which was considers weak for DSD values greater than 75%, moderate between 25 and 75% and strong for DSD values lower than 25%.

2.4. Kriging Mapping

The semivariogram adjustment was used to identify the spatial variability of soil RP and UG. These settings allowed for data interpolation through ordinary kriging and map building. Soil RP and UG maps were constructed at depths of 0–20; 20–40; and 40–60 cm.
The maps were built using the Surfer version 11.0 software. The sampled points were interpolated to obtain an estimate (z*) that consisted of a linear combination of neighboring measurement values (x0), represented by Equation (2).
z * ( x 0 ) = i = 1 N λ i z x i
where z* is estimated; x0 is linear combination of neighboring measurement values; N is number of measured values involved in the z estimate (xi); and i is weight associated with each measured value.
The results of the UG were classified according to Table 3, as suggested by [22].
The results obtained from RP were classified according to Table 4, which was adapted from [22].

3. Results

3.1. Geostatistical Parameters

The information obtained from the soil UG and RP in the layers 0–20, 20–40 and 40–60 cm using the geostatistical analysis are organized in Table 5 and Table 6. All adjusted models showed weak DSD (DSD > 75%).
In both areas, the best adjusted model was the Gaussian for the parameters UG and RP. The study areas showed weak spatial dependence, verified by the value of DSD obtained, which was <99.75% in the UG and <99.79% in the RP of area 1 and <99.13% for the UG and <99.85% for the RP in area 2. The UG of 0–20 cm presented an exponential model and weak DSD (< 90.13%).
This was obtained with the ranges (a) distances of 6.40 to 6.60 m for the UG (Table 5 and Table 6) and 6.40 to 9.80 m for the RP in area 1 (Table 5) and 4.70 to 8.50 m for the UG and 7.90 to 8.70 m for the RP in area 2 (Table 6).
The variables UG and RP of the areas evaluated presented coefficients of adjustment of the model to the semivariogram (R2) above 0.65, at the depths of 0–20, 20–40 and 40–60 cm, that is, at least 65% of the variability in the values of the estimated semivariance.

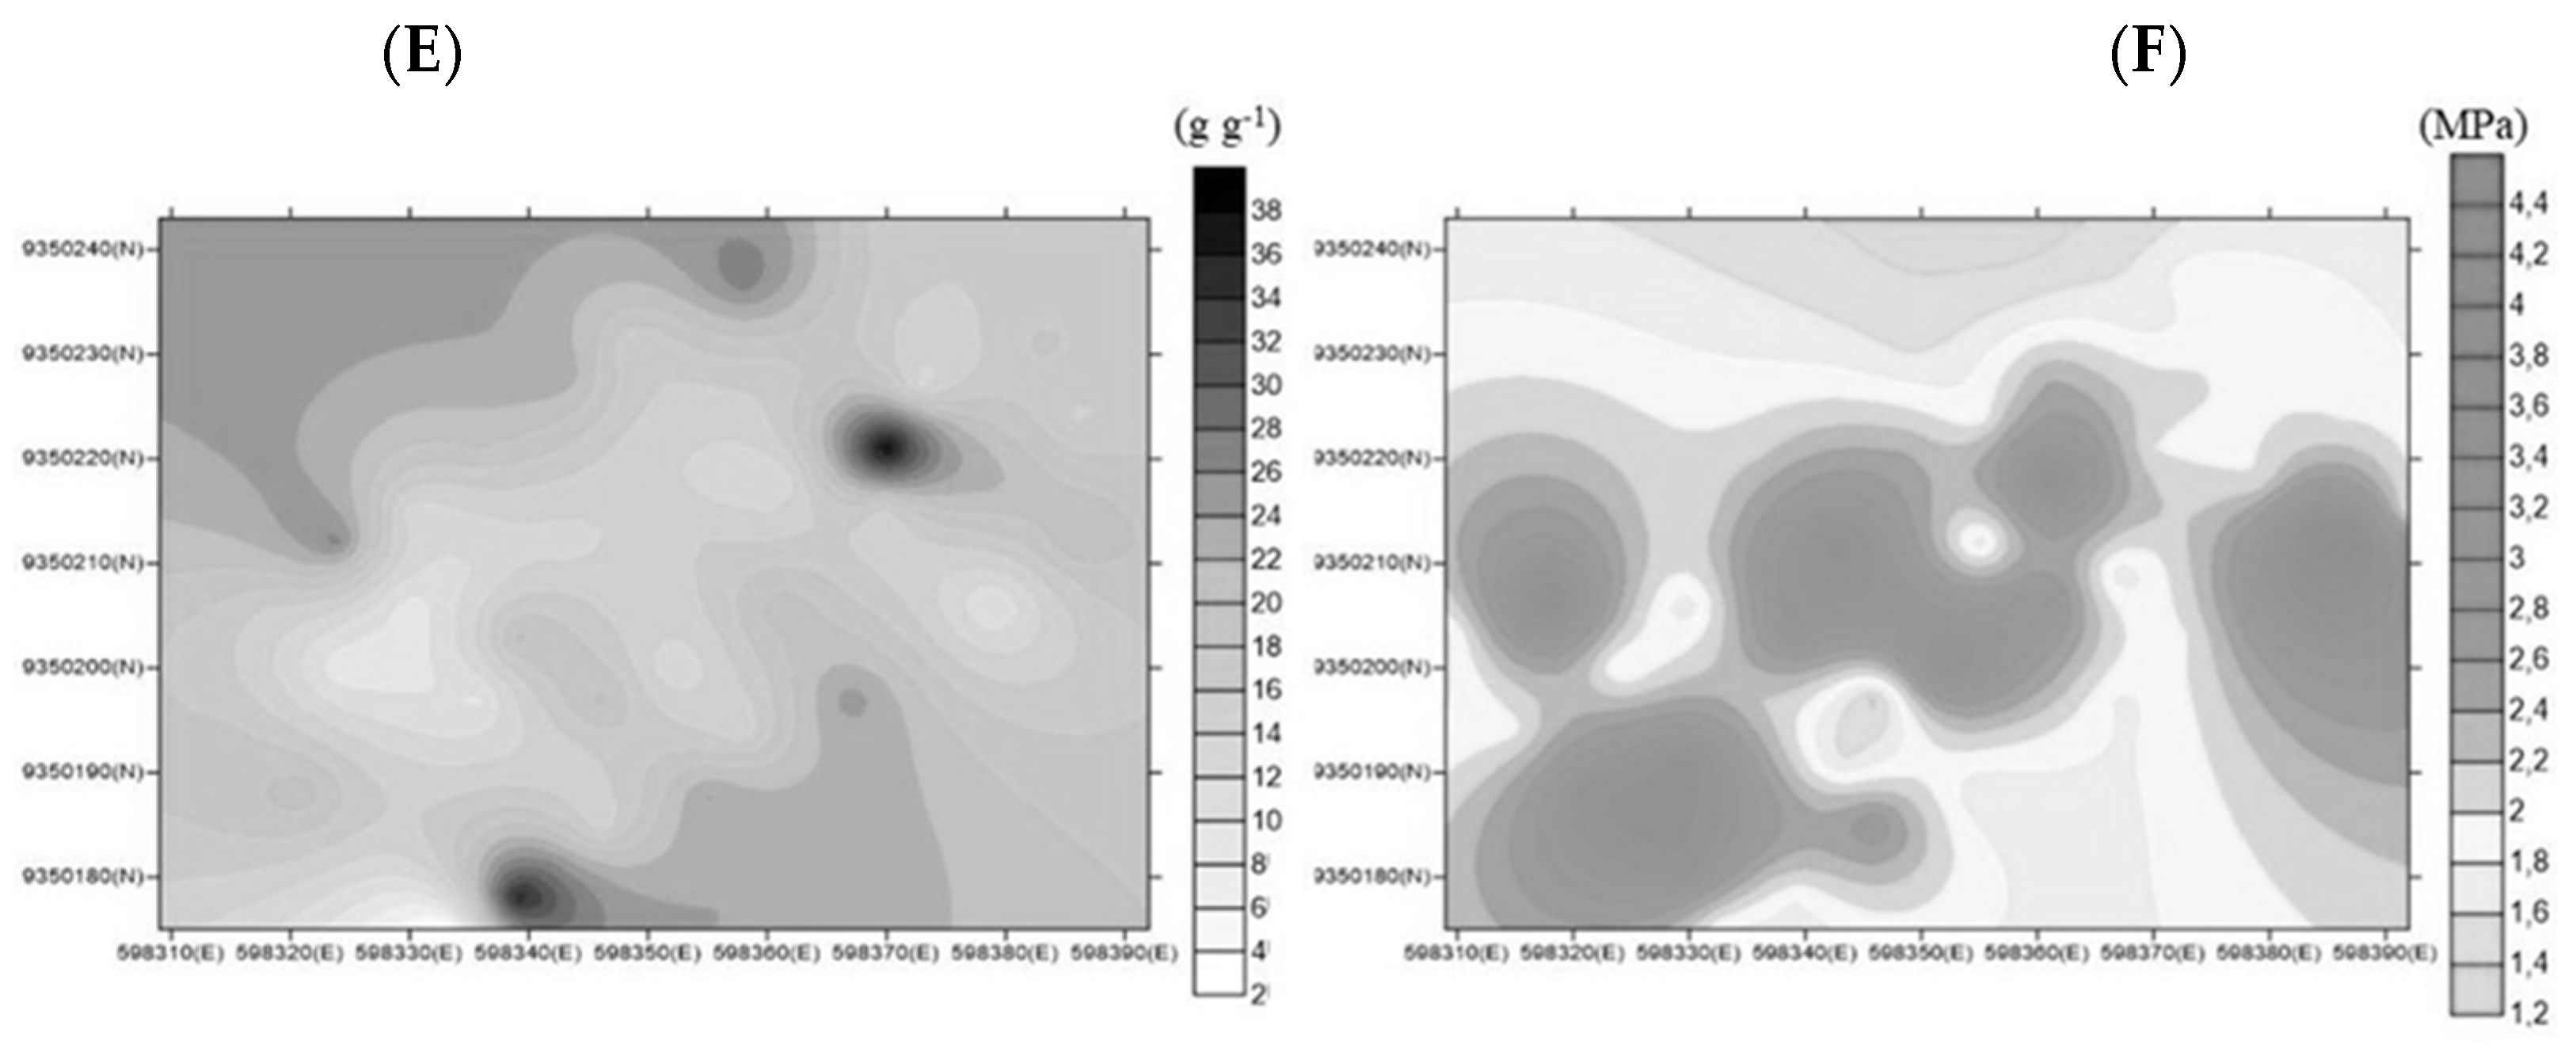
3.2. Kriging Mapping

In area 1 (Figure 2A), it was observed that for the depth 0–20 cm the UG ranged from 2 to 40.0 g g–1 with few dry spots and was mostly wet.
The RP values (Figure 2B) were low to moderate in the sample space studied, with variations from 0.5 to 1.7 MPa, values that do not characterize mechanical limitation of the soil. However, at the depth of 20–40 cm, the UG ranged from 2 to 38 g g−1 with moderate dry spots and dry medium, which reflected the values of low to very high RP in the sample space studied, with variations between 1.2 and 4.4 MPa.
At the depth of 40–60 cm (Figure 2E,F), the map presented mostly dry spots (white color) and few wet spots, and presented moderate to very high RP values of 1.9 to 4.5 Mpa.
In area 2 (Figure 3A,B), it was observed that at the depth of 0–20 cm the UG varied from 10 to 29.0 g g−1, represented by dry and medium dry spots and presenting moderate RP values (0.1–2.0 Mpa), with variations from 0.8 to 1.7 MPa.
At the depth of 20–40 cm (Figure 3C,D), the UG ranged from 2 to 47 g g−1 with moderate dry spots and ranged from medium wet to medium dry mostly, presenting moderate to high RP values (1.2 to 3.8 Mpa). The depth of 40–60 cm (Figure 3E,F) showed similarly to the UG depth of 0–20 cm and values of moderate to high RP, with values between 1.6 and 3.6 MPa.
Area 2 (Figure 3) reached lower RP values than area 1, which presented higher RP and lower UG. For both areas 1 and 2, when comparing the values of the kriging maps (Figure 2 and Figure 3) of the UG and RP in the evaluated layers, it was verified that the greater the depth, the UG decreased, while the RP increased.

4. Discussion

4.1. Geostatistical Parameters

The results of Table 5 and Table 6 show the semivariogram’s degree of reliability in explaining the experimental data variations. According to [6], this geostatistical parameter quantifies the spatial dependence of the soil attribute in relation to the total variance, and when the values are high, indicates that the adjusted variograms illustrate most of the variance in the data. Generally, a spatial dependence of soil properties can be attributed to intrinsic and extrinsic factors, caused by changes in land use [23,24]. Ref. [25], when studying the spatial variability of the UG and RP of the soil of a yellow argisol, found similar values to the present study for UG ranging from 90% to 99% for all depths.
It was observed that the range values obtained (Table 5 and Table 6) were mostly lower than the spacing value between the samples, indicating that the samples have low correlation with each other, and thus justifying their weak degree of spatial dependence. These results corroborate [26], who found that the variability in RP data increased proportionally with the size of the sampling grid adopted for the dimensions of 20 m × 20 m, 40 m × 40 m and 60 m × 60 m.
According to [27], the range is an important parameter of the semivariogram since it indicates the zone of influence of a sample, that is, it defines the maximum distance to where the value of a variable has spatial dependence relation with its neighbors. The correct interpretation of the results of the found ranges of the studied physical attributes is important in the planning of the experimental area; therefore, such results must be taken into account in management and research proposals [28].
The variables UG and RP of the areas evaluated presented high R2 (Table 5 and Table 6). According to studies by [29], when R2 is above 50%, the better the estimate of values not measured using the method of interpolation by ordinary kriging. When studying the spatial variability of physical attributes, Ref. [30] found values of R2 similar to those found in the present study, all above 0.65, with (0.77 to 0.87) for the RP and (0.90 to 0.93) for the UG at all studied depths.
The variables evaluated in this work presented a better fit to the Gaussian model. Similar results were found by [31], who evaluated the spatial variability of the soil’s physical attributes to define management zones in apple orchards.

4.2. Kriging Mapping

The results of the UG (Figure 2A) can be explained as a function of the soil’s textural class (sandy loam). Because they contain granulometric proportions with large amounts of fine particles, they tend to be organized in small porous structural units characterized by a slow water movement in this surface layer [32], thus showing that the soil texture is one of the main factors that regulate the water dynamics in the soil.
At the depth of 40–60 cm (Figure 2E,F), results may have been influenced by soil texture, whose predominance of the sand fraction in the evaluated layers resulted in rapid permeability and consequent variation in the water content in the soil, transferring this characteristic to the mechanical resistance of the soil to penetration.
According to [33], water content is highly correlated with the RP in soil. The authors of [34] stated that a decrease in water content causes an increase in soil RP. These results differ from those studied by [34], who studied the temporal stability of moisture in loam–sandy soil and found an increase in the UG according to soil depth (0–10 cm = 15.5%), (10–20 = 22.4%), (20–30 cm = 26.6%), (30–40 cm = 27.8%) and (60–100 cm = 28.6%). The authors of [35] concluded that RP values of 1.2 MPa indicate no restriction on soil penetration by the roots, and RP values of 1.9 MPa are indicators of compacted soils. Using these data, it is considered that the RP presented great physical condition with no impediment to agricultural production at a depth of 0–20 cm, since the values ranged from 1.7 MPa to 4.5 Mpa at the other depths. These results can exert great influence on the development of crops, affecting mainly the roots and, consequently, the productivity.
Ref. [36] concluded that RP values of 1.2 MPa indicate no restriction on soil penetration by the roots, and RP values of 1.9 MPa are indicators of compacted soils. Using these data, it is considered that the RP presented great physical condition with no impediment to agricultural production at a depth of 0–20 cm since the values ranged from 1.7 MPa to 4.5 Mpa at the other depths. These results can exert great influence on the development of crops, mainly affecting the roots and, consequently, the productivity.
The results obtained in area 2 (Figure 3A–F) at depths of 0–20, 20–40 and 40–60 cm corroborate those found by [37]; when studying the physical attributes in a yellow clay, they observed that the UG showed an inverse relationship with the RP, that is, the RP increased (0.6 to 4.6 Mpa) as the UG decreased in the soil. This can result from the history of use of the area for pasture and conventional soil preparation and management with plowing annually.
According to [37], maintaining high UG values in the soil surface layer can contribute to obtaining lower RP values. The RP is directly correlated with various soil attributes, such as texture, density, organic matter and, mainly, soil moisture at the time of RP evaluation [38,39].
The UG and RP are important physical attributes that directly influence the growth of the roots and, consequently, the aerial part of the plants. When RP is increased, the root system presents reduced development, which may compromise the productivity of the culture.
Area 1 (Figure 2F) had a higher RP and had a lower UG than area 2 (Figure 3E,F). Ref. [40] stated that soil compaction is more harmful in dry soil, and in conditions of lower soil moisture, there may be root growth at values of soil mechanical resistance to penetration higher than 4.0 MPa. The fact that some points have higher RP values may decrease pore volume and cause favorable and unfavorable variations in plant growth, as pointed out by [41] on the relationship between physical attributes and plant growth. As this area is represented by the cultivation of cocoa and papaya under conventional soil management, the existence of the accumulation of pressures in the soil due to tractor traffic in soil preparation can be assumed, in addition to the non-revolution of the soil for long periods and the natural accommodation of the particles. Increased RP occurred in the deeper layers of the soil.
The RP was higher in the deeper layer. Refs. [27,42], cited that depth is an important factor in studying spatial dependence. According to [43], the RP is dependent of UG. When found in low contents, water is retained with greater tension in the pores, triggering a predominance of solid, cohesive forces and, consequently, leading to a considerable increase in mechanical resistance to penetration, demonstrating that the variability of soil mechanical resistance to penetration and soil moisture does not occur by chance but presents correlation or spatial dependence [44,45].
Along the soil layers it is possible to verify compaction stains (<1.9), which can be caused by the pressure that the tires of agricultural machines and implements exert on the soil. Ref. [46] stated that tractor traffic can promote increased density in depth, causing soil compaction and configuring greater variations of the attribute in the surface layer of the soil. In addition, there are the intrinsic characteristics of the studied soil, such as plasticity, humidity conditions, and the characteristics of the machinery used as weight, type of tire and inflation pressure. Higher pressures of inflation of the tires favor subsurface compaction [47].
When comparing the two areas of the present study, it is noticeable that there was no restriction on the growth of roots in the soil. Although there was an age difference between the plantations, the areas presented a lower RP and higher UG at the depth of 0–20 cm, and as the depth increased (20–40, 40–60 cm), they presented a higher RP and lower UG. However, area 1 presented higher RP values in depth in relation to area 2, where it presented greater susceptibility to compaction in the future. With these results, there is the importance of the improved study of soil attributes with the use of precision agriculture tools in intercropped plantations of fruit. In the literature, there are few studies on the monitoring of the spatial variability of soil attributes; generally, all are directed to the chemical characteristics of the soil. As we know, soil attributes are related to soil quality and, therefore, more studies in this area are needed for better results.

5. Conclusions

  • The papaya and cocoa intercropping area with planting time of three months was more susceptible to compaction at 3 months of age.
  • The soil mechanical resistance to penetration was more critical in the layer of 40–60 cm for the two consortia evaluated, showing areas with possible restriction to plant growth.
  • The maps showed the spatial variability of soil gravimetric moisture and resistance to soil penetration, showing the need for localized management for each planting area. Further studies are needed to evaluate the behavior of these attributes in time and space and how it interferes with the production of crops.

Author Contributions

Conceptualization, C.C.L. and G.F.V.; Formal analysis, C.C.L. and G.F.V.; Funding acquisition, D.d.C.M., R.S.O. and I.d.J.M.V.; Investigation, G.A.e.S.F., S.A.D.S.; Methodology, C.C.L., D.d.C.M., R.S.O. and I.d.J.M.V.; Software, G.F.V.; Supervision, R.S.O.; Validation, C.C.L. and G.F.V.; Visualization, R.S.O., G.F.V. and P.F.P.F.; Writing—review and editing, G.F.V., G.A.e.S.F., P.F.P.F. and S.A.D.S. All authors have read and agreed to the published version of the manuscript.

Funding

This research received no external funding.

Data Availability Statement

All relevant data are included in the manuscript.

Conflicts of Interest

The authors declare no conflict of interest. The funders had no role in the design of the study; in the collection, analyses, or interpretation of data; in the writing of the manuscript, or in the decision to publish the results.

References

  1. Empresa Brasileira de Pesquisa Agropecuária (EMBRAPA). Plano Estratégico Para a Cultura do Mamoeiro 2017–2021; Embrapa Mandioca e Fruticultura—Documentos (INFOTECA–E); EMBRAPA: Brasilia, Brazil, 2019. [Google Scholar]
  2. FAOSTAT—Food and Agriculture Organization of the United Nations Statistics for 2021. Available online: http://www.fao.org/faostat/en/home (accessed on 30 April 2022).
  3. IBGE—Instituto Brasileiro de Geografia e Estatística (2021). Municipal Agricultural Production (MAP). Rio de Janeiro: IBGE.2021. Available online: https://www.ibge.gov.br/estatisticas/economicas/agricultura-e-pecuaria/9117-producao-agricola-municipal-culturas-temporarias-e-permanentes.html (accessed on 20 January 2022).
  4. Molin, J.P.; Amaral, L.R.; Colaço, A. Precision Agriculture, 1st ed.; Oficina de Textos: São Paulo, Brazil, 2015; 224p. (In Portuguese) [Google Scholar]
  5. Gebler, L.; Grego, C.R.; Vieira, A.L.; da Kuse, L.R. Spatial influence of physical and chemical parameters on management zone definition in apple orchards. Eng. Agrícola 2015, 35, 1160–1171. [Google Scholar] [CrossRef] [Green Version]
  6. Carvalho, P.S.M.; Silva, S.A.; Paiva, A.Q.; Sodré, G.A.; Lima, J.S.S. Variabilidade espacial da fertilidade de um solo cultivado com cacaueiro. Rev. Eng. Na Agric. 2018, 26, 178–189. (In Portuguese) [Google Scholar] [CrossRef] [Green Version]
  7. Nascimento, M.V.N.; Almeida, G.L.P.; Batista, P.H.D.; Coutinho, A.S. Physical attributes of dystrophic Regolithic Neosol under pasture subjected to mechanized forage harvesting and animal grazing. Bol. De Indústria Anim. 2017, 74, 169–175. (In Portuguese) [Google Scholar] [CrossRef] [Green Version]
  8. Almeida, L.S.; Guimarães, E.C. Geostatistics and exploratory factor analysis for special representation of soil chemical attributes in coffee growing. Coffee Sci. 2016, 11, 195–203. [Google Scholar]
  9. Silva, F.J.; Oliveira, C.A.A.; Almeida, L.S.; Lima, L.P.; Guimarães, E.C. Spatial variability of soil resistance to penetration and corn yield. Rev. De Agric. Neotrop. 2017, 4, 77–84. (In Portuguese) [Google Scholar]
  10. Wiebke, N.; Schneidewind, U.; Armengot, L.; Adamtey, N.; Schneider, M.; Gerold, G. Spatial-temporal soil moisture dynamics under different cocoa production systems. Catena 2017, 158, 340–349. [Google Scholar]
  11. Banjare, R.; Sahu, G.D.; Minj, V. Effect of organic nutrition practices on quality parameters of papaya (Carica papaya L.) under Precision farming technique. Pharma Innov. 2022, 11, 618–619. [Google Scholar]
  12. Cavalcante, E.G.S.; Alves, M.C.; de Souza, Z.M.; Pereira, G.T. Variabilidade espacial de atributos físicos do solo sob diferentes usos e manejos. Rev. Bras. De Eng. Agrícola E Ambient. 2011, 15, 237–243. (In Portuguese) [Google Scholar] [CrossRef]
  13. Özkan, U.; Gökbulak, F. Effect of vegetation change from forest to herbaceous vegetation cover on soil moisture and temperature regimes and soil water chemistry. Catena 2017, 1, 158–166. [Google Scholar] [CrossRef]
  14. Machado, J.; Shinohara, N.K.S.; Padilha, M.R.F.; Silva, K.E.; Barreto, T.S.C.P.; Silva, A.G.S.S. Precision agriculture: Technological programs in Brazil. Rev. Geama 2018, 4, 23–30. [Google Scholar]
  15. Vogel, G.F.; Martinkoski, L.; Grillo, J.F.; Michalovicz, L.; Fey, R. Evaluation of impact and electronic penetrometers in determin-ing mechanical resistance to soil penetration. Sci. Agrar. 2018, 18, 30–36. (In Portuguese) [Google Scholar]
  16. Freitas, L.; Oliveira, I.A.; Silva, L.S.; Frare, J.C.V.; Filla, V.A.; Gomes, R.P. Indicators of soil chemical and physical quality under different management systems. Unimar Ciências 2017, 26, 08–25. (In Portuguese) [Google Scholar]
  17. Dai, W.; Li, Y.; Fu, W.; Jiang, P.; Zhao, K.; Li, Y.; Penttinen, P. Spatial variability of soil nutrients in forest areas: A case study from subtropical China. J. Plant Nutr. Soil Sci. 2018, 181, 827–835. [Google Scholar] [CrossRef]
  18. Climate Data. Dados Climáticos de Marabá. Available online: https://pt.climatedata.org (accessed on 1 May 2022).
  19. Empresa Brasileira de Pesquisa Agropecuária (EMBRAPA). Centro Nacional de Pesquisa de Solos. Manual de Métodos de Análise de Solo, 3rd. ed.; Embrapa: Rio de Janeiro, Brazil, 2017; 230p. [Google Scholar]
  20. Matheron, G. Principles of geoestatistics. Econ. Geol. 1963, 58, 1246–1266. [Google Scholar] [CrossRef]
  21. Cambardella, C.A.; Moorman, T.B.; Novak, J.M.; Parkin, T.B.; Karlen, D.L.; Turco, R.F.; Konopka, A.E. Field–Scale Variability of Soil Properties in Central Iowa Soils. Soil Sci. Soc. Am. J. 1994, 58, 1501–1511. [Google Scholar] [CrossRef]
  22. Lopes, E.S.; Sampietro, J.A.; Lombardi, K.C.; Dias, A.N. Evaluation of moisture in soil compaction submitted to traffic of forest harvesting machines. Rev. Árvore 2011, 2, 659–667. (In Portuguese) [Google Scholar] [CrossRef]
  23. Soil, S.S. Soil Survey Manual, 18th ed.; USDA: Washington, DC, USA, 1993; 437p. [Google Scholar]
  24. Carvalho, M.P.; Takeda, E.Y.; Freddi, O.S. Spatial variability of attributes of a soil under vine in Vitória Brasil (SP). Rev. Bras. De Ciência Do Solo 2003, 27, 695–703. (In Portuguese) [Google Scholar] [CrossRef]
  25. Mion, R.L.; Nascimento, E.M.S.; Lima, S.F.A.; Silva, S.F.; Duarte, J.M.L.; Sousa, B.M. Spatial variability of total porosity, moisture and soil resistance to penetration of a Yellow Argisol. Semin. Ciências Agrárias 2012, 33, 2057–2066. (In Portuguese) [Google Scholar] [CrossRef] [Green Version]
  26. Souza, E.B.; Cortez, J.W.; Olszevski, N.; De Jesus, N.H.; Da Cunha, H.A.; De Araújo, V.F.; Feitosa, J.R. Grid sample for spatial study of penetration resistence in the elephant grass farming area. Braz. J. Agric. 2017, 92, 281–294. (In Portuguese) [Google Scholar] [CrossRef]
  27. Aquino, R.E.; Campos, M.C.C.; Oliveira, I.A.; Marques Junior, J.; Silva, D.M.P.; Silva, D.A.P. Spatial variability of physical attributes of anthropogenic and non-anthropogenic soils in the Manicoré, AM. Biosciência J. 2014, 30, 988–997. (In Portuguese) [Google Scholar]
  28. Da Vitória, E.L.; Calvi, D.P.; Barbosa, M.A.; Canal, L. Variabilidade espacial dos atributos físicos em áreas cultivadas com mamão sob diferentes preparos do solo. Rev. Eng. Na Agric. 2016, 22, 150–161. [Google Scholar] [CrossRef]
  29. Azevedo, E.C. Use of Geostatistics and Geoprocessing Resources in the Diagnosis of the Degradation of a Clay Soil under Pasture in the State of Mato Grosso. Ph.D. Thesis, University of Campinas, Campinas, Brazil, 2004. (In Portuguese). [Google Scholar]
  30. Soares, M.D.R.; Campos, M.C.C.; Souza, Z.M.; Brito, W.B.M.; Franciscon, U.; Castione, G.A. Spatial variability of soil physical attributes in an area of Terra Preta Arqueológica under pasture in Manicoré, AM. Rev. De Ciências Agrárias Amaz. J. Agric. Environ. Sci. 2015, 58, 434–441. (In Portuguese) [Google Scholar]
  31. Centeno, L.N.; Guevara, M.D.F.; Cecconello, S.T.; Sousa, R.O.; Timm, L.C. Soil texture: Concepts and applications in sandy soils. Rev. Bras. De Eng. E Sustentabilidade 2017, 4, 31–37. (In Portuguese) [Google Scholar]
  32. Almeida, K.S.S.A.; Souza, L.S.; Paz, V.P.S.; Silva, F.T.S.; Santos, D.N.; Pereira, J.S.L. Spatial variability of the hydraulic conductivity of saturated soil in a dystrocoeso yellow latosol, in the municipality of Cruz das Almas. Irriga 2018, 22, 259–274. (In Portuguese) [Google Scholar] [CrossRef]
  33. Martins, F.P.; Santos, E.L. Water infiltration rate and soil resistance to penetration under use and management systems. Acta Iguazu 2017, 6, 28–40. (In Portuguese) [Google Scholar]
  34. Neto, M.; Oliveira, J.; Mello, C.R.D.; Silva, A.M.D.; Mello, J.M.D.; Viola, M.R.; Yanagi, S.D.N.M. Temporal stability of soil moisture under effect of three spacings in a eucalyptus stand. Acta Sci. Agron. 2017, 39, 393–400. (In Portuguese) [Google Scholar] [CrossRef] [Green Version]
  35. Andrade, R.S.; Stone, L.F.; Godoy, G.S. Estimation of soil resistance to penetration based on S index and effective stress. Rev. Bras. De Eng. Agrícola E Ambient. 2013, 17, 932–937. (In Portuguese) [Google Scholar] [CrossRef] [Green Version]
  36. Stolf, R.; Faganello, B.F. Use of the Impact Penetrometer, Model IAA/Planalsucar-Stolf, in Recommending Soil Preparation at Usina Nossa Senhora Aparecida (Pontal-SP), 3rd ed.; STAB: Piracicaba, Brazil, 1983; pp. 11–22. (In Portuguese) [Google Scholar]
  37. Pedrotti, A.; Pauletto, E.A.; Crestana, S.; Ferreira, M.M.; Dias, M.S.; Gomes, A.S.; Turatti, A.L. Mechanical resistance to penetration of a Planosol submitted to different cultivation systems. Rev. Bras. De Ciência Do Solo 2001, 25, 521–529. (In Portuguese) [Google Scholar] [CrossRef]
  38. Busscher, W.J.; Bauer, P.J.; Camp, C.R.; Sojka, R.E. Correction of cone index for soil water content differences in a coastal plain soil. Soil Tillage Res. 1997, 43, 205–217. [Google Scholar] [CrossRef]
  39. Bergamin, A.C.; Vitorino, A.C.T.; Franchini, J.C.; Souza, C.M.A.; Souza, F.R. Compaction in an Oxisol distroférrico and its relations with the root growth of corn. Rev. Bras. De Ciência Do Solo 2010, 34, 681–691. (In Portuguese) [Google Scholar] [CrossRef] [Green Version]
  40. Calonego, J.C.; Gomes, T.C.; Santos, C.H. Development of cover plants in compacted soil. Biosci. J. 2011, 27, 289–296. (In Portuguese) [Google Scholar]
  41. Andrade, R.; Silva, S.H.G.; Faria, W.M.; Poggere, G.C.; Barbosa, J.Z.; Guilherme, L.R.G.; Curi, N. Proximal sensing applied to soil texture prediction and mapping in Brazil. Geoderma Reg. 2020, 23, e00321. (In Portuguese) [Google Scholar] [CrossRef]
  42. Beltrame, L.F.S.; Gondin, L.A.P.; Taylor, J.C. Structure and compaction in soil permeability Rio Grande do Sul. Rev. Bras. De Ciência Do Solo 1981, 5, 145–149. (In Portuguese) [Google Scholar]
  43. Souza, Z.M.; Silva, M.L.S.; Guimarães, G.L.; Campos, D.T.S.; Carvalho, M.P.; Pereira, G.T. Spatial variability of physical attributes in a dystrophic Red Latosol under no-tillage in Selviria (MS). Rev. Bras. De Ciência Do Solo 2001, 25, 699–707. (In Portuguese) [Google Scholar] [CrossRef] [Green Version]
  44. Abreu, S.L.; Reichert, J.M.; Silva, V.R.D.; Reinert, D.J.; Blume, E. Spatial variability of soil physical-water properties, yield and quality of wheat grains in Sandy Franc Argisol under no-tillage. Ciência Rural 2003, 33, 275–282. (In Portuguese) [Google Scholar] [CrossRef]
  45. Mercante, E.; Uribe–Opazo, M.A.; Souza, E.G. Spatial variability of water infiltration into soil under pasture as a function of trampling intensity. Rev. Bras. De Ciência Do Solo 2003, 27, 1149–1159. (In Portuguese) [Google Scholar] [CrossRef] [Green Version]
  46. Scapinelli, A.; Deina, F.R.; Valadão Junior, D.D.; Valadão, F.C.A.; Pereira, L.B. Root system and productive components of sunflower in compacted soil. Bragantia 2016, 75, 474–486. (In Portuguese) [Google Scholar] [CrossRef] [Green Version]
  47. Machado, A.L.T.; Reis, A.V.; Ferreira, M.F.P.; Machado, R.L.T.; Machado, A.L.C.; Bauer, G.B. Influence of the inflation pressure of the tractor tire on the resistance of the soil to penetration. Rev. Bras. De Agrociência 2005, 11, 481–486. (in Portuguese). [Google Scholar]
Figure 1. Location of the experimental area.
Agriengineering 05 00082 g001
Figure 2. Kriging map of UG and RP at depths 0–20, 20–40 and 40–60 cm in area 1. (A) Spatial distribution of UG of 0–20 cm in g g−1; (B) spatial distribution of RP of 0–20 cm in MPa; (C) spatial distribution of UG of 20–40 cm; (D) spatial distribution of 20–40 cm RP in MPa; (E) spatial distribution of 40–60 cm UG in g g−1; (F) spatial distribution of 40–60 cm PR in MPa.
Agriengineering 05 00082 g002aAgriengineering 05 00082 g002b
Figure 3. Kriging map of UG and RP at depths 0–20, 20–40 and 40–60 cm in area 2. (A) Spatial distribution of UG of 0–20 cm in g g−1; (B) spatial distribution of RP of 0–20 cm in MPa; (C) spatial distribution of UG of 20–40 cm; (D) spatial distribution of 20–40 cm RP in MPa; (E) spatial distribution of 40–60 cm UG in g g−1; (F) spatial distribution of 40–60 cm RP in MPa.
Agriengineering 05 00082 g003aAgriengineering 05 00082 g003b
Table 1. Soil granulometric analysis at depths 0–20, 20–40 and 40–60 cm of area 1.
Depths (cm)Clay CoarseClay ThinSiltSand
%
0–203225.412.630
20–403225.312.730
40–603125.412.631
Table 2. Soil granulometric analysis at depths 0–20, 20–40 and 40–60 cm of area 2.
Depths (cm)Clay CoarseClay ThinSiltSand
%
0–201414.91160
20–401414.81160.2
40–6014.214.81160
Table 3. System of gravimetric moisture categories.
ClassesUG (g g–1)
Dry<20
Less dry20–30
Less wet30–40
Wet>40
Table 4. System of categories of soil resistance to penetration.
CategoriesRP (MPa)
Lower<0.1
Moderate0.1–2.0
Much>2.0
High4.0–8.0
Table 5. Geostatistics of UG (g g–1) and RP (MPa) in the layers 0–20, 20–40 and 40–60 cm from area 1.
ModelC0C0 + C1aR2DSD
Depth 0–20 (cm)
UGGaus0.142.636.60.72weak
RPGaus00.056.90.71weak
Depth 20–40 (cm)
UGGaus0.140.036.40.78weak
RPGaus00.577.40.91weak
Depth 40–60 (cm)
UGGaus0.160.126.40.65weak
RPGaus00.669.80.92weak
Model: Gaus: Gaussian model; a: range (m); (C0 + C1): sill variance; C0: nugget effect, R2: determination coefficient, DSD: degree of spatial dependence.
Table 6. Geostatistics of soil gravimetric moisture and soil mechanical resistance to penetration at depths of 0–20, 20–40 and 40–60 cm from area 2.
ModelC0C0 + C1aR2DSD
Depth 0–20 (cm)
UGGaus0.0114.568.10.9weak
RPGaus00.078.10.84weak
Depth 20–40 (cm)
UGGaus00.278.50.92weak
RPGaus00.298.70.84weak
Depth 40–60 (cm)
UGExp1.816.444.70.77weak
RPGaus00.157.90.92weak
Model: Gaus: Gaussian model; Exp: exponential model; a: range (m); (C0 + C1): sill variance; C0: nugget effect, R2: determination coefficient, DSD: degree of spatial dependence.
Disclaimer/Publisher’s Note: The statements, opinions and data contained in all publications are solely those of the individual author(s) and contributor(s) and not of MDPI and/or the editor(s). MDPI and/or the editor(s) disclaim responsibility for any injury to people or property resulting from any ideas, methods, instructions or products referred to in the content.

