Article

Experimental Investigation of Methane Generation in the Presence of Surface and Un-Surface Nanoparticles of Iron Oxide

by
Asim Ali
1,
Hareef Ahmed Keerio
2,3,*,
Sallahuddin Panhwar
4 and
Muhammad Zeshan Ahad
5
1
Department of Civil Engineering Technology, Benazir Bhutto Shaheed University of Technology & Skill Development, Khairpur 66020, Pakistan
2
Department of Civil and Environmental Engineering, Hanyang University, Seoul 04763, Korea
3
Department of Environmental Engineering, Quaid E Awam University of Engineering Science and Technology, Nawabshah 67450, Pakistan
4
Department of Civil Engineering, Balochistan University of Engineering and Technology, Khuzdar 98100, Pakistan
5
Department of Civil Engineering, Iqra National University, Peshawar 25100, Pakistan
*
Author to whom correspondence should be addressed.
AgriEngineering 2022, 4(1), 134-140; https://doi.org/10.3390/agriengineering4010009
Submission received: 7 December 2021 / Revised: 26 January 2022 / Accepted: 2 February 2022 / Published: 8 February 2022
(This article belongs to the Special Issue Agricultural Waste: Biomass as a Source of Energy)

Abstract

:
The exploitation and harnessing of renewable energies are becoming increasingly important throughout the world. This study presents a method of methane (CH4) generation using biological disintegration of food waste (FW) by anaerobic digestion (AD). The CH4 production was enhanced by the addition of three different types of iron oxide (Fe3O4) nanoparticles (NPs) (Cetyletrimethlebromide (CTAB), urea-capped Fe3O4 NPs and Fe3O4 NPs without capping). The bio generation of CH4 and biodegradation of volatile solids (VS) were carried out in an AD treatment at mesophilic conditions (35–37 °C) for more than 50 days in batch mode. The concentration of all three types of NPs was kept constant at 75 mg/L. It was noticed that urea-capped NPs produced the maximum CH4 (5.386 L), followed by Fe3O4 NPs (5.212 L). Methane production in the control bioreactor was 2.143 L. The experimental results of CH4 generation (a dependent variable) were analyzed against the concentrations of NPs used (as independent variables) in multiple regression analysis (MRA). The overall model for the experiments resulted in R2 and R-adjusted values of 0.995 and 0.993, respectively.

1. Introduction

Global warming and rapid urbanization have become big problems that must be talked about and managed. An increasing population and mass migration of people from rural to urban areas have added extra pressure to the energy demand in developed and developing nations [1]. On the other hand, in a report by the WWF, the burning of fossil fuels is reported as the primary contributor to global warming. With this in mind, renewable energy sources have been cited as the best alternative to decrease environmental pollution [2,3].
Alternative renewable energy sources include wind, solar, tidal, and biomass, and their use is planned to add energy production on a priority basis. The generation of biogas (which consists of 50–60% of methane with an upper calorific value of 6.0 KWh/m3 at standard temperature and pressure (STP)) is achieved from the oxygen-free bio-disintegration of biomass such as animal manure, crop residue, food waste, etc. [4,5]. Anaerobic digestion (AD) has been reported as a well-established and well-proven technology to treat organic waste (OW) [6]. AD treatment depends on multiple factors such as pH, temperature, organic loading, supplements, and pretreatment types and extents. Nanotechnology has shown excellent compatibility and promising results in AD in recent years. In the literature, it is reported that the addition of nanoparticles (NPs) enhanced methane generation (CH4) from 21.5% (size of NPs lies between 50 to 100 nm) to greater than 150% by offering a greater surface area, a high reaction rate, and accelerated enzymatic activities [7,8]. Anaerobic digestion (AD) of organic matter (OM) has always been questioned due to the time-consuming bio-disintegration process. NPs have been called biodegradation accelerators due to their unique physicochemical properties. Therefore, urea-capped Fe3O4 nanoparticles (U–Fe3O4 NPs) are attractive materials for enhancing methane gas production by improving polycyclic aromatic hydrocarbons (PAHs) [9,10,11]. The mathematical demonstration of experimental results is as important as novel research. It enhances our understanding of physical processes by establishing models to design and upscale future lab work [12]. In this regard, Nweke et al. [13] and Nwabanne et al. [14] applied a first-order kinetic model to determine the substrate consumption rate. Furthermore, the Monod model and modified Gompertz model were reported to predict microbial or biomass growth and methane production, respectively [15,16,17,18]. Moreover, Sung and Liu conducted a linear regression analysis to describe ammonia inhibition in anaerobic digestion. In another study, multiple regression analysis (MRA) was applied to compare the biomethane potential (BMP) of various feedstocks [19,20].
Hence, this study was designed to carry out a MRA of anaerobically produced methane in the presence of NPs. During the mathematical analysis, the cumulative CH4 production from the control bioreactor (Rc) is established as the dependent variable and the bioreactors supplemented with NPs (Fe3O4, CTAB-capped, urea-capped) as the independent variables. This study provides data from a statistical analysis of the AD process when augmented with NPs.

2. Materials and Methods

2.1. Materials and Chemicals

Iron chloride tetra and hexahydrate (Fe-II and Fe-III) were used as fundamental salts to synthesize the NPs. The synthesis process was the same as in [8], the results of which have been published in our previous studies [4,18]. Non-homogeneous leftover food waste (FW) was used as a substrate and was collected from various on-campus locations.

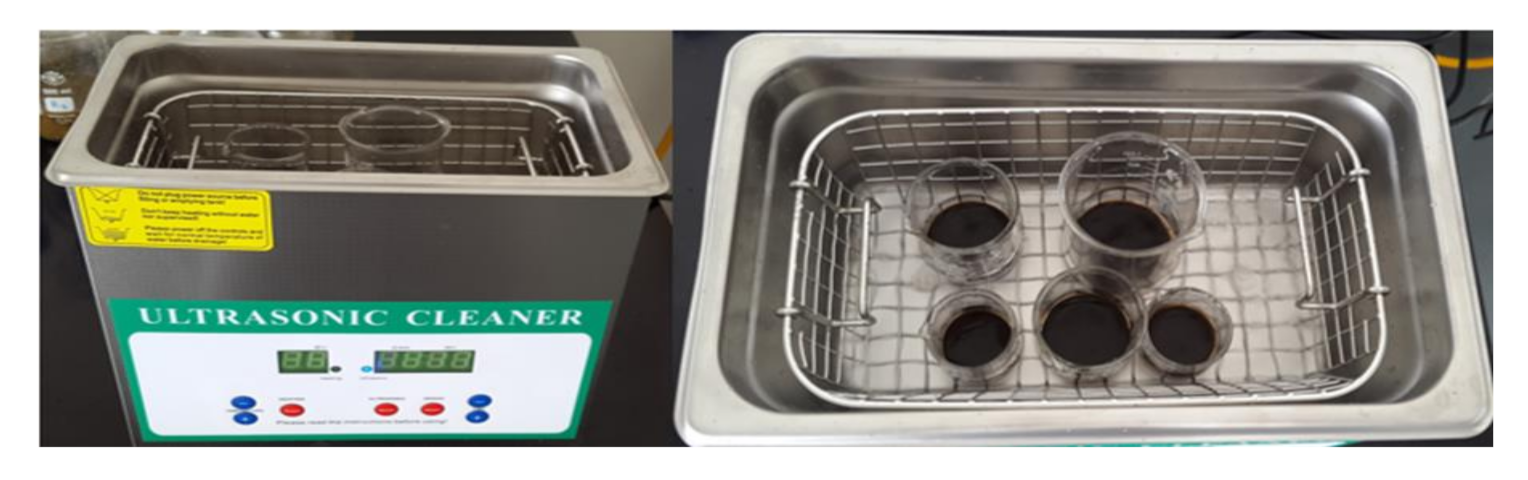
2.2. Substrate and Nanoparticles Preparation

Before adding NPs to the bio digesters, the dried NPs were sonicated using a Sonicator (IK/UTSB/01), IMehran University, Jamshoro, Pakistan at 40 °C for 15 min to remove impurities and liquefy the NPs as shown in Figure 1. Then, the impurities were slowly removed from the surface.
The leftover FW contained various wastes, which included mainly cooked and some uncooked portions. Initially, the biodegradables were separated from the non-biodegradables manually. The size was reduced using a mechanical grinder as shown in Figure 2; thus, the homogeneity of the fractions was ensured.

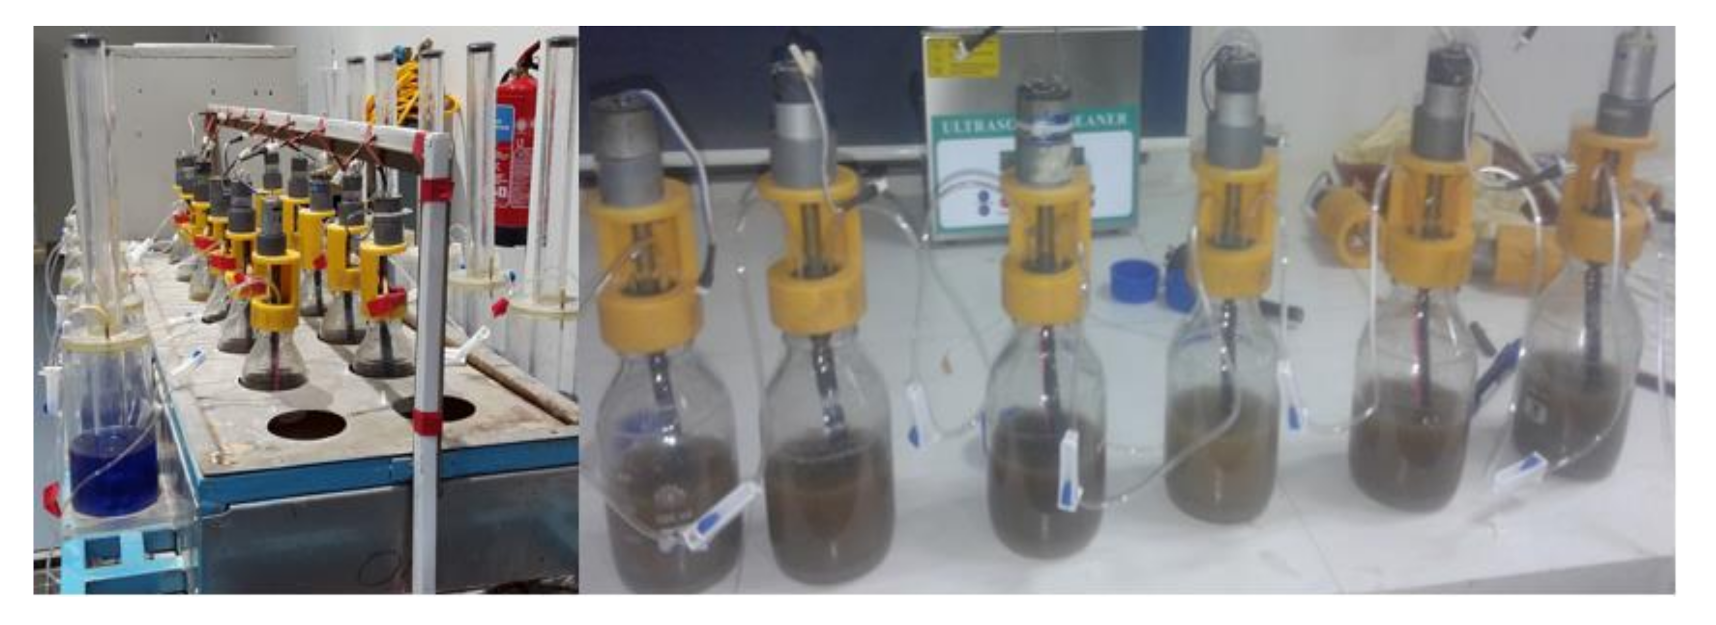
2.3. Experimental Setup

The AD of FW was set to mesophilic conditions (35–37 °C) in a batch mode for 50 days. We used 500 mL culture bottles as the bioreactors with a 300 mL working volume, as presented in Figure 3. Organic loading and NP concentration (except control, Rc) in each bioreactor were set to 6.653 gVS and 75 mg/L, respectively. The bioreactors were labeled Rct, Ru, Ri, CTAB capped loaded, urea added, and Fe3O4 supplemented.
Each bioreactor was run in duplicate to improve the accuracy of the reading. Before the bioreactors were placed into the thermally coupled water bath, nitrogen gas (N2) was used to purge the bioreactors for 5–10 min to confirm the anaerobic conditions. Furthermore, DC motors were installed for mixing the substrate for 30 s every 30 min. An alkali solution of 5M NaOH was used to measure CH4 by adsorbing the other gases, as reported in [21]. Note that methane generation was measured every day. All the pre-and post-parameters were analyzed during batch assays [4,18,22].

2.4. Regression Model

This study aimed to find an equation that describes or summarizes the relationships in a set of data [23]. The data set is based on the impact of different types of NPs on methane generation and was studied using linear regression (single factor/variable) and multiple regression models (MRM) in MS Excel 2016 (Microsoft, Redmond, WA, USA). Kafle and Chen performed the analysis using an earlier version of MS Excel (2007) [20]. Furthermore, this model was created in order to analyze the straight-line relationships between the four variables. The general multiple regression estimates the ʎs in the equation as [20]:
Y = ʎ 0 + ʎ 1 X 1 + ʎ 2 X 2 + ʎ 3 X 3 + + ʎ n X n
where Xn represents an independent variable (IV’s) and Y is the dependent variable. The ʎs are the unknown regression coefficients. The significance of the results was determined by assuming a confidence interval (α = 0.05) of 95%.

3. Results and Discussion

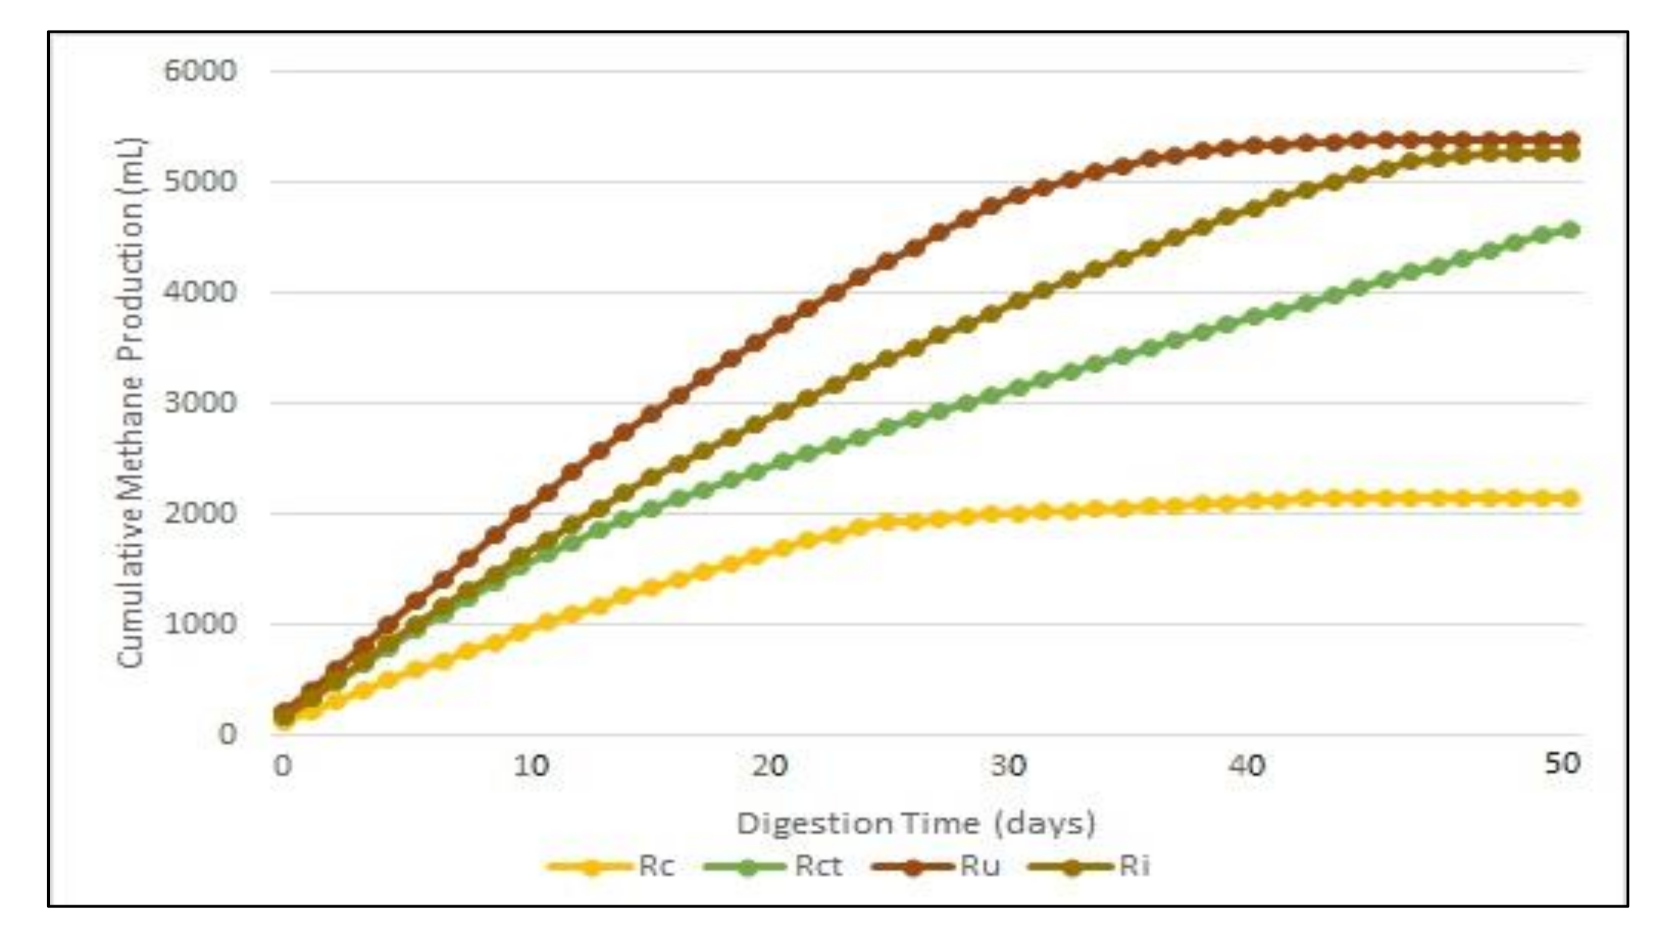
3.1. Nanoparticles vs. Methane Generation

The impact of the addition of NPs was experimentally studied in the batch mode of AD of FW to enhance bio-methane generation. Figure 4 shows that the bioreactors loaded with NPs (Ru, Rct, and Ri) exhibit high methane production. Abdelsalam et al. [8] reported a 1.6-fold enhancement of methane when 20 mg/L of Fe3O4 NPs were added to bioreactors. In our study, Fe2O4, CTAB, and urea-capped NPs enhanced CH4 generation by 1.45, 1.14, and 1.52 times at 75 mg/L concentration of NPs. Cumulatively, the methane production was 2.14 L, 4.584 L, 5.386 L, and 5.255 L in Rc, Rct, Ru, and Ri, respectively. Khalid et al. [24] observed a 129% increase in methane yield while treating rice straw in the presence of magnetite and alkali pretreatment. Moreover, Zhang et al. [25] reported that methanogens, which are the prime bacteria involved in methane generation, could be improved by adding nano zero-valent iron NPs [26]. This difference in CH4 production might be caused by the composition of substrate irrespective of NP concentration. FW contains various components, and each component has its own biodegradability capacity. Apart from the bio methane increment, the addition of NPs increased biocompatibility and improved process stability. The effect of NPs on pH, VS, TS, and other improvements in kinetics has been discussed and reported in our previous studies [4,18]. Furthermore, the supplementation of NPs expanded methane generation, accelerated the hydrolysis rate and reduced the lag phase.
The addition of NPs endured the highest removal of volatile and total solids, which reached more than 92% and 90%, respectively [18]. Meanwhile, 20 mg/L of Fe3O4 achieved 74% removal [8]. The results of our study conflict with the findings of Abdelsalam, who used a two-stage system involving a thermophilic liquefaction reactor and a mesophilic anaerobic filter to convert over 95% of volatile solids to methane [27].

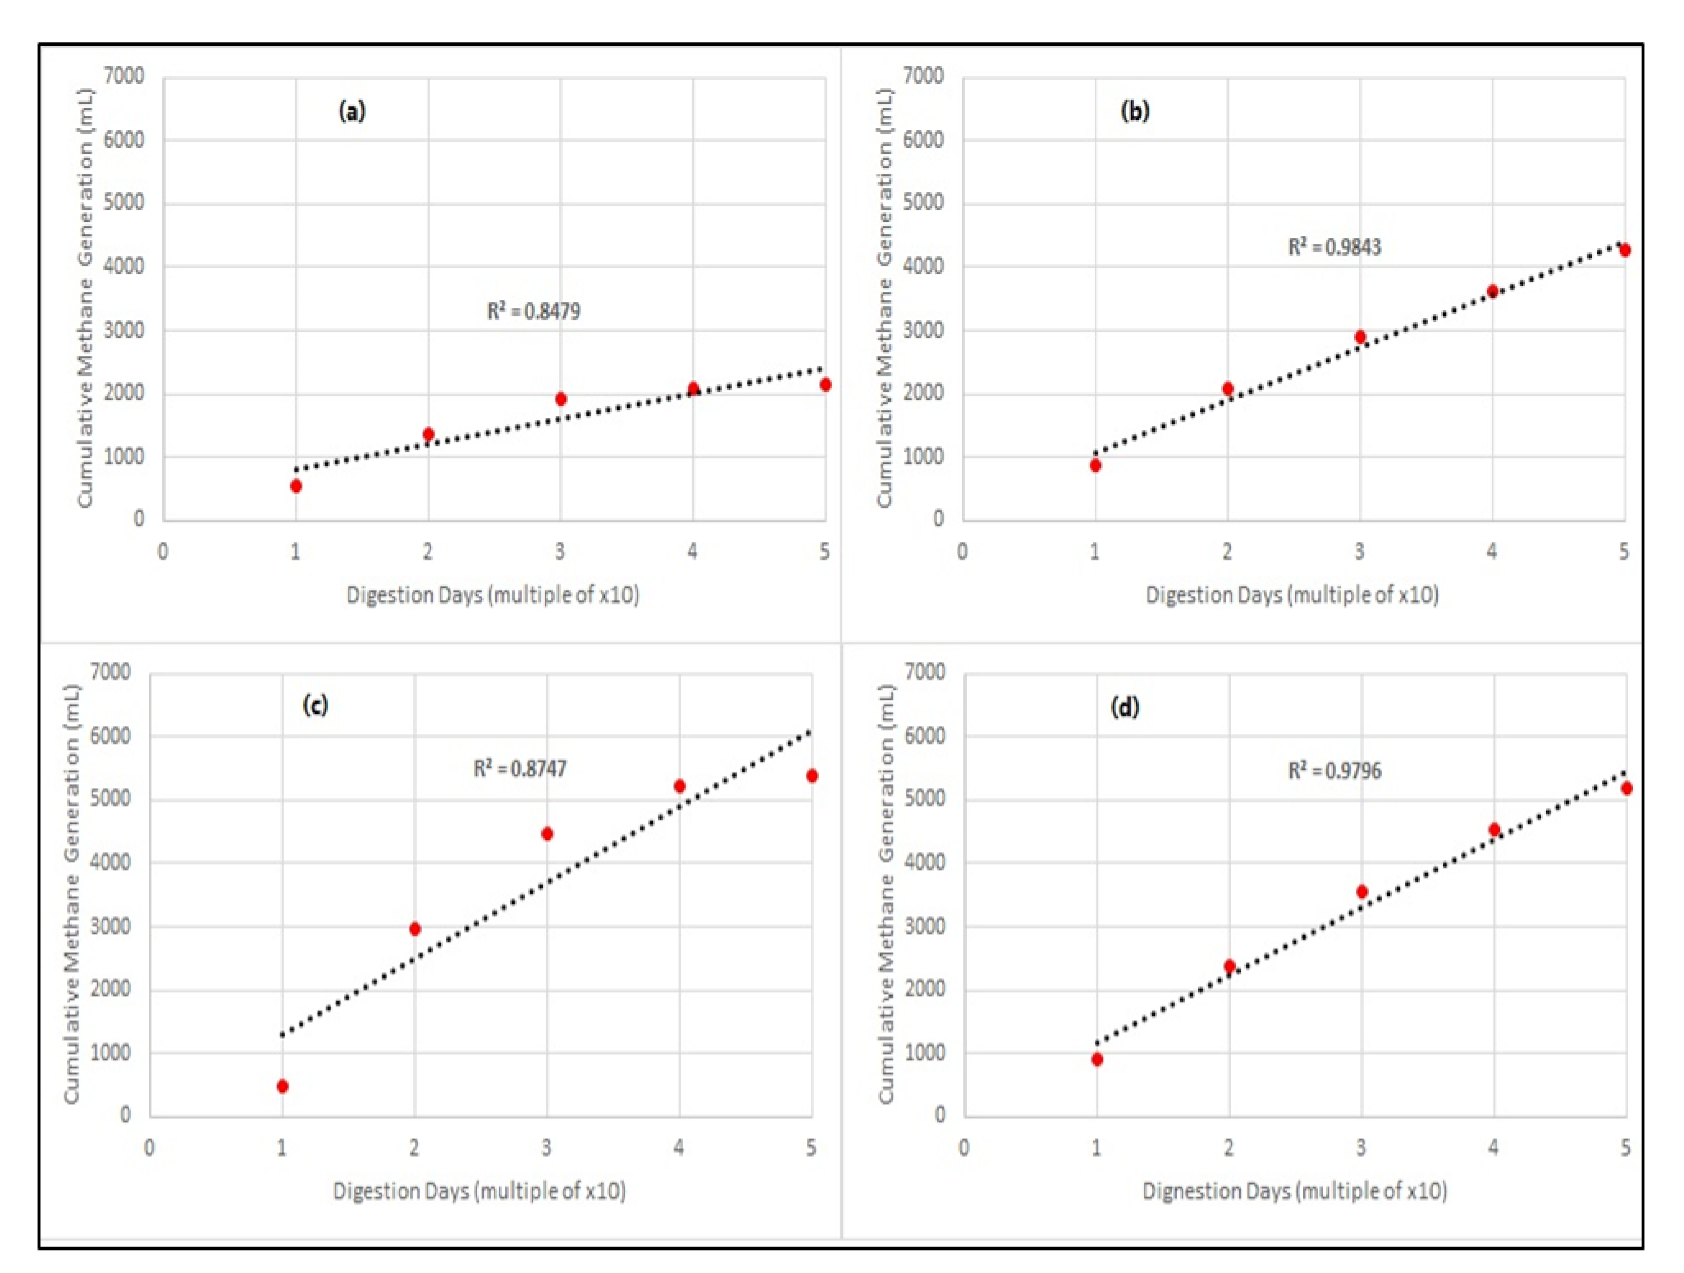
3.2. Linear Regression Analysis (LRA)

The impact of NP addition on cumulative CH4 generation was analyzed by considering single-variable data. Figure 5 illustrates the scattered nature of the linear model of experimentally generated CH4. In Figure 5a–d, the R2 lies in the range of 0.848 to 0.984. This shows that the linear regression model fits well with the experimental data.

3.3. Multiple Regression Analysis (MAR)

All four variables (Rc, Rct, Ru, and Ri) were considered together during our analysis. The effect of different variables has been studied in the literature [28,29]. The MAR fit the data well and produced a 0.993 coefficient of determination (R2). The R-adjusted was found to be 0.993, but with the linear regression model R2 was 0.848 to 0.984 (Table 1). The results in this study are closer to the effects of multiple regression analyses presented by [29]. More than 99% invariance in methane generation in the control bioreactor was observed by adding NPs to the bioreactors.
The details of this analysis in MS Excel 2016 are given in the Supplementary Materials at the end of this article. The experimental data show that the maximum production of CH4 was achieved at 50 days of digestion. The R-adjusted value also confirms that 50 days of digestion is sufficient to measure the methane potential. In Table 1, the Sig-F value, which is lower than α = 0.05, confirms that the methane production was significantly improved when NPs were added. The general multiple regression models developed based on the nonstandard coefficients is given in Equation (2):
Y C H 4 = 44.485 + 0.384 R c t + 0.588 R u 0.525 R i  
where YCH4 is the cumulative methane yield from Rc, which was set as a dependent variable. To test the validity of MRM, a global test must be used, which determines whether all the independent variables have regression coefficients equal to zero. The samples of regression coefficients correspond to the regressions as reported by [29,30]. In another study, the multiple regression model was estimated by considering three independent variables as given in Equation (3):
G 0 = 163.8 + 12.85 C P 13.06 L I G + 7.85 A D F
where G0 is the methane potential, CP is the crude protein, LIG is lignin, and ADF is acid detergent fiber. This model was found to be the best fit to predict the experimental results when R2 and R-adjusted were both 0.999. Therefore, the results of this study are entirely in agreement with the results of [20]. The summary of the complete regression analysis is given in the Supplementary Materials (Table S1).

4. Conclusions

The addition of NPs to AD boosted methane generation significantly with good process compatibility. Three of the performance indicators, namely the methane generation from Rct, Ru, and Ri, are significant predictors of the dependent variable CH4 production from Rc. Our regression analysis showed that the multiple regression model (MRM) best fits the experimental data rather than the single factor/variable regression model. The R2 and R-adjusted coefficients of the MRM were found to be good. Thus, we mathematically demonstrated that adding NPs significantly improved CH4 generation.

Supplementary Materials

The following are available online at https://www.mdpi.com/article/10.3390/agriengineering4010009/s1, Figure S1: Data for regression analysis, Table S1: Data in trend format for regression analysis.

Author Contributions

Conceptualization, A.A. and H.A.K.; methodology, S.P.; software, A.A. and M.Z.A.; validation, A.A. and S.P.; formal analysis, H.A.K.; investigation, H.A.K.; resources, A.A.; data curation, A.A.; writing—original draft preparation, A.A.; writing—review and editing, H.A.K. and S.P.; funding acquisition, self-funding by all four authors (A.A., H.A.K., S.P. and M.Z.A.). All authors have read and agreed to the published version of the manuscript.

Funding

Self-funded.

Institutional Review Board Statement

Not applicable.

Informed Consent Statement

Not applicable.

Data Availability Statement

Not applicable.

Conflicts of Interest

The authors declare no conflict of interest.

References

  1. Ali, A.; Mahar, R.B.; Sheerazi, S.T.H. Renewable Electricity Generation from Food Waste through Anaerobic Digestion in Pakistan: A Mini-Review. Earth Syst. Environ. 2019, 3, 95–100. [Google Scholar] [CrossRef]
  2. Panwar, N.L.; Kaushik, S.C.; Kothari, S. Role of renewable energy sources in environmental protection: A review. Renew. Sustain. Energy Rev. 2011, 15, 1513–1524. [Google Scholar] [CrossRef]
  3. Dincer, I.; Midilli, A.; Hepbasli, A.; Karakoc, T.H. (Eds.) Global Warming: Engineering Solutions; Springer Science & Business Media: Oshawa, CA, USA, 2009. [Google Scholar]
  4. Ali, A.; Mahar, R.B.; Soomro, R.A.; Sherazi, S.T.H. Fe3O4 nanoparticles facilitated anaerobic digestion of organic fraction of municipal solid waste for enhancement of methane production. Energy Sources Part A Recovery Util. Environ. Eff. 2017, 39, 1815–1822. [Google Scholar] [CrossRef]
  5. Baek, G.; Kim, J.; Kim, J.; Lee, C. Role and potential of direct interspecies electron transfer in anaerobic digestion. Energies 2018, 11, 107. [Google Scholar] [CrossRef] [Green Version]
  6. Salminen, E.A.; Rintala, J.A. Semi-continuous anaerobic digestion of solid poultry slaughterhouse waste: Effect of hydraulic retention time and loading. Water Res. 2002, 36, 3175–3182. [Google Scholar] [CrossRef]
  7. Ye, Q.; Zhang, Z.; Huang, Y.; Fang, T.; Cui, Q.; He, C.; Wang, H. Enhancing electron transfer by magnetite during phenanthrene anaerobic methanogenic degradation. Int. Biodeterior. Biodegrad. 2018, 129, 109–116. [Google Scholar] [CrossRef]
  8. Abdelsalam, E.; Samer, M.; Attia, Y.A.; Abdel-Hadi, M.A.; Hassan, H.E.; Badr, Y. Influence of zero valent iron nanoparticles and magnetic iron oxide nanoparticles on biogas and methane production from anaerobic digestion of manure. Energy 2017, 120, 842–853. [Google Scholar] [CrossRef]
  9. Gong, L.; Yang, X.; You, X.; Wang, J.; Zhou, J.; Zhou, Y.; Yang, J. Explore the effect of Fe3O4 nanoparticles (NPs) on anaerobic digestion of sludge. Environ. Technol. 2020, 11, 4093–4107. [Google Scholar] [CrossRef]
  10. Panhwar, S.; Aftab, A.; Keerio, H.A.; Sarmadivaleh, M.; Tamer, U. A Novel Approach for Real-Time Enumeration of Escherichia coli ATCC 47076 in Water through High Multi-Functional Engineered Nano-Dispersible Electrode. J. Electrochem. Soc. 2021, 168, 037514. [Google Scholar] [CrossRef]
  11. Panhwar, S.; Aftab, A.; Muqeet, M.; Keerio, H.A.; Solangi, G.S.; Suludere, Z.; Tamer, U. High-Performance E. coli Antibody-Conjugated Gold Nanorods for the Selective Electrochemical Detection of Pathogens in Drinking Water. J. Electron. Mater. 2021, 50, 7119–7125. [Google Scholar] [CrossRef]
  12. Ali, A.; Mahar, R.B.; Abdelsalam, E.M.; Sherazi, S.T.H. Kinetic Modeling for Bio augmented Anaerobic Digestion of the Organic Fraction of Municipal Solid Waste by Using Fe3O4 Nanoparticles. Waste Biomass Valorization 2018, 10, 1–12. [Google Scholar] [CrossRef]
  13. Nweke, C.N.; Nwabanne, J.T.; Igbokwe, P.K. Kinetics of batch anaerobic digestion of vegetable oil wastewater. Open J. Water Pollut. Treat. 2014, 1, 1–10. [Google Scholar] [CrossRef]
  14. Nwabanne, J.T.; Okoye, A.C.; Ezedinma, H.C. Kinetics of anaerobic digestion of palm oil mill effluent. Can. J. Pure Appl. Sci. 2012, 6, 1877. [Google Scholar]
  15. Keerio, H.A.; Bae, W.; Park, J.; Kim, M. Substrate uptake, loss, and reserve in ammonia-oxidizing bacteria (AOB) under different substrate availabilities. Process Biochem. 2020, 91, 303–310. [Google Scholar] [CrossRef]
  16. Keerio, H.A.; Bae, W. Experimental Investigation of Substrate Shock and Environmental Ammonium Concentration on the Stability of Ammonia-Oxidizing Bacteria (AOB). Water 2020, 12, 223. [Google Scholar] [CrossRef] [Green Version]
  17. Jeyaseelan, S. A simple mathematical model for anaerobic digestion process. Water Sci. Technol. 1997, 35, 185–191. [Google Scholar] [CrossRef]
  18. Ali, A.; Mahar, R.B.; Sherazi, S.T.H. Methane Augmentation of Anaerobic Digestion of Food Waste in the Presence of Fe3O4 and Carbamide Capped Fe3O4 Nanoparticles. Waste Biomass Valorization 2019, 11, 1–15. [Google Scholar] [CrossRef]
  19. Sung, S.; Liu, T. Ammonia inhibition on thermophilic anaerobic digestion. Chemosphere 2003, 53, 43–52. [Google Scholar] [CrossRef]
  20. Kafle, G.K.; Chen, L. Comparison on batch anaerobic digestion of five different livestock manures and prediction of biochemical methane potential (BMP) using different statistical models. Waste Manag. 2016, 48, 492–502. [Google Scholar] [CrossRef] [PubMed] [Green Version]
  21. Ariunbaatar, J.; Panico, A.; Esposito, G.; Pirozzi, F.; Lens, P.N. Pretreatment methods to enhance anaerobic digestion of organic solid waste. Appl. Energy 2014, 123, 143–156. [Google Scholar] [CrossRef]
  22. APHA. Standard Methods for the Examination of Water and Wastewater, 20th ed.; American Public Health Association (APHA): Washington, DC, USA, 1998. [Google Scholar]
  23. Keerio, H.A.; Panhwar, S.; Shah, S.A.; Naji, A.M.; Ali, A.; Aftab, A. Investigation of Climate Change Variability under Climate Change Conditions over the Semi-Arid Region. J. Mech. Contin. Math. Sci. 2020, 15, 46–54. [Google Scholar] [CrossRef]
  24. Khalid, M.J.; Waqas, A.; Nawaz, I. Synergistic effect of alkaline pretreatment and magnetite nanoparticle application on biogas production from rice straw. Bioresour. Technol. 2019, 275, 288–296. [Google Scholar] [CrossRef] [PubMed]
  25. Zhang, Y.; Feng, Y.; Quan, X. Zero-valent iron enhanced methanogenic activity in anaerobic digestion of waste activated sludge after heat and alkali pretreatment. Waste Manag. 2015, 38, 297–302. [Google Scholar] [CrossRef] [PubMed]
  26. Panhwar, S.; Sahito, A.R.; Solangi, G.S.; Mahar, R.B.; Lal, J. Methane production by anaerobic digestion of spent wash in continuous stirred tank reactor. Mehran Univ. Res. J. Eng. Technol. 2019, 38, 791–798. [Google Scholar] [CrossRef] [Green Version]
  27. Bouallagui, H.; Touhami, Y.; Cheikh, R.B.; Hamdi, M. Bioreactor performance in anaerobic digestion of fruit and vegetable wastes. Process Biochem. 2005, 40, 989–995. [Google Scholar] [CrossRef]
  28. Plotts, T. A Multiple Regression Analysis of Factors Concerning Superintendent Longevity and Continuity Relative to Student Achievement. Ph.D. Thesis, Seton Hall University, South Orange, NJ, USA, 2011. [Google Scholar]
  29. Turóczy, Z.; Marian, L. Multiple regression analysis of performance indicators in the ceramic industry. Procedia Econ. Financ. 2012, 3, 509–514. [Google Scholar] [CrossRef] [Green Version]
  30. Kulcsar, E. Multiple regression analysis of main economic indicators in tourism. Rev. Tur.—Stud. Cercet. Tur. 2009, 8, 59–64. [Google Scholar]
Figure 1. Removal of impurities from NPs by sonication.
Agriengineering 04 00009 g001
Figure 2. Preparation of substrate for anaerobic treatment.
Agriengineering 04 00009 g002
Figure 3. Lab scale batch mode anaerobic digester setup and bioreactors.
Agriengineering 04 00009 g003
Figure 4. The impact of NPs on cumulative methane generation in Ru, Ri, and Rct bioreactors with respect to Rc (control bioreactor).
Agriengineering 04 00009 g004
Figure 5. Simple linear regression plots; (a) Rc, (b) Rct, (c) Ru, and (d) Ri.
Agriengineering 04 00009 g005
Table 1. Analysis of variance (ANOVA).
Model Sum of SquaresdfMean SquareFSig-F
1Regression19,412,872.3636,470,957.4533448.9521470.00 a
Residual86,305.64594461876.209694
Total19,499,178.0149
a Predictors: (constant), CH4 generation from Rct, Ru, and Ri; Dependent variable: CH4 generation from Rc.
Publisher’s Note: MDPI stays neutral with regard to jurisdictional claims in published maps and institutional affiliations.

