1. Introduction
There are many soil benefits associated with using cover crops such as reduced runoff and soil erosion, increased infiltration and water holding capacity, increased soil organic carbon and decreased soil compaction [
1,
2]. In the Southeastern United States, three weeks is normally required from cover crop termination to cash crop planting to reduce competition with the cash crop nutrients and water [
3,
4]. Two weeks is the minimum time between cover crop termination and planting cash crop to replenish soil water [
5].
For decades, rolling technology has been used in the United States on no-till systems to mechanically terminate cover crops, but because of adverse spring weather conditions (too wet or too cold) producers use synthetic herbicide such as glyphosate (Roundup
TM) to accelerate cover crops death to keep recommended planting dates for subsequent cash crop. A multi-year field experiment conducted by Kornecki et al. [
6] has shown that kill rates for cereal rye (
Secale cereale, L.) one week after rolling were between 96% and 98% when using supplemental glyphosate with rolling. Nonetheless, synthetic herbicides cannot be used in organic production systems, and there is a push to reduce glyphosate use because of harmful effects on the environment.
Terminating tall cover crops (e.g., cereal rye) in a no-till system is associated with flattening and damaging plant tissue due to crimping action to promote desiccation. Desiccated cover crop residue forms a thick layer of mulch that completely covers the soil-protecting soil surface, constraining weed germination and conserving soil moisture [
7].
Because commercially available synthetic herbicides such as glyphosate are banned in organically grown cotton (
Gossypium hirsutum, L.), and organic herbicides are highly ineffective in terminating cover crops and expensive [
8], the only solution is to increase the mechanical termination effectiveness of cover crops using rollers/crimpers. However, to accomplish this goal, multiple rolling over the same cover crop area or developing forceful rollers/crimpers to reduce the number of passes are the only practical options.
The majority of researchers worldwide are in the agreement that multiple passes of heavy agricultural machinery over the same farming land area can significantly increase soil compaction and have negative effects associated with soil degradation. Repeated traffic in agricultural field operations (number of passes over the same area) increases soil compaction because soil degradation (soil structure deformation, by increasing bulk density or decrease in porosity) can correlate to the number of passes of equipment [
9]. Research has shown that soil quality was worsened in both scenarios of having a greater number of passes by a lighter tractor or by a heavy tractor with fewer passes [
10].
Conventional tillage systems are considered to have the most negative effect by inducing soil compaction that creates serious environmental problems worldwide [
11], because it degraded soil structure which often is difficult to assess from the top soil layers. This hidden degradation of soil structure is linked to particular problems such as inhibited plant growth and reduction of crop yields, and lower water infiltration that could be mistaken for other reasons besides soil compaction. Hamza and Anderson [
12] stated that soil compaction increases soil strength and decreases soil fertility by decreasing soil available water and nutrients, which can increase production costs with the need for additional fertilizer applications. Furthermore, low soil organic matter can rapidly decrease soil quality, as this problem has been known worldwide. Neve and Hofman [
13] indicated that soil compaction also has negatively affects the mineralization of soil organic carbon and nitrogen. In addition, soil compaction can lead to reduced oxygen supplies and increased levels of carbon dioxide in the soil that negatively impacts root growth [
14].
Benito et al. [
15] investigated the effects of conventional, minimum tillage, and zero-tillage on soil water, soil organic matter and soil compaction. They found that the zero-tillage treatment conserved much more soil water than conventional and minimum tillage treatments, especially in dry years, Moreover, for conventional tillage, soil compaction was present in the subsoil compared to the top soil. Wiermann et al. [
16] investigated the long-term effects of conventional and conservation tillage systems on soil properties and soil strength on a silty loam soil in Germany. They concluded that the recurrent deep impact of tillage tools in conventional tillage plots caused permanent destruction of freshly developed soil aggregates, resulting in a relatively weak soil structure in the tilled soil layers when failing to support applied single wheel dynamic loads as low as 2.5 tons. Conversely, in the conservation tillage plots, a single wheeling event with an applied 2.5 ton load was adequately handled with the help of a robust aggregate system and did not lead to structural degradation provided by reduced tillage.
To monitor soil compaction issues, the soil water infiltration rate is a good indicator, particularly in high soil moisture situations, where the difference in soil resistance between compacted soil (with traffic) and uncompacted soil (no traffic) is low and usually lower than the 2 MPa threshold that limits root growth. In contrast, as soils become drier, soil compaction in the topsoil becomes observable [
17]. Soil strength values have also been utilized to determine the degree of soil compaction because it mirrors soil resistance to root penetration [
12,
18,
19,
20,
21]. Research conducted by Aliev [
22] indicated that the most effective method of protecting soil from structural degradation and soil compaction issues is combining several independent agricultural field operations into single simultaneous runs, not only to reduce the number of wheel passes but to save farm resources. Cereal rye (
Secale cereale L.) is a popular cover crop in the United States that can also help with soil compaction issues as it is at least 1.5 m tall, and generates up to 10,000 kg ha
−1 of biomass that improves soil physical/chemical properties for better cash crop growth and reduced soil compaction [
23].
The United States is among countries such as India, China, Turkey, and Tanzania that produce 97% of the global organic cotton [
24]. Increased organic cotton production is stimulated by consumer demand, less regulatory restrictions and higher price to producers. In 2017, the U.S. planted 10,644 ha of organically grown cotton producing 5082 metric tons of lint with a slight increase of 1.3% in 2018 to 5380 metric tons of organic cotton production [
25]. This increase continued in 2019, as the United States produced 6657 metric tons of organic cotton lint which is a 20% increase compared to 2018 [
26]. The main concern related to no-till organic systems with cover crops is that synthetic herbicide use is prohibited, so the only effective way to terminate cover crops is through mechanical termination that might include repeating rolling/crimping over the same cover crop area. The concern is, however, that multiple rolling/crimping operations (multi-passes) might cause soil compaction issues.
Therefore, the objectives of this study were to: (1) determine the effectiveness of different roller/crimper designs in terminating cereal rye cover crop in single, double, and triple runs over the same cereal rye area, (2) determine effects of multiple rolling/crimping on soil compaction with associated gravimetric soil moisture content at two depths, and (3) to evaluate the effects of different rollers/crimpers on seed cotton yield in a conservation system.
2. Materials and Methods
A replicated three-year field experiment was initiated in 2014 in Central Alabama (E.V. Smith Research Center), USA by planting a rye cover crop in the fall of 2014 (10 November 2014) at a rate of 100 kg ha
−1 to determine the effectiveness of different rollers/crimpers in mechanical termination of a cereal rye cover crop. The test was conducted on a Compass loamy sand (thermic Plinthic Paleudults) soil. Each spring, rolling treatments were applied in late April when rye was at the milk growth stage (Zadoks #77, [
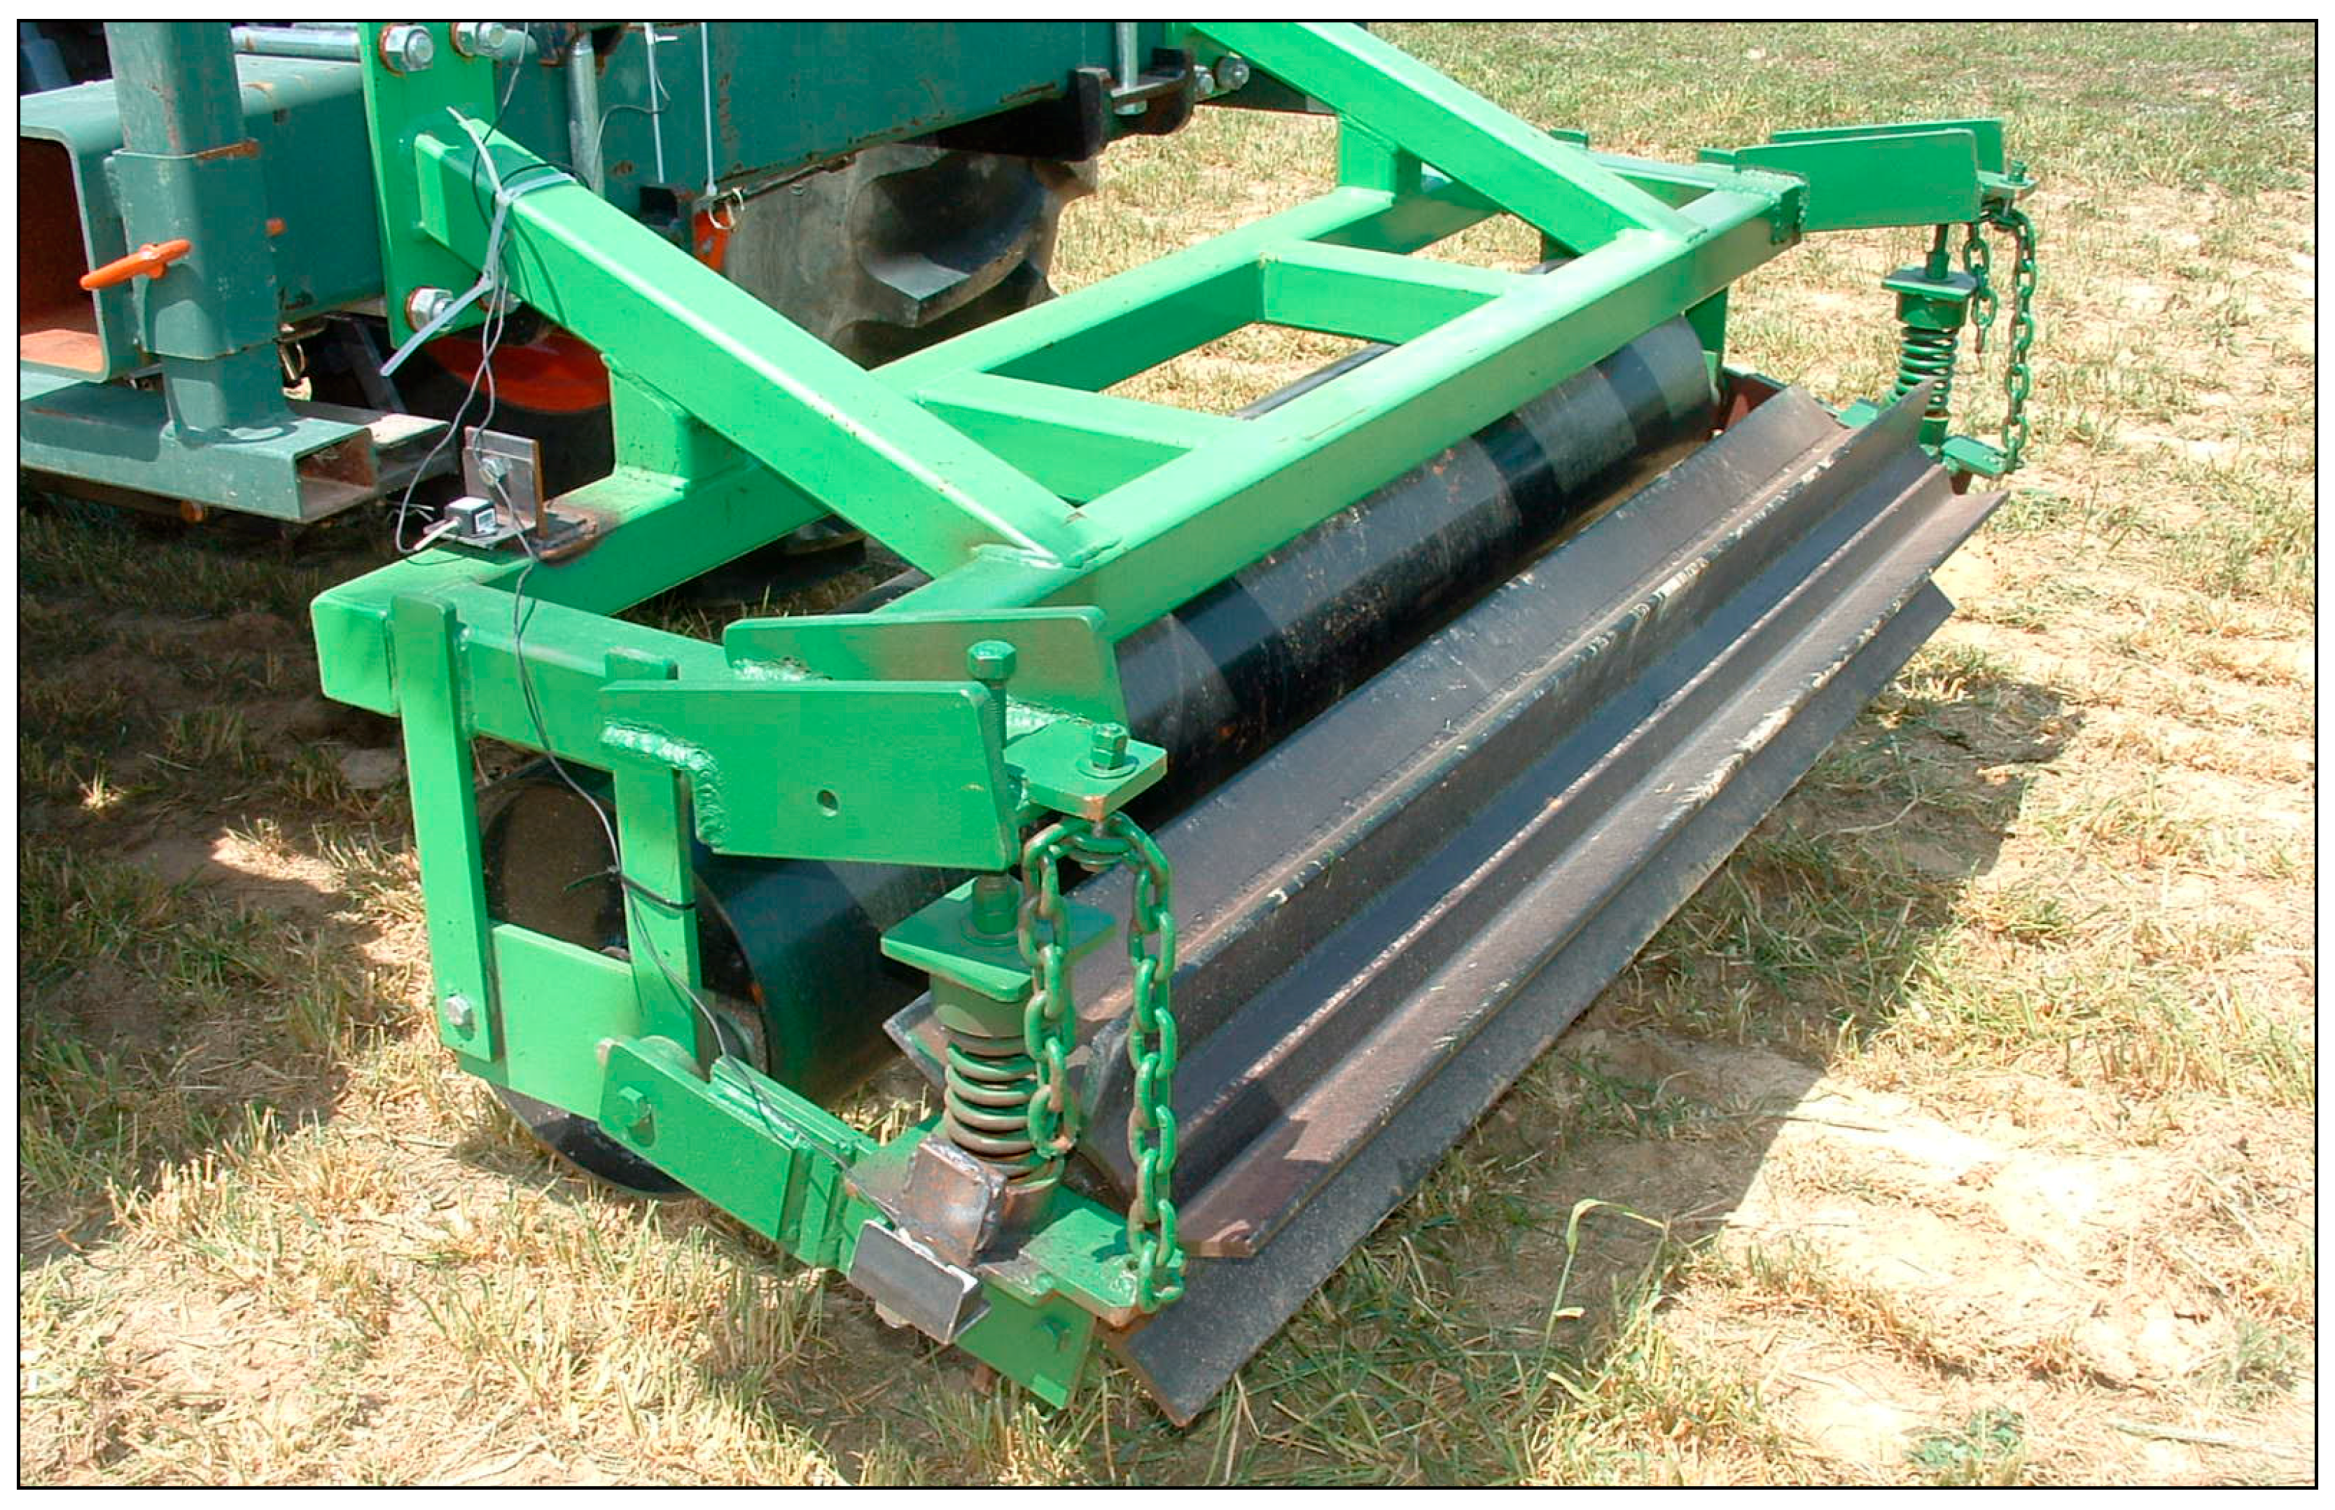
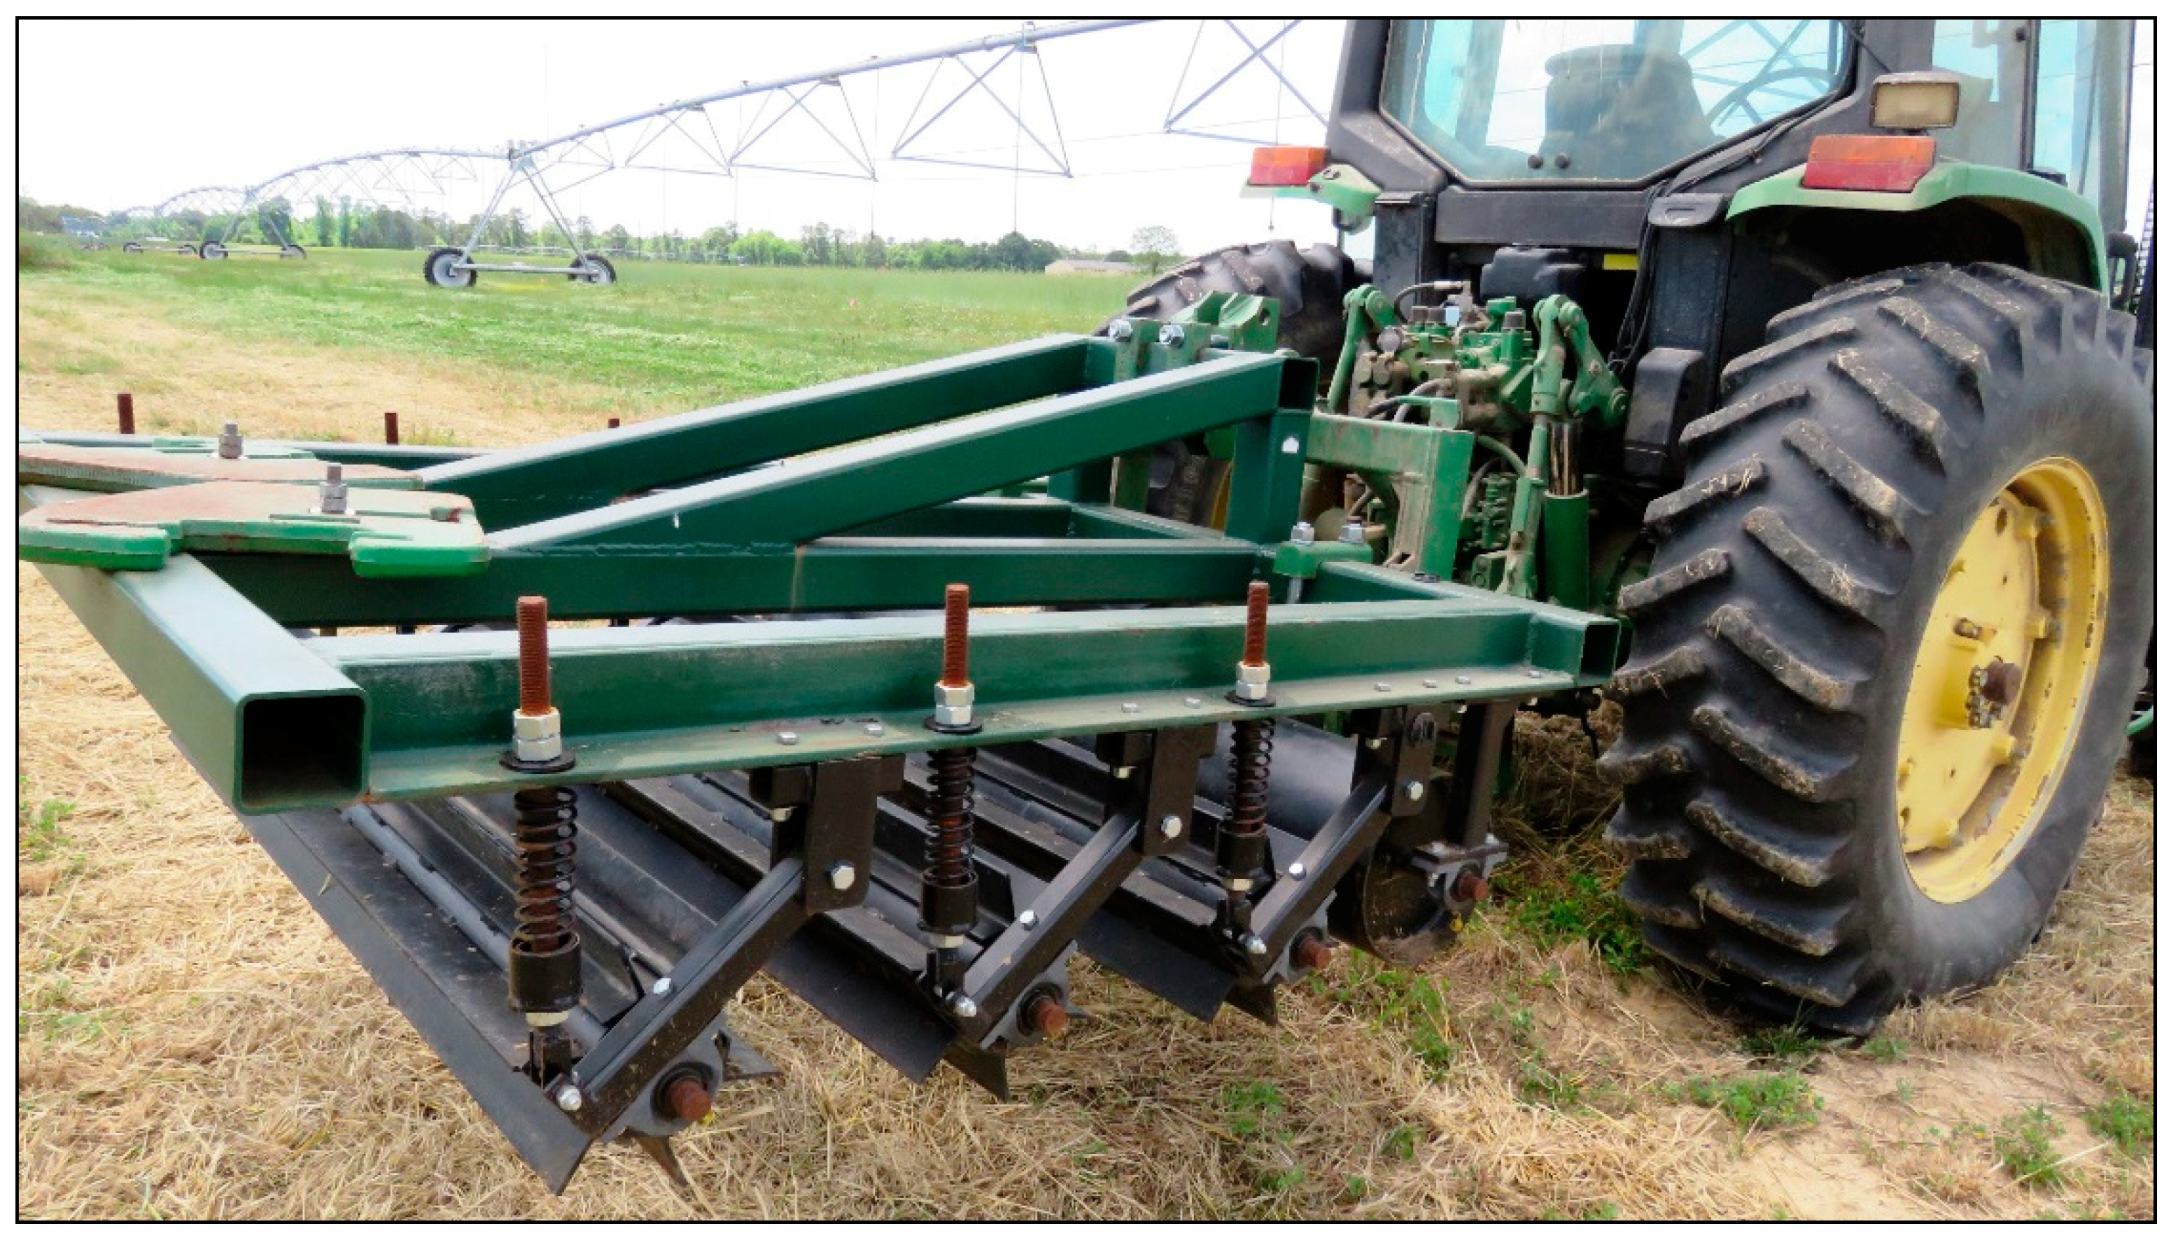
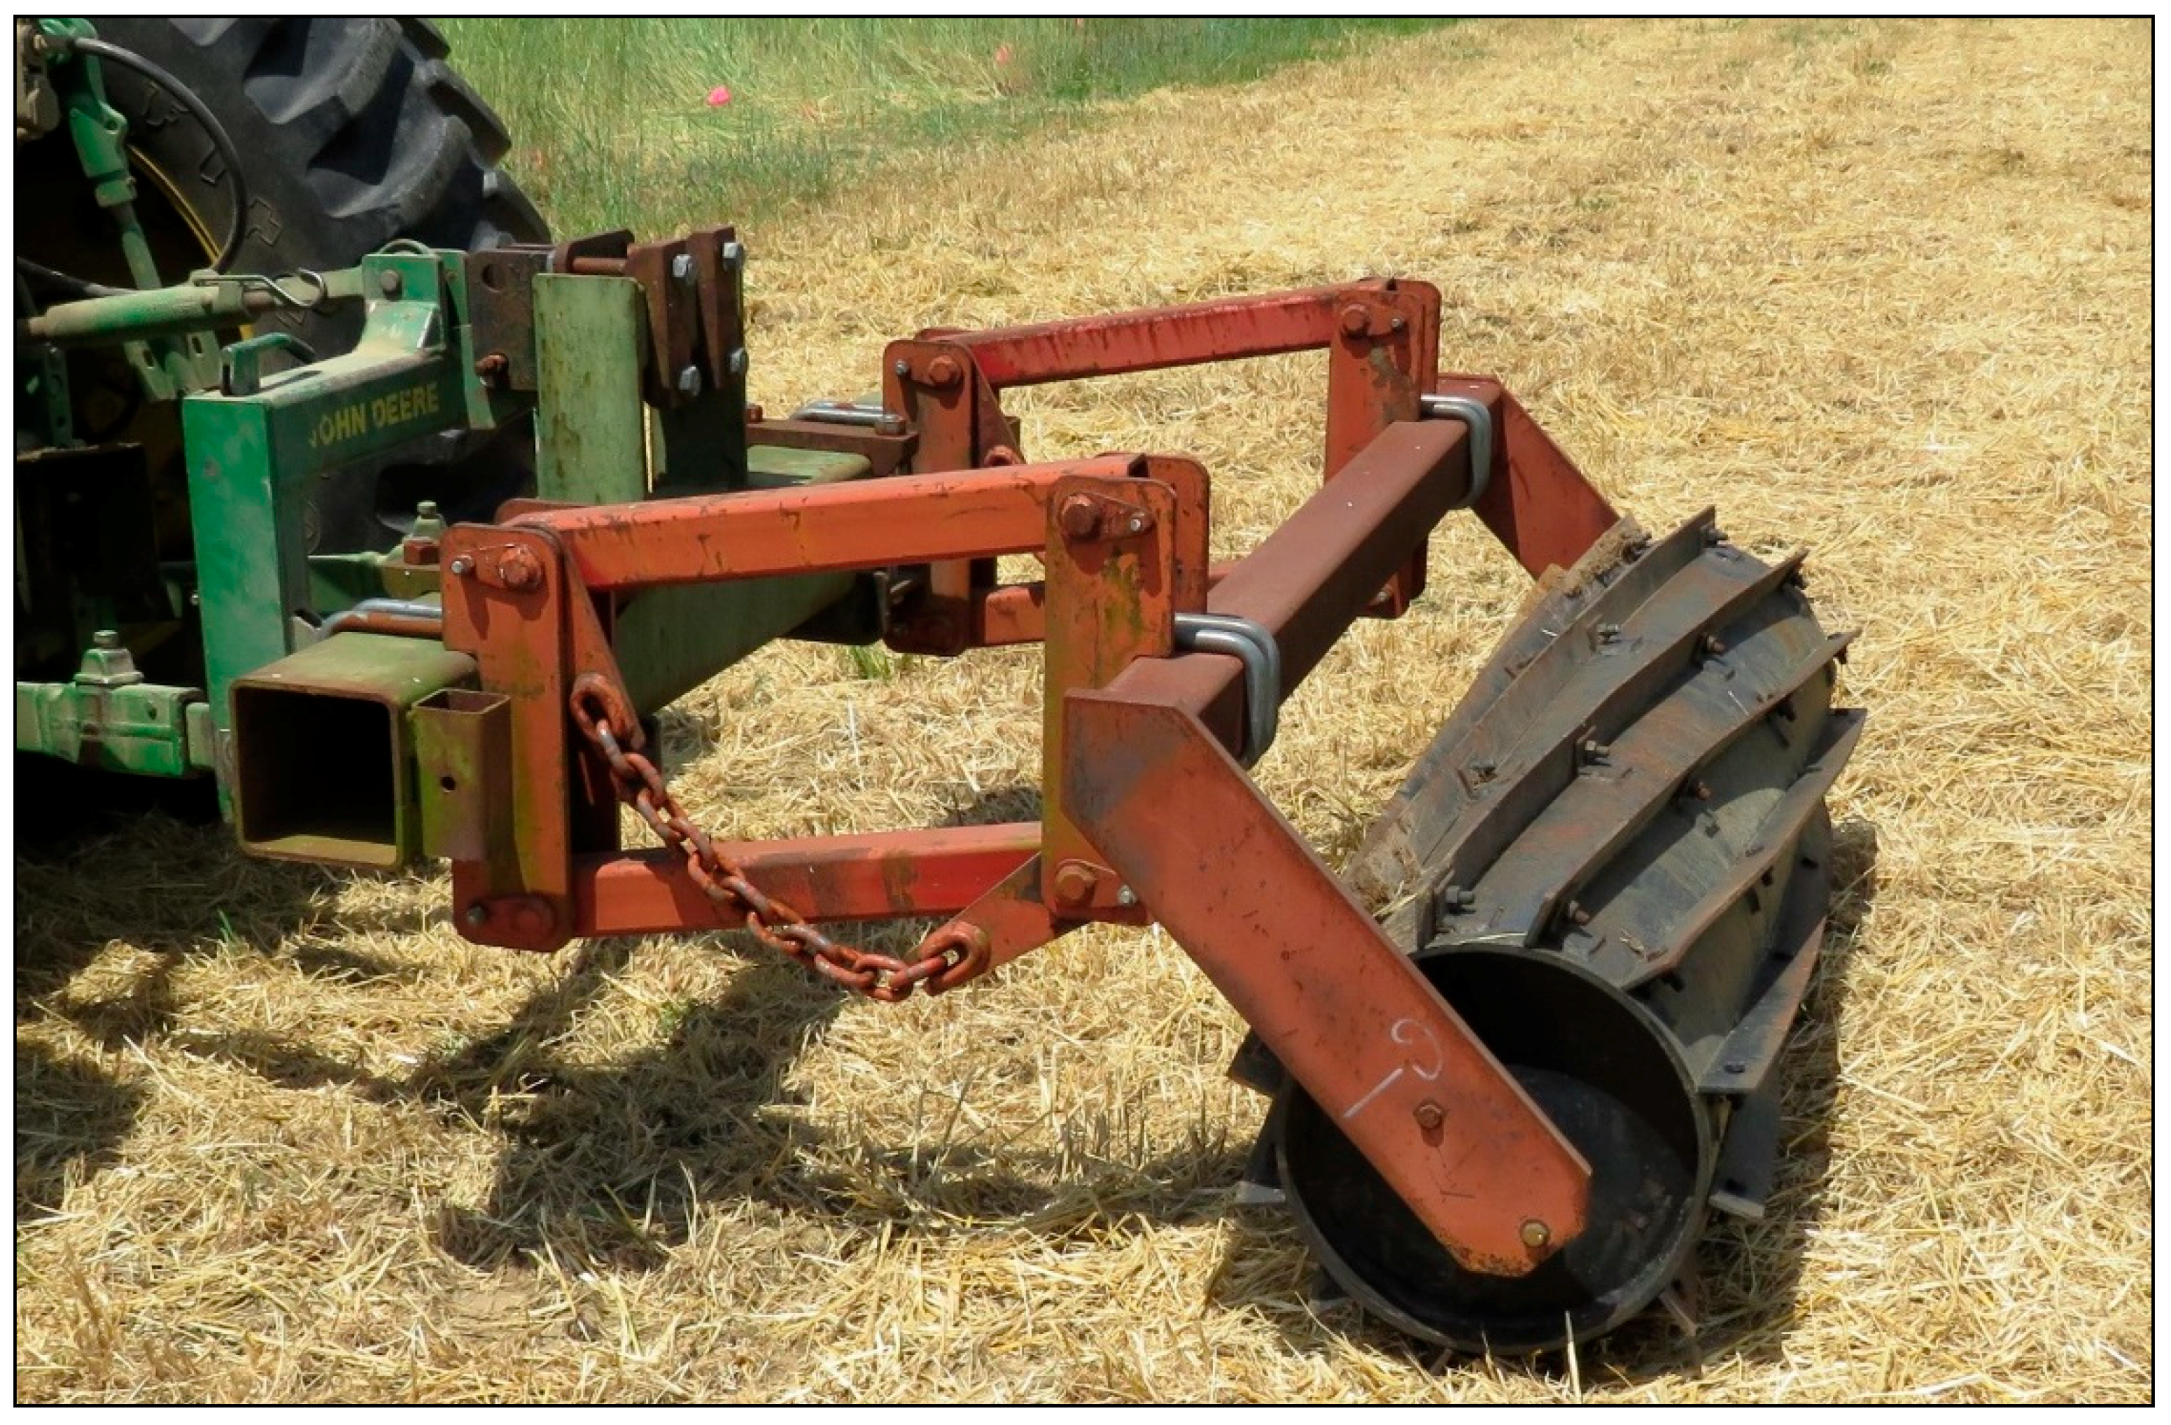
27]), and its kill rates were evaluated one, two, and three weeks after rolling. Field activities during the experiment are presented in
Table 1. The following types of experimental rollers/crimpers were tested: 2-stage (
Figure 1) [
28], 4-stage (
Figure 2) [
28], and spiral roller (
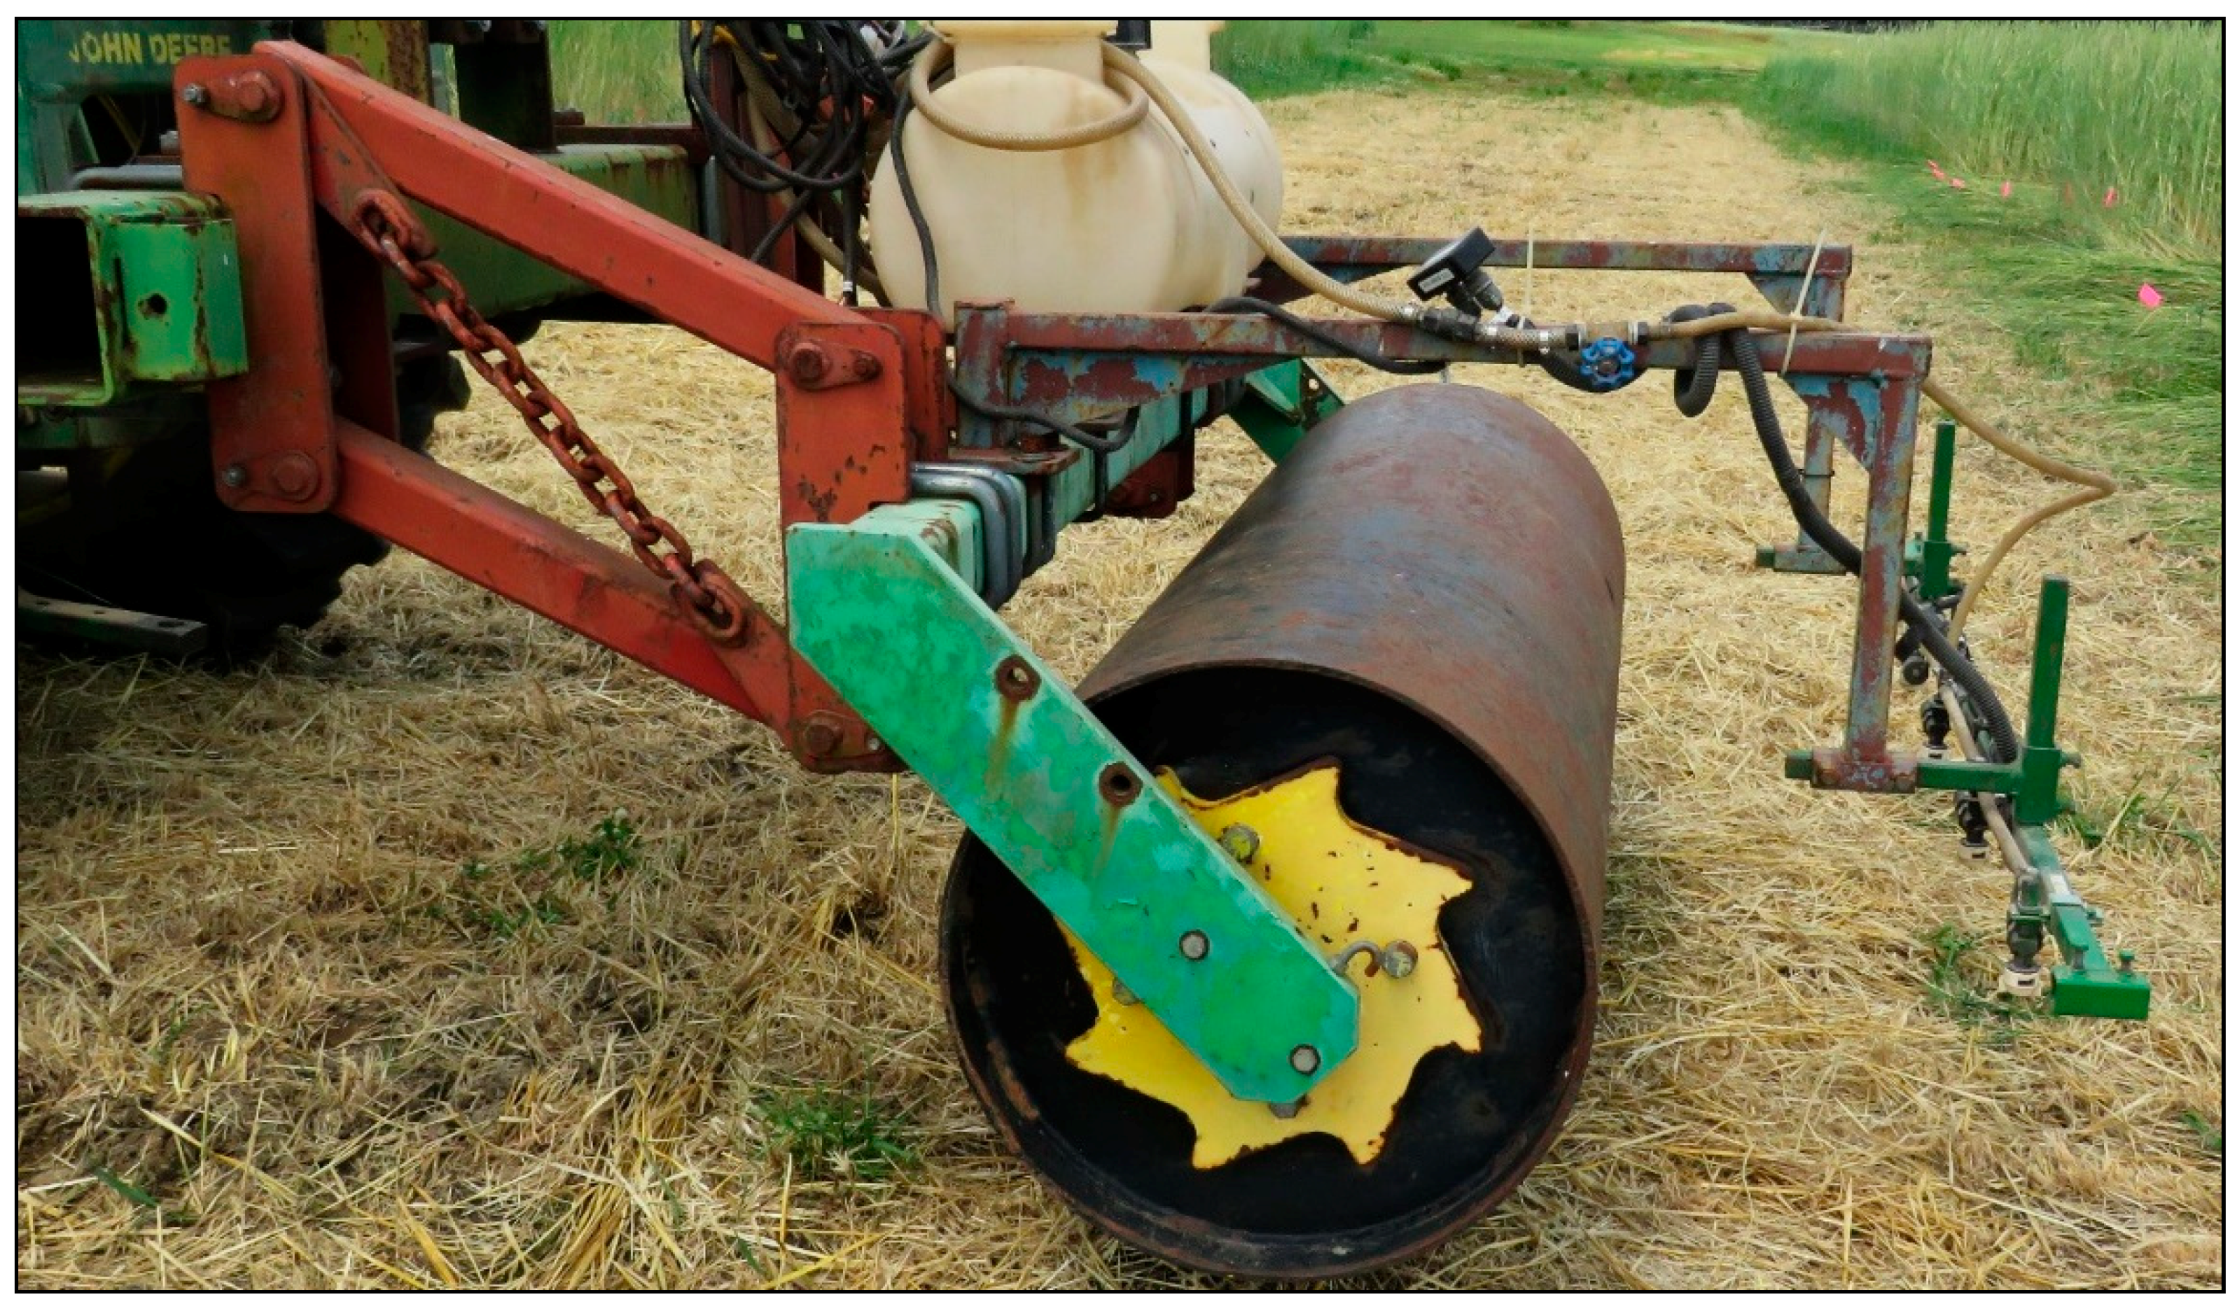
Figure 3) to roll rye 1, 2, and 3 times (passes), which were conducted at the same day. These rollers were developed at the United States Department of Agriculture—Agricultural Research Service (USDA—ARS) National Soil Dynamics Laboratory in Auburn, Alabama, USA. A smooth roller with spray boom applying glyphosate was also tested (
Figure 4), and the standing rye (untreated) was the control. The application rate for a systemic, non-selective glyphosate (Roundup
TM Weather Max) was a continuous spray at 1.6 L ha
−1 (660 g of active ingredient of glyphosate in 1.0 L of potassium salt solution, i.e., 1.06 kg a.i. ha
−1 with water spraying dilution of 140 L ha
−1).
The experiment was a randomized complete block (RCB) design with randomized treatments (plots) within each block. Total of 14 treatments were employed: four different rollers (2-stage, 4-stage, spiral, and smooth drum rollers) with one, two, and three passes over the same cover crop area (12 treatments), smooth drum roller with glyphosate with one pass only (treatment 13) and standing (untreated) rye was the control (treatment 14). Treatments were randomly assigned to individual plots (56 plots total, each plot 9.1 m long and 1.8 m wide). Each treatment was repeated four times (four replications presented in tables as BLOCKS). Rye kill rates were estimated based on a procedure described in [
29] utilizing a hand-held chlorophyll meter with data logger SPAD 502 (Konica-Minolta, Ramsey, N.J.) and calculating kill rates on a scale of 0% (no injury symptoms) to 100% (complete death of all plants). To obtain a kill rate value per plot, five readings of plant tissue were collected in each plot by manually clamping the chlorophyll meter on randomly selected plants and storing the readings in the data logger.
Evaluation was performed one, two, and three weeks after rolling treatments. Cotton (Phytogen 333WRF variety) was planted 14, 25, and 18 May 2015, 2016 and 2017, respectively, utilizing a John Deere 1700 MaxEmerge planter and DAWNR row cleaners (91 cm row spacing with a seeding rate of 180,380 seeds ha−1). Cotton was harvested on 19, 14, and 15 October 2015, 2016 and 2017, respectively, using a 2-row cotton picker (John Deere model 9920).
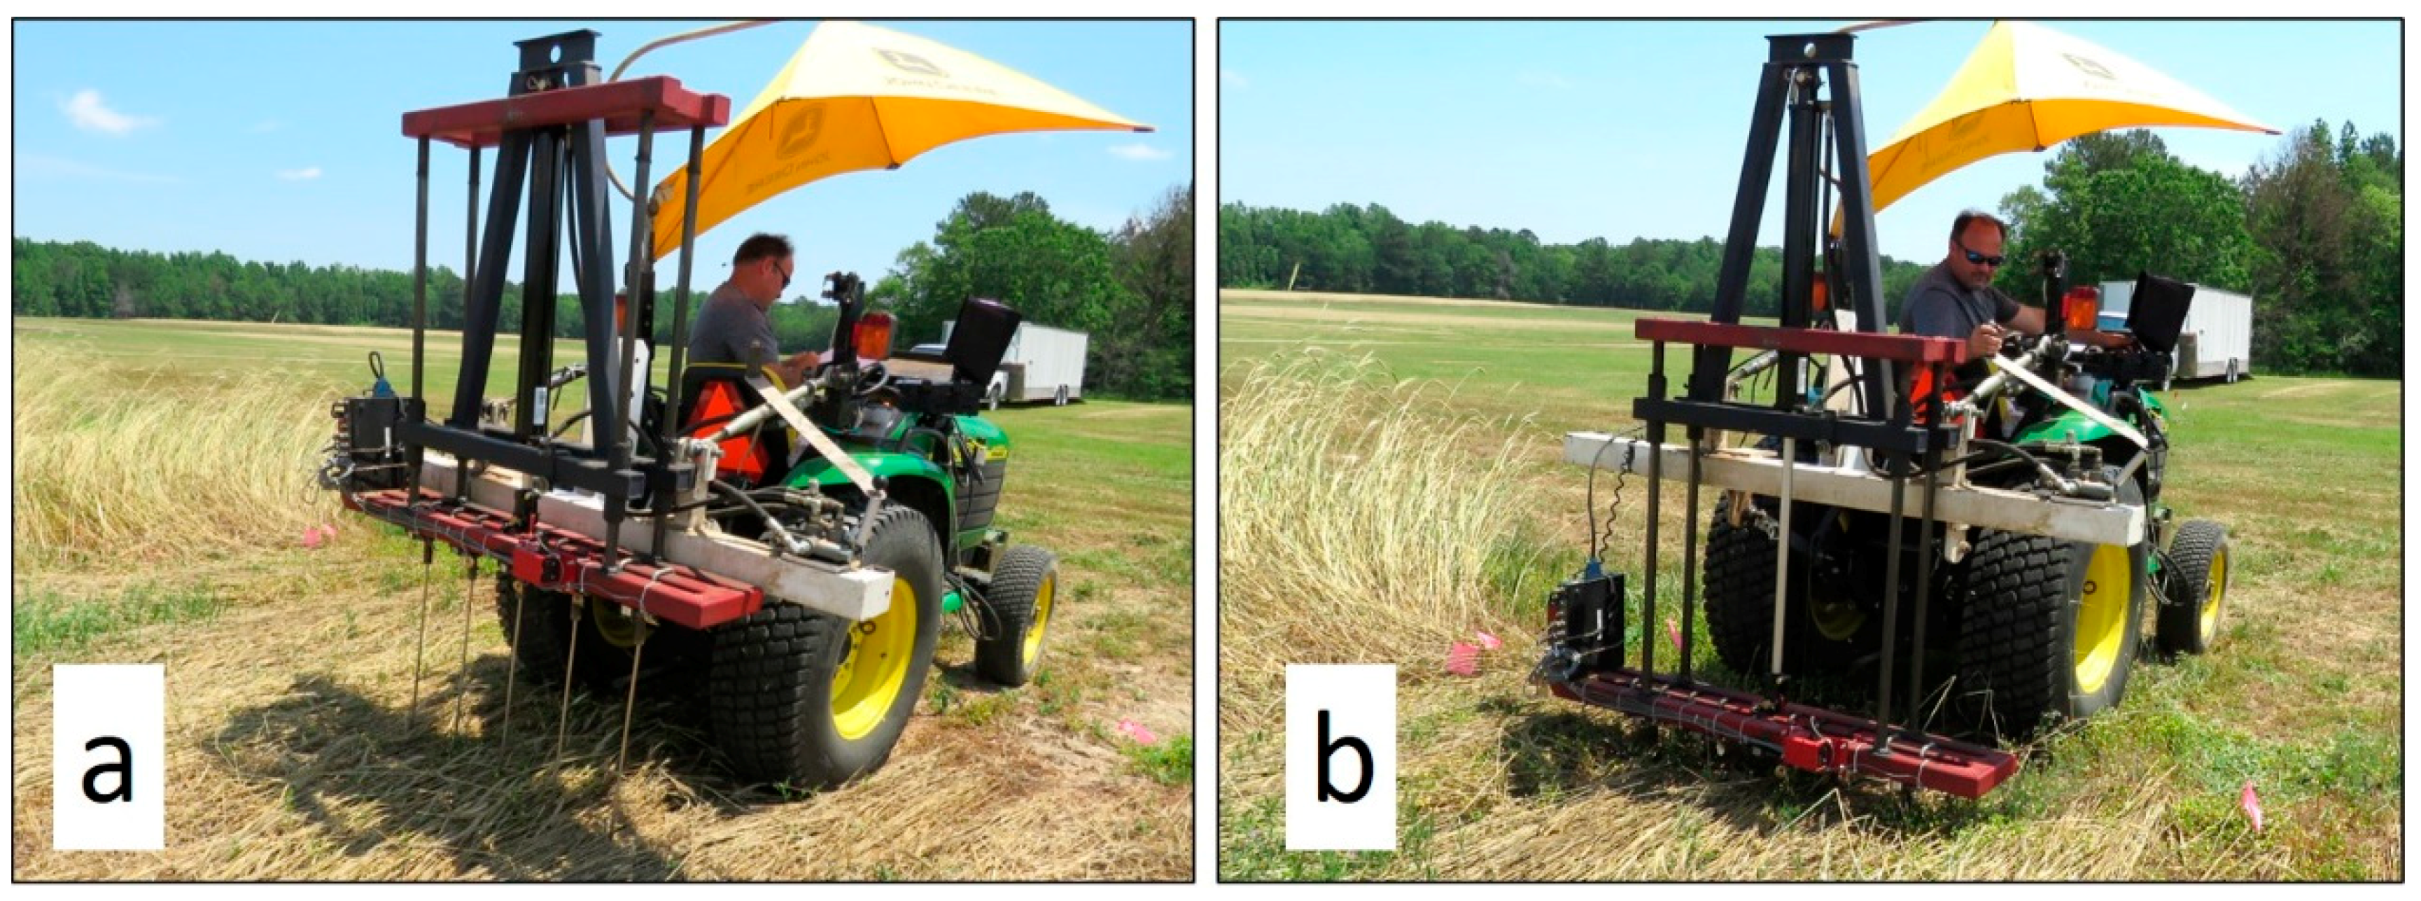
To determine soil compaction due to multiple rolling operations, soil penetration resistance (also referred to as soil strength) was assessed by quantifying cone index (CI) before rolling treatment applications and after rolling/crimping at dates presented in
Table 1. Soil CI was measured by a mobile five cone penetrometer [
30] depicted in
Figure 5. Penetrometer cone index data were measured with 3 rods located between wheel tracks (non-traffic) inside the plot area, and 2 rods collecting in the wheel track (wheel traffic) for each plot. Since the standing (untreated) cereal rye was the control (undisturbed area not subjected to external forces; i.e., rolling and wheel traffic) and served as a reference point to the rolled plot area and wheel traffic, other parameters such as soil infiltration were not assessed. However, corresponding soil gravimetric moisture content (GMC) was measured for control plots at the same time CI readings and GMC readings were collected for all plots so that the relationship between soil strength (CI) and GMC could be established at two soil depths (0–15 cm and 15–30 cm). Soil samples were obtained using a soil probe to a depth of 30 cm to determine the associated GMC. Three soil samples were taken in each plot then each sample was divided equally for two depths (0 to 15 cm and 15 to 30 cm). Three samples from each depth were combined to make a composite sample. CI data were averaged over the depth for each treatment and averaged over treatments at two depths to attain the analysis of variance for soil compaction and gravimetric soil moisture content at 15 and 30 cm depths. Soil CI and GMC data were obtained at least three weeks after rolling but not longer than 1 month after the last rolling application. The reason for this range was due to constant monitoring of weather and associated soil conditions (wet soil after rain). Stainless steel cone tips with a base area of 129 mm
2 were utilized in the experiment [
31]. Cone index data were obtained according to procedures described in [
32] and measured in the middle of the plot and on the wheel track to identify compaction issues. CI measurements were obtained from each plot (three complete sets per plot) for a non-traffic area inside the plot using three stainless rods with cone tips spaced 19 cm apart providing measurements on a 76 cm width strip down to a 45 cm depth. Soil CI for wheel traffic was obtained using two rod readings per wheel traffic. Data were subjected to analysis of variance using the analysis of variance (ANOVA), Generalized Linear Model (GLM) procedure and treatment means were separated with Fisher’s protected least significant differences (LSD) test at the α = 0.05 (5% probability level) [
33].
3. Results and Discussion
Results from analysis of variance for biomass production by cereal rye cover crop, its kill rates, and seed cotton yield are presented in
Table 2. Highly significant differences were observed in cereal rye biomass for variables YEAR; therefore, the biomass production was evaluated every year separately. Likewise, significant differences in cereal rye kill rates were observed for variables WEEK, BLOCK, TRT (rolling treatments) and YEAR, thus rye kill rates data were analyzed separately by year week and rolling treatments. Similarly, significant difference in seed cotton yield was detected for variables YEAR and BLOCK, therefore cotton yield was analyzed separately for each growing season.
Over three growing seasons, cereal rye generated an average biomass of 7680 kg ha
−1 with an average plant height of 1.57 m which was comparable to typical rye cover crop production in Alabama of 7000 kg ha
−1 [
34]. A significant difference in biomass production among growing seasons indicates that different weather and soil conditions in each growing season affected rye biomass production (
Table 3). In 2015, rye generated higher biomass compared to 2016. The lowest rye biomass was obtained in 2017 and it appears that season was impacted by the weather. For instance, the lowest rye biomass in 2017 might be associated with unusually low rainfall amounts of only 20 mm during March and April. In contrast, higher cumulative rainfall amounts of 553 mm from November 2014 till April 2015 might have promoted rye growth in 2015. On the other hand, during the same period in the 2016 growing season, there was twice the amount of total rainfall (1287 mm) compared to 2015 [
35]. This excessive rainfall caused flooding to the experimental area but did not have a considerable negative impact on rye biomass production in 2016. It appears that rye biomass was mostly dependent on plant available water stored in soil in winter and early spring, especially during the accelerated rye vegetative growth.
3.1. Cereal Rye Kill Rate
Cereal rye kill rates one, two and three weeks after rolling/crimping are presented in
Table 4. In 2015, one week after rolling, no difference in kill rates between rolling once and two times were reported for the 2-stage, 4-stage, and smooth drum (from 86% to 89%); whereas the spiral roller rolling once had lower kill rates of 82%, although the higher kill rates for the spiral roller were reported rolling twice (86%), and three times (85%); the untreated control was 40%. Results have also shown that one week after rolling with three passes, rye kill rates generated by the 2-stage and 4-stage exceeded 90%, and kill rates were similar to the smooth drum rolling once with chemical treatment (glyphosate) indicating that these mechanical treatments were as effective as chemical treatment. These kill rates were high enough to plant a cash crop into rye residue cover just one week after rolling [
3]. Two weeks after rolling, no significant differences in kill rates (95% to 97%) were reported among rollers; the control was 49%. In contrast, smooth drum and spiral rollers with three passes generated kill rates below 90%. Three weeks after rolling, no significant differences in rye kill rates were found (99% to 100%); the control was 88%. One week after rolling in 2015, the 2-stage and the 4-stage crimpers rolling 3 times generated kill rate over 90% which was very similar to the smooth drum with glyphosate application (91%).
In the 2016 growing season, one week after applying rolling treatments, the highest rye kill rate (96%) was observed for the 4-stage roller with two and three passes; the same was reported (96%) for the smooth roller with glyphosate and 95% for the 2-stage roller with three passes. The spiral roller and smooth drum with 1, 2, and 3 passes generated lower kill rates from 69% to 75%, whereas the control had only a 29% kill rate. At two weeks after rolling, kill rates for 2-stage, 4-stage, and spiral rollers were above 90%, ranging from 94% to 99%. The smooth drum with one pass produced a lower rye kill rate of 89%, and higher (95%) kill rate with two and three passes; the control (standing rye) had a 50% kill rate. Three weeks after rolling, all tested rollers with one, two or three passes, generated 98% to 100% kill rates, and a lower kill rate was found for the untreated rye (82%).
At one week after rolling in 2017, also seen in the two previous growing seasons, the 2-stage and 4-stage rollers (two and three passes) produced kill rates from 90% to 98%. Likewise, the smooth drum with glyphosate generated a 96% rye kill rate. In contrast, spiral roller and the smooth drum generated lower kill rates from 76% to 85%; the lowest kill rate of 43% was reported for the control. At two weeks after rolling, the 2-stage, 4-stage, and spiral rollers with one, two and three passes, produced rye kill rates ranging from 92% to 100% which were higher than observed for the smooth roller (from 81% to 88%); the control had the lowest kill rate (62%). Three weeks after rolling, there were no significant differences among the tested rollers and the number of rolling passes producing maximum (100%) rye kill rates, while the control had a lower rate of 87%.
These results clearly have shown that for the experimental 2-stage or 4-stage rollers that generated higher kill rates compared to other roller types, it may be necessary to complete three rolling passes in situations where effective mechanical termination is critical especially in no-till organic system. This is important when there is a short time (e.g., 7 days) from rolling of cover crop to cash crop planting and when cover crop kill rate must exceed 90% as recommended by Ashford and Reeves [
3] for successfully planting the cash crop into desiccated residue cover.
3.2. Seed Cotton Yield
Over the three growing seasons rolling treatments for rye did not affect the yield (
Table 2), with the average seed cotton yield of 3601 kg ha
−1 and corresponding lint yield of 1512 kg ha
−1 (
Table 5). Conversely, cotton yield was significantly different at each growing season, and most likely was related to different weather conditions affecting the seed cotton yield. Lower lint cotton yield in 2016 (1224 kg ha
−1) was likely weather related, as drought conditions occurred. According to Agricultural Weather Information Service (AWIS) [
35], there was a low rainfall amount of 359 mm from May to October of 2016. In contrast, during the same period for 2015 and 2017, total rainfall was 644 mm and 962 mm, respectively. These higher rainfall amounts helped maintain higher lint cotton yields in 2015 (1721 kg ha
−1) and 2017 (1592 kg ha
−1). Across all growing seasons, there were significant differences in seed cotton yield among variable BLOCK, thus in this experiment blocking was justified.
3.3. Cone Index and Corresponding Gravimetric Moisture Content
The results for analysis of variance for CI and GMC with respective F-values and probabilities are shown in
Table 6 and indicated that there were highly significant differences for cone index values with respect to variables YEAR, BLOCK, TIME, POS (position), and DEPTH. There were no significant differences among trolling treatments (TRT) as well as no significant YEAR by TRT interactions at significance level α = 0.05. Analysis of variance results with respect to GMC indicated that variables YEAR, BLOCK, TIME, DEPTH and TRT were highly significant, therefore, the data were analyzed separately for each growing season (variable YEAR). Although, the variable TRT was significant for GMC it was most likely related to variability in soil properties rather than from treatments effects on GMC. There was not significant interaction between YEAR ∗ TRT for CI and GMC.
Based on these analyses, CI before treatment applications was higher (1.46 MPa) compared to lower CI of 0.90 MPa after rolling rye with corresponding higher GMC of 13.1% after rolling compared to lower GMC of 11.0% before rolling rye. These results clearly indicate that changes in CI were related to changes in GMC and not to treatment effects. Because variable YEAR was highly significant (p-value < 0.0001), CI and GMC data were analyzed separately for each year with respect to position, depth, and time.
3.3.1. Growing Season 2015
The relationship between CI averaged over rolling treatments and gravimetric soil moisture content in the 2015 growing season for each depth is shown in
Table 7. The CI values for both non-traffic and wheel traffic had an inverse relationship with respect to gravimetric soil moisture content indicating that the increase in CI is related to decreasing soil GMC. For in-plot at the 0–15 cm layer, CI was higher before rolling compared to lower CI after rolling; however, no significant difference in GMC was reported (12.9% to 13.1%), but both CI values were well under the 2 MPa compaction threshold for cotton root penetration restriction [
37]. At 15–30 cm depth before rolling, CI increased above 2 MPa as the GMC decreased to 9.4%. For wheel traffic at the 0–15 cm depth there was no difference in CI before and after rolling with corresponding GMC 13.1% to 12.9%. In contrast, before rolling at 15–30 cm depth, CI was higher than 2 MPa with lower corresponding GMC of 9.4% compared to lower CI with higher GMC of 13.6%, which indicates the inverse relationship between CI and GMC.
3.3.2. Growing Season 2016
Analogous to the 2015 growing season, the CI values in 2016 both for non-traffic and wheel traffic had an inverse relationship to gravimetric soil moisture content (
Table 8). For non-traffic plot at the 0–15 cm layer CI was higher before rolling compared to lower CI after rolling, with respective GMC values of 11.3% to 13.0%. At 15–30 cm depth, before rolling, CI values were lower compared to 0–15 cm depth governed by the higher respective GMC values of 13.0% and 14.l%. For wheel traffic at the 0–15 cm depth there was a difference in CI before and after rolling with corresponding GMC of 11.3% and 13.0%, respectively, indicating that soil moisture and influence of wheel traffic both affected soil strength. Similarly, at 15–30 cm depth, lower CI was reported before rolling with corresponding GMC of 14.1% compared to higher CI with lower GMC of 13.0% which supports the inverse relationship between CI and GMC.
3.3.3. Growing Season 2017
In 2017, CI values at both depths before and after rolling for plot and wheel traffic had an inverse relationship with the GMC (
Table 9). Similar to the 2015 growing season, the in-plot non-traffic area at 0–15 cm layer before rolling had higher CI compared to lower CI after rolling, with respective GMC values of 9.4 and 12.2%. Likewise, at 15–30 cm depth, CI values were higher before rolling compared to lower CI after rolling with corresponding GMC values of 9.9% and 12.8%. As for plot area wheel traffic at the 0–15 cm depth, CI before rolling was higher compared to lower CI after rolling with corresponding GMC of 9.4% and 12.2%. Similarly, at the 15–30 cm depth, CI was higher than 2 MPa was reported before rolling with corresponding GMC of 9.9% compared to lower CI with higher GMC of 12.8% consistently supporting the inverse relationship between CI and GMC.
3.4. Soil Cone Index (CI) for Different Rolling Treatments and Depths
Highly significant differences were observed in soil CI for variable YEAR, BLOCK, TIME, POS, and DEPTH. In contrast, across all growing seasons, no significant differences were detected among rolling treatments (TRT) at significant level α = 0.05 and there were no significant YEAR by TRT interactions. This was most likely caused by the variability across the years due to climate differences between the years. However, a trend was present between rolling and soil compaction and TRT was significant at α = 0.10 (
p-value = 0.0906,
Table 10). Since variable YEAR was highly significant, rolling treatment effect on soil compaction was reanalyzed again by YEAR for variables TRT and DEPTH before and after rolling on non-traffic (area inside plot) and on wheel traffic. Results are presented in
Table 11,
Table 12,
Table 13,
Table 14,
Table 15 and
Table 16.
Evaluating each YEAR, significantly higher soil CI averaged over treatments and depths before and after rolling (time) and position (non-traffic and wheel traffic) were reported in 2017 (1.32 MPa), followed by lower CI of 1.18 MPa in 2015, and the lowest was found in 2016 (0.97 MPa). Overall average CI was reported before rolling treatment application (1.42 MPa) compared to lower CI of 0.90 MPa after the rolling. Likewise, significantly higher average CI was reported on wheel traffic (1.33 MPa) compared to lower CI of 0.99 MPa non-traffic. The average CI increased with depths having the highest CI at 30 cm depth (1.53 MPa) and the lowest (0.46 MPa) was at zero depth. The average highest CI (1.22 MPa) was reported for the smooth drum roller rolling three times, compared with lowest CI for the spiral roller/crimper rolling once (1.09 MPa).
3.4.1. Growing Season 2015
There were significant differences in cone index among rolling treatments before these rolling treatments were applied on rye non-traffic area and wheel traffic (
Table 11). Because rolling treatments were not yet applied, this variability in soil compaction was not related to rolling treatments effects but solely on soil properties and gravimetric moisture content GMC. On the other hand, significant difference in cone index among rolling treatments (after treatment application) might have combined effects on soil cone index for both non-traffic and wheel traffic in addition to effects due to soil properties and changes in gravimetric soil moisture content.
Soil compaction after rolling (
Table 11) revealed that no statistical differences for non-traffic were reported for 2-stage roller, spiral roller and smooth drum with one, two, and three passes. CI for 4-stage roller rolling 2 and 3 times was higher than rolling once, however, there was no difference in CI rolling twice or three times with the untreated control, indicating that repeated rolling did not cause soil compaction issues in the non-traffic area.
For the wheel traffic area, a significantly higher CI was reported for the 2-stage roller rolling two and three times compared to rolling one time. For 4-stage roller, higher CI was reported for rolling three times compared to rolling once or twice without differences between rolling once or twice. For the spiral roller and the smooth drum, higher CI was found after rolling twice compared to rolling once or three times, although a higher CI value was observed for after rolling three times compared to rolling once. No differences between rolling once and three times were reported for the smooth drum roller.
For the 2015 growing season, soil cone index values related to depth range 0 to 30 cm for before and after rolling treatment application are presented in
Table 12. Before rolling, the soil strength on the non-traffic area increased with depth from 0.2 MPa at 0 cm depth to 3.2 MPa at 30 cm depth. Likewise, wheel traffic soil strength was similar at 0 cm depth with 0.2 MPa to 2.9 MPa at 30 cm depth. Soil cone index increased with depth which was influenced by gravimetric soil moisture content (13.1% GMC at the 0–15 cm depth;
Table 7), but values were still less than the 2.0 MPa unrestricted root growth threshold for cotton [
37]. In contrast, at depths of 20 cm to 30 cm, soil cone index for non-traffic increased above 3.0 MPa and this increase was caused by lower GMC of 9.4% at the 15–30 cm depth (
Table 7). After rolling CI values for non-traffic and wheel traffic were lower than before applying rolling treatments due to higher GMC of 12.9% and 13.6%, at 0–15 cm and 15–30 cm depths, respectively.
3.4.2. Growing Season 2016
Soil cone index averaged over rolling treatments (before their application) for non-traffic was 0.83 MPa and for wheel traffic CI was 1.15 MPa. After rolling treatments were performed, the CI for non-traffic was 0.63 MPa compared to higher CI of 1.27 MPa for wheel traffic, and based on the CI value for untreated control, which was no different than for rolling treatments, it appears that these CI values were related to changes in soil gravimetric moisture content.
For the non-traffic (plot) after rolling (
Table 13), CI values for the 2-stage roller rolling twice or three times was higher than for rolling once. CI for the 4-stage roller was lower for rolling once, compared to rolling twice and three times with higher CI value than rolling twice. The CI for the control was no different than rolling 2–3 times for both the 2- and 4-stage rollers indicating that repeated rolling did not cause soil compaction due to crimping bar force. For spiral roller and the smooth drum, there were no differences in CI among rolling once, twice and three times (
Table 13).
For wheel traffic, higher soil strength for 2-stage and the spiral roller/crimper was observed for rolling twice compared to rolling once or three times without differences between these treatments. Higher CI for rolling twice vs. rolling three times was most likely due to variability in CI within the experimental area (
p-value for block <0.0001). For the 4-stage roller/crimper, CI increased with number of rolling with the lowest with rolling once and the highest CI for rolling three times. No differences in CI rolling once, twice or three times for smooth drum roller and for smooth roller with glyphosate (rolling once). CI for the control was no different than for 4-stage and spiral roller rolling once. Overall, the soil CI values in 2016 were less than 2.0 MPa which was the limit for unrestricted root growth in cotton [
37].
Soil cone index values in the 2016 growing season for depths 0 to 30 cm for 5 cm increments, obtained before and after applying rolling treatments are presented in
Table 14. Except for one CI value that slightly exceeded 2.0 MPa for wheel traffic at the 5 cm depth, all other CI values for all depths before and after rolling value were less than 2.0 MPa. It appears that all CI values were related to gravimetric soil moisture content (
Table 8). Before rolling, GMC at depth of 0–5 cm was 11.3% which would explain the higher CI value compared to lower depth for which the soil strength decreased with an increase in GMC to 13.0%. Similarly, after rolling, CI values were higher at depths 5–15 cm with lower GMC at 0–15 cm depth (13.0%) compared to lower CI values at 20–30 cm with higher corresponding GMC of 14.1% at 15–30 cm depth.
3.4.3. Growing Season 2017
Soil cone index (CI) averaged over treatments before applying rolling treatments were 1.40 and 2.01 MPa for non-traffic and wheel traffic, respectively. After rolling treatments application, averaged CI values for non-traffic was 0.77 MPa and for wheel traffic was 1.12 MPa.
CI values for specific rolling treatments are presented in
Table 15.
p-values for rolling treatments before and after rolling were highly significant (from <0.0001 to 0.0027;
Table 15). For non-traffic, there was no difference in CI for 2-and 4-stage rollers for rolling once, twice or three times. For the spiral roller, the lower CI was observed for rolling twice which was statistically different compared to rolling once and three times. No differences in CI were found between smooth drum roller rolling once, twice and for smooth drum rolling once with glyphosate, but a statistically higher CI existed for smooth drum roller rolling three times. CI for all rollers and rolling times was significantly lower than for the control (non-rolled rye) indicating that rolling two or three times did not cause soil compaction issue. No differences in CI values were observed for rolling once or three times with respect to wheel traffic for the 2-stage roller, the smooth drum, and for smooth drum with glyphosate (rolling once), with no significant difference between rolling once and twice. Similarly, the 4-stage roller and spiral roller had lower CI for rolling once and three times, compared to higher CI for rolling twice. However, CI values for rolling twice were not different than for the control (non-rolled rye) indicating that rolling 2 or 3 times did not increase soil compaction, with CI values below the 2.0 MPa limit for non-restrictive root growth [
37].
As in the two previous growing seasons, soil cone index values for 2017 were related to gravimetric soil moisture content. Before rolling soil strength for non-traffic area was 0.5 MPa at depth 0 cm, increasing to 1.9 MPa at 30 cm depth as seen in
Table 16. For wheel traffic, soil CI was 0.7 MPa at 0 cm depth and increased to 2.2 MPa at 5 cm, then maintained above 2.0 MPa to 30 cm. These higher CI values were related to lower GMC which was 9.4% at the 0–15 cm layer and 9.9% at 15–30 cm layer. It appears that higher CI values especially before rolling for wheel traffic compared to non-traffic area might be also related to the cumulative effects of natural soil consolidation. Soil CI after rolling ranged from 0.4 to 1.5 MPa, and were related to higher GMC (12.2% at 0–15 cm to 12.8% at 15–30 cm) compared to lower GMC measured before rolling.


