Detection and Location of Dead Trees with Pine Wilt Disease Based on Deep Learning and UAV Remote Sensing

1
College of Engineering, South China Agricultural University, Wushan Road, Guangzhou 510642, China
2
National Center for International Collaboration Research on Precision Agricultural Aviation Pesticide Spraying Technology, Wushan Road, Guangzhou 510642, China
*
Author to whom correspondence should be addressed.
AgriEngineering 2020, 2(2), 294-307; https://doi.org/10.3390/agriengineering2020019
Submission received: 22 April 2020
/
Revised: 13 May 2020
/
Accepted: 15 May 2020
/
Published: 21 May 2020
(This article belongs to the Special Issue Precision Agriculture Technologies for Management of Plant Diseases)
Abstract
:Pine wilt disease causes huge economic losses to pine wood forestry because of its destructiveness and rapid spread. This paper proposes a detection and location method of pine wood nematode disease at a large scale adopting UAV (Unmanned Aerial Vehicle) remote sensing and artificial intelligence technology. The UAV remote sensing images were enhanced by computer vision tools. A Faster-RCNN (Faster Region Convolutional Neural Networks) deep learning framework based on a RPN (Region Proposal Network) network and the ResNet residual neural network were used to train the pine wilt diseased dead tree detection model. The loss function and the anchors in the RPN of the convolutional neural network were optimized. Finally, the location of pine wood nematode dead tree was conducted, which generated the geographic information on the detection results. The results show that ResNet101 performed better than VGG16 (Visual Geometry Group 16) convolutional neural network. The detection accuracy was improved and reached to about 90% after a series of optimizations to the network, meaning that the optimization methods proposed in this paper are feasible to pine wood nematode dead tree detection.
1. Introduction
Pine trees are currently the largest planted species in China. They are widely distributed in China and have a wide variety. Pine wilt disease (Bursaphelenchus xylophilus) caused by pine wood nematodes has a devastating effect, and its destructive power and fast-spreading speed pose a huge threat to pine forests [1].
In foreign countries, pine wilt disease prevention and control measures include biological and chemical control, such as killing the activity of pine wood nematodes with bacteria [2] or using chemical spray to kill pine wood nematodes [3]. Yamaguchi et al. [4] found that the appropriate temperature was able to inhibit the growth of pine wood nematodes. In order to prevent pine wilt disease, Pan Jie et al. [5] analyzed the hyperspectral image of the diseased Pinus massoniana and looked for the characteristic band of the diseased tree for early prevention.
At present, the preventive and controlling measures for pine wilt disease in China are mainly through quarantine, chemical control, clearing dead wood, and forest management [6] to prevent the spread of the pine wood nematode disease, however, no effective progress has been made in accurate detection and location of pine-wilt-diseased dead trees. The characteristics of the diseased tree are obvious, which provides the possibility to establish a detection model by deep learning to achieve intelligent detection and location of the pine-wilt-diseased dead tree.
Machine learning and machine vision have been widely used in the field of object detection. Many achievements have been made in agriculture using machine learning and machine vision [7,8,9]. Jianwei Yan et al. [10] realized the detection and classification of 11 types of thorn pear under different angles and occlusion conditions by improving the Faster-RCNN (Faster Region Convolutional Neural Network) deep learning framework. They compared VGG16, ZF and VGG_CNN_M1024 3 convolutional neural networks and confirmed that VGG16 has the best detection effect. The final average accuracy rate of thorn pear is 95.16%; Xiaohang Huang et al. [11] identified the lotus root through the YOLO_v2 deep learning framework combined with the improved DS Tiny Darknet feature extraction network. During the research process, K-means algorithm was used to obtain the length and width of the lotus root and determine the preselected regions. By comparing Darknet-19, Tiny Darknet and DS Tiny Darknet’s three feature extraction networks, they confirm that DS Tiny Darknet has a lower detection accuracy than Darknet-19, but its detection speed is faster and the detection quality is better, and the detection accuracy of lotus can reach 75.2%; Hongxing Peng et al. [12] improved an SSD (Single Shot MultiBox Detector) deep learning network combined with a ResNet101 convolutional neural network to detect and classify litchi, apple, navel orange and emperor mandarin. Transfer learning and data enhancement were used to improve model training speed and model generalization ability. Finally, the accuracy rates of detect litchi, apple, navel orange and emerald mandarin respectively reached 91.57%, 86.68%, 90.69% and 89.18%.
Unmanned Aerial Vehicles (UAVs) are widely used in low-altitude remote sensing in agriculture because of their low cost and high efficiency [13,14,15,16]. Bowen Wang et al. [17] calculated the NDVI (Normalized Difference Vegetation Index) of the tree group by analyzing the remote sensing ground data of the tree group to find the aging tree group. According to the analysis results, the geographical coordinate reference system and the projected coordinate reference system were used to achieve the accurate location of the aging tree group; Xin Yu [18] used UAV remote sensing to capture high-altitude ground data in debris flow-prone areas, and used GIS (Global Information System) technology to obtain geographic location information of target area to realize real-time monitoring of debris flow geological disasters; Jiang Deng et al. [19] used UAV remote sensing to collect ground data of a cotton planting area and corrected the collected data by Pix4D software to obtain the orthographic images of the cotton planting area. The NDVI index, RVI (Ratio Vegetation Index), WDRVI (wide dynamic vegetation index) and DVI (difference vegetation index) index were extracted by ENVI software. The index change of cotton in different growth stages was analyzed to establish a cotton biomass estimation model. Chuanjian Wang et al. [20] used UAVs to capture remote sensing data of crop planting areas, and analyzed the spectral reflectance and the EDVI index of zucchini, cotton and corn. At the same time, the bands with large differences in the spectral bands of the three crops were selected as model training data. The specific band data was trained by the convolutional neural network to classify the three crops. Finally, the accuracy rates of the three crops reached to 97.95%, 97.23%, and 97.48%, respectively.
Although there are many achievements in crop detection and classification based on convolutional neural networks and remote sensing, no research has been found on the detection and location of dead trees with pine wilt disease.
Identifying and treating diseased plants as early as possible can prevent the expansion and spread of pine wilt disease, which can greatly reduce the damage to the ecological environment and economic losses caused by the disease. This paper uses the Faster-RCNN deep learning framework to establish a pine wilt diseased dead tree detection model, and builds a geographic information output module to output the specific geographic location of the diseased plants, to achieve rapid detection and location of the pine wilt disease dead tree, to improve the detection efficiency and prevent the disease from further spread.
2. Materials and Methods
2.1. Field Plot
The UAV remote sensing image was collected by a 20 million pixel sensefly SODA visible light camera with GPS module, mounted on an eBee UAV. The field plot was a pine wilt disease endemic area located in Ji’an County, Ji’an City, Jiangxi Province. The endemic area is 1.7952 square kilometers. The main observation object is Pinus massoniana. Pix4D software was used to plan the navigation path of the UAV to ensure that it covers all areas of the pine wilt disease endemic area. A fixed overlap rate was set through the Pix4D software. The flying height of the UAV was set to 1000 m, the lateral overlap ratio of the shooting was set to 60%, and the heading overlap ratio was set to 60%. The dead trees with pine wilt disease mainly included three types: orange-yellow mildly diseased dead trees, red-brown severely diseased dead trees and all white dead trees which are shown separately in the blank boxes in Figure 1a–c.
2.2. Data Preprocessing and Data Enhancement
To prevent data duplication and model overfitting, image stitching then cutting were conducted proportionally. The tool for image stitching in this experiment was the Photoscan software. After cutting, 340 images were filtered to be used as pine wilt disease dead tree dataset.
Considering that there were only 340 data points used for training, it is obvious that the samples were insufficient. Data enhancement was performed through a series of ways, including image rotation, image flipping, darkening and brightening of the image which simulate the state of the environment with strong light and weak light effectively. Therefore, the final dataset reached to 1700. Among these samples, 80% were used for training, and 20% were used for testing. Image labeling was conducted by the LabelImg labeling tool.
2.3. Improved Faster-RCNN Network
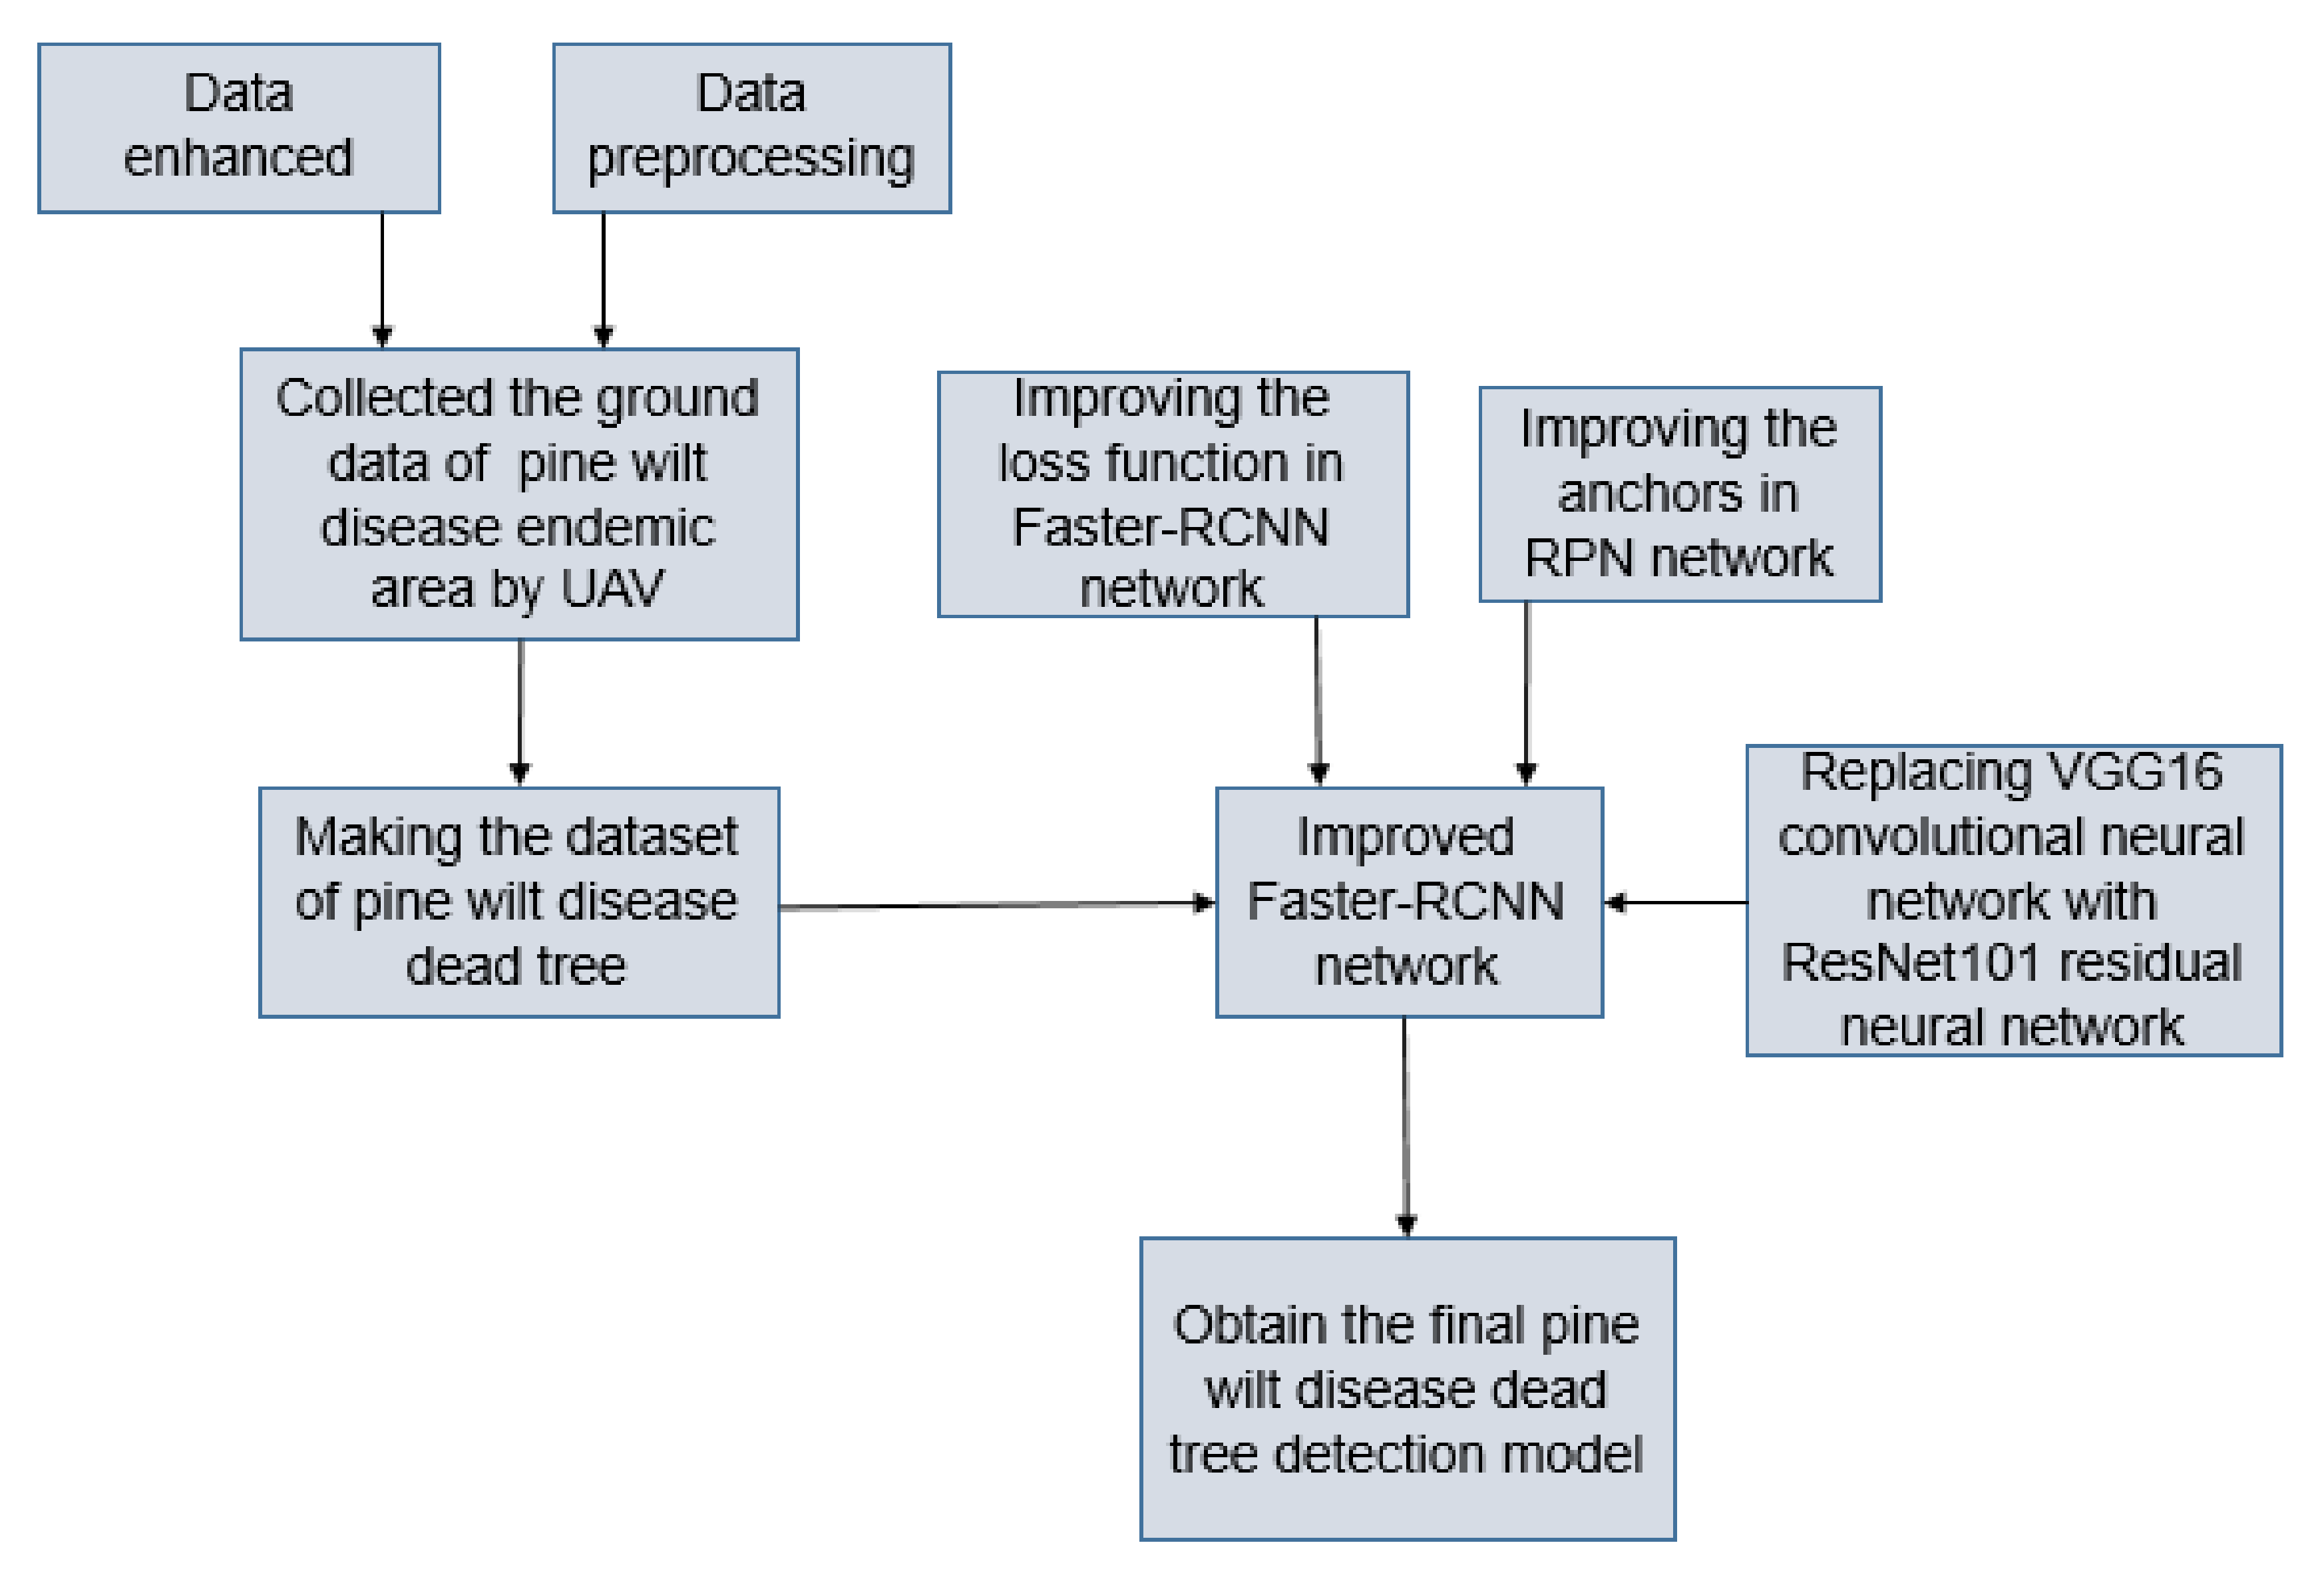
A Faster-RCNN deep learning framework was adopted to detect pine wilt disease dead tree from UAV remote sensing images. The detection accuracy by the original data and the unimproved network was not ideal. The average accuracy map mAP (mean average precision) was only 66.2%. Therefore, network optimization according to the specific needs of the research was conducted. The overall technical route of improvement is shown in Figure 2.
2.3.1. Selection of Loss Function
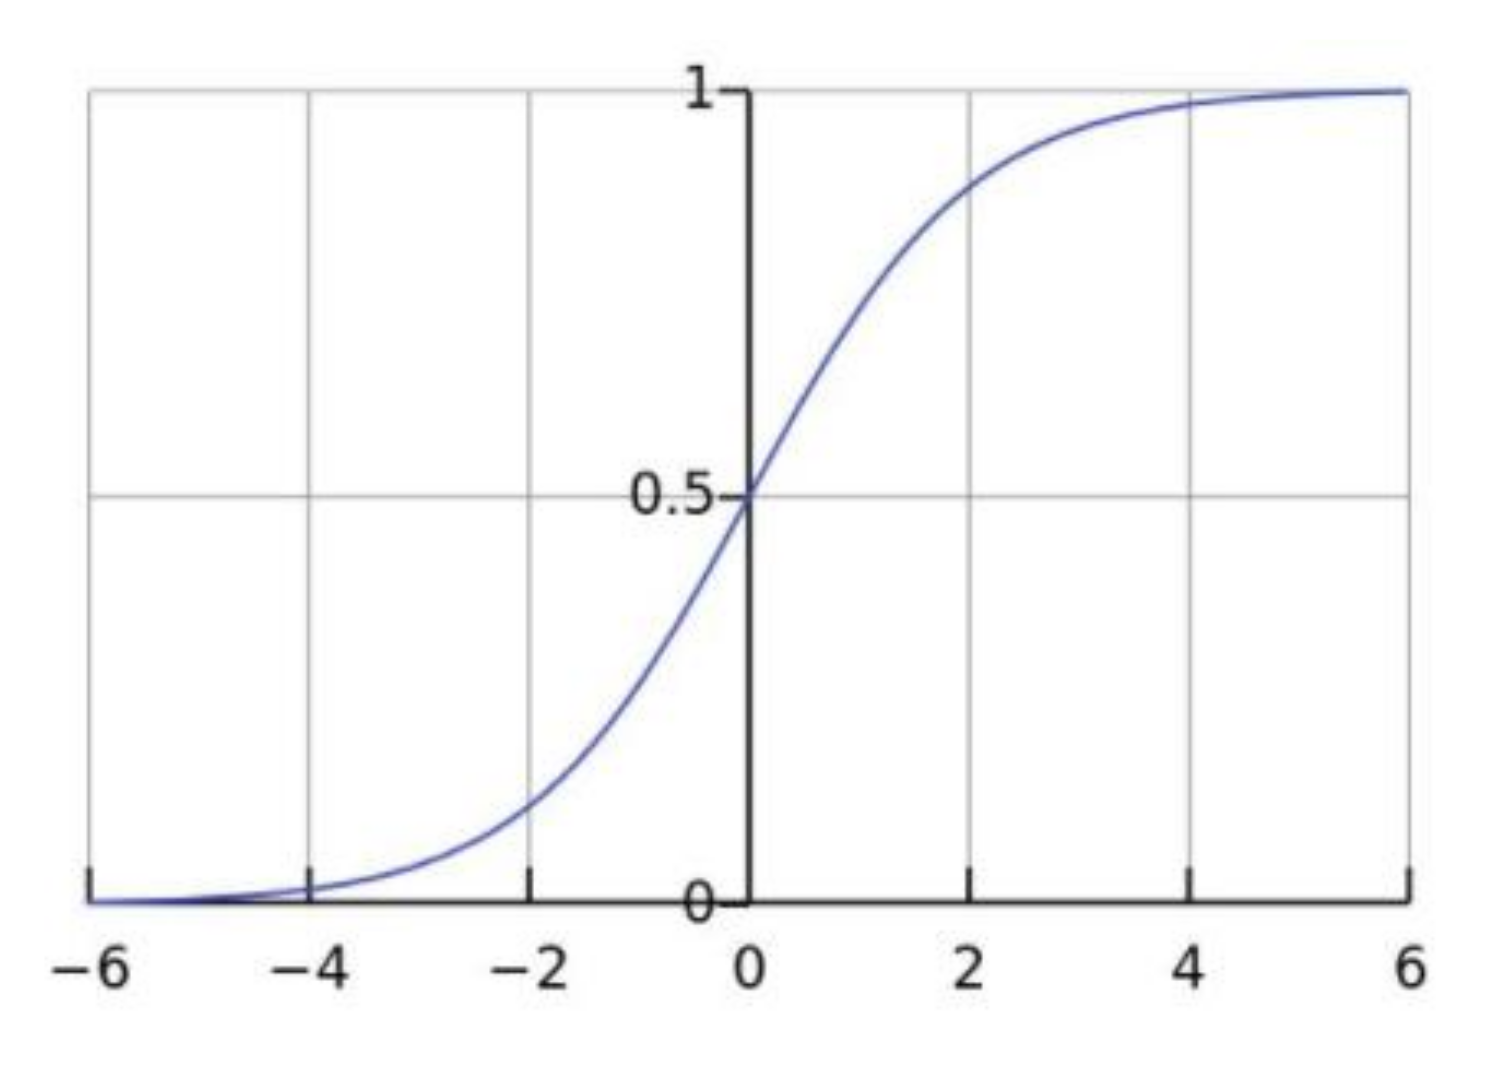
The role of the loss function in model training is to calculate the gap between the real value and the predicted value. It guides the update of the parameters in the model and the direction of model convergence based on the change in the loss value. The smaller the loss value, the smaller the difference between the training result and the prediction result, and the better the model training effect. In object detection, classification can be divided into two types: one with two categories that detect only one target, and one with multiple categories that detect multiple types. The loss function used in the original Faster-RCNN network is the softmax multiclass function [21]. The softmax function can effectively classify multiple targets in multiclassification tasks, but only one target for pine wilt disease dead tree detection, which belongs to the binary classification problem, so the sigmoid function was adopted to replace the softmax function in this study. The expression of the sigomid function is shown in Equation (1). This function can converge all data within 0 ~ 1; its function curve is shown in Figure 3.
2.3.2. Optimization of Anchors in RPN Network
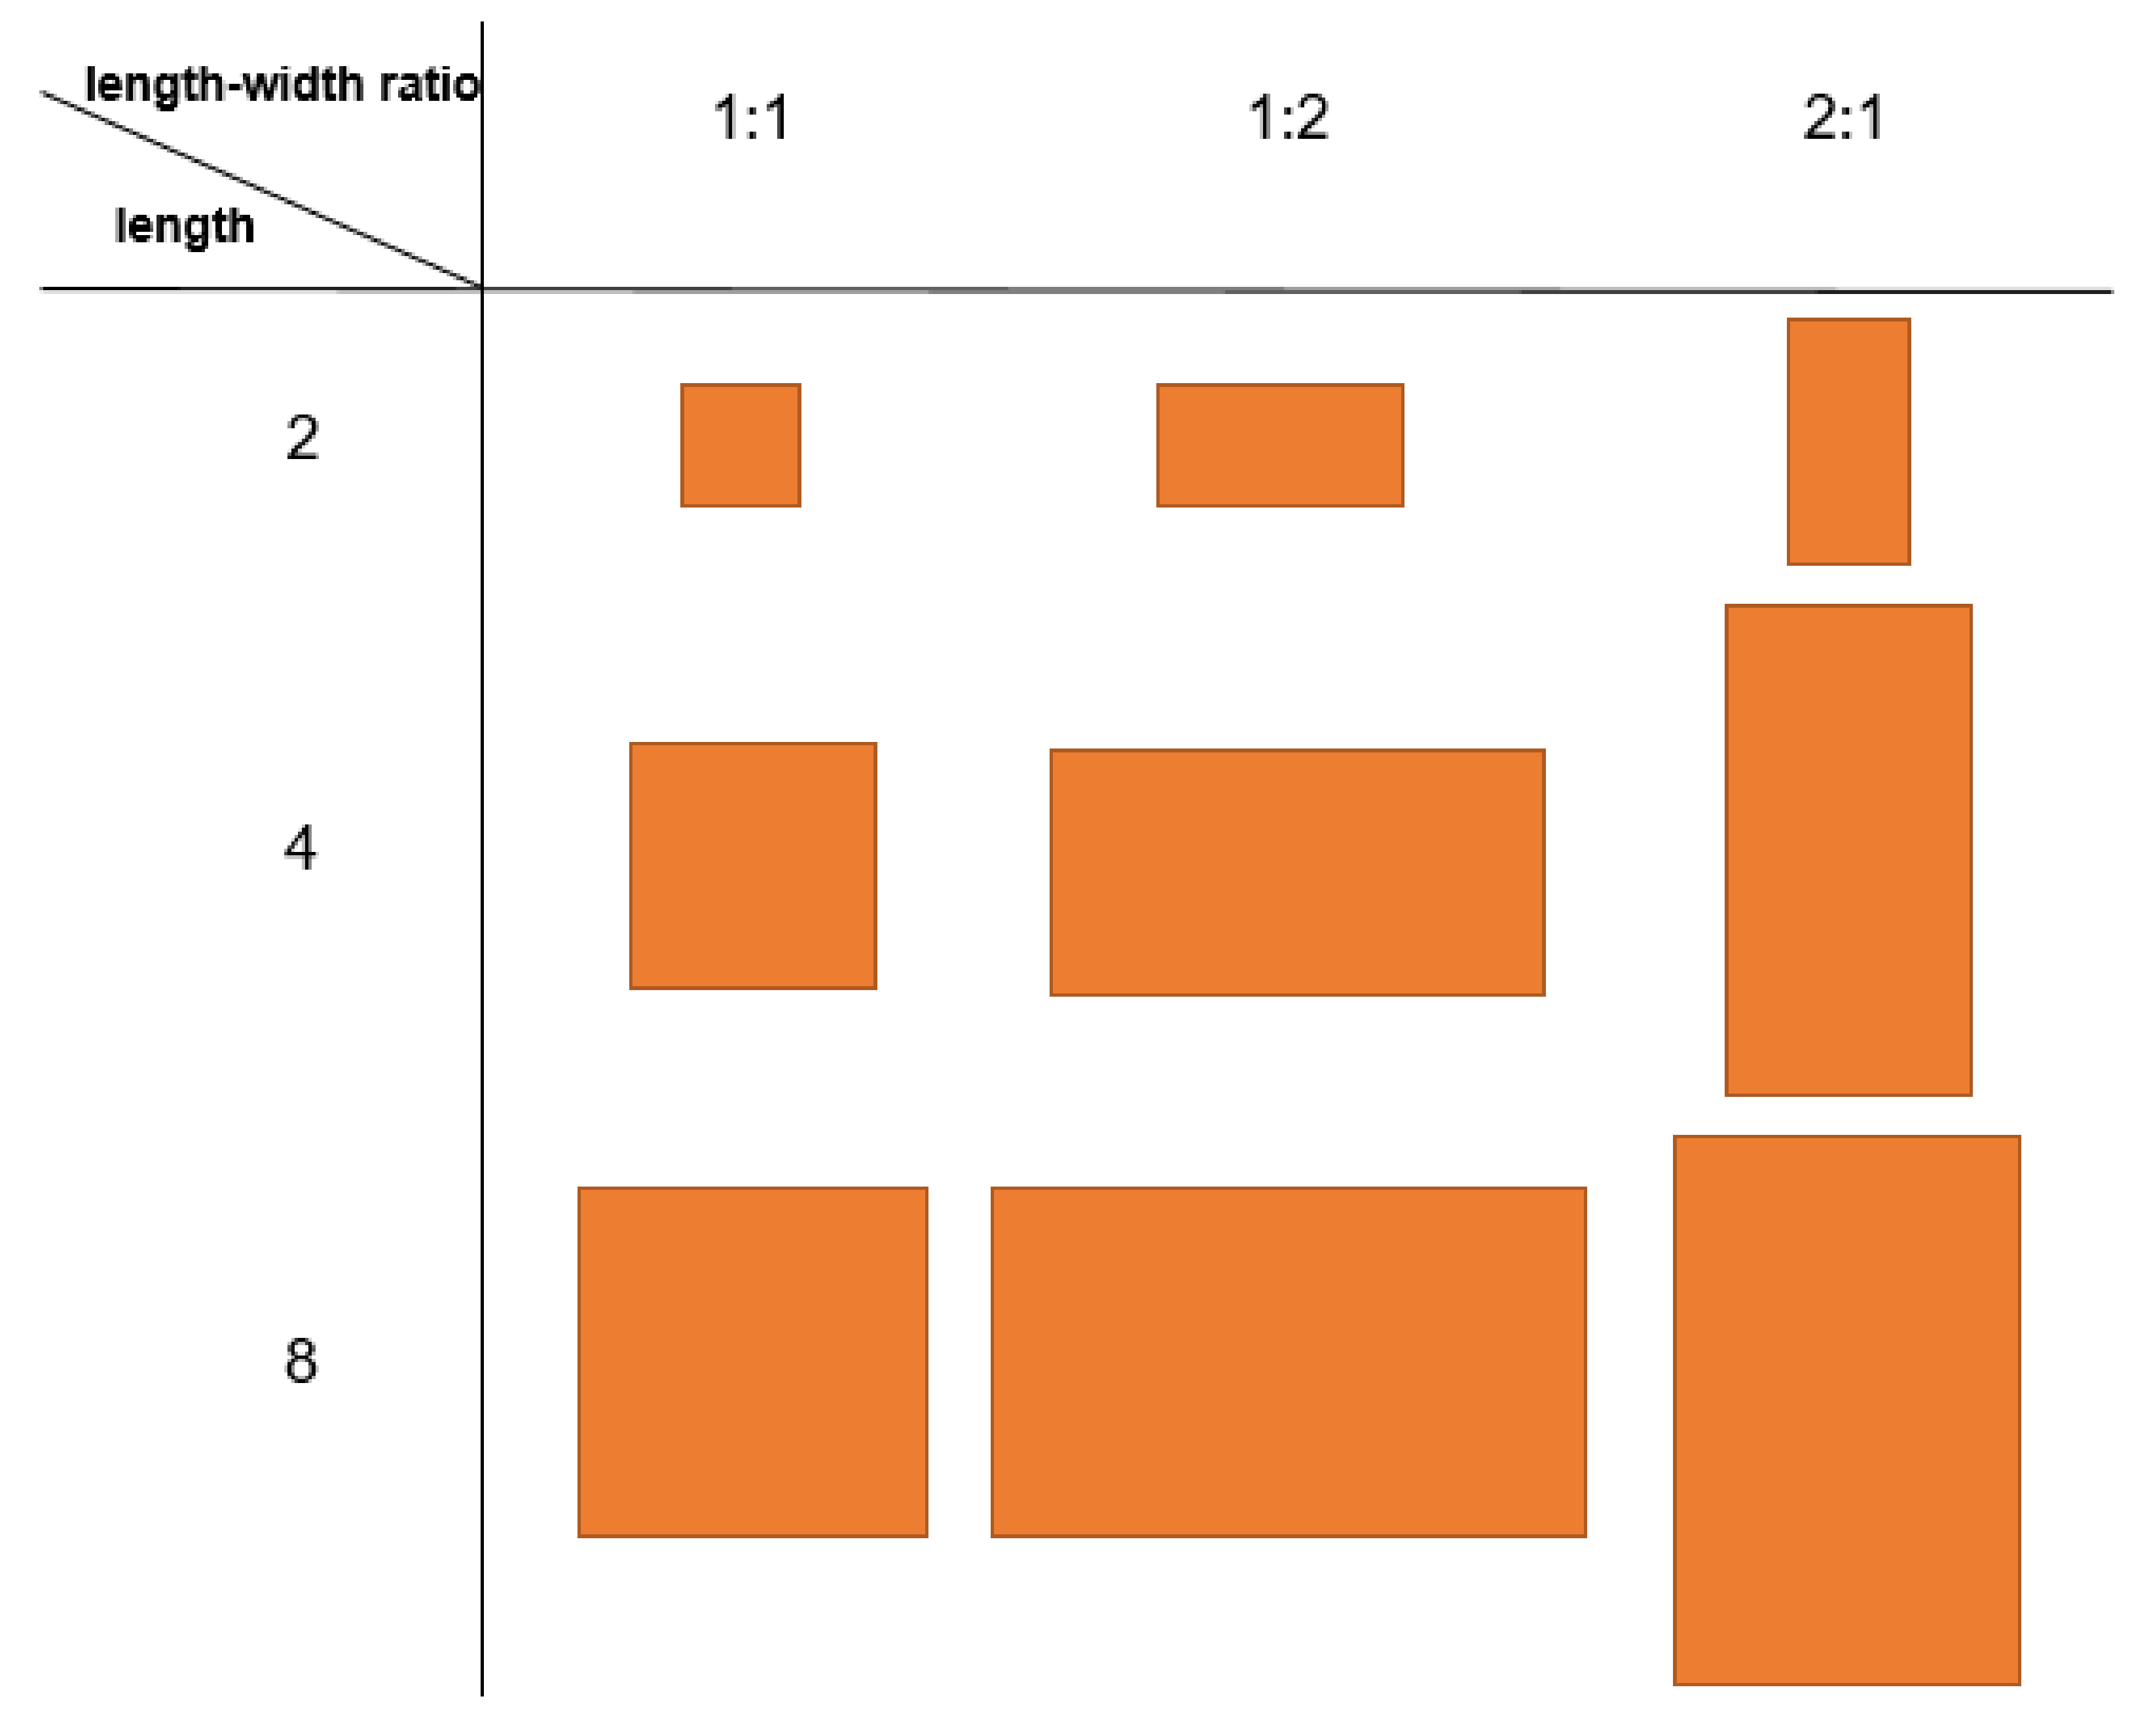
During the training of the Region Proposal Network (RPN), preselected boxes which named anchors played a crucial role. The size of the generated anchors determines the quality of the preselected boxes obtained in the subsequent screening process. As the detection object in UAV remote sensing images was small in this study—some diseased trees occupied only a few pixels—the anchors set in the original RPN network had to be optimized. This study discarded six anchors with side lengths of 16 and 32, and added six anchors with side lengths of 2 and 4, aspect ratios of 1:1, 1:2 and 2:1. Three anchors with length of eight are retained. The improved anchors are shown in Figure 4.
2.3.3. Optimization of Convolutional Neural Network
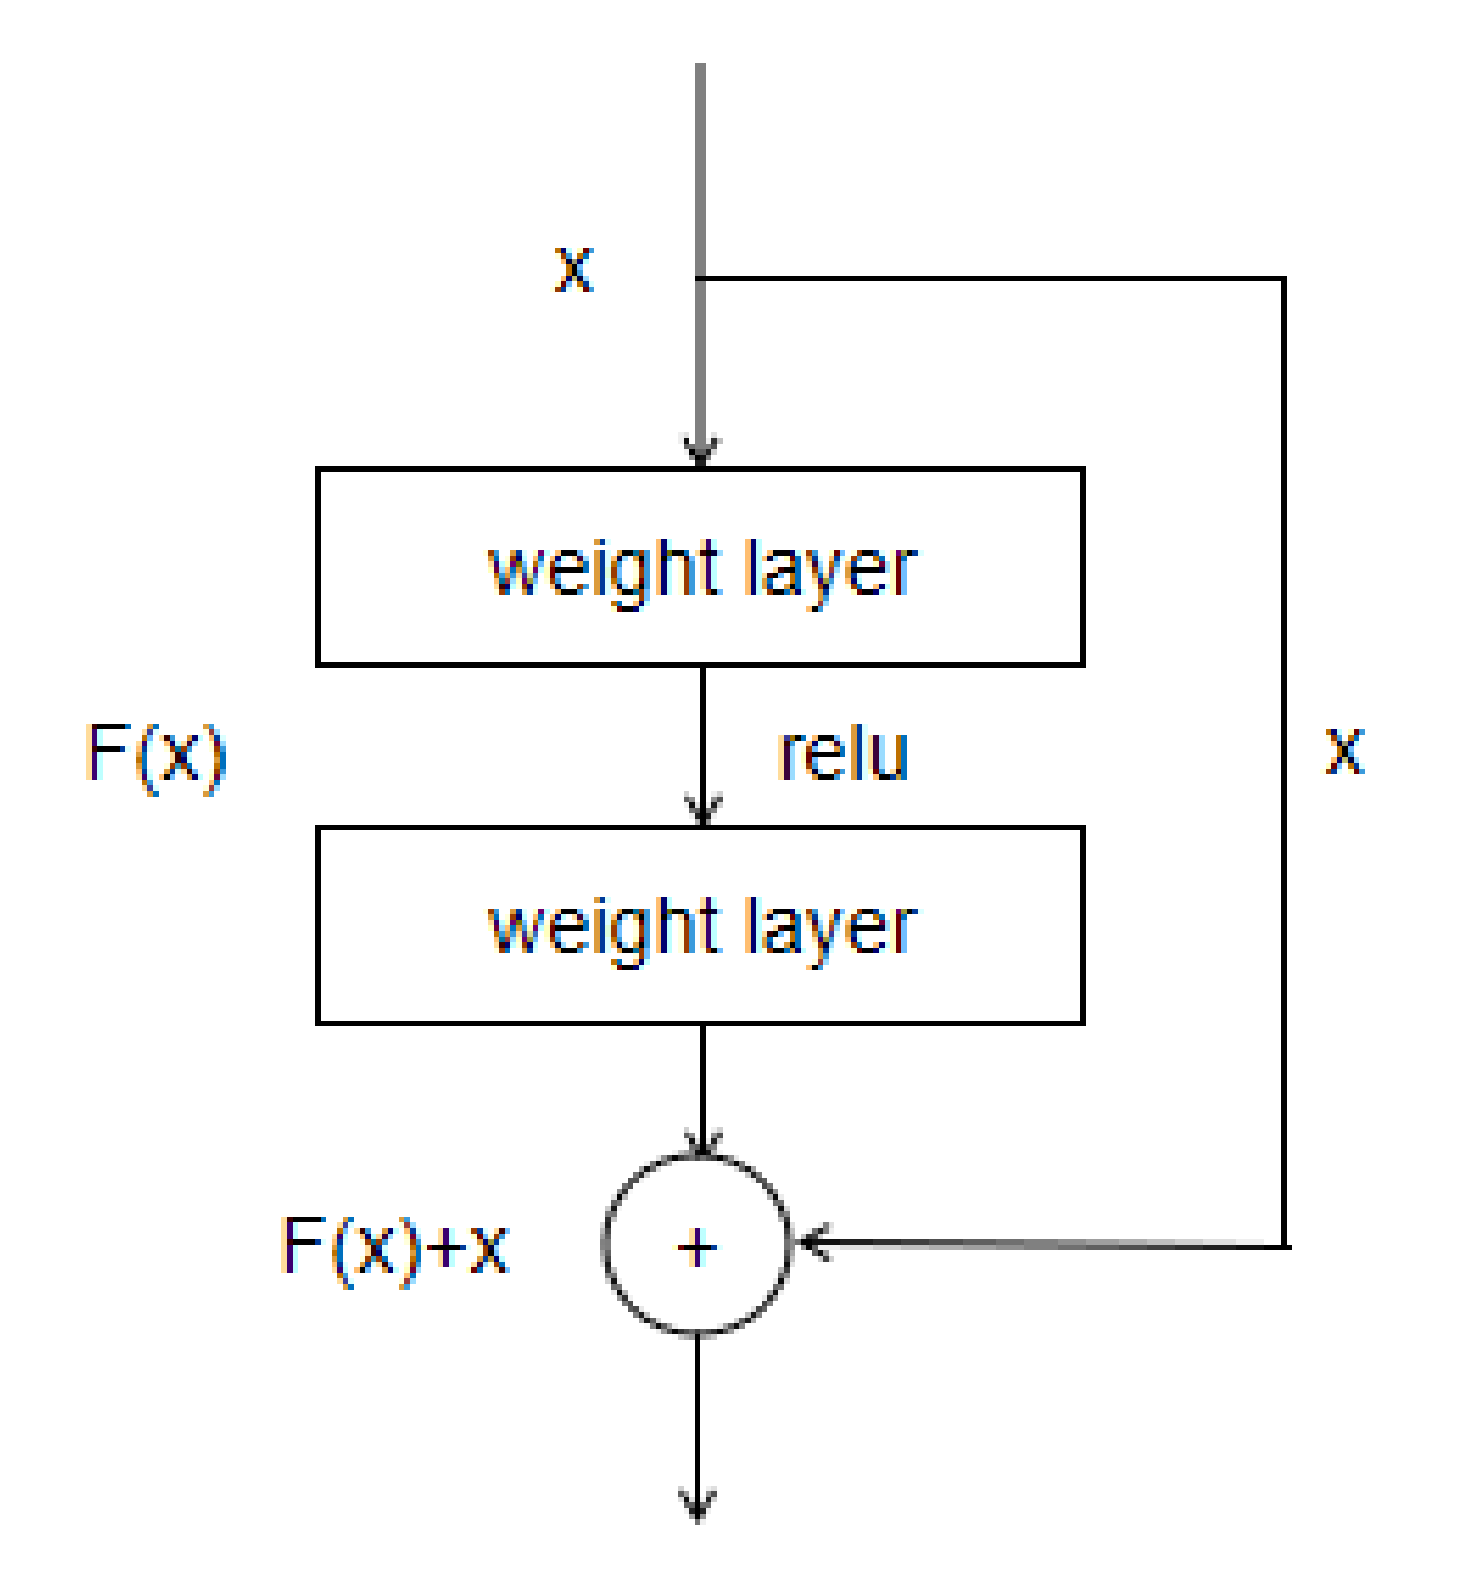
The convolutional neural network used in the original Faster-RCNN network is VGG16 [22]. In this paper, the VGG16 convolutional neural network was replaced by the ResNet101 convolutional neural network (Residual Network 101) [23], which has a deeper network depth and prevents the gradient from disappearing. The residual neural network can deepen the network to 101 or even 156 layers. The basic structure of the network is shown in Figure 5. The output H (x) is equal to the sum of x and F (x), that is, H (x) = F (x) + x, F (x) represents the difference between the output and the input, a deeper residual neural network is obtained by interconnecting several basic networks.
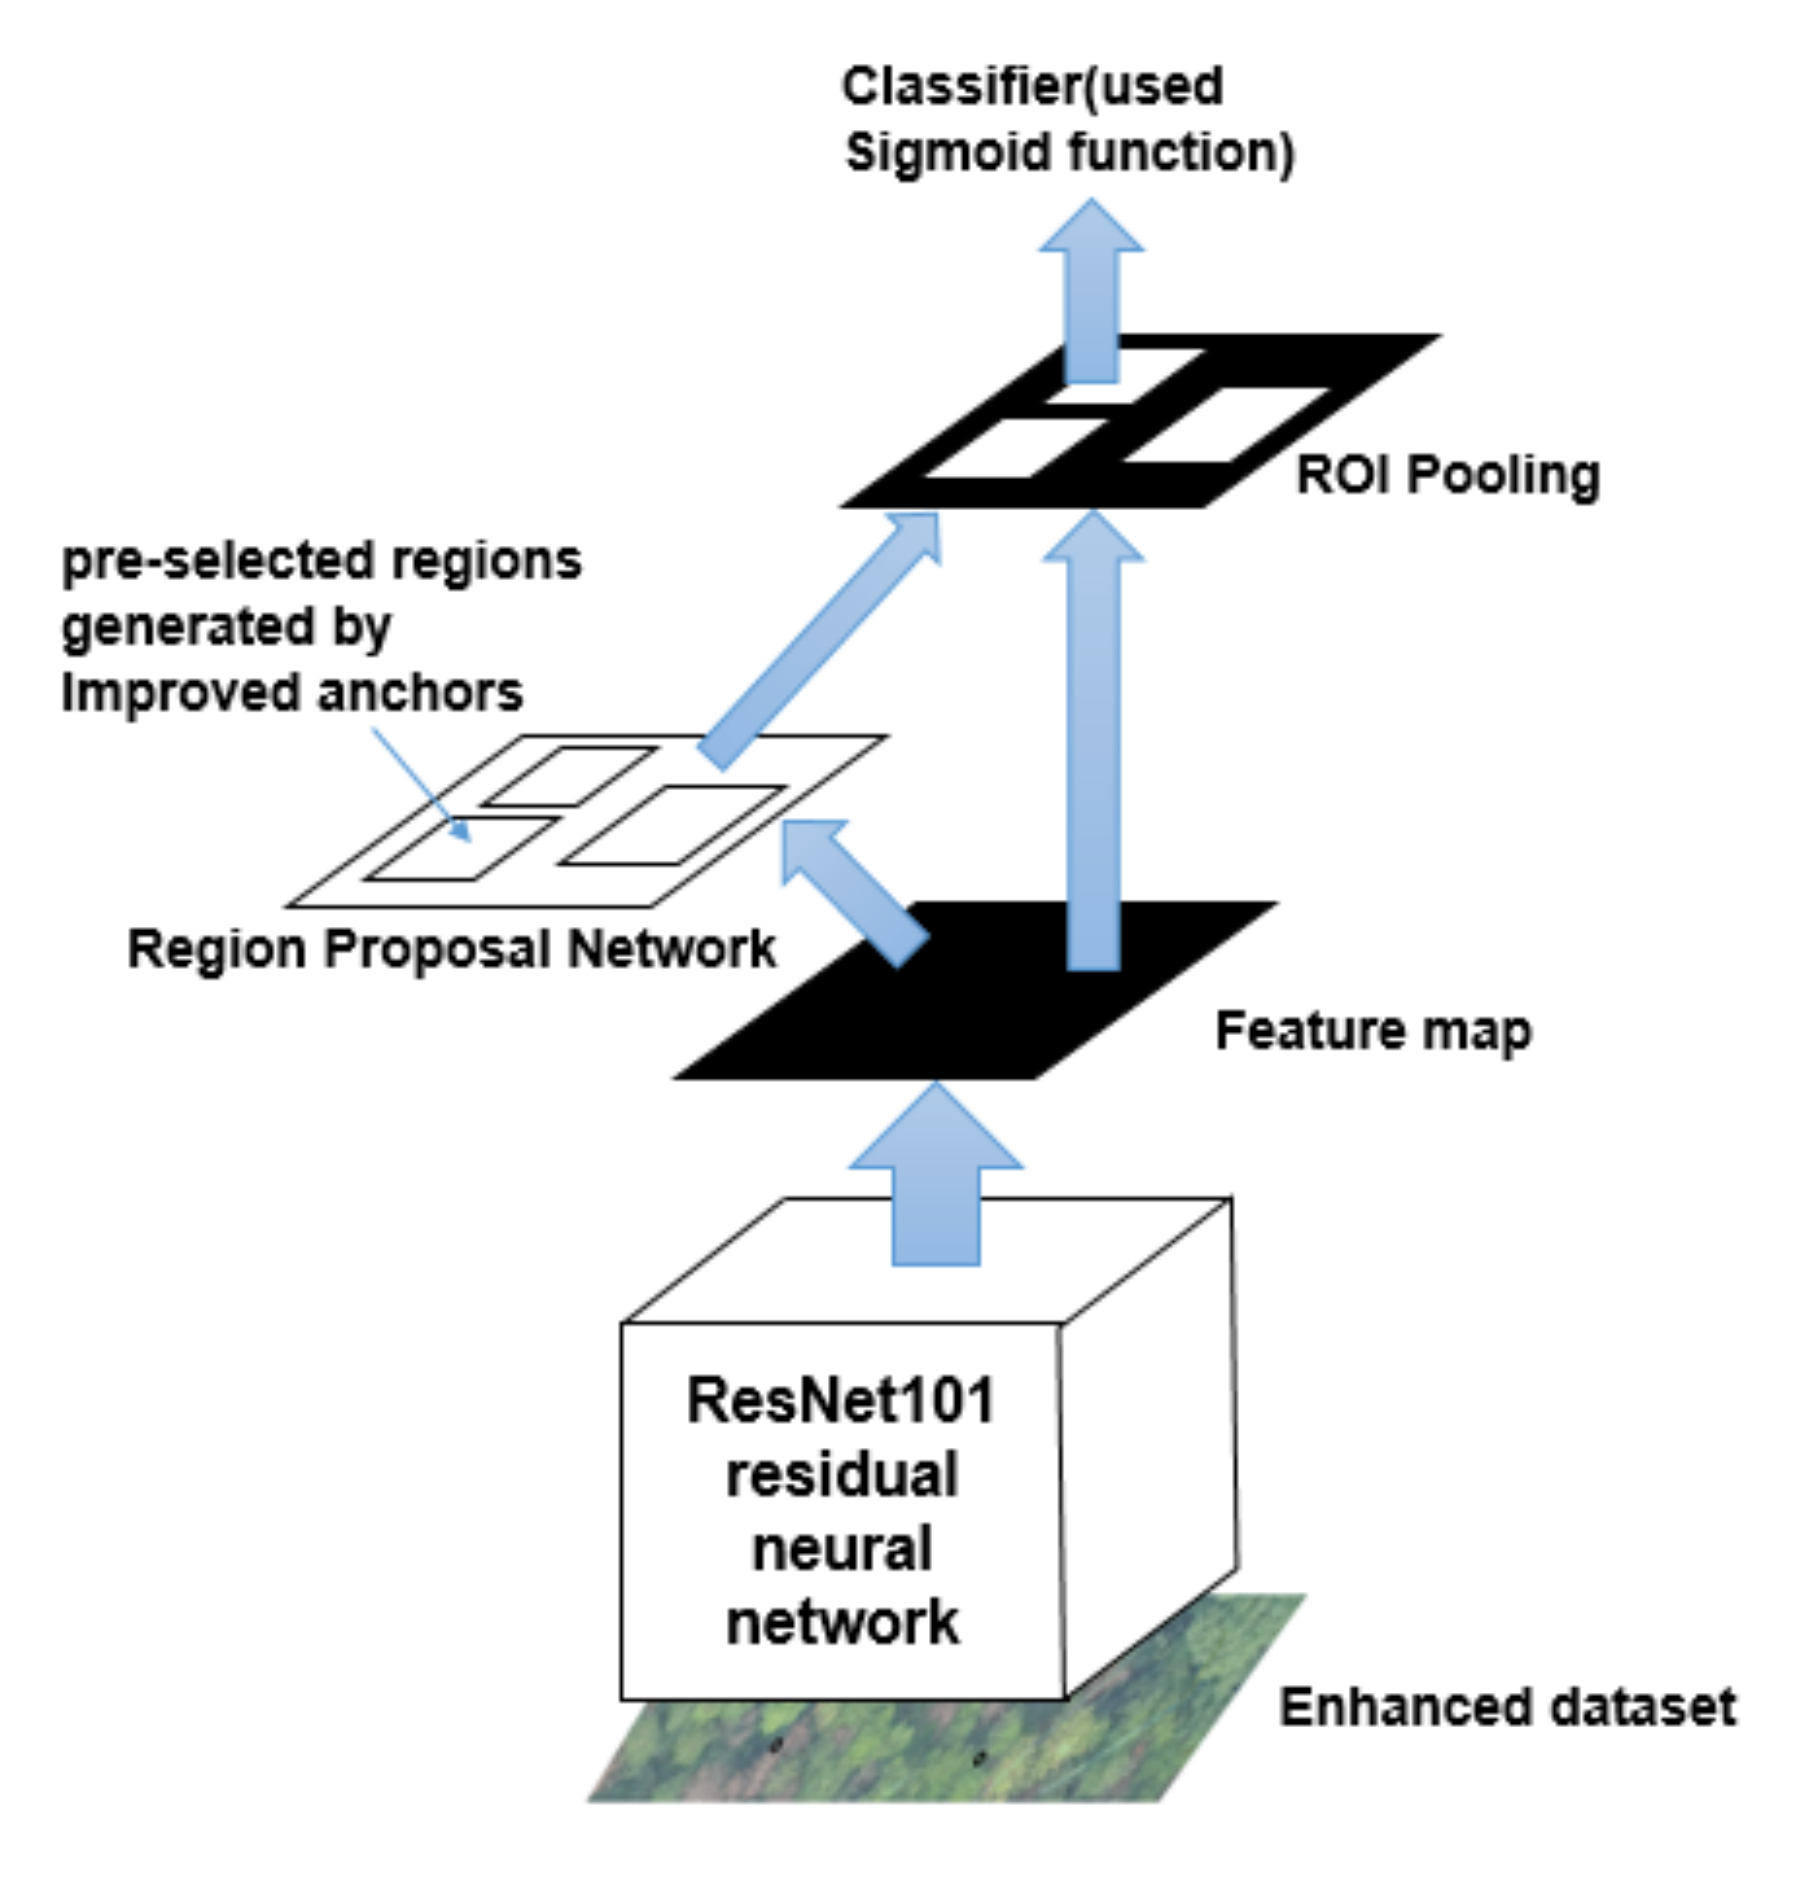
After the above improvements, the overall network training process is as follows:
- (1)
- Input the enhanced dataset into ResNet101 residual neural network to generate feature map;
- (2)
- Input the feature map into the RPN network, and generate N preselected boxes of different sizes and different aspect ratios at the center of each pixel on the feature map through the improved anchors. By calculating the IOU (Intersection Over Union) value between the preselected boxes and the ground truth, classify positive samples and negative samples. Screen the preselected boxes by NMS (nonmaximum suppression) algorithm. Finally, by setting the appropriate top-N parameters, select the top-N preselected boxes as the final preselected regions and output the result;
- (3)
- Input the feature map and the preselected regions generated by the RPN network to the ROI (region of interest) pooling layer, partition pool the feature map according to the preselected regions and output a fixed-size feature map;
- (4)
- Use the sigmoid function and smooth L1 function to classify and regress the final feature map.
The improved overall network structure is shown in Figure 6.
2.4. Location of the Detection Objects
The image captured by the sensefly SODA visible light camera with GPS module has geographic location information. The original geographic coordinate system is a three-dimensional spherical surface. To convert three-dimensional geographic coordinates into a plane coordinate system, the UTM (Universal Transverse Mercator) Mercator projection coordinate system was selected, and ArcMap software was adopted as the tool to define the projection coordinates for the image. In the UTM Mercator projection coordinate system, it is necessary to obtain the appropriate number of Mercator projection distribution bands according to the specific geographic longitude information of the detection area through the conversion formula shown in Equation (2), where represents the number of Mercator projection distribution bands, x represents the integer part of the longitude of the area, and the result obtained by is rounded down.
As the longitude of Anyi County, Nanchang City, Jiangxi Province is 114.92, the integer part of x is equal to 114. According to the Equation (2), the number of Mercator projection distribution bands is 50. Also, as Anyi County of Nanchang City, Jiangxi Province belongs to the northern hemisphere, the final determination of the UTM Mercator projection coordinate system is WGS (World Geodetic System) 1984 UTM Zone 50N, the longitude range defined by the projection coordinate system is 114° to 120°, and the central meridian is 117°.
To add geographic location information to the output of Faster-RCNN detection, mainly two conversion functions of coordinates in the Gdal (Geospatial Data Abstraction Library) and Osr (Open Systems Resources) library were adopted, including conversion function from image to projection coordinate and projection to geographic coordinate.
2.4.1. Conversion from Image Coordinate to Projection Coordinate
The GetGeoTransform function can read the projection coordinates of the upper left and lower right corners of the input image. If the UTM projection coordinate system defined by the input image is the northern hemisphere, the projection coordinates of the upper left corner are returned, if the UTM projection coordinate system defined by the input image is the southern hemisphere, the projection coordinates of the lower right corner are returned. At the same time, the Gdal library also reads the resolution of the input image in width and height and returns six values, then calculates the projection coordinates corresponding to each target based on these six values and the coordinates on the image. The calculation formulas between the coordinates on the image and the projection coordinates on the x-axis and the y-axis are shown in Equations (3) and (4), where and represent Projection coordinates in the x axis and y axis, cols indicates the number of coordinate columns of the detection target on the image, and rows indicates the number of coordinate rows of the detection target on the image, and trans [0] and trans [3] represent the projection coordinates of the upper left corner of the input image, trans [2] and trans [4] represent the projection coordinates of the lower right corner of the input image, and trans [1] and trans [5] represent the resolution of the input image in width and height. Since the location of this image was taken in the northern hemisphere, only the top left coordinate of the projected image was returned, and trans [2] and trans [4] were returned as zero.
2.4.2. Conversion from Projection Coordinates to Geographic Coordinates
To convert the projection coordinate to geographic coordinates, the GetProjection function and the CloneGeogCS function in the osr library were conducted to get the reference system of projection and geographic coordinate. Then the CoordinateTransformation function in the osr library was conducted to implement the coordinated conversion from WGS 1984 UTM zone 50N projection coordinate system to WGS 84 geographic coordinate system. After the coordinated conversion was completed, the final latitude and longitude information of each target detection result was obtained.
3. Results and Discussion
3.1. Performance of Pine Wilt Disease Dead Tree Detection
Table 1 shows the detail of model training effects under different conditions. Using the original data, the mAP (mean Average Precision) of the model increased from 66.2% to 70.8% after replacing the VGG16 by ResNet101. Although the detection speed of VGG16 is faster than the detection speed of RseNet101, the model accuracy of ResNet101 is better. Therefore, in this study, ResNet101 was selected as the training network for subsequent experiments. Then, the mAP of the model reached 72.5% after replacing the softmax function by the sigmoid function without enhancing the data. Under the condition of improving the loss function and using the ResNet101 network, the mAP of the model reaches to 80.2% after putting the enhanced dataset into the network for training. On the basis of the above optimization, the mAP of the model was improved to 89.1% after improving the anchors in the RPN network. In summary, after a series of improvement, the mAP of the model increased from 66.2% to 89.0%, in other words, the overall improvement was 22.8%. The final detection speed of the model is 1.064 s.
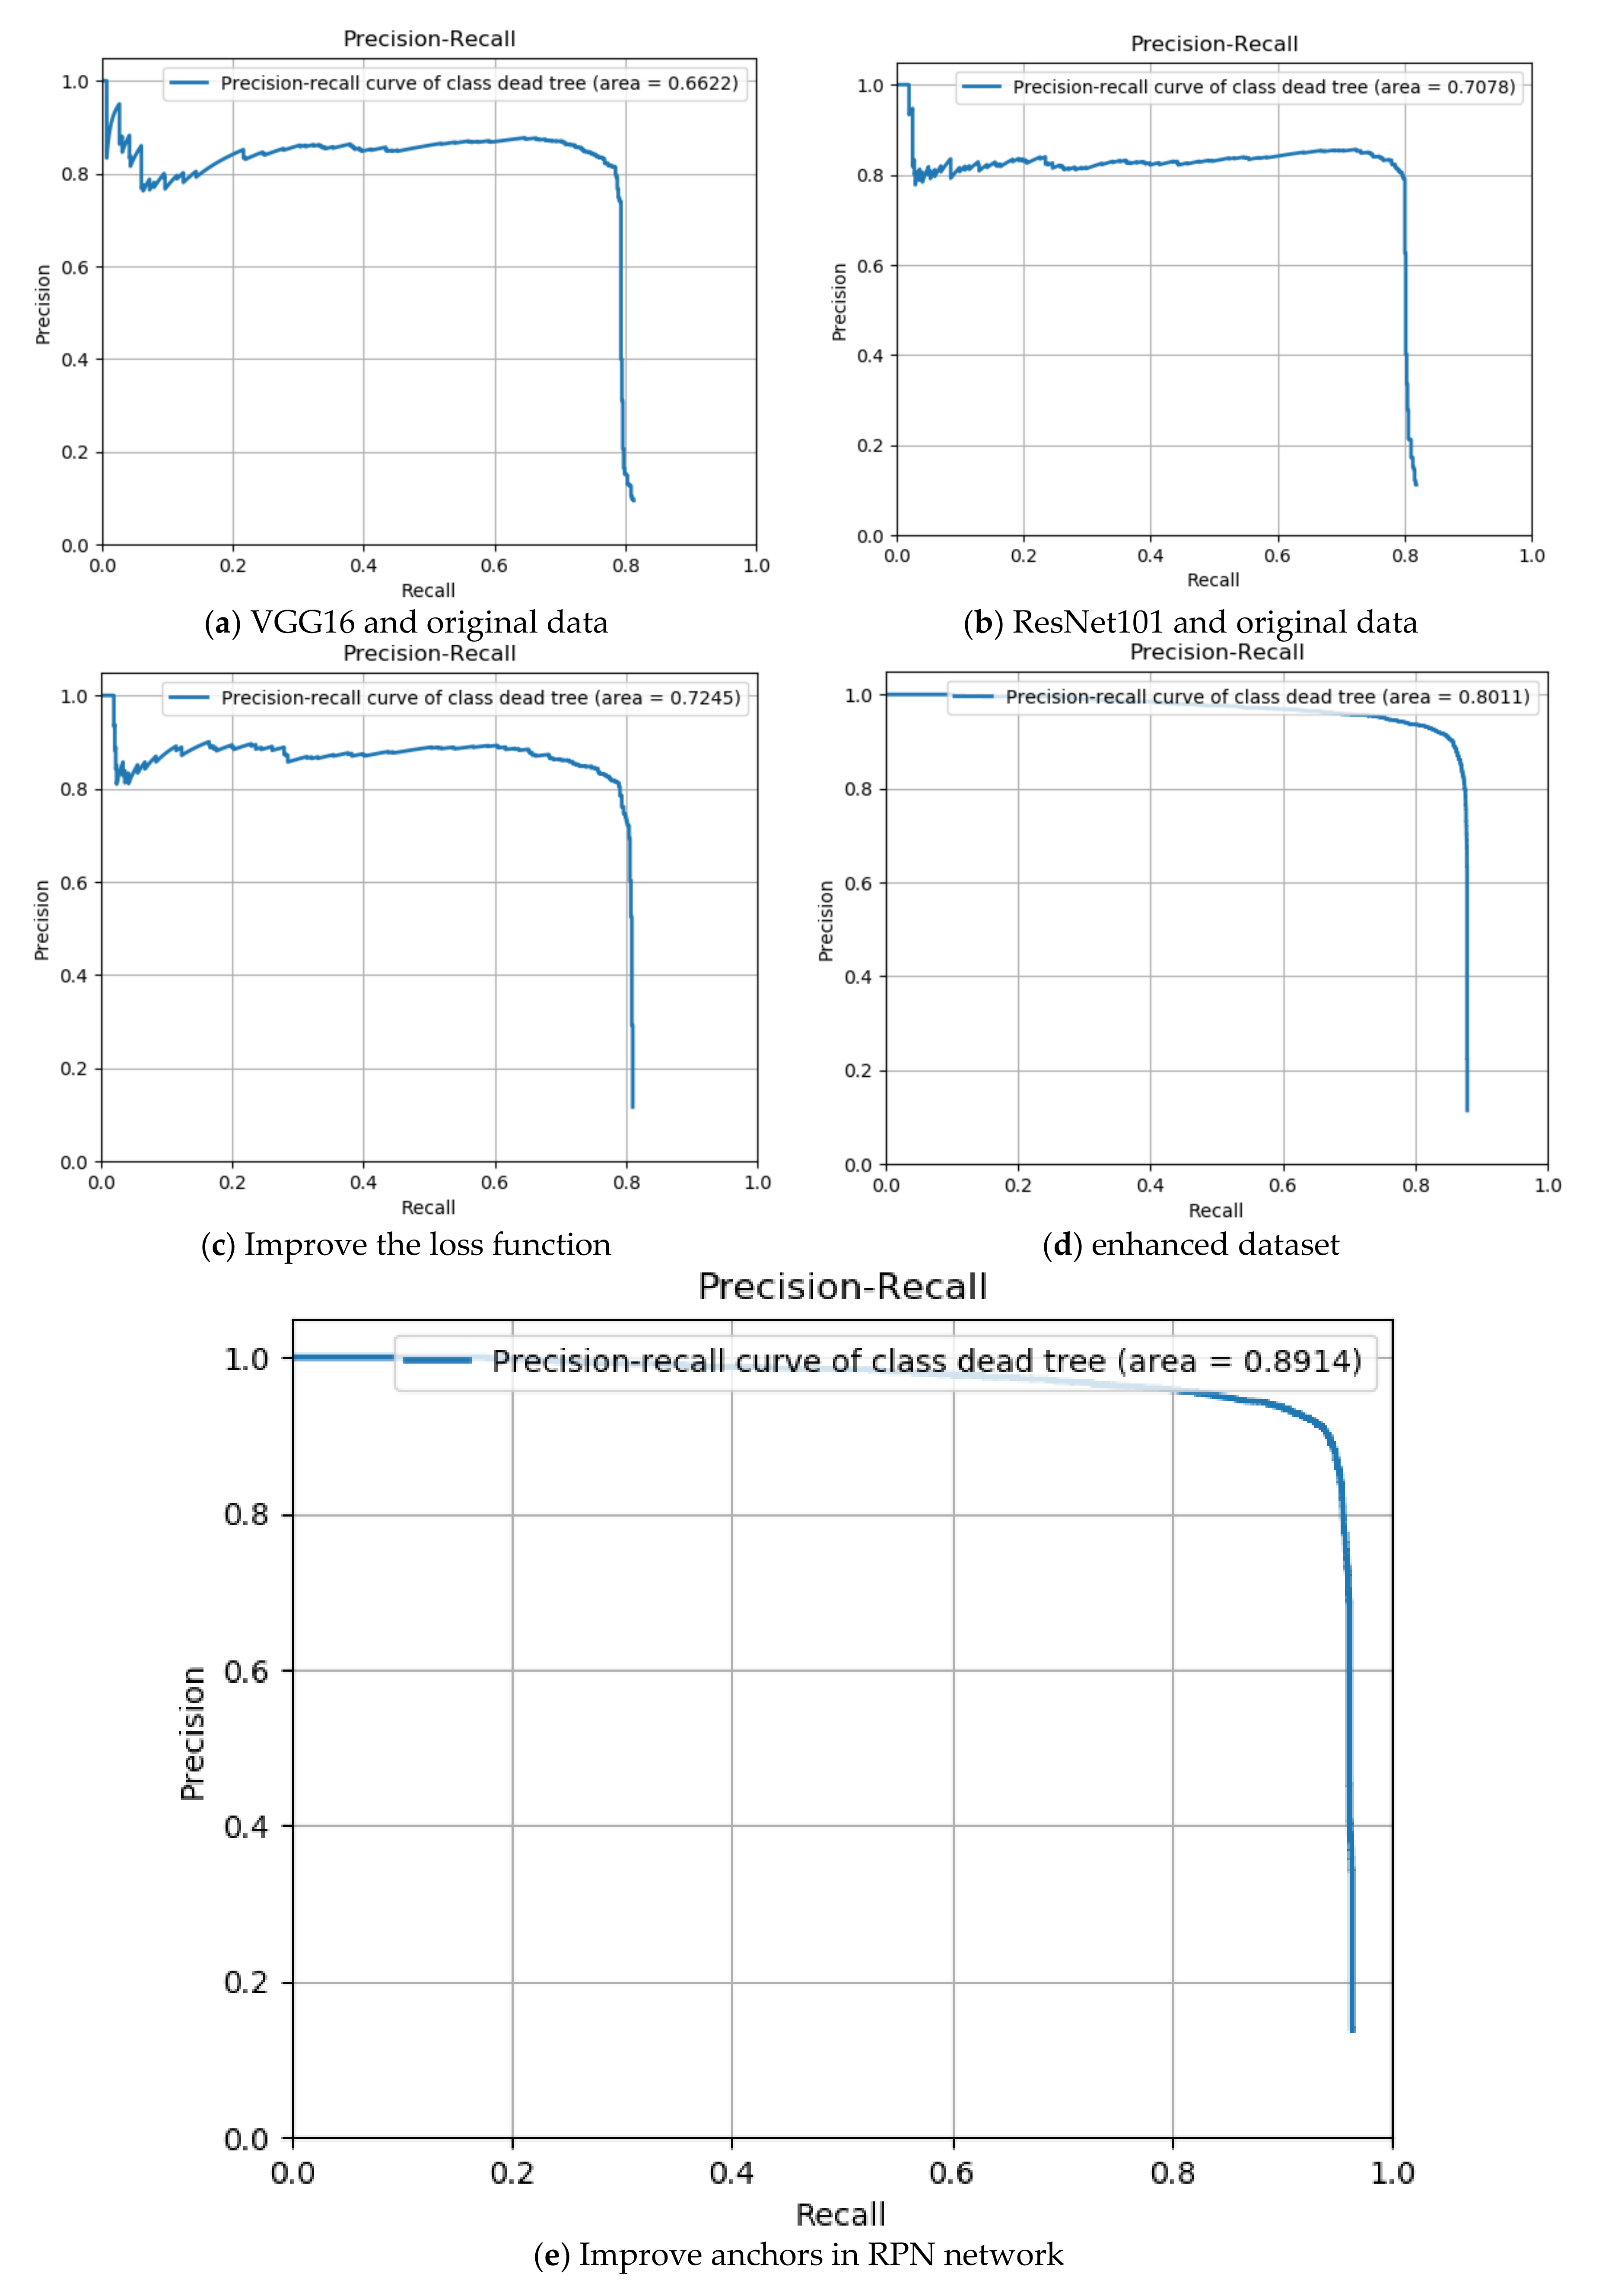
PR curve (precision–recall curve) of different conditions is shown in Figure 7. Precision rate means that among the identified targets, the number of correctly identified targets accounts for the total number of targets. Recall rate means the proportion of correctly identified samples among all positive samples in the test set. The area created by the PR curve with the x-axis and y-axis represents the effect of the model; the larger the area is, the better the model effect. As shown in Figure 7a,b, when using the original data to train the model, the area of the PR curve using VGG16 is 0.6622 and the area of the PR curve using ResNet101 is 0.7078, which is larger than using VGG16. Based on the ResNet101 neural network, after improving the loss function, the area of the PR curve increased to 0.7245, which is shown in Figure 7c. As shown in Figure 7d, the recall rate of the model obtained by using the enhanced data training exceeds 0.8, using ResNet101 convolutional neural network and replacing the loss function, the accuracy rate was more stable, and the area of the PR curve increased to 0.8011. Finally, after improving the anchors in the RPN network, the recall rate of model exceeded to 0.9, and the area of the PR curve increased to 0.8914, which is shown in Figure 7e.
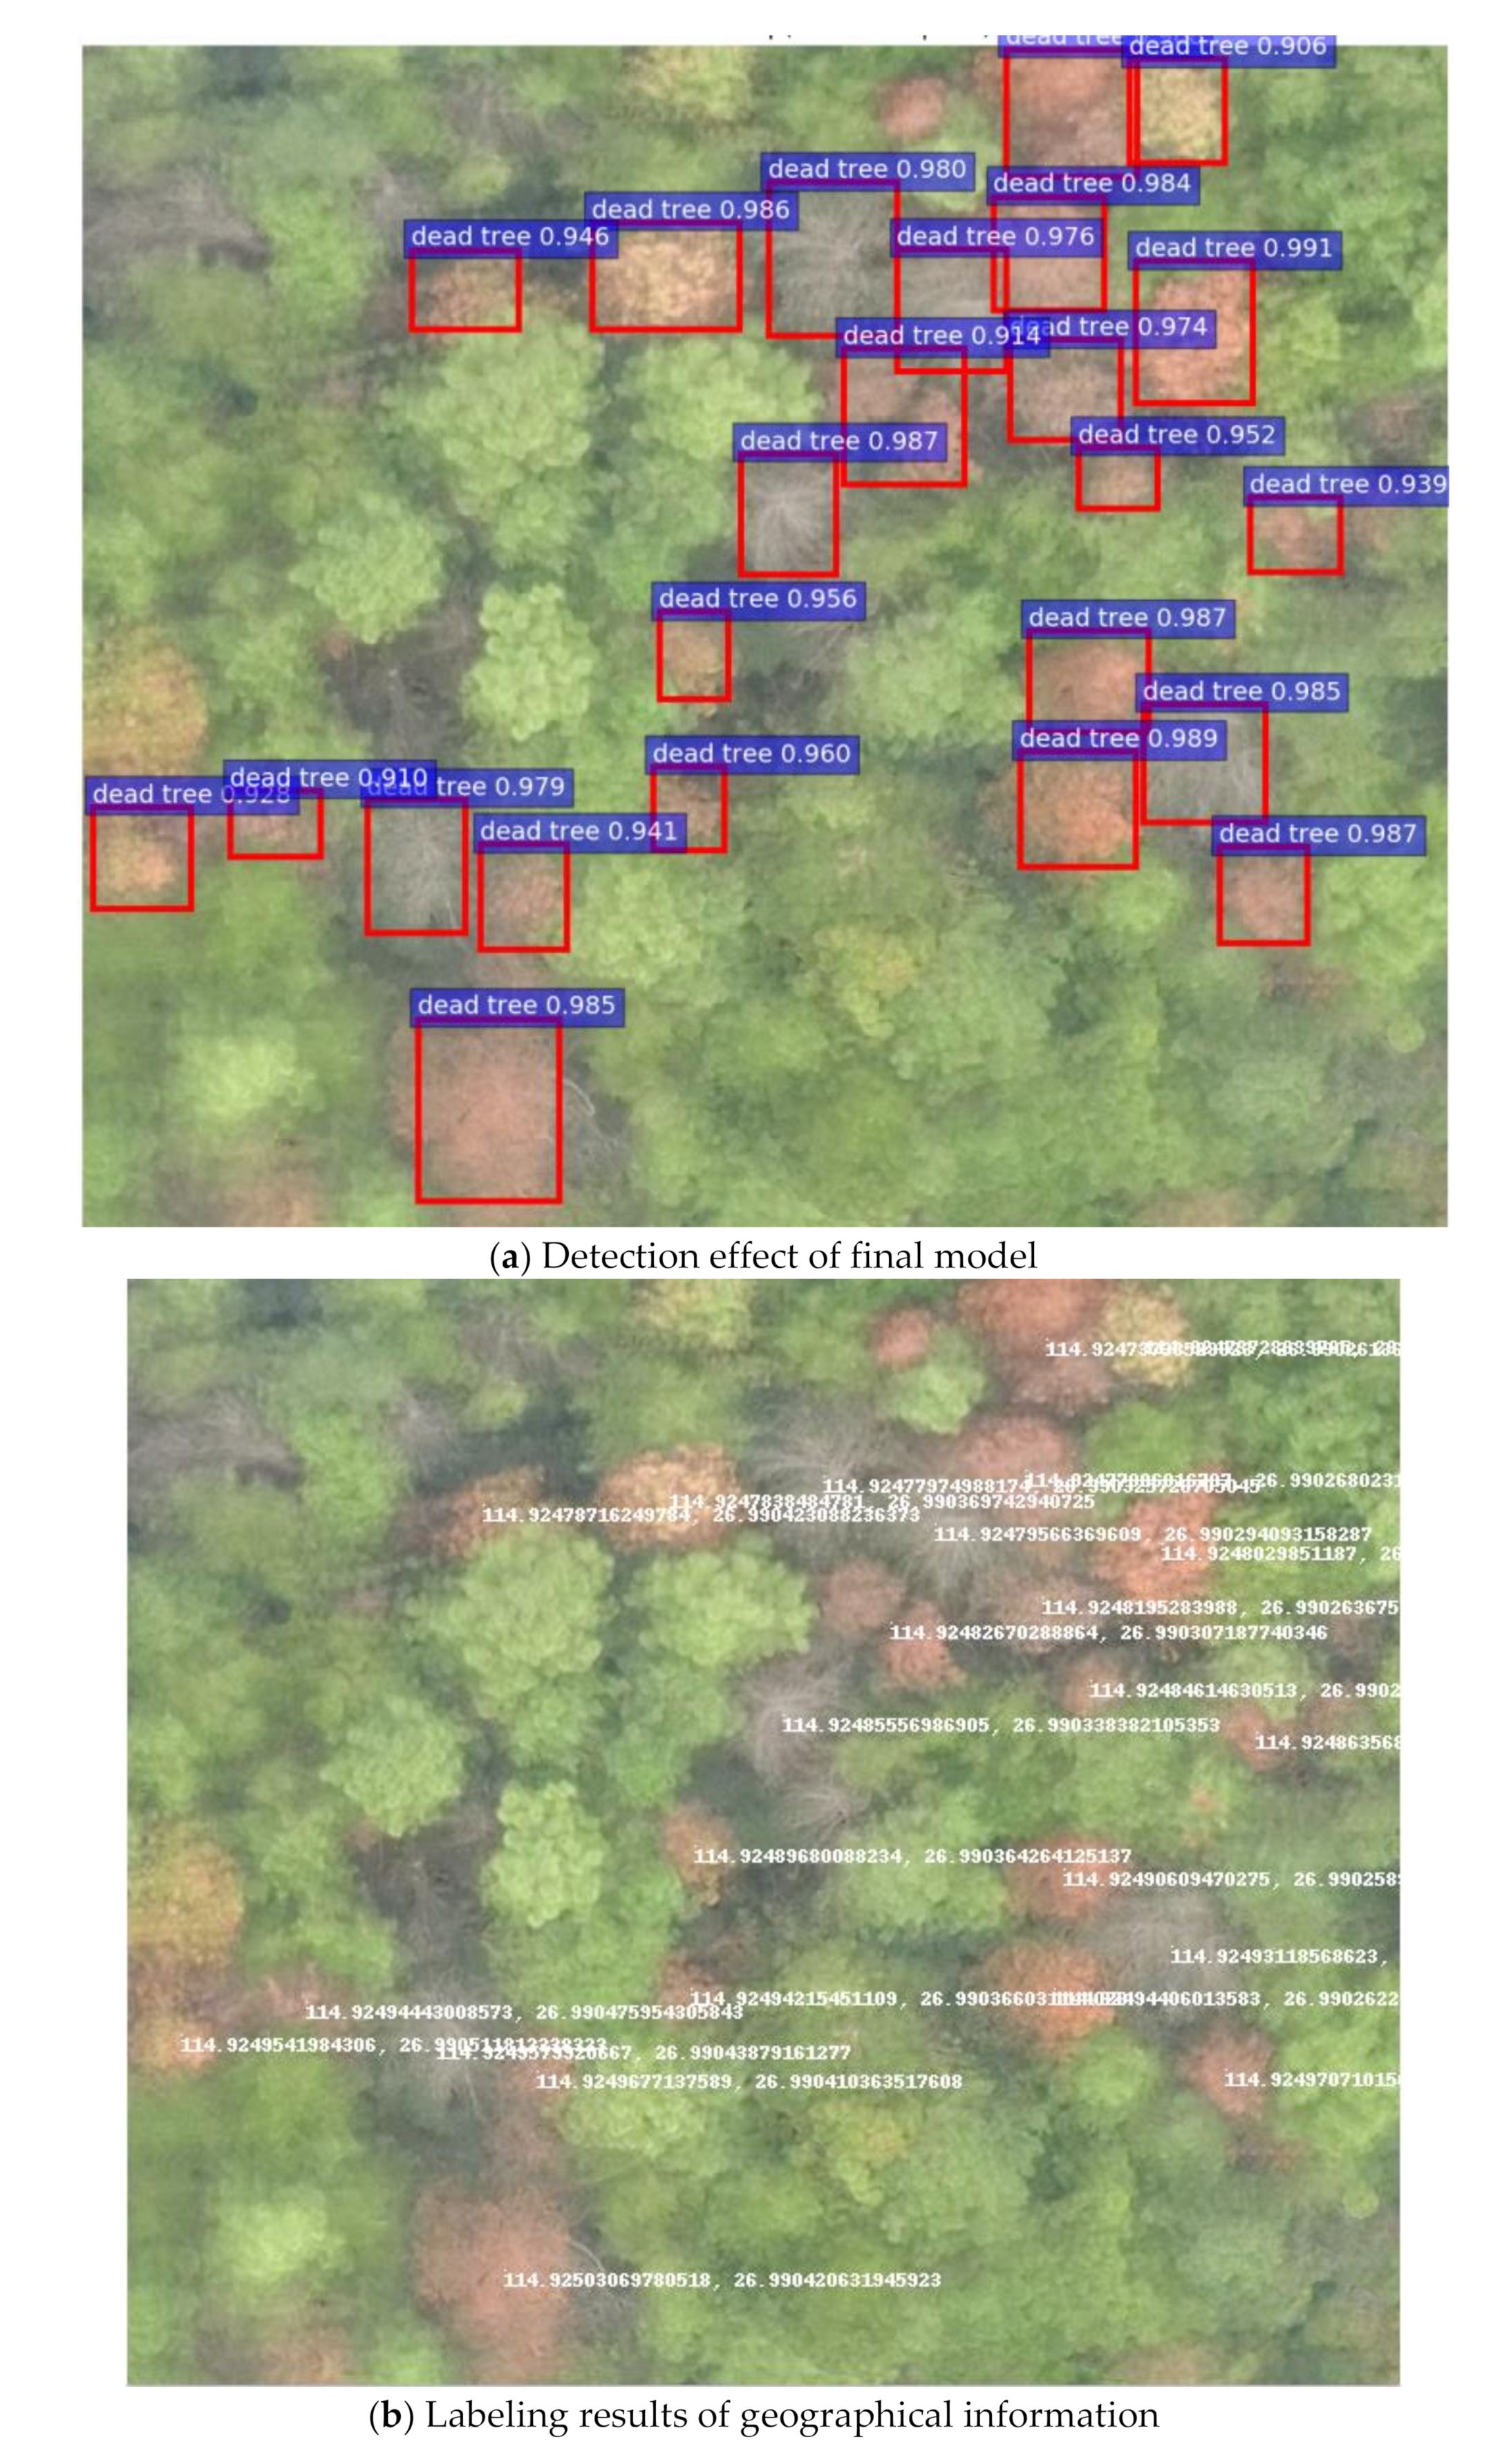
The detection result of the best detection model in this study is shown in Figure 8a. The detection objects include all kinds of dead tree, and all confidences of the results are all above 90%.
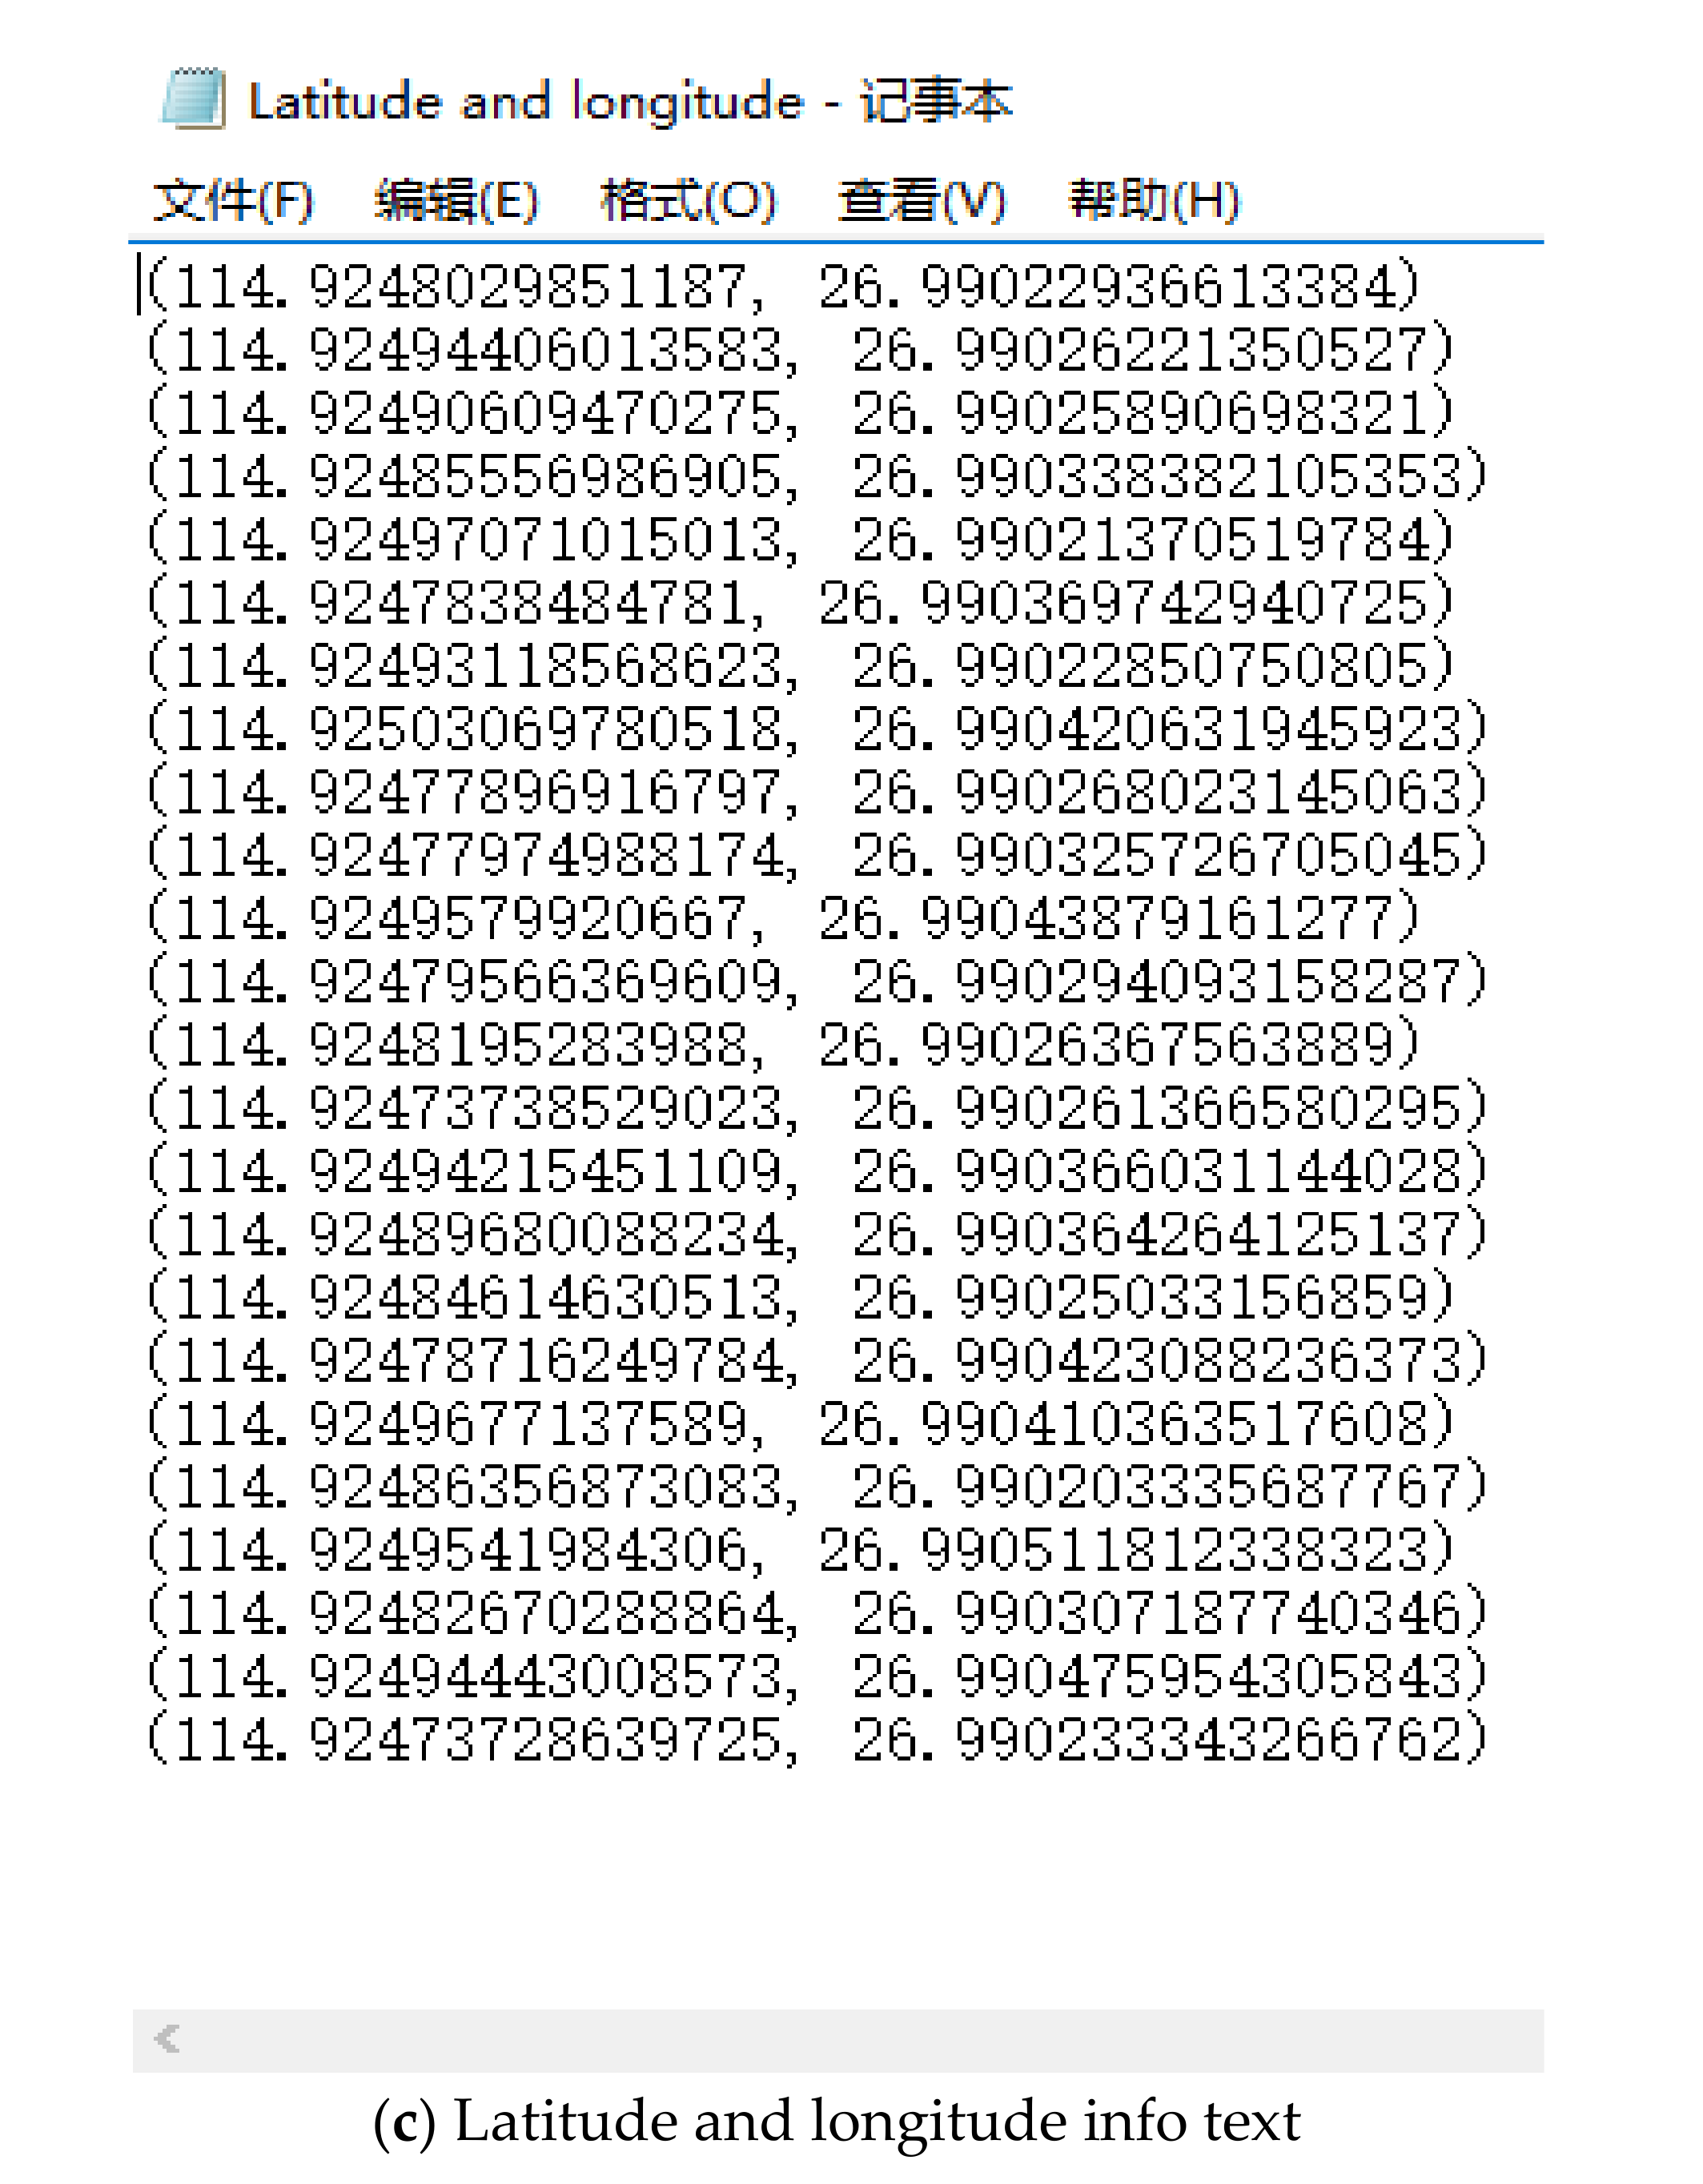
The geographic location of each pine wilt disease dead tree was directly output in this study by adding a geographic coordinate conversion function to the network to guide workers to find the location of the diseased tree faster, improving work efficiency. The output result of geographic information detection is shown in Figure 8b. Considering space limitation, to avoid incomplete display of information and the occlusion between geographic location information in the image, the geographic location information of each target detection result was also output to a text file which recorded the geographic location information of each disease tree. The content of geographic location information text is shown in Figure 8c.
3.2. Analysis and Discussion
(1) The precondition of traditional pine wilt disease dead tree management methods, such as biological and chemical control, [2,3,4,5] is detection of diseased trees. Traditional pine wilt disease detection methods are mainly human eye observation, manually sampling for analysis and detection [24], which features heavy workload, low efficiency, strong subjectivity and difficulty to achieve large-scale monitoring. The method proposed in this article can make up for the above deficiencies by adopting UAV remote sensing, establishing a pine wilt disease dead tree detection model and combining geographic location information, the rapid detection and location of pine wilt disease dead trees can be realized.
(2) Comparing with traditional machine learning algorithms such as random forest algorithm and the decision tree algorithm [25], this study used deep learning network to establish the pine wilt disease dead tree detection model, made some improvements on the basis of the original network and got a more accurate model and better detection effect. In the study of Fangfang Huang et al. [25], the mean accuracy of the pine wilt disease detection model trained by random forest algorithm and the decision tree algorithm was 75.6%. Accuracy of pine wilt disease detection model trained by the method in this paper is 89.1%, which is shown in Table 1.
(3) The pine wilt disease dead tree detection method in this paper has only reached an accuracy rate of 89%, and there was incomplete detection in areas with dense dead trees. The reason might be that the improved anchors were still fixed and not adaptive to the detection target, also the selection of preselected regions wasn’t optimized. Therefore, there is still room for improvement. To further improve the accuracy of the model, a K-means algorithm might be used to adapt the size of anchors according to the detection target and the NMS (nonmaximum suppression) algorithm in the RPN network should be further improved. For example, a soft-NMS nonmaximum suppression algorithm could be used to filter preselected boxes to get better preselected regions.
(4) The most recent publication similar to this study reported that the accuracy for detection and location of the dead tree of pine wilt disease reached to 82.42% by modifying anchors with side lengths of 16, 32 and 64, and representing the position of each dead tree in dots [26]. Comparing with it, in this study, the anchors were modified to a more suitable size with side lengths of 2, 4 and 8, and data enhancement was performed on the original training data, replacing the softmax loss function in the Faster-RCNN network with the sigmoid loss function, replacing the VGG16 convolutional neural network with the ResNet101 convolutional neural network. Therefore, the accuracy of the optimized model in this study was increased from 66.2% to 89.1%, and the overall improvement was 22.9%. Comparing with representing the position of each dead tree as a dot [26], this study directly output the geographic location of each pine wilt disease dead tree, which could help workers find disease trees faster.
(5) Taking effective protective measures according to different degrees of illness can more effectively suppress the spread of the disease and improve work efficiency. The research object of this paper was the discrimination among three disease stages of the diseased Pinus massoniana, and the three external features of Pinus massoniana were marked. However, it was hard to collect enough image data of pine wilt disease dead trees in various periods. Under the limitation of insufficient sample amounts, data enhancement was performed through a series of ways, including image rotation, image flipping, and darkening and brightening, and multi-classification was replaced by binary classification. Further collecting the image data of the pine wilt disease epidemic area, in order to expand the data, will help to distinguish the pine wilt disease dead tree in different stages and improve the model detection ability.
(6) This study has established a detection model of pine wilt disease dead tree and can accurately extract the latitude and longitude information of each diseased plant. If the detection model can be deployed to an edge smart device mounted on a UAV, real-time monitoring and positioning of pine wilt disease dead tree can be achieved. Such a method could further improve the detection efficiency of pine wilt disease dead trees, and workers can obtain the geographic location information of the diseased trees in a timely fashion during the prevention and control process so as to improve work efficiency.
4. Conclusions
This paper proposes a pine wilt disease dead tree detection model based on the Faster-RCNN deep learning framework, adding a geographic location information module to the network to achieve detection and location of pine-wilt-diseased dead trees. Several optimization works were conducted including data enhancement on the original training data, replacing the Softmax loss function in the Faster-RCNN network with the sigmoid loss function, replacing the VGG16 convolutional neural network with the ResNet101 convolutional neural network, and adjusting the size of the anchors in the RPN network and so on. The accuracy of the optimized model was increased from 66.2% to 89.1%, and the overall improvement was 22.9%. The confidence of the final test results obtained by the optimized model was above 90%, which means a rather good detection effect on pine-wilt-diseased dead trees. Also, the coordinate system conversion function and geographic location information output module were added to the network so that the latitude and longitude information of each target detection result could be extracted and generated.
Author Contributions
Conceptualization, Y.L.; Funding acquisition, Y.L.; Project administration, Y.L.; Software, Z.T. and Z.H.; Writing—original draft, Z.T.; Writing—review and editing, X.D. All authors have read and agreed to the published version of the manuscript.
Funding
This research was funded by the Research and Development Program in Key Areas of Guangdong Province (2019B020214003), the National Natural Science Foundation of China (61675003), the Special projects in key areas of “artificial intelligence” of general colleges and universities in Guangdong Province (Grant No. 2019KZGZX1012).
Conflicts of Interest
The authors declare no conflict of interest.
References
- Li, G. The Occurrence and Control of Pine Wood Nematode Disease. Green Technol. 2019, 4, 110–111. [Google Scholar]
- Narayanan, P.L.; Ok, R.S.; Gnanendra, S.; Junhyun, J.; Young-Hwan, P.; Sun-Keun, L.; Hanhong, B. Phylogenetic characterization of bacterial endophytes from four Pinus species and their nematicidal activity against the pine wood nematode. Sci. Rep. 2019, 9, 1–11. [Google Scholar]
- Kim, J.C.; Lee, S.J.; Kim, S.; Lee, M.R.; Baek, S.; Park, S.E.; Kim, J.; Shin, T.Y.; Kim, J.S. Management of pine wilt disease vectoring Monochamus alternatus adults using spray and soil application of Metarhizium anisopliae JEF isolates. J. Asia-Pac. Entomol. 2020, 23, 224–233. [Google Scholar] [CrossRef]
- Yamaguchi, R.; Matsunaga, K.; Watanabe, A. Influence of temperature on pine wilt disease progression in Pinus thunbergii seedlings. Eur. J. Plant Pathol. 2020, 156, 581–590. [Google Scholar] [CrossRef]
- Pan, J.; Zhang, H.; Ju, Y.; Liao, Z. Early Monitoring of Pine Wilt Disease in Pinus mas- sioniana based on Hyperspectral Data. Plant Dis. Pests 2015, 6, 1–5. [Google Scholar]
- Chen, J. Summarization of research on pine wood nematode control. Jilin For. Sci. Technol. 2019, 48, 41–42. [Google Scholar]
- Deng, X.; Lan, Y.; Hong, T.; Chen, J. Citrus greening detection using visible spectrum imaging and C-SVC. Comput. Electron. Agric. 2016, 130, 177–183. [Google Scholar] [CrossRef]
- Deng, X.L.; Lan, Y.B.; Xing, X.Q.; Mei, H.L.; Liu, J.K.; Hong, T.S. Citrus Huanglongbing detection based on image feature extraction and two-stage back propagation neural network modeling. Int. J. Agric. Biol. Eng. 2016, 9, 20–26. [Google Scholar]
- Lan, Y.; Huang, Z.; Deng, X.; Zhu, Z.; Huang, H.; Zheng, Z.; Lian, B.; Zeng, G.; Tong, Z. Comparison of machine learning methods for citrus greening detection on UAV multispectral images. Comput. Electron. Agric. 2020, 171, 105234. [Google Scholar] [CrossRef]
- Yan, J.; Zhao, Y.; Zhang, L.; Su, X.; Liu, H.; Zhang, F.; Fan, W.; He, L. Improving Faster-RCNN to Identify Prickly Pear Fruit in Natural Environment. Trans. Chin. Soc. Agric. Eng. 2019, 35, 143–150. [Google Scholar]
- Huang, X.; Liang, Z.; He, Z.; Huang, C.; Li, X. Research on the Rapid Recognition of Lotus Plants Based on YOLO v2. Mod. Agric. Sci. Technol. 2018, 13, 164–167, 169. [Google Scholar]
- Peng, H.; Huang, B.; Shao, Y.; Li, Z.; Zhang, C.; Chen, Y.; Xiong, J. General Improved SSD Model for Recognition of Fruit Picking Targets in Natural Environment. Trans. Chin. Soc. Agric. Eng. 2018, 34, 155–162. [Google Scholar]
- Deng, X.; Huang, Z.; Zheng, Z.; Lan, Y.; Dai, F. Field detection and classification of citrus Huanglongbing based on hyperspectral reflectance. Comput. Electron. Agric. 2019, 167, 105006. [Google Scholar] [CrossRef]
- Lan, Y.; Zhu, Z.; Deng, X.; Lian, B.; Huang, J.; Huang, Z.; Hu, J. Monitoring and classification of citrus Huanglongbing based on UAV hyperspectral remote sensing. Trans. Chin. Soc. Agric. Eng. (Trans. CSAE) 2019, 35, 92–100. [Google Scholar]
- Lan, Y.; Deng, X.; Zeng, G. Advances in diagnosis of crop diseases, pests and weeds by UAV remote sensing. Smart Agric. 2019, 1, 1–19, (In Chinese with English Abstract). [Google Scholar]
- Dai, F.; Qiu, Z.; Qiu, Q.; Liu, C.; Huang, G.; Huang, Y.; Deng, X. Rapid detection method for citrus yellow dragon disease based on Raman spectroscopy and autofluorescence spectroscopy. Smart Agric. 2019, 1, 77–86. [Google Scholar]
- Wang, B.; Shi, J.; Shi, S.; Zhang, W.; Ma, X.; Zhao, Y. Locating senile trees based on remote sensing data. J. Nanjing Univ. (Nat. Sci.) 2019, 55, 699–707. [Google Scholar]
- Yu, X. Debris Flow Disaster Monitoring Based on UAV Remote Sensing and GIS Technology. Henan Build. Mater. 2019, 6, 307–308. [Google Scholar]
- Deng, J.; Gu, H.; Wang, Z.; Sheng, J.; Ma, Y.; Xin, H. Estimation and Verification of Aboveground Biomass in Cotton at Main Growth Stage Based on UAV Remote Sensing. Agric. Res. Arid Area 2019, 37, 55–61, 69. [Google Scholar]
- Wang, C.; Zhao, Q.; Ma, Y.; Ren, Y. UAV remote sensing crop classification based on convolutional neural network. Trans. Chin. Soc. Agric. Mach. 2019, 50, 161–168. [Google Scholar]
- Ren, S.; He, K.; Girshick, R.; Sun, J. Faster r-cnn: Towards real-time object detection with region proposal networks. IEEE Trans. Pattern Anal. Mach. Intell. 2017, 39, 1137–1149. [Google Scholar] [CrossRef] [PubMed] [Green Version]
- Simonyan, K.; Zisserman, A. Very deep convolutional networks for large-scale image recognition. arXiv 2014, arXiv:1409.1556. [Google Scholar]
- He, K.; Zhang, X.; Ren, S.; Sun, J. Deep residual learning for image recognition. In Proceedings of the IEEE Conference on Computer Vision and Pattern Recognition, Las Vegas, NV, USA, 27–30 June 2016; pp. 770–778. [Google Scholar]
- Han, Q.; Zhang, W. A preliminary study on identification technology of pine wood nematode. Henan For. Sci. Technol. 2019, 39, 32, 54. [Google Scholar]
- Huang, F.; Lei, M.; Zhang, L.; Liu, X. Pinus massoniana pine wood nematode surveillance method based on random forest and decision tree. Inf. Commun. 2019, 12, 32–36. [Google Scholar]
- Xu, X.; Tao, H.; Li, C.; Cheng, C.; Guo, H.; Zhou, J. Identification and location of pine wilt disease-affected wood based on Faster R-CNN and UAV remote sensing. J. Agric. Mach. 2020, 1–20. [Google Scholar]
Figure 1.
The symptoms of pine wood nematode dead tree.
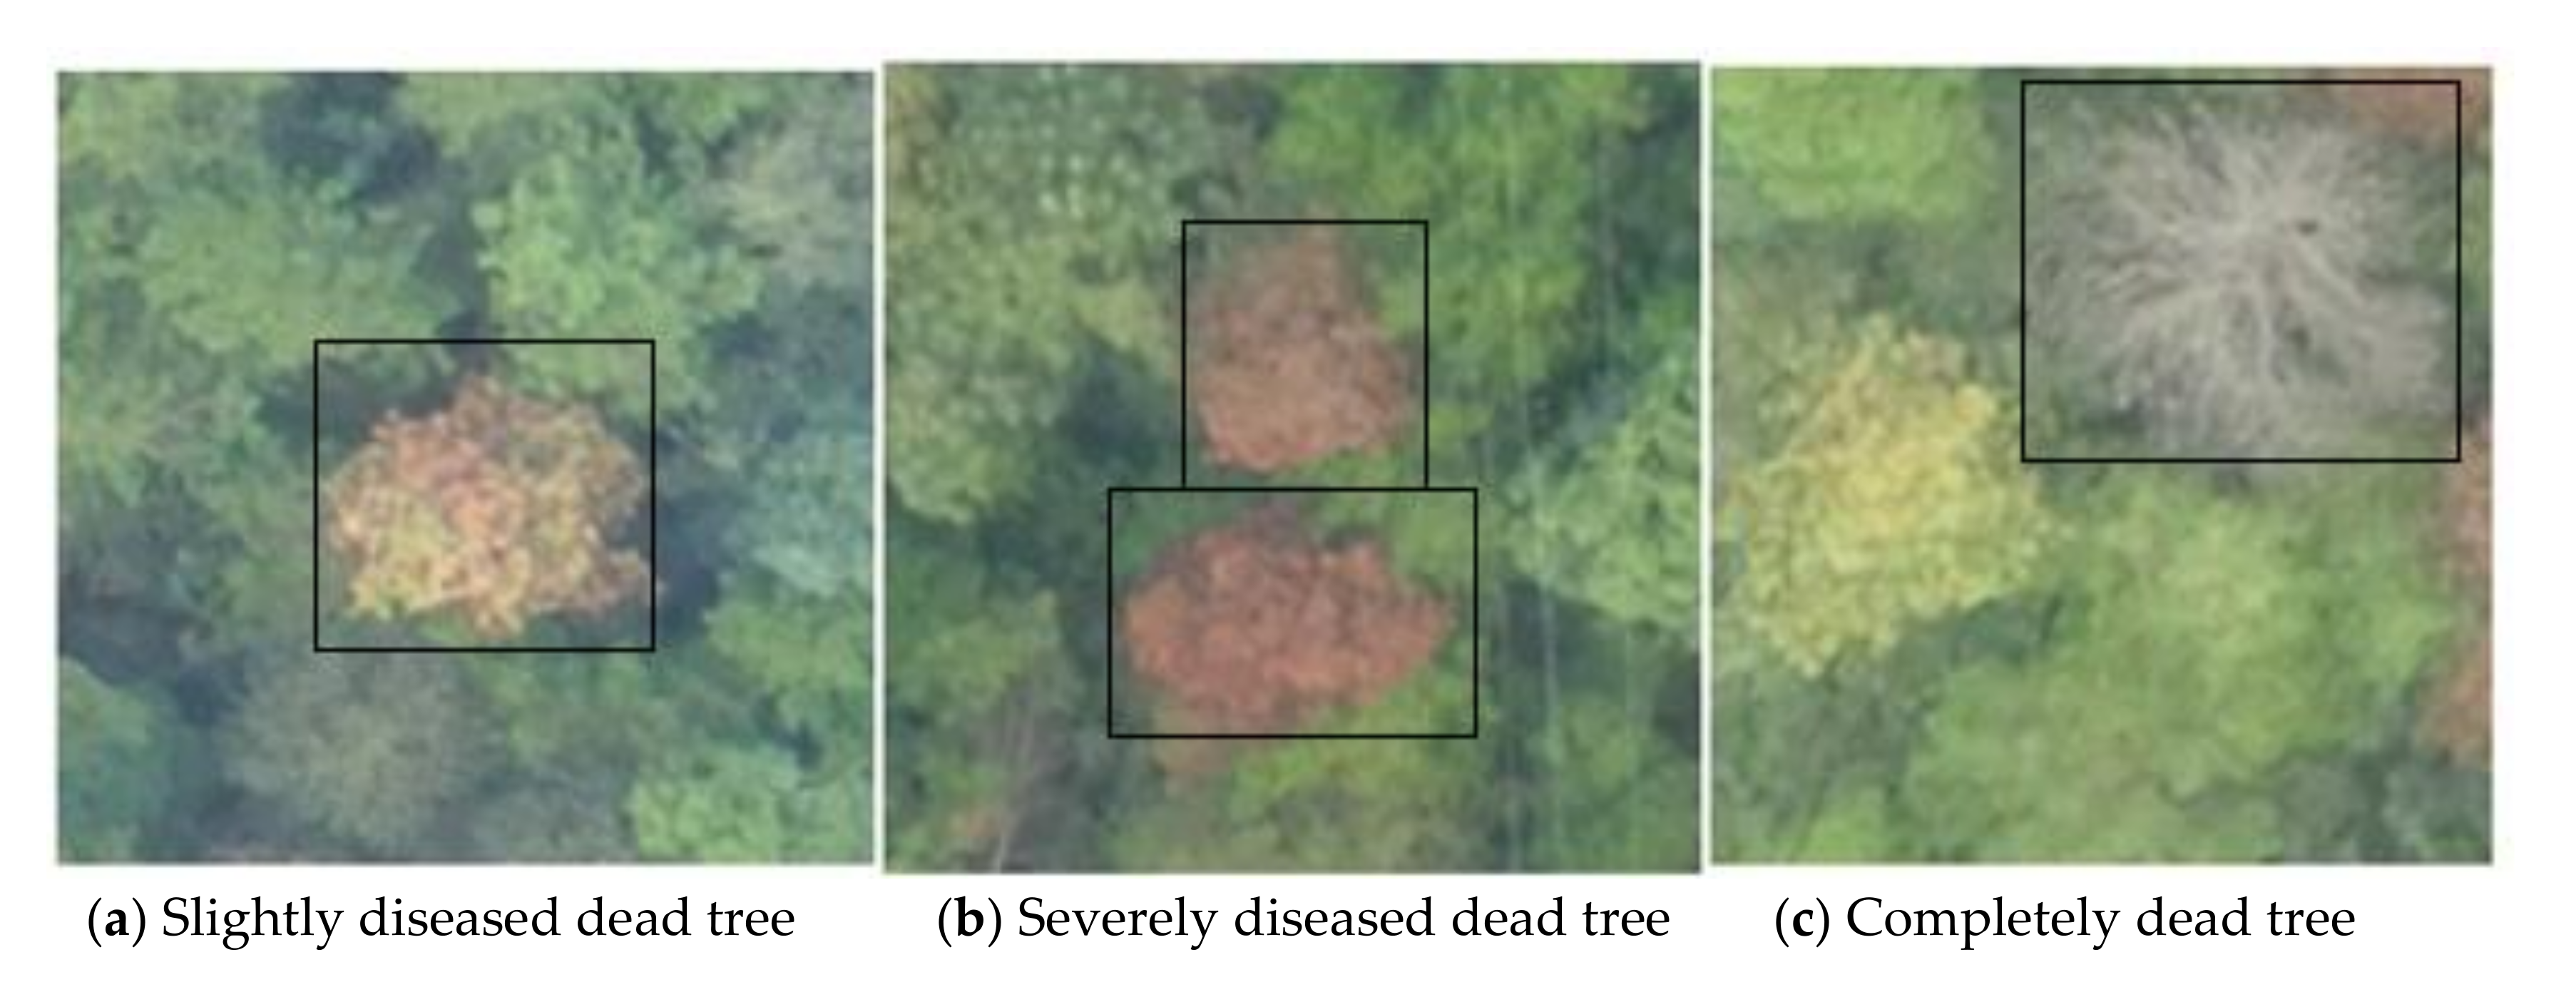
Figure 2.
The overall technical route of improvement.

Figure 3.
Sigmoid function curve.

Figure 4.
Nine kinds of anchor improved for small target detection in the Unmanned Aerial Vehicle (UAV) remote sensing image.
Figure 4.
Nine kinds of anchor improved for small target detection in the Unmanned Aerial Vehicle (UAV) remote sensing image.

Figure 5.
Basic network structure of the ResNet101 convolutional neural network.

Figure 6.
The improved overall network structure.

Figure 7.
Precision–recall curve of models in different improvement conditions.

Figure 8.
The detection effect of the final model, the output result of geographic information and the generated geographic information text.
Figure 8.
The detection effect of the final model, the output result of geographic information and the generated geographic information text.


Table 1.
Comparison of model effect in different improvement conditions.
| Network Used | Improve the Loss Function | Data Augmentation | Improve RPN Network | Accuracy of Model | Detection Speed |
|---|---|---|---|---|---|
| VGG16 | No | No | No | 66.2% | 0.649 s |
| ResNet101 | No | No | No | 70.8% | 1.129 s |
| ResNet101 | Yes | No | No | 72.5% | 1.079 s |
| ResNet101 | Yes | Yes | No | 80.2% | 1.122 s |
| ResNet101 | Yes | Yes | Yes | 89.1% | 1.064 s |
© 2020 by the authors. Licensee MDPI, Basel, Switzerland. This article is an open access article distributed under the terms and conditions of the Creative Commons Attribution (CC BY) license (http://creativecommons.org/licenses/by/4.0/).
Share and Cite
MDPI and ACS Style
Deng, X.; Tong, Z.; Lan, Y.; Huang, Z. Detection and Location of Dead Trees with Pine Wilt Disease Based on Deep Learning and UAV Remote Sensing. AgriEngineering 2020, 2, 294-307. https://doi.org/10.3390/agriengineering2020019
AMA Style
Deng X, Tong Z, Lan Y, Huang Z. Detection and Location of Dead Trees with Pine Wilt Disease Based on Deep Learning and UAV Remote Sensing. AgriEngineering. 2020; 2(2):294-307. https://doi.org/10.3390/agriengineering2020019
Chicago/Turabian StyleDeng, Xiaoling, Zejing Tong, Yubin Lan, and Zixiao Huang. 2020. "Detection and Location of Dead Trees with Pine Wilt Disease Based on Deep Learning and UAV Remote Sensing" AgriEngineering 2, no. 2: 294-307. https://doi.org/10.3390/agriengineering2020019