Article

Groundwater Aquifer Suitability for Irrigation Purposes Using Multi-Criteria Decision Approach in Salah Al-Din Governorate/Iraq

1
Civil Engineering Department, University of Technology, Baghdad 10066, Iraq
2
Directorate of Space and Communication, Ministry of Science and Technology, Baghdad 10070, Iraq
*
Author to whom correspondence should be addressed.
AgriEngineering 2019, 1(2), 303-323; https://doi.org/10.3390/agriengineering1020023
Submission received: 22 April 2019 / Revised: 25 May 2019 / Accepted: 3 June 2019 / Published: 7 June 2019

Abstract

:
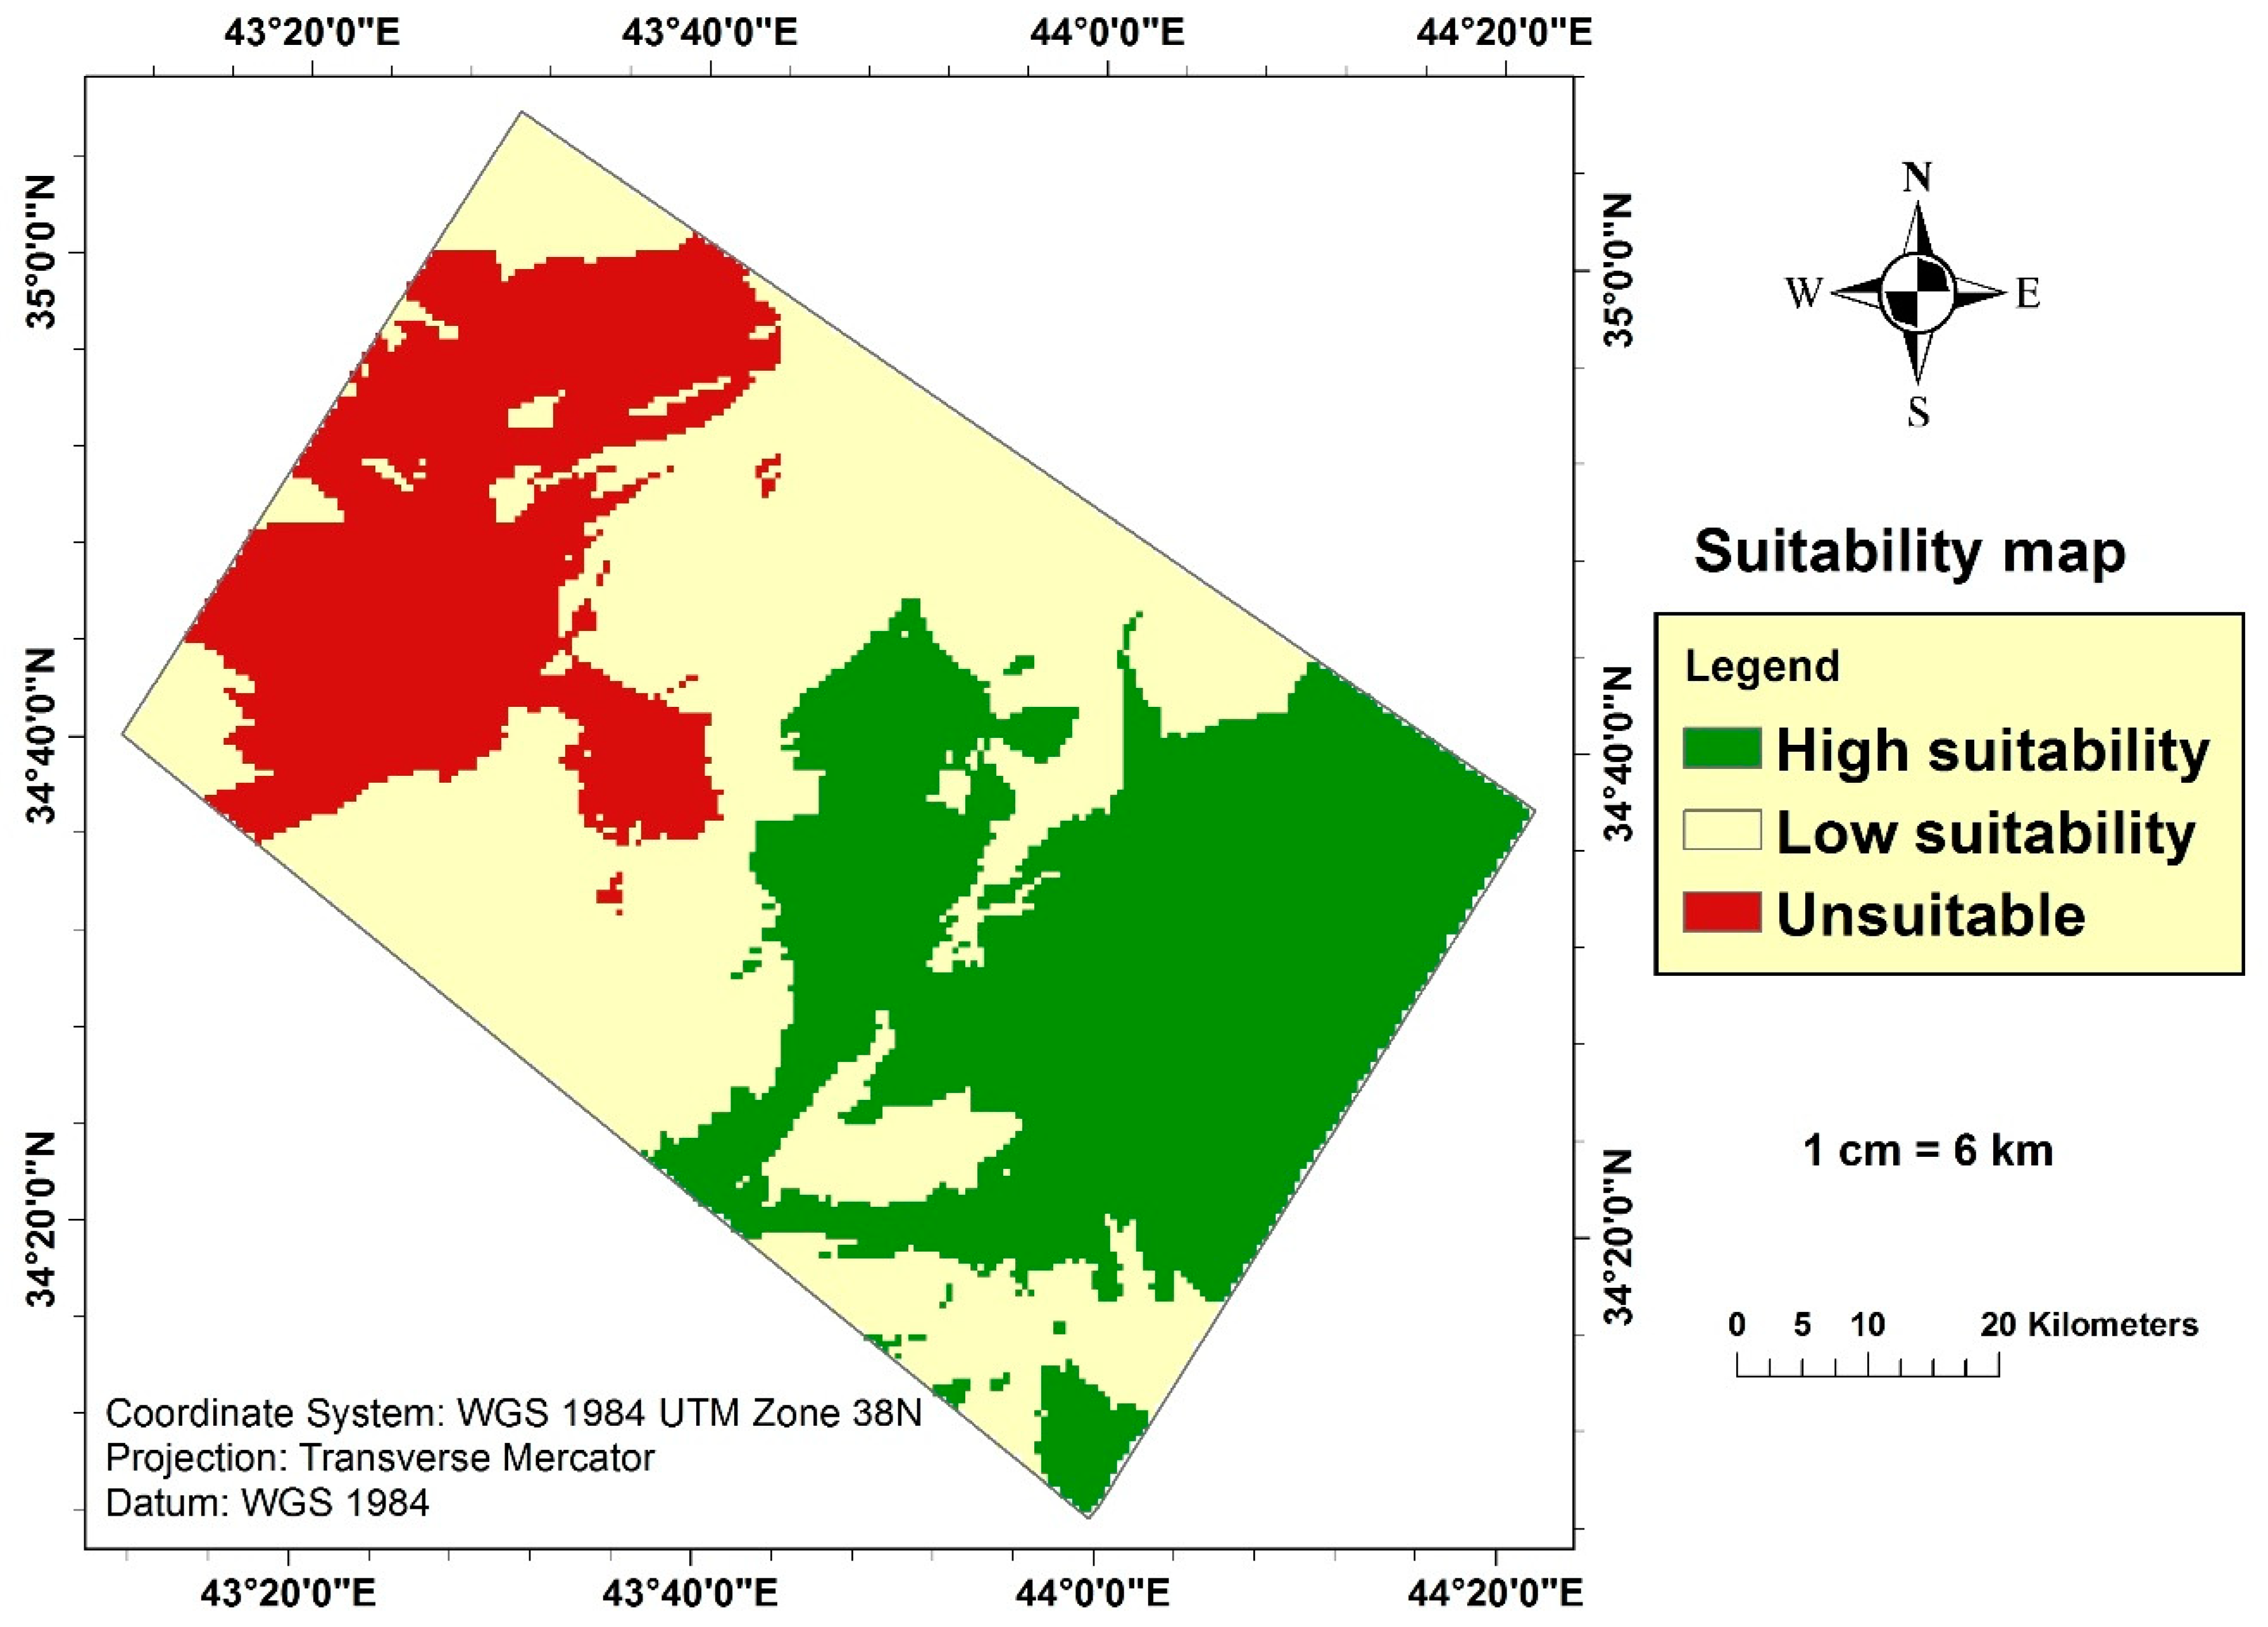
In this study, GIS-based Multi-Criteria Decision Approach (MCDA) is used to identify suitable locations to use groundwater for irrigation purposes in Salah-Al-Din Governorate, 180 km to the North of Baghdad, capital of Iraq republic. Various criteria are adopted including Electrical Conductivity (EC), Power of Hydrogen (pH), Sodium percentage (Na%), Sodium Adsorption Ratio (SAR), Magnesium Adsorption Ratio (MAR), Kelly’s Ratio (KR), climate factor, aquifer thickness, and aquifer elevation. Three datasets are integrated to produce the suitability model, including geophysical data, groundwater wells data and satellite-based climate data. The criteria layers are assessed using the multi-criteria decision approach by combining them together using the weighted overlay function in ArcGIS 10.5. Appropriate weights assigned and integrated into GIS to create the groundwater suitability map for irrigation. Finally, the suitability of the study area for irrigation purposes with its percent to the total area is classified into three classes according to the set criteria used for this purpose: high suitability (35.41%), low suitability (44.22%), and unsuitable/excluded (20.37%).

1. Introduction

Agriculture is one of the significant sources of livelihood for Iraqi people as one-third of the population resides in rural areas and their livelihoods depend upon it [1]. The challenge of implementing prosperous agriculture in the current time requires an integrated and systemic approach that should address sustainable use and management of natural resources, especially water, to ensure food security and agricultural livelihoods. However, many hindrances are facing this intention in Iraq, including deteriorated infrastructure, poor operation and maintenance of the systems, weak governmental support and lack of regulatory national plans [2].
Water is a crucial need for humans in many aspects of living including irrigation of agricultural crops; however, there is a gradual decrease in the water resources of the world, especially in the arid and semi-arid areas, with a confronting increase in requirement due to the rapid growth of the world’s population and industrial/agricultural advancement. This universal water crisis is evident in Iraq in the form of degradation of the Euphrates and Tigris rivers that has been evolving practically over the last four decades. In 1975, Turkey started the works in Güneydoğu Anadolu Projesi (GAP), which is a 22 dam project on the Tigris and Euphrates headwaters in Turkey intended for use in irrigation and hydroelectricity. On the other side, Iran in 2017 completed Daryan dam on Sirwan River (Diyala River in Iraq), and in 2018 Sardasht dam on the Little Zab river. This, in addition to other factors, leads to the logical expectation of declination of the Euphrates and Tigris output by 2025 to 50% and 25% respectively [3]. This problem coincides with a significant rise in Iraq’s population, increasing water demand, inadequate infrastructure to maintain quality of life and lack of scientific planning for water resources management. Another serious factor in this regard is that the Middle East region (including Iraq) is one of the most vulnerable world regions to the potential impact of climate change (less precipitation, higher transpiration, sea level rise, and drought). According to these facts, the peak water supply in Iraq does not meet the needs, and this problem gets worse with time as the increasing population, the climate change, and unpredictable weather increase water demands largely. The consequences are many, which include a negative impact on agriculture, industry, tourism, and energy sectors resulting in increasing unemployment rates, poverty, food insecurity, and malnutrition.
In recent times, there has been a worldwide conviction that groundwater is one of the most important natural water supply resources. When compared with surface water, it has a number of fundamental advantages: it is of higher quality, better protected from possible pollution, less subjected to seasonal and perennial fluctuations, and much more uniformly spread over large regions than surface water. Additionally, groundwater could be available in places where the surface water is scarce. The importance of groundwater as one of the substantial natural resources is accentuated in countries with arid and semiarid climates, where it is widely used for irrigation as in the countries of the Arab region with desert climate [4], these countries started to focus on groundwater resources due to water scarcity and pollution problems [5]. In the times of water scarcity, groundwater is an excellent, renewable, qualitative and quantitative source of water supply, the timing of aquifer recharge is usually related indirectly to the precipitation timing, making groundwater a reliable source of supply during droughts and scarcity of surface water. It could be extracted at rates greater than recharge rates and could be managed wisely to recover following the drought crisis.
Site selection of a water supply borehole must follow a planned manner to be productive and cost-effective. Properly sited boreholes are usually productive, have a long lifespan and are cost-effective. On the other hand, random drilling can result in an unproductive or low production well with consequent economic loss. Accordingly, an ideal plan of drilling is essential for proper and effective investment of groundwater. This can be achieved by establishing criteria that determine the quality and quantity of groundwater to study the suitability of the aquifer. In this context, geophysical surveys are used to detect the depth and thickness of aquifers, and climate data can be used to estimate groundwater recharge. Water quality can be determined by groundwater wells data. These criteria can be combined using Multi-Criteria Decision Approach (MCDA) to determine the appropriate location for groundwater use.
The geophysical techniques are a noninvasive, cost-effective, highly relevant method that has gained widespread acceptance in groundwater exploration all over the world [6]. The surface electrical resistivity sounding is one of the important geophysical methods in the investigation and determination of aquifers parameters, providing preliminary information and suggesting the most suitable area for drilling wells with a relatively low cost. While the vertical electrical sounding (VES) technique provides detailed information about the thickness and hydroelectrical parameters of the aquifers in any studied area [7].
Geographic information system (GIS) technique is highly relevant in this regard because it offers the capability to efficiently manage and integrate large volumes of spatial and temporal data, in addition to its prediction and validation in solving spatial decision problems [8]. MCDA is an approach for decision analysis that combines both qualitative and quantitative information by decomposing their problems into systematic orders depending on a number of criteria [9], it is a useful tool to explore and solve complicated problems. MCDA, given a common output of different alternatives with respect to different perspectives and priorities, can evaluate these alternatives depending on the theory of decision science [10]. Several studies have used the MCDA approach to assess the spatial distribution of the environmental problems [11,12,13,14], while others have combined the MCDA with cost-benefit analysis [15]. Additionally, various studies used MCDA in site selection as a decision making tool with good results [16,17,18,19,20]. The applied MCDA efficiency is greatly enhanced by employing GIS technique taking advantage of it in spatial analysis efficacy. Therefore, GIS-based MCDA technique that efficiently combines multiple hydrological data to produce a reliable decision model is an effective tool to enhance the suitability analysis in an area of interest. Several researchers have used remote sensing and GIS-based MCDA in groundwater studies with effective results [21,22,23,24,25].
This study aims to collect and analyze the available VES data, groundwater wells data and satellite-based climate data, to set the criteria that define the groundwater quality and quantity, and to integrate these parameters into the MCDA to identify the suitable groundwater location to use for irrigation purposes in Salah Al-Din Governorate/Iraq. The significance of this study lies in its relation to several fields such as water management, agricultural productivity, sustainable environment, and human livelihoods. It seeks to manage production and enhance the planning of agricultural production by identifying suitable sites to use water for irrigation purposes. It is expected that this will assist in water resource management and planning and proposed to be helpful in setting regions into single planning and management units aiming for economic integration.

2. Materials and Methods

2.1. Study Area

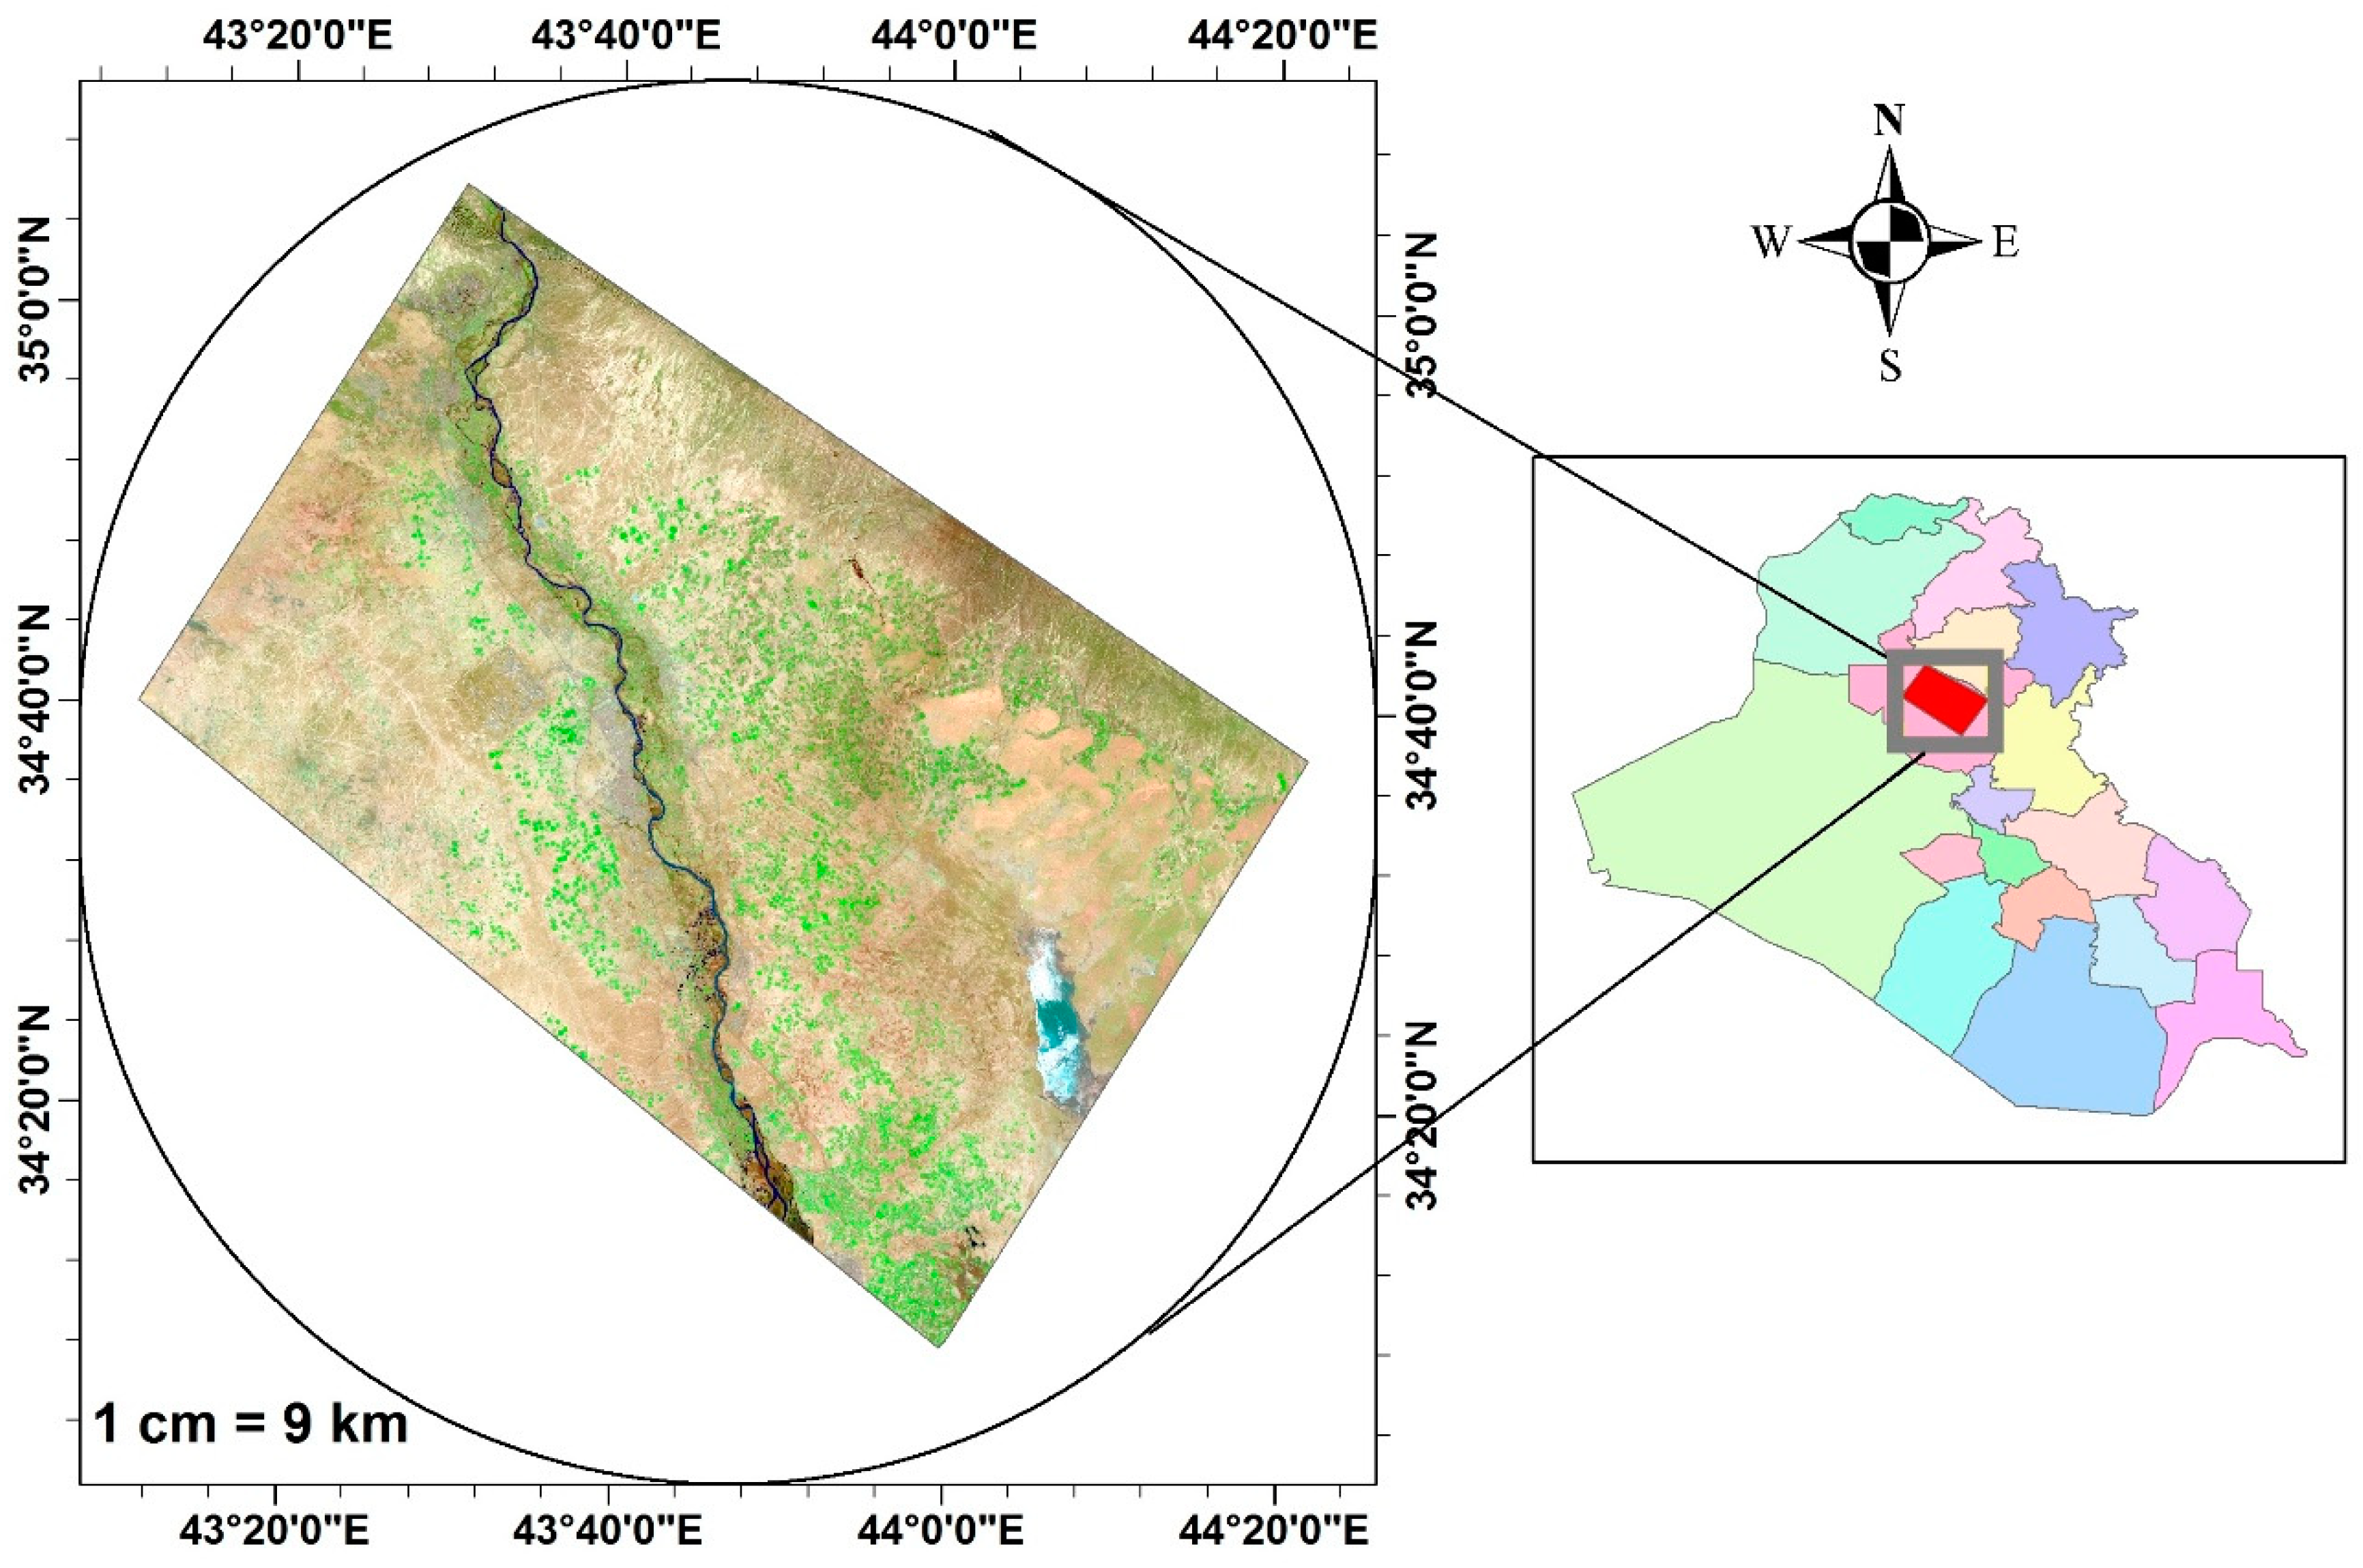
The study area is located in Salah Al-Din Governorate, about 180 km to the North of Baghdad, the capital of Iraq republic, between longitudes (43°00′–45°05′ E) and latitudes (34°00′–36°50′ N) (Figure 1). Topographically, it is a semi-flat area with the presence of some elevated local features represented by the deposits of river terraces and several depressions [7]. Geologically, most of the area is covered by Quaternary deposits (Pleistocene) including the alternation of sediments such as clay, sand, and gravel which belong to recent sediments, with an underlying Pre-quaternary (Tertiary) deposit represented by Mukdadiyah Formation (Pliocene), which consists of the alternation of sandstone, siltstone and claystone, and Injana Formation (U. Miocene). This consists of a sequence of silty, sandy, gravel and mud; all of these formations are suitable for groundwater storage. Tectonically, the area lies in the Stable and Unstable Shelf geotectonic units within the Mesopotamian zone, Ammara–Tikrit secondary subzone [26]. The study area is an important economic area, where the population depends economically on agriculture, especially crops of grain production, such as wheat, barley, and corn. Farmers depend on rainwater and groundwater as a source of irrigation to plant some summer and winter vegetables. Additionally, the areas of the two banks of the Tigris and the Al-Udheim rivers depend also on the water of these rivers for agriculture.

2.2. Dataset

2.2.1. Vertical Electrical Sounding (VES)

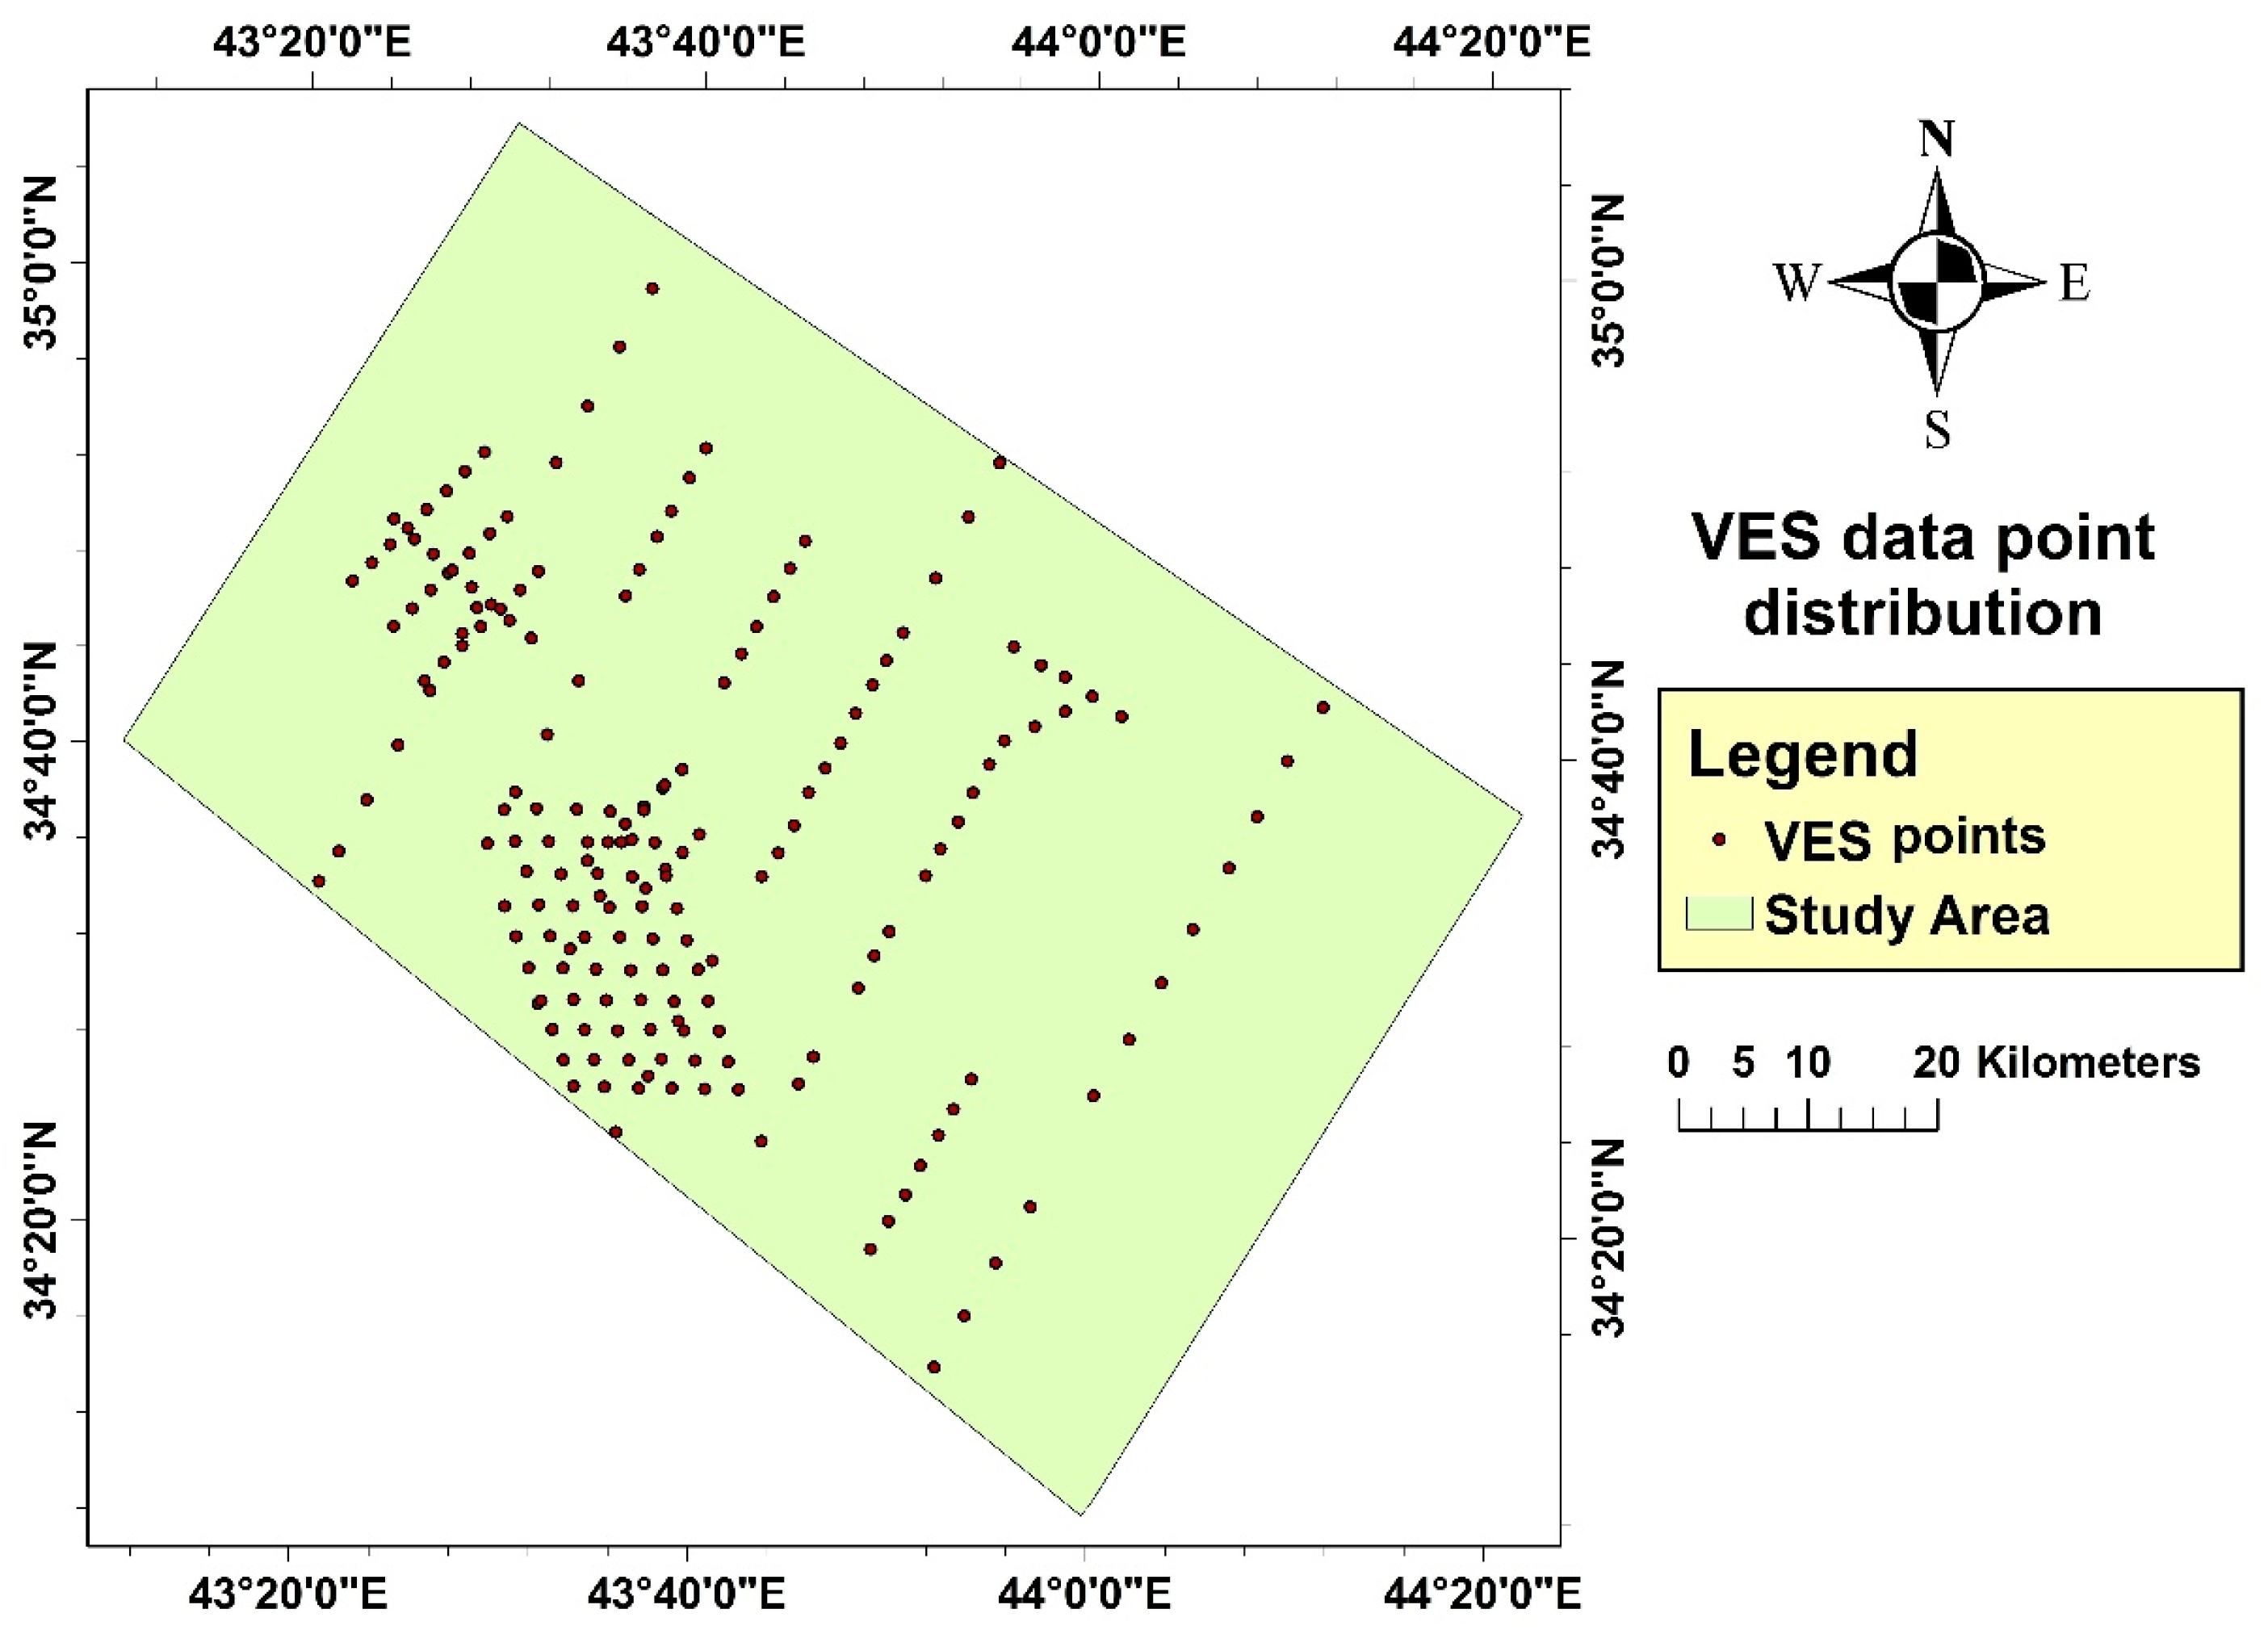
Geophysical methods are considered the most important techniques in groundwater and other hydrogeological explorations. This research includes collecting and analyzing vertical electrical sounding data provided by previous studies that were conducted in the study area [27,28,29,30]. The total number of VES data are 185 data point; Figure 2 shows the VES point distribution.
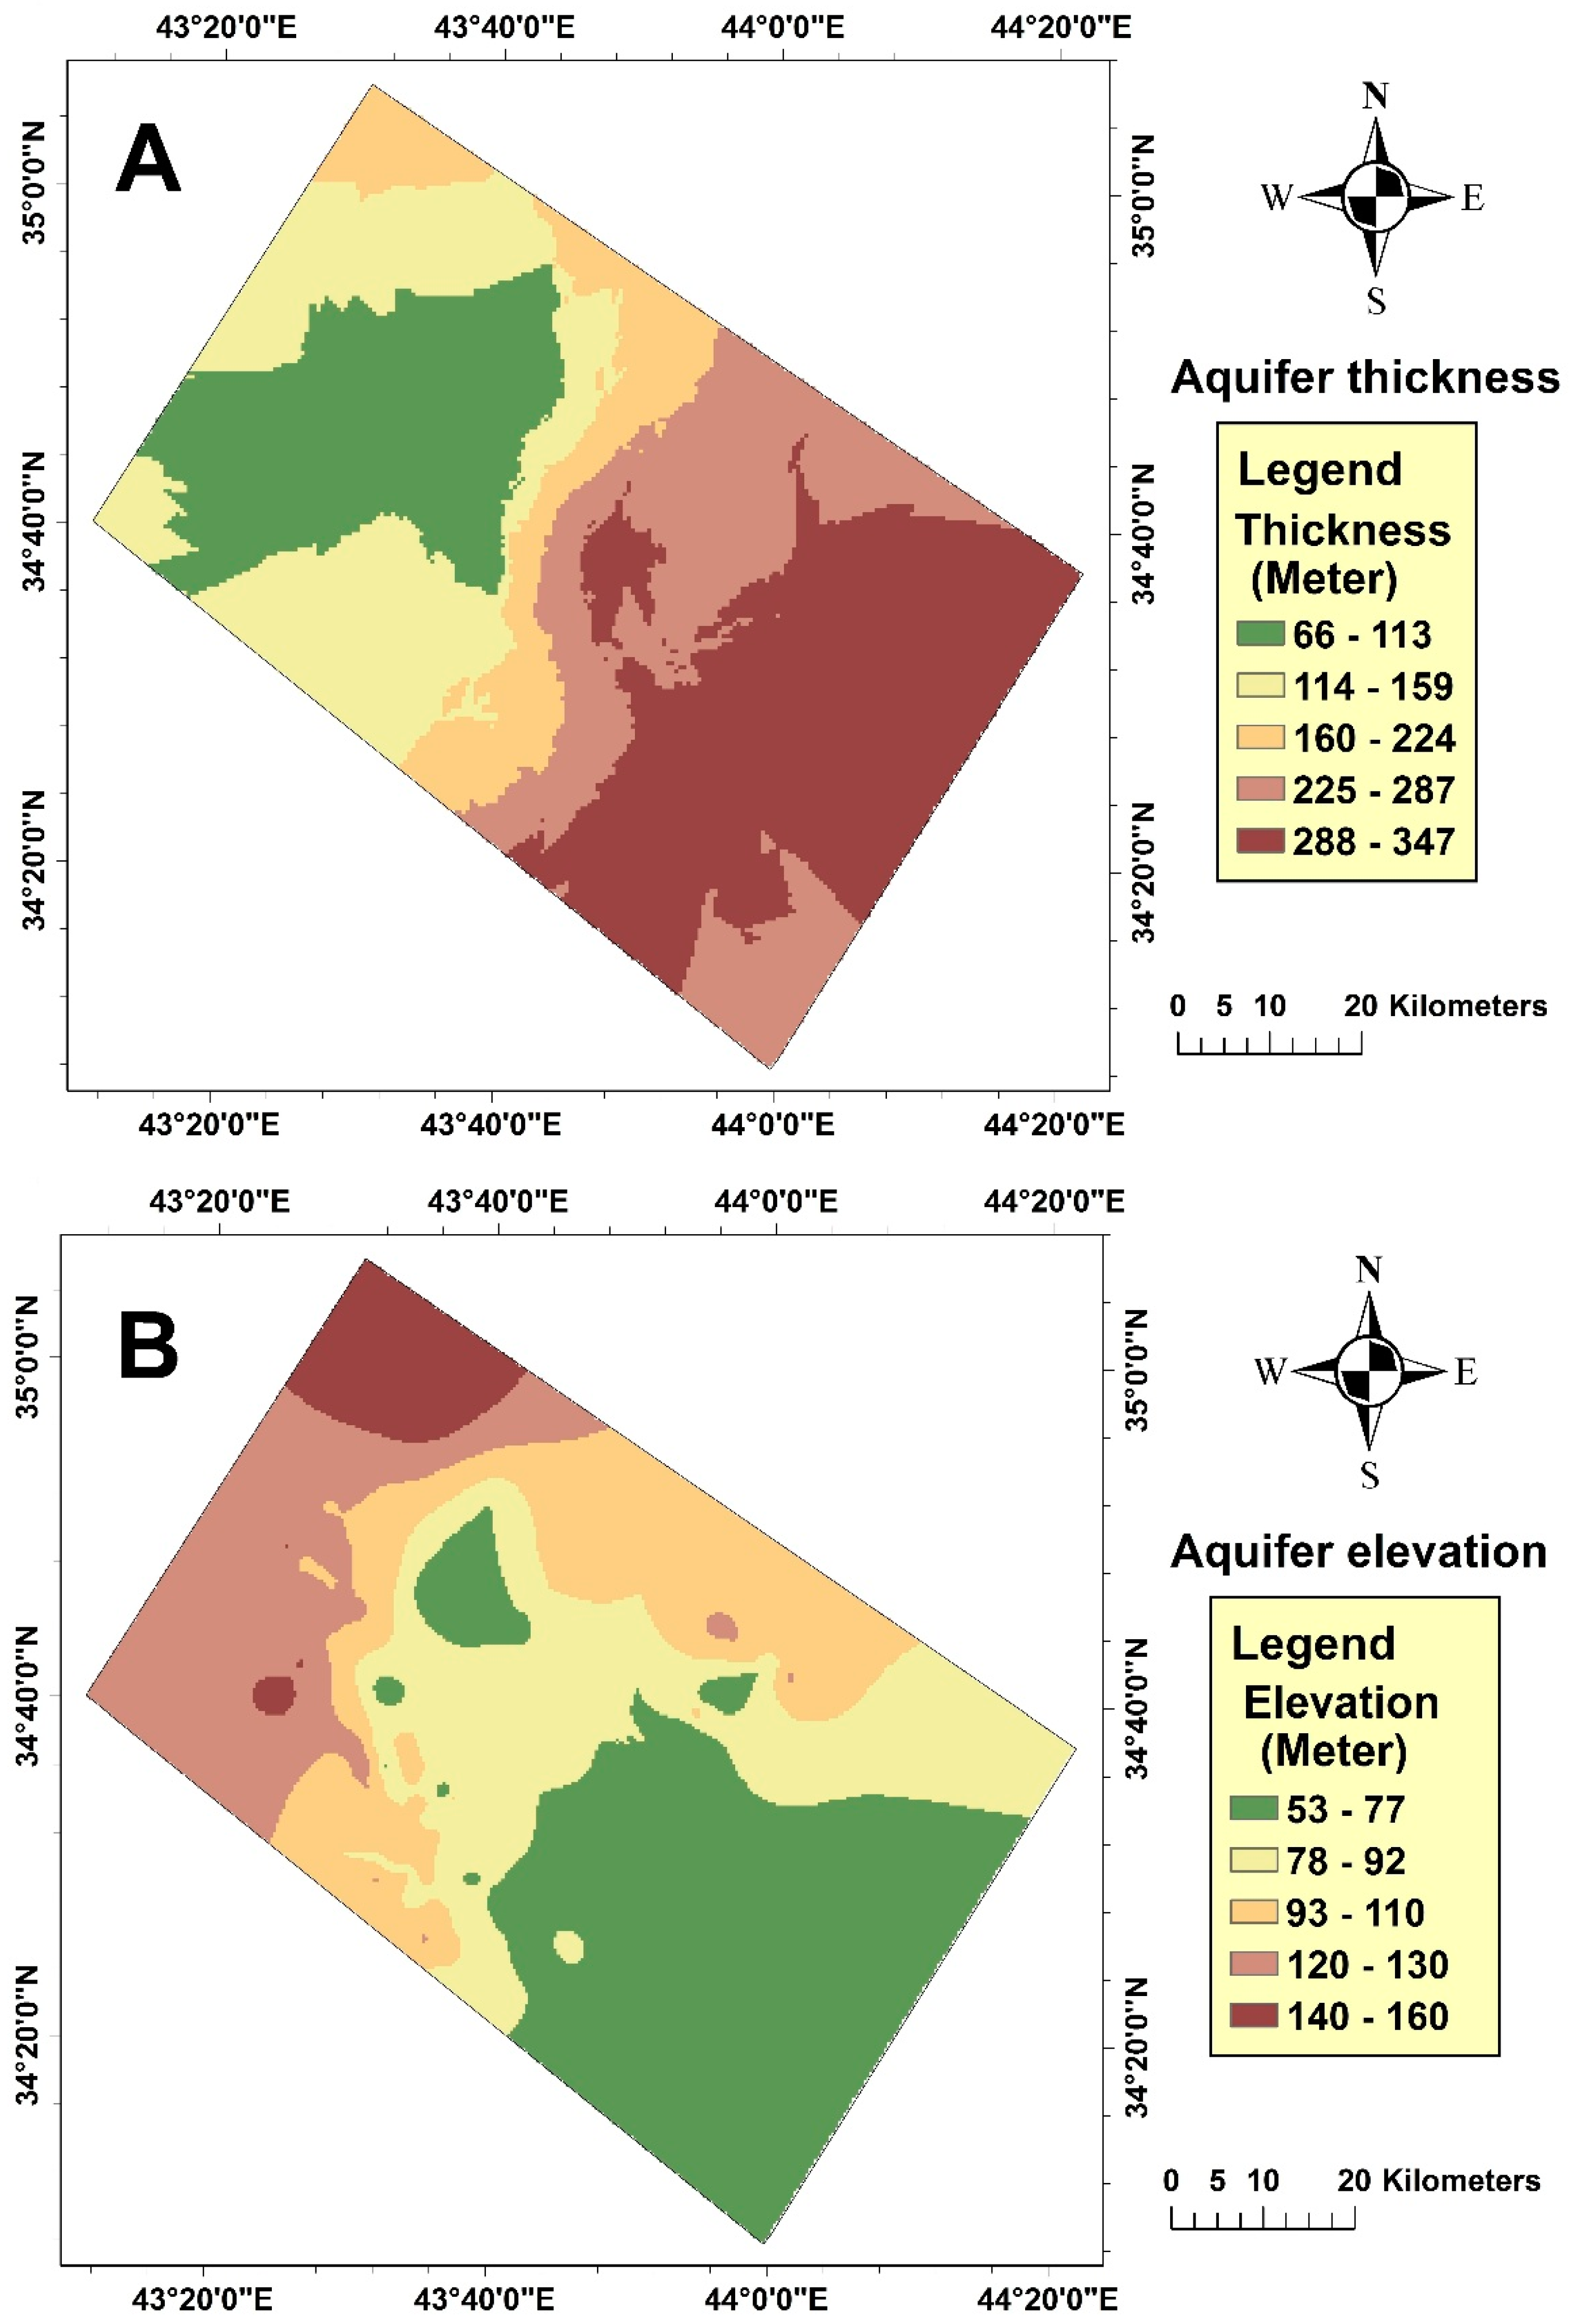
The data contain the aquifer thickness and elevation in excel sheet form and paper maps. These data were geo-referenced, digitized, converted to shapefile and projected to WGS 84/UTM zone 38N. After the pre-processing steps, the aquifer thickness was interpolated using the Ordinary Kriging method, while the aquifer water level was interpolated using the Topo-to-Raster method. Figure 3 shows the aquifer thickness and aquifer elevation.

2.2.2. Climate Data

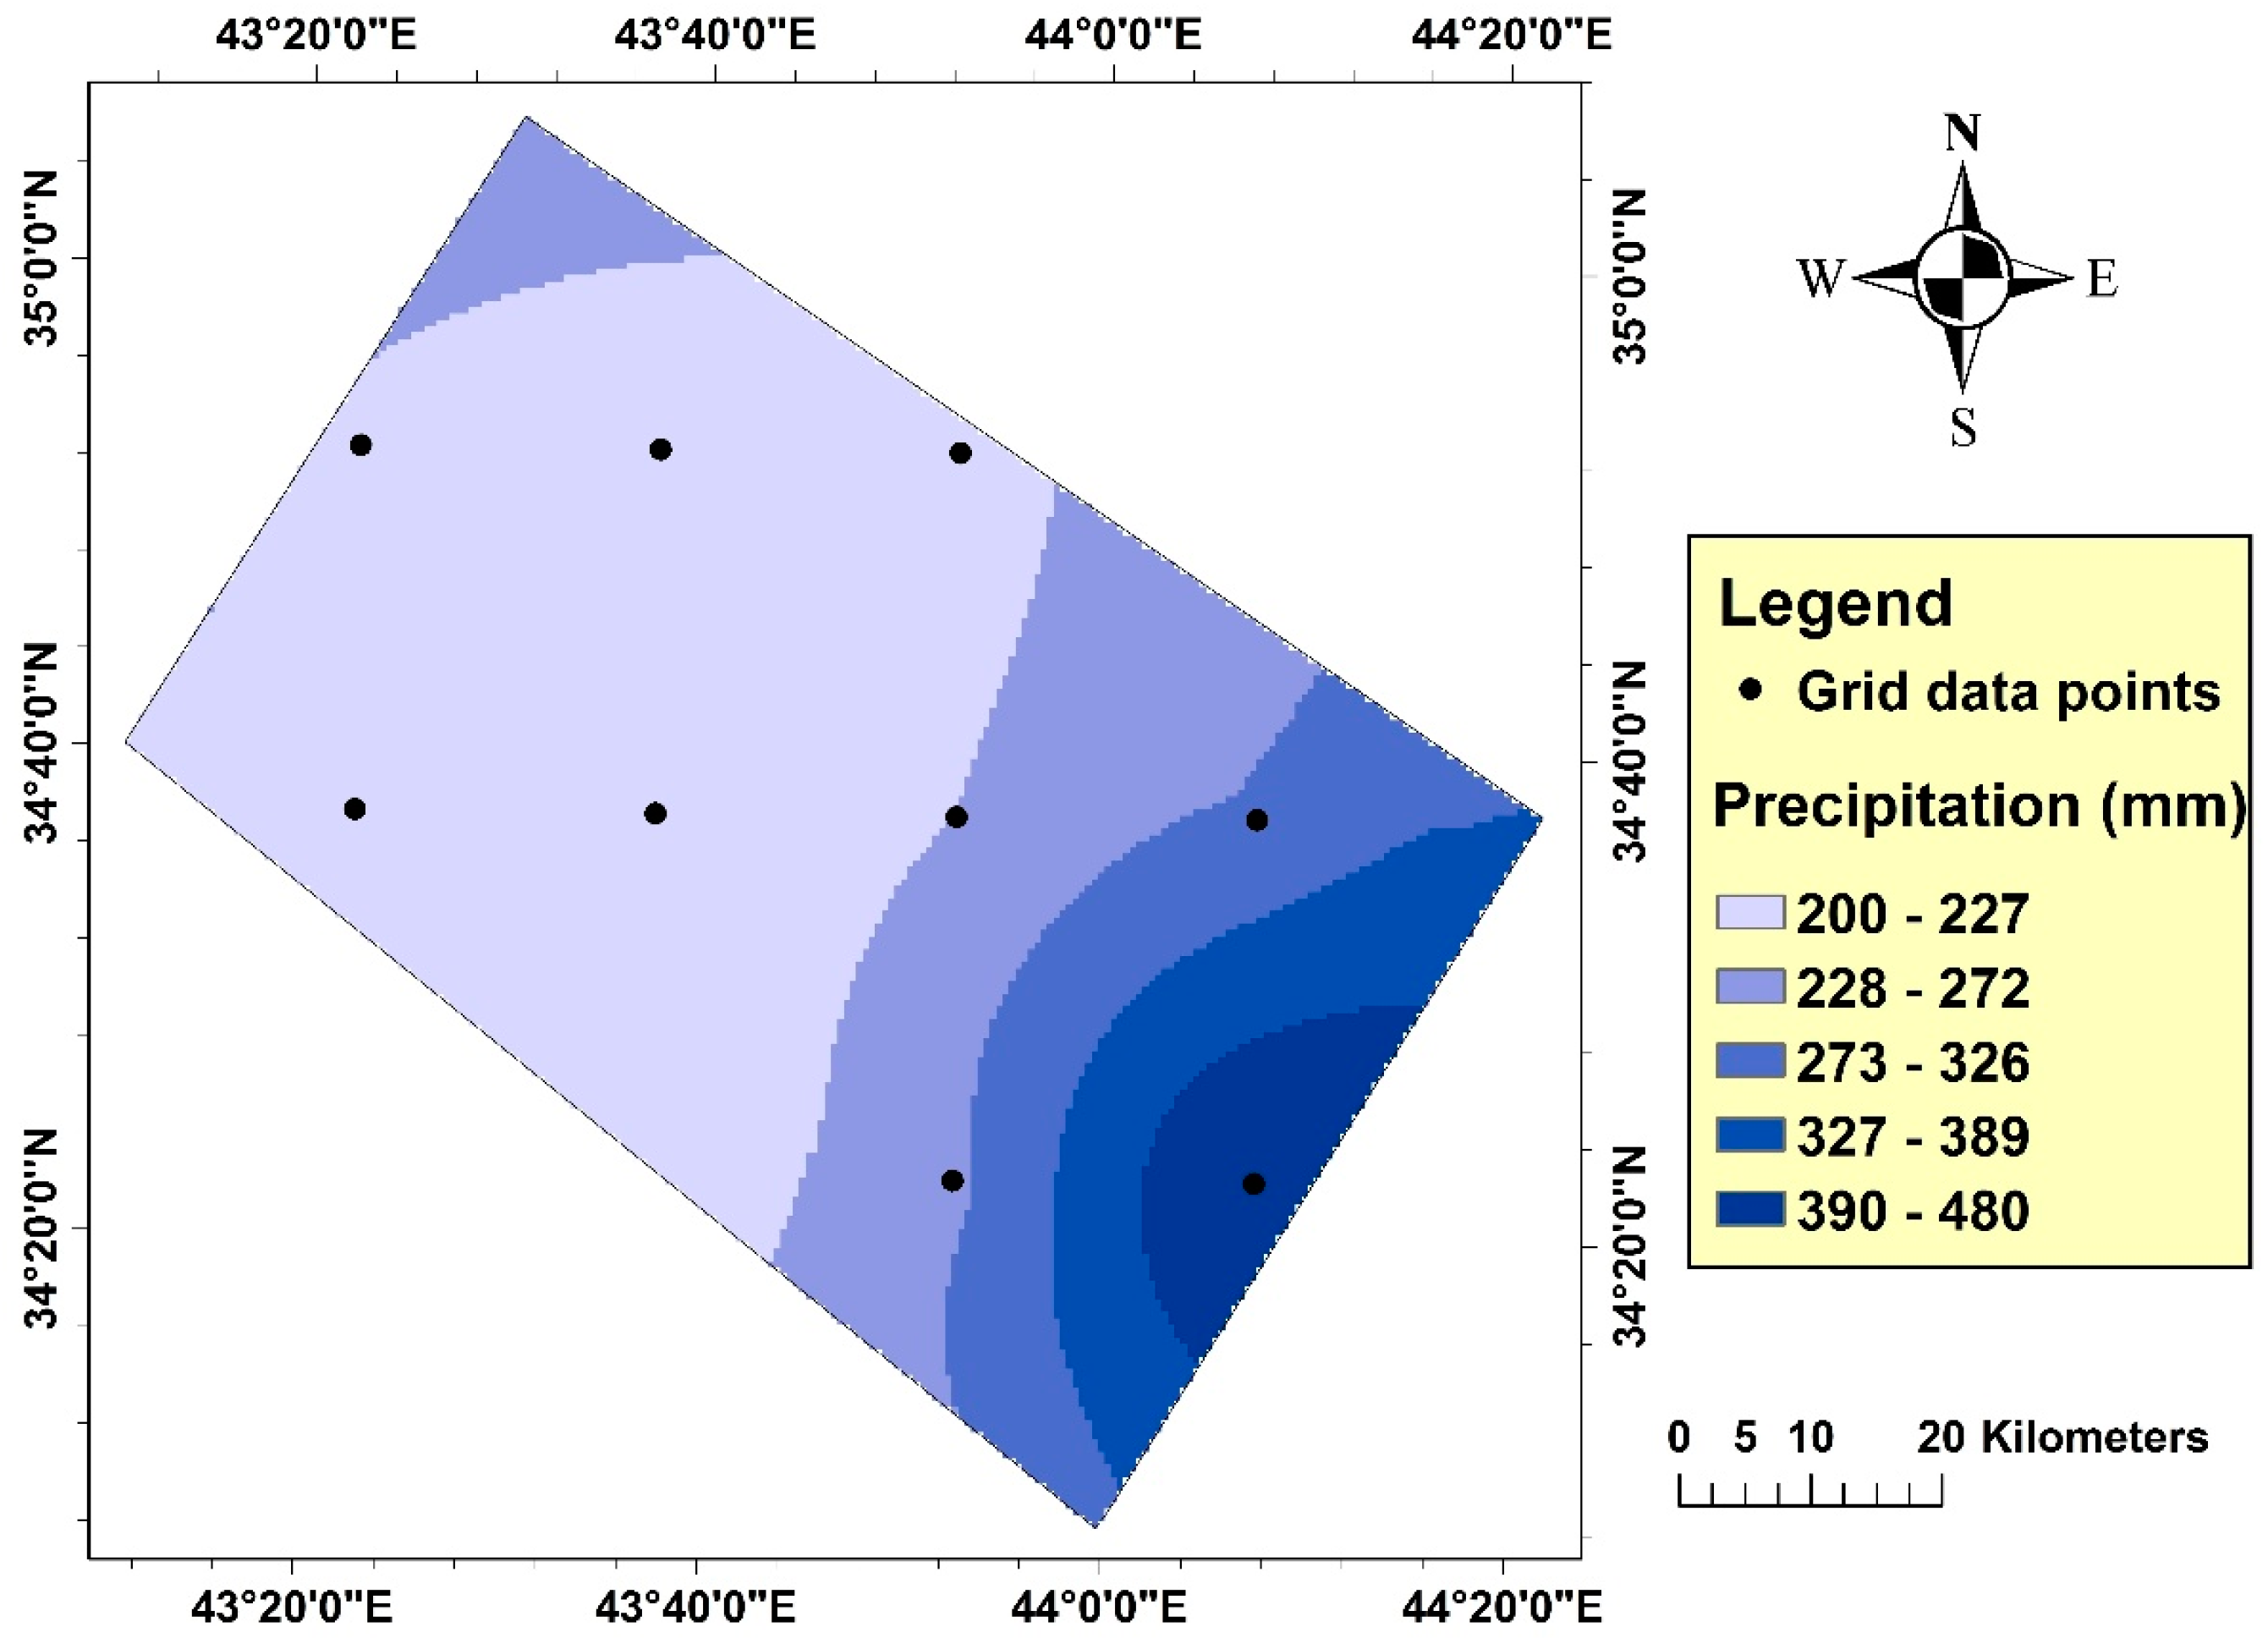
Remote sensing rainfall estimation based on satellite-derived data from the Tropical Rainfall Measuring Mission (TRMM) is a possible way of supplementing rain gauge data, with a good spatial cover [31,32]. Climate data for the period 2000–2017 based on satellite data were downloaded and processed with spatial resolution 0.25 deg. The data interpolated using the Ordinary Kriging method. The total annual precipitation ranged between 200–480 mm. Figure 4 presents the total annual precipitation based on TRMM_3B43 v7 satellite data per mm over December 1999–October 2017.
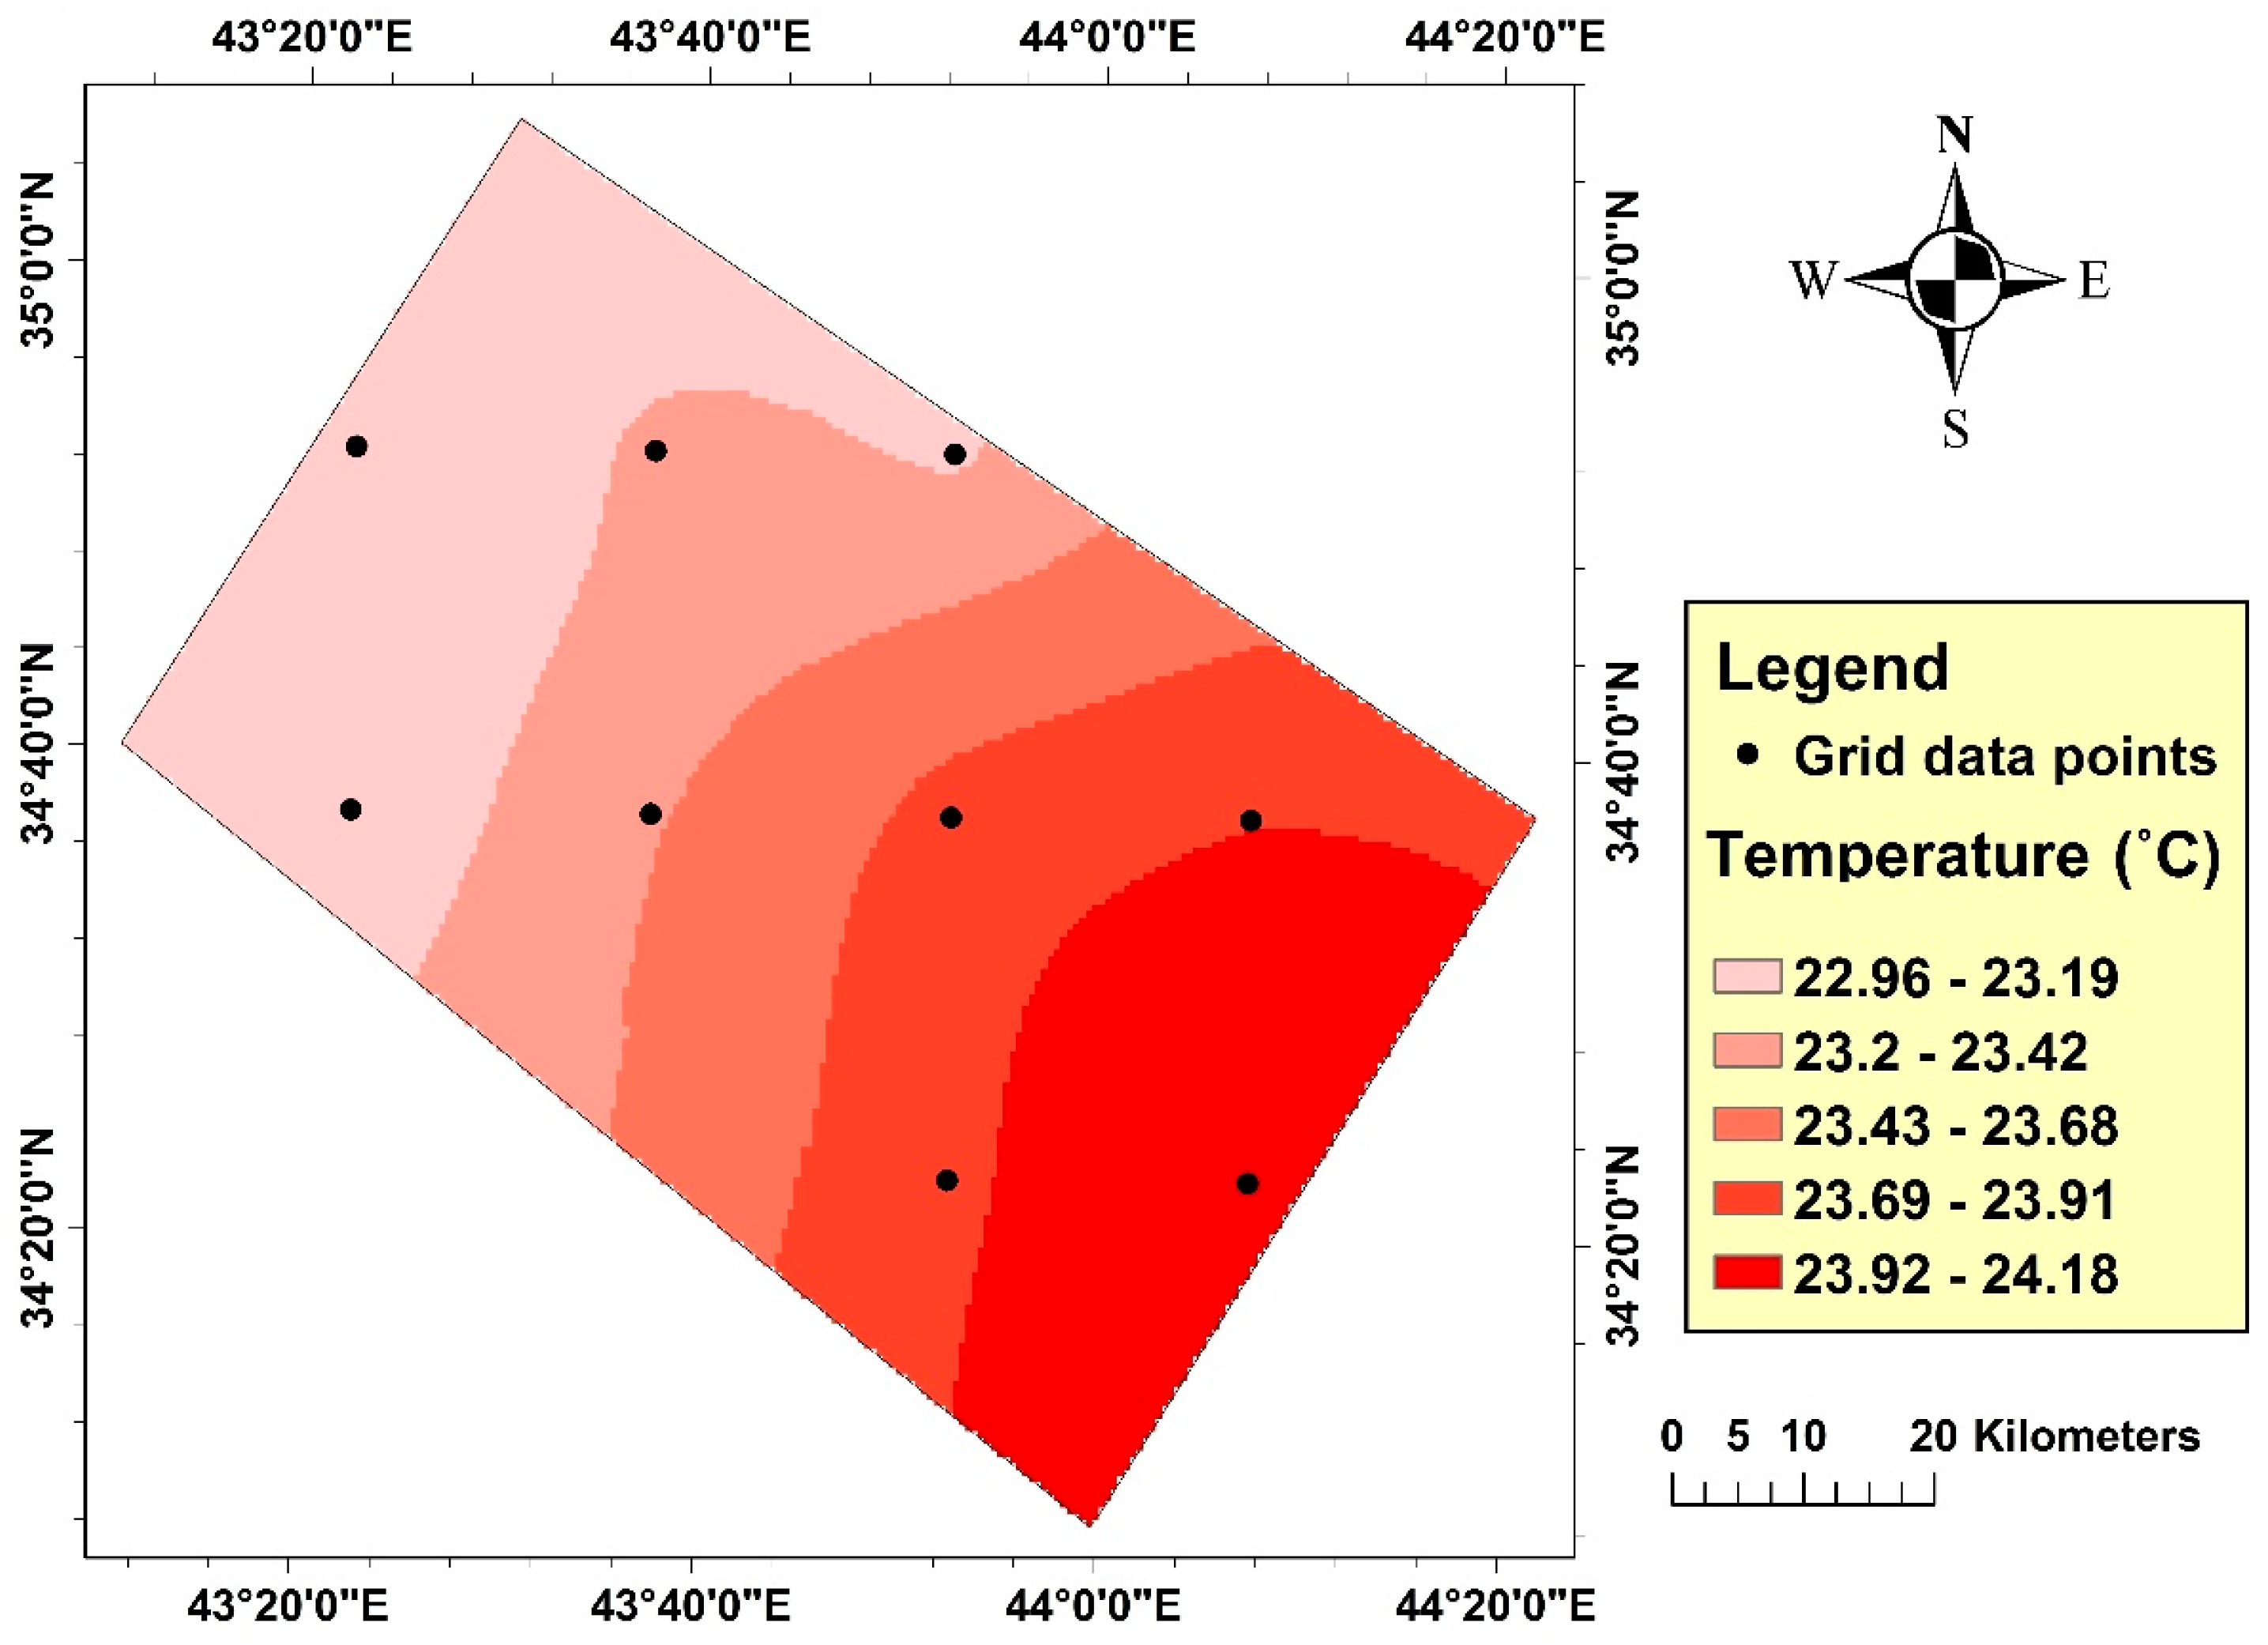
Figure 5 presents the average annual air temperature based on satellite data during the period 2000–2017, which were downloaded from GLDAS Model (NOAH025_M v2.1). The data, originally in the Kelvin unit (°K), were converted to Celsius (°C) and interpolated using the Ordinary Kriging method.

2.2.3. Groundwater Wells Data

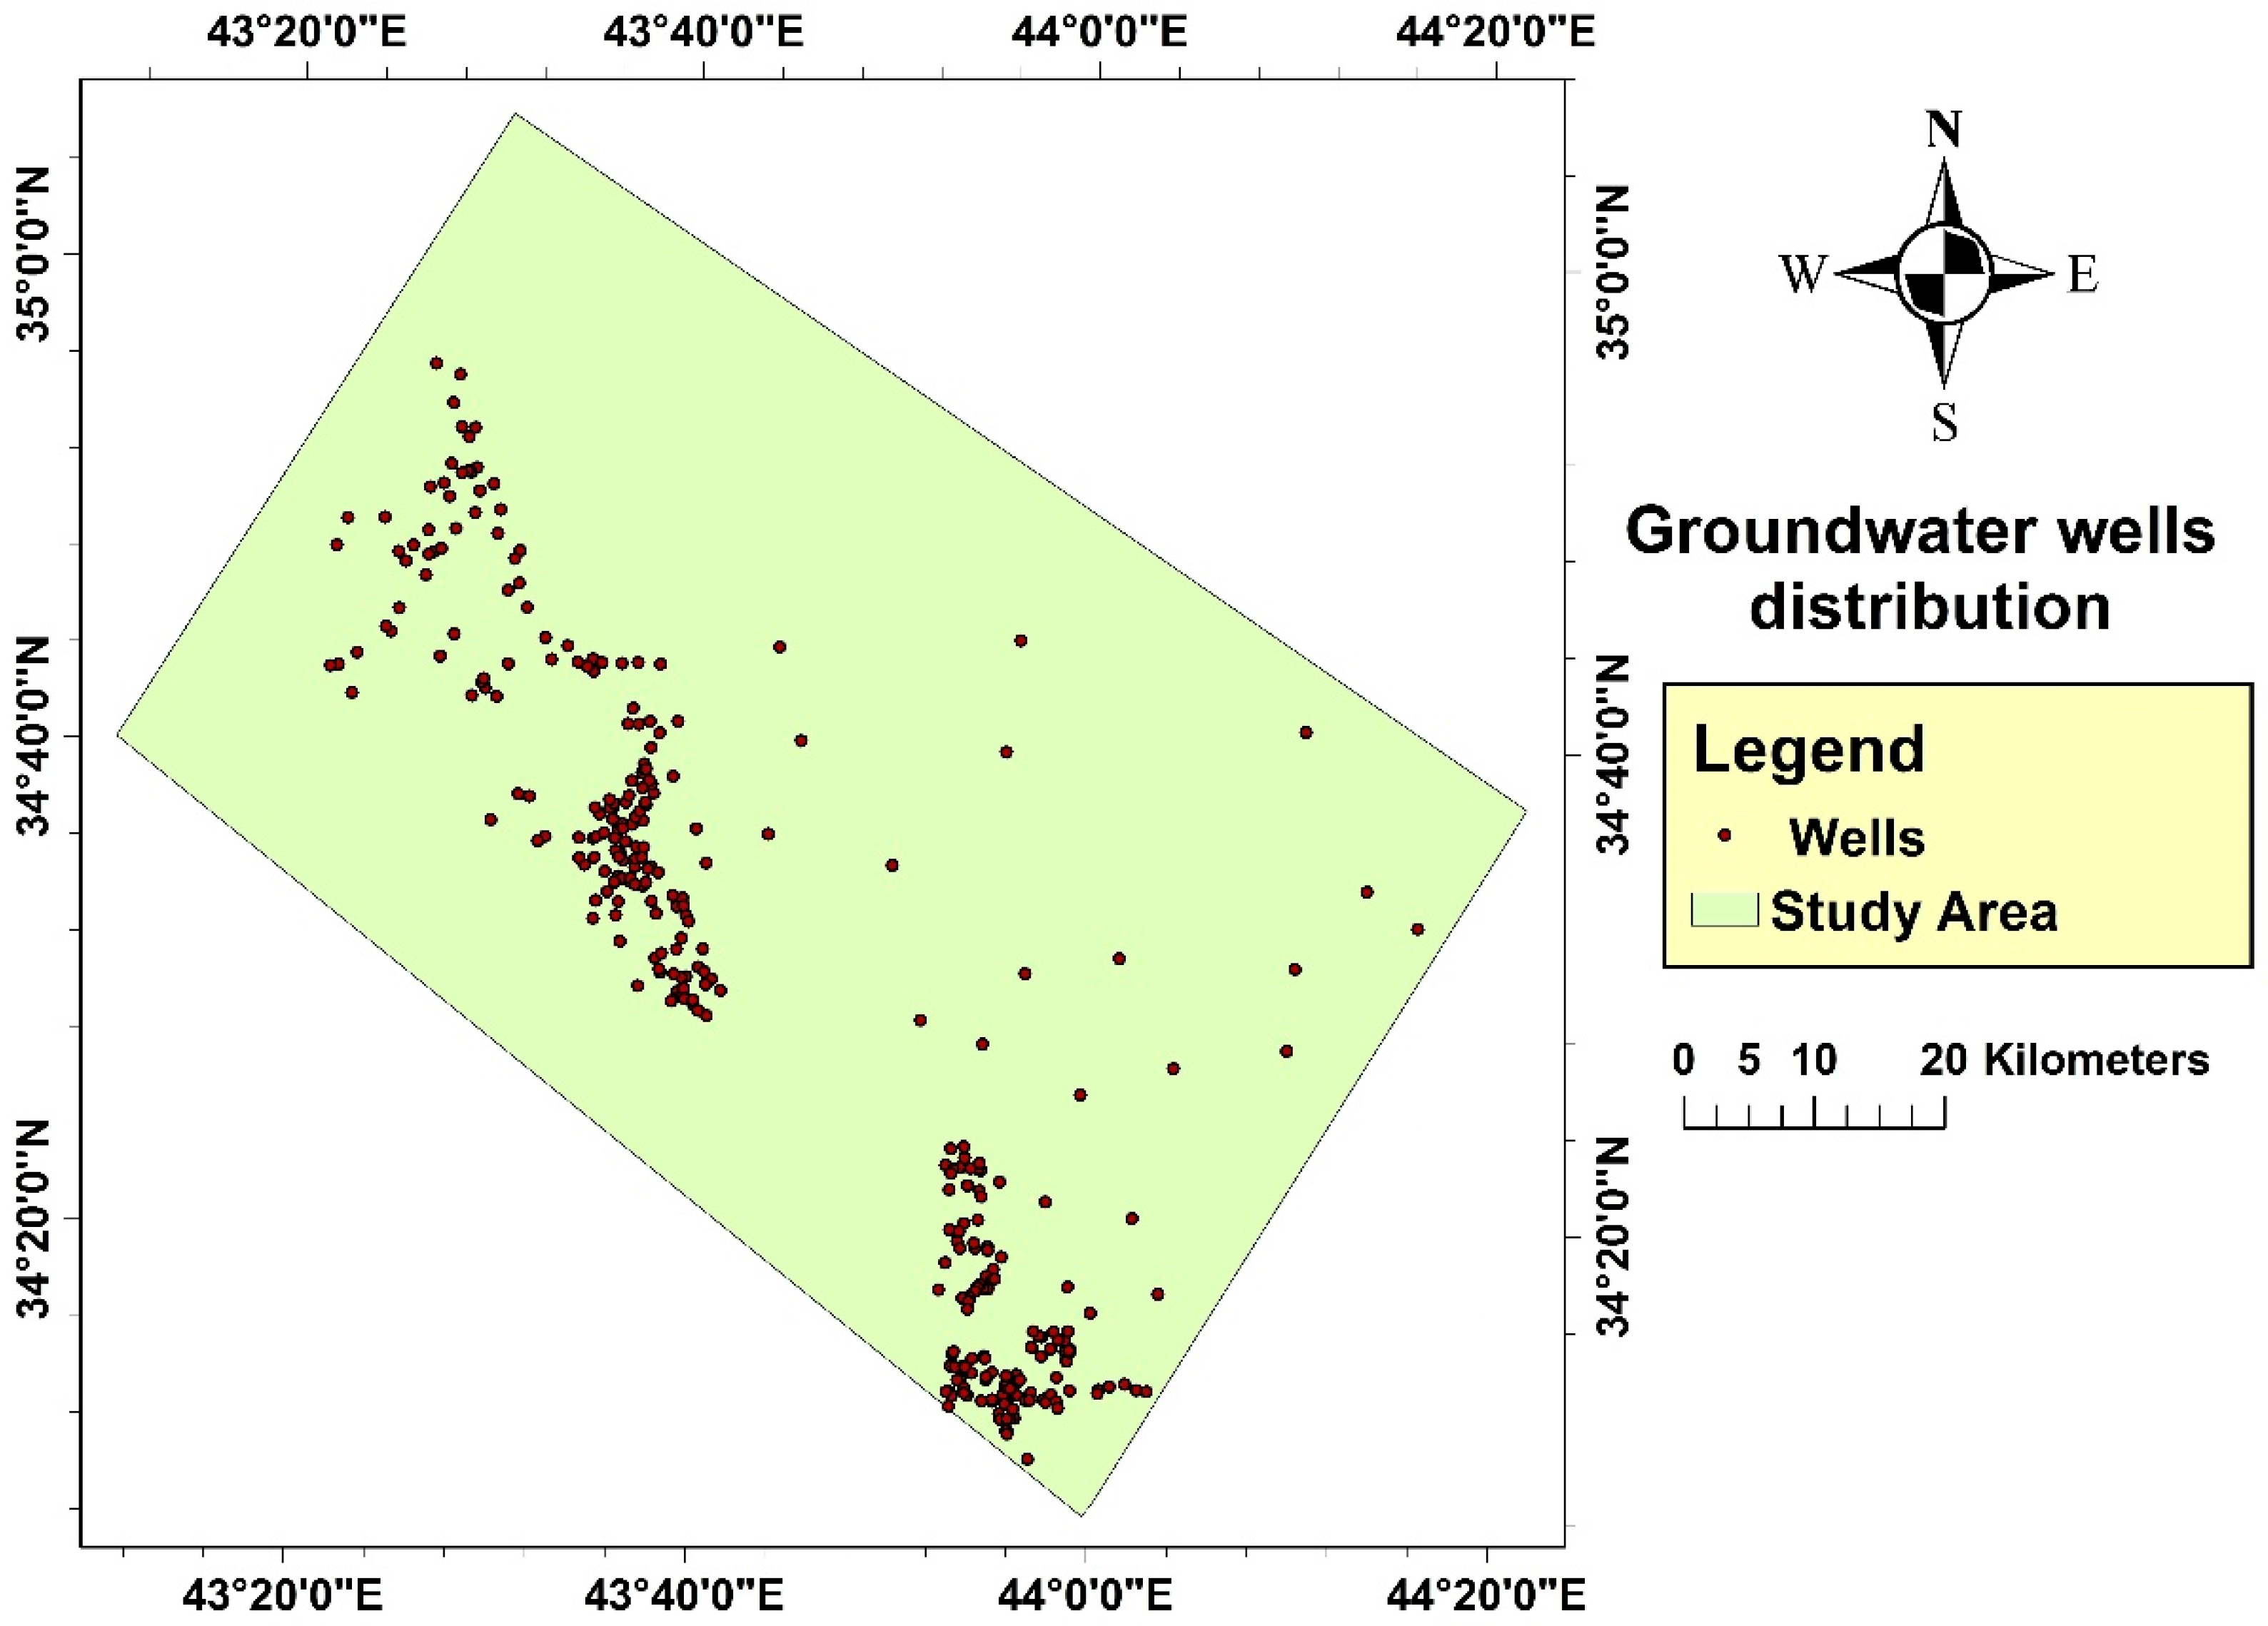
The groundwater wells data were acquired from the General Commission for Groundwater/Ministry of Water Resources/Iraq. The total number of the data points are 340, each point contains pH, EC (µS/cm), K (ppm), Na (ppm), Mg (ppm), Ca (ppm), Cl (ppm), and SO4 (ppm). The distribution of the wells is shown in Figure 6.

2.3. Data Interpolation

Kriging interpolation method represents a group of geostatistics-based interpolation techniques that attempt to give an optimal estimate of the value of a variable on a surface. Kriging was initially developed in the 1960s by Matheron [33] based on the theory of regionalized variables which was, in turn, an extension of the methods employed by David Krige in the mining industry of South Africa. It is a multistep process often used in soil science and geology. Kriging method comprises exploratory statistical analysis of the data. The general formula is:
Z ( S o ) = i = 1 N λ i   Z ( Si )
where Z (si) is the measured value at ith location, λi represents an unknown weight for the measured value at the ith location, so is the prediction location, and N is the number of measured values.
The selection of the semivariogram model influences the prediction of the unknown values, particularly when the shape of the curve near the origin differs significantly, so it is a fundamental step between spatial description and spatial prediction. There are five semivariogram models namely spherical, exponential, Gaussian, linear, and circular; every model is designed to fit different types of phenomena accurately. The following equations of semivariance models were used in this study [34]:
(a) Spherical semivariance model
γ ( h ) = { c o + c ( ( 3 h 2 a 1 2 ( h 3 2 a 3 ) ) 0 < h < a c o + c h > a 0 h = 0
(b) Exponential semivariance model
γ ( h ) = { c o + c ( 1 exp ( h a ) ) h > 0 0 h = 0
(c) Gaussian semivariance model
γ ( h ) = { c o + c ( 1 exp ( h 2 a 3 ) ) h > 0 0 h = 0
where C is constant, h represents the distance, and a is the range.
Many authors applied the semivariance models in their studies. Muhamad and Othman [35] stated that the spherical model has good performances to produce a spatial rainfall map model because all priority weight sets had similar results that ranked the spherical model in the first place. Moreover, the spherical model was suitable for EC and exponential model for Na, K and Mg [36], while the exponential model was the best fit for soil pH [37]. In addition, monthly and annual temperature have spatial structure and their spatial variation conform to the spherical and exponential models [38]. Finally, a Gaussian model is a suitable choice to apply in monitoring the groundwater level [39].
In this study, the Ordinary Kriging method is used for interpolation of all layers except the water elevation (which is interpolated using Topo-To-Raster). Additionally, the semivariogram model is chosen according to the previous studies as follows: the Gaussian model used for the aquifer thickness; the spherical model used to produce the layers Ec, Kf, precipitation, and temperature, while the exponential model used for the layers SAR, NA%, MAR, KR, and pH.

2.4. Agricultural Water Quality

As various types of water are used for different purposes, it is necessary to use a specific system for water quality standards assessment because water suitable for a given purpose may not be suitable for another. Risk should be taken into consideration when assessing the suitability of water for irrigation. The following terms are the main important characteristics of groundwater that are used in the present study to determine its suitability:

2.4.1. Salinity Hazard

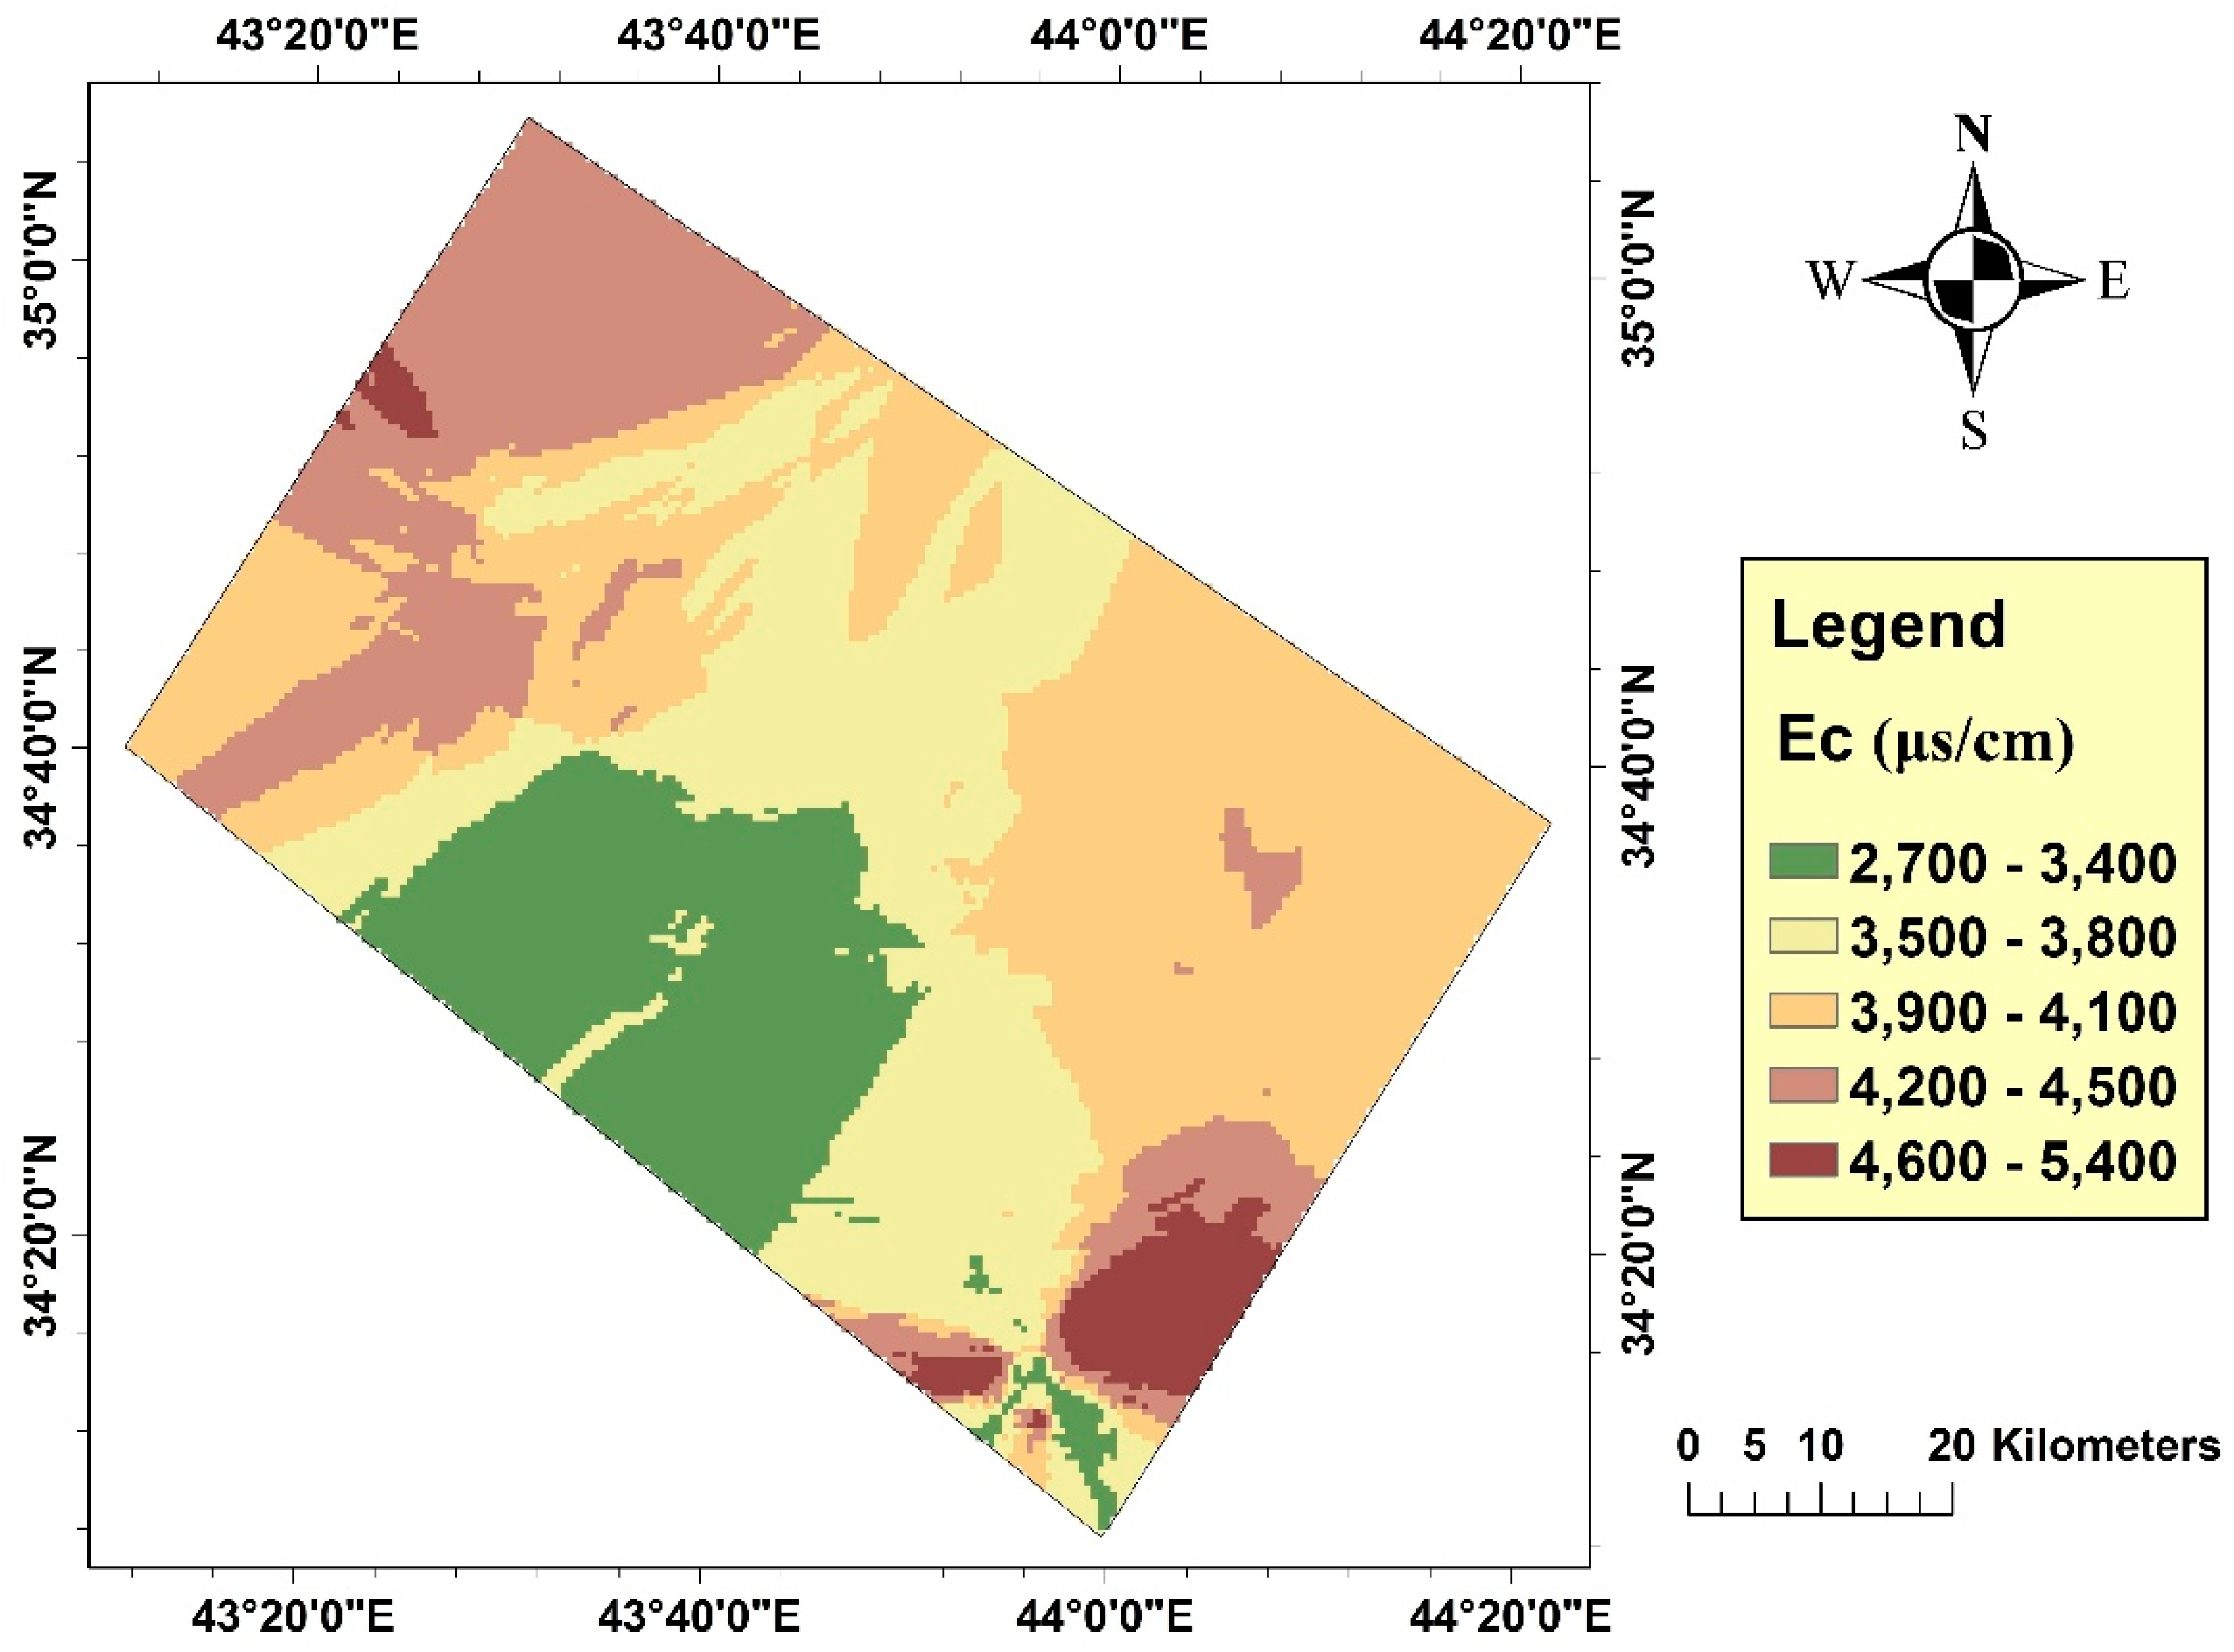
Thorne and Peterson in 1954 [40] modified the classification proposed by the US Salinity Laboratory in 1954 as shown in Table 1. For this study, the values of EC vary from 2700 to 5400 μS/cm, where all the values lie in the fourth category (very high salinity water). Figure 7 illustrates the interpolated EC value distribution in the study area using the Ordinary Kriging method.

2.4.2. Power of Hydrogen (pH)

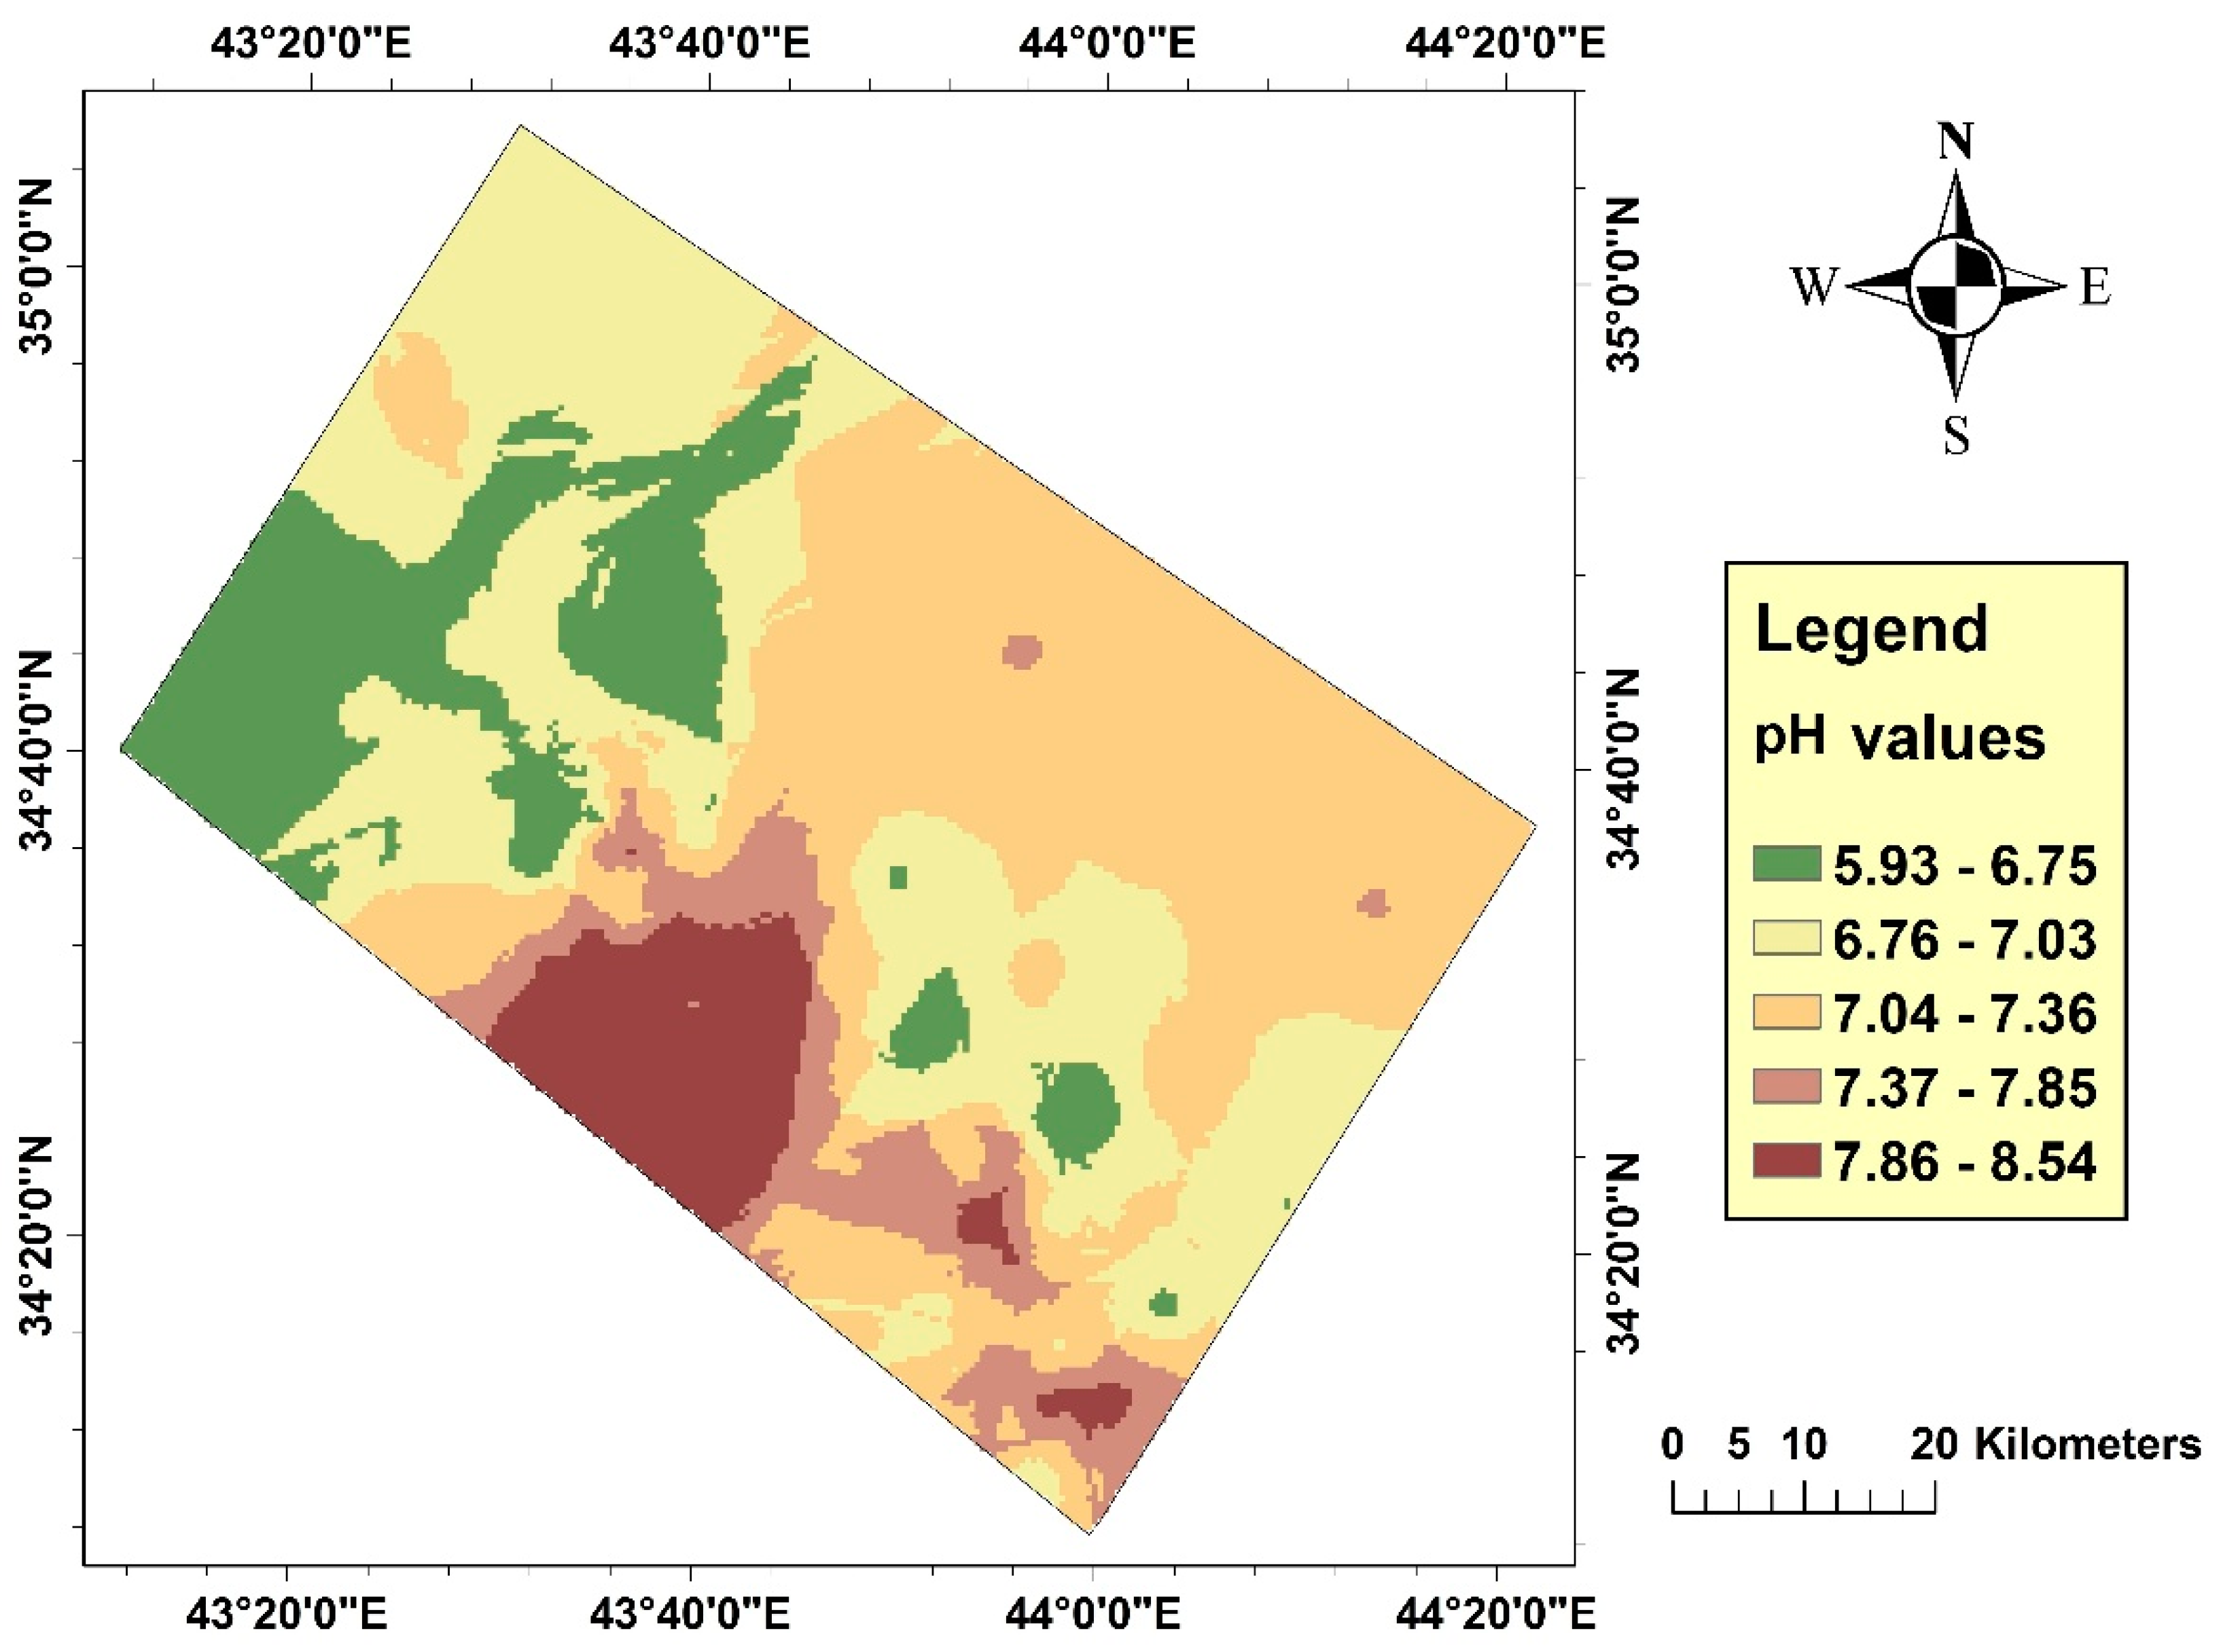
Water pH and redox potential significantly affect the chemical and biochemical processes in the water, therefore their determination has great importance. It helps to distinguish the presence of different forms of elements in water, which is one aspect of assessing the corrosive properties of water that affects the efficiency of most chemical, physical-chemical and biochemical processes of the water. The permissible limit prescribed by WHO varies from 6.5 to 8.1 with a mean value of 7.5 [42]. For this study, the average value of pH is 6.98, where all values lie in the range 5.93–8.54, indicating slightly alkaline water. The pH values distribution of the study area is shown in Figure 8.

2.4.3. Sodium Hazard

Sodium is one of the major factors governing water quality. There are two indicators used to evaluate the sodium hazard of irrigation water, the sodium adsorption ratio (SAR) and sodium percentages (Na %). The sodium and salinity hazards are the essential factors that could be used to indicate the water suitability for irrigation usages [43].
(a) Sodium Adsorption Ratio (SAR)
SAR is a quality parameter for irrigation water; it is used mainly in the management of sodium-affected soils. It is one of the most important factors for assessing the suitability of water for irrigation due to its effect on soil and vegetation as it has a direct relationship with sodium absorption in soil. SAR is calculated according to the formula:
SAR = N a C a + M g 2
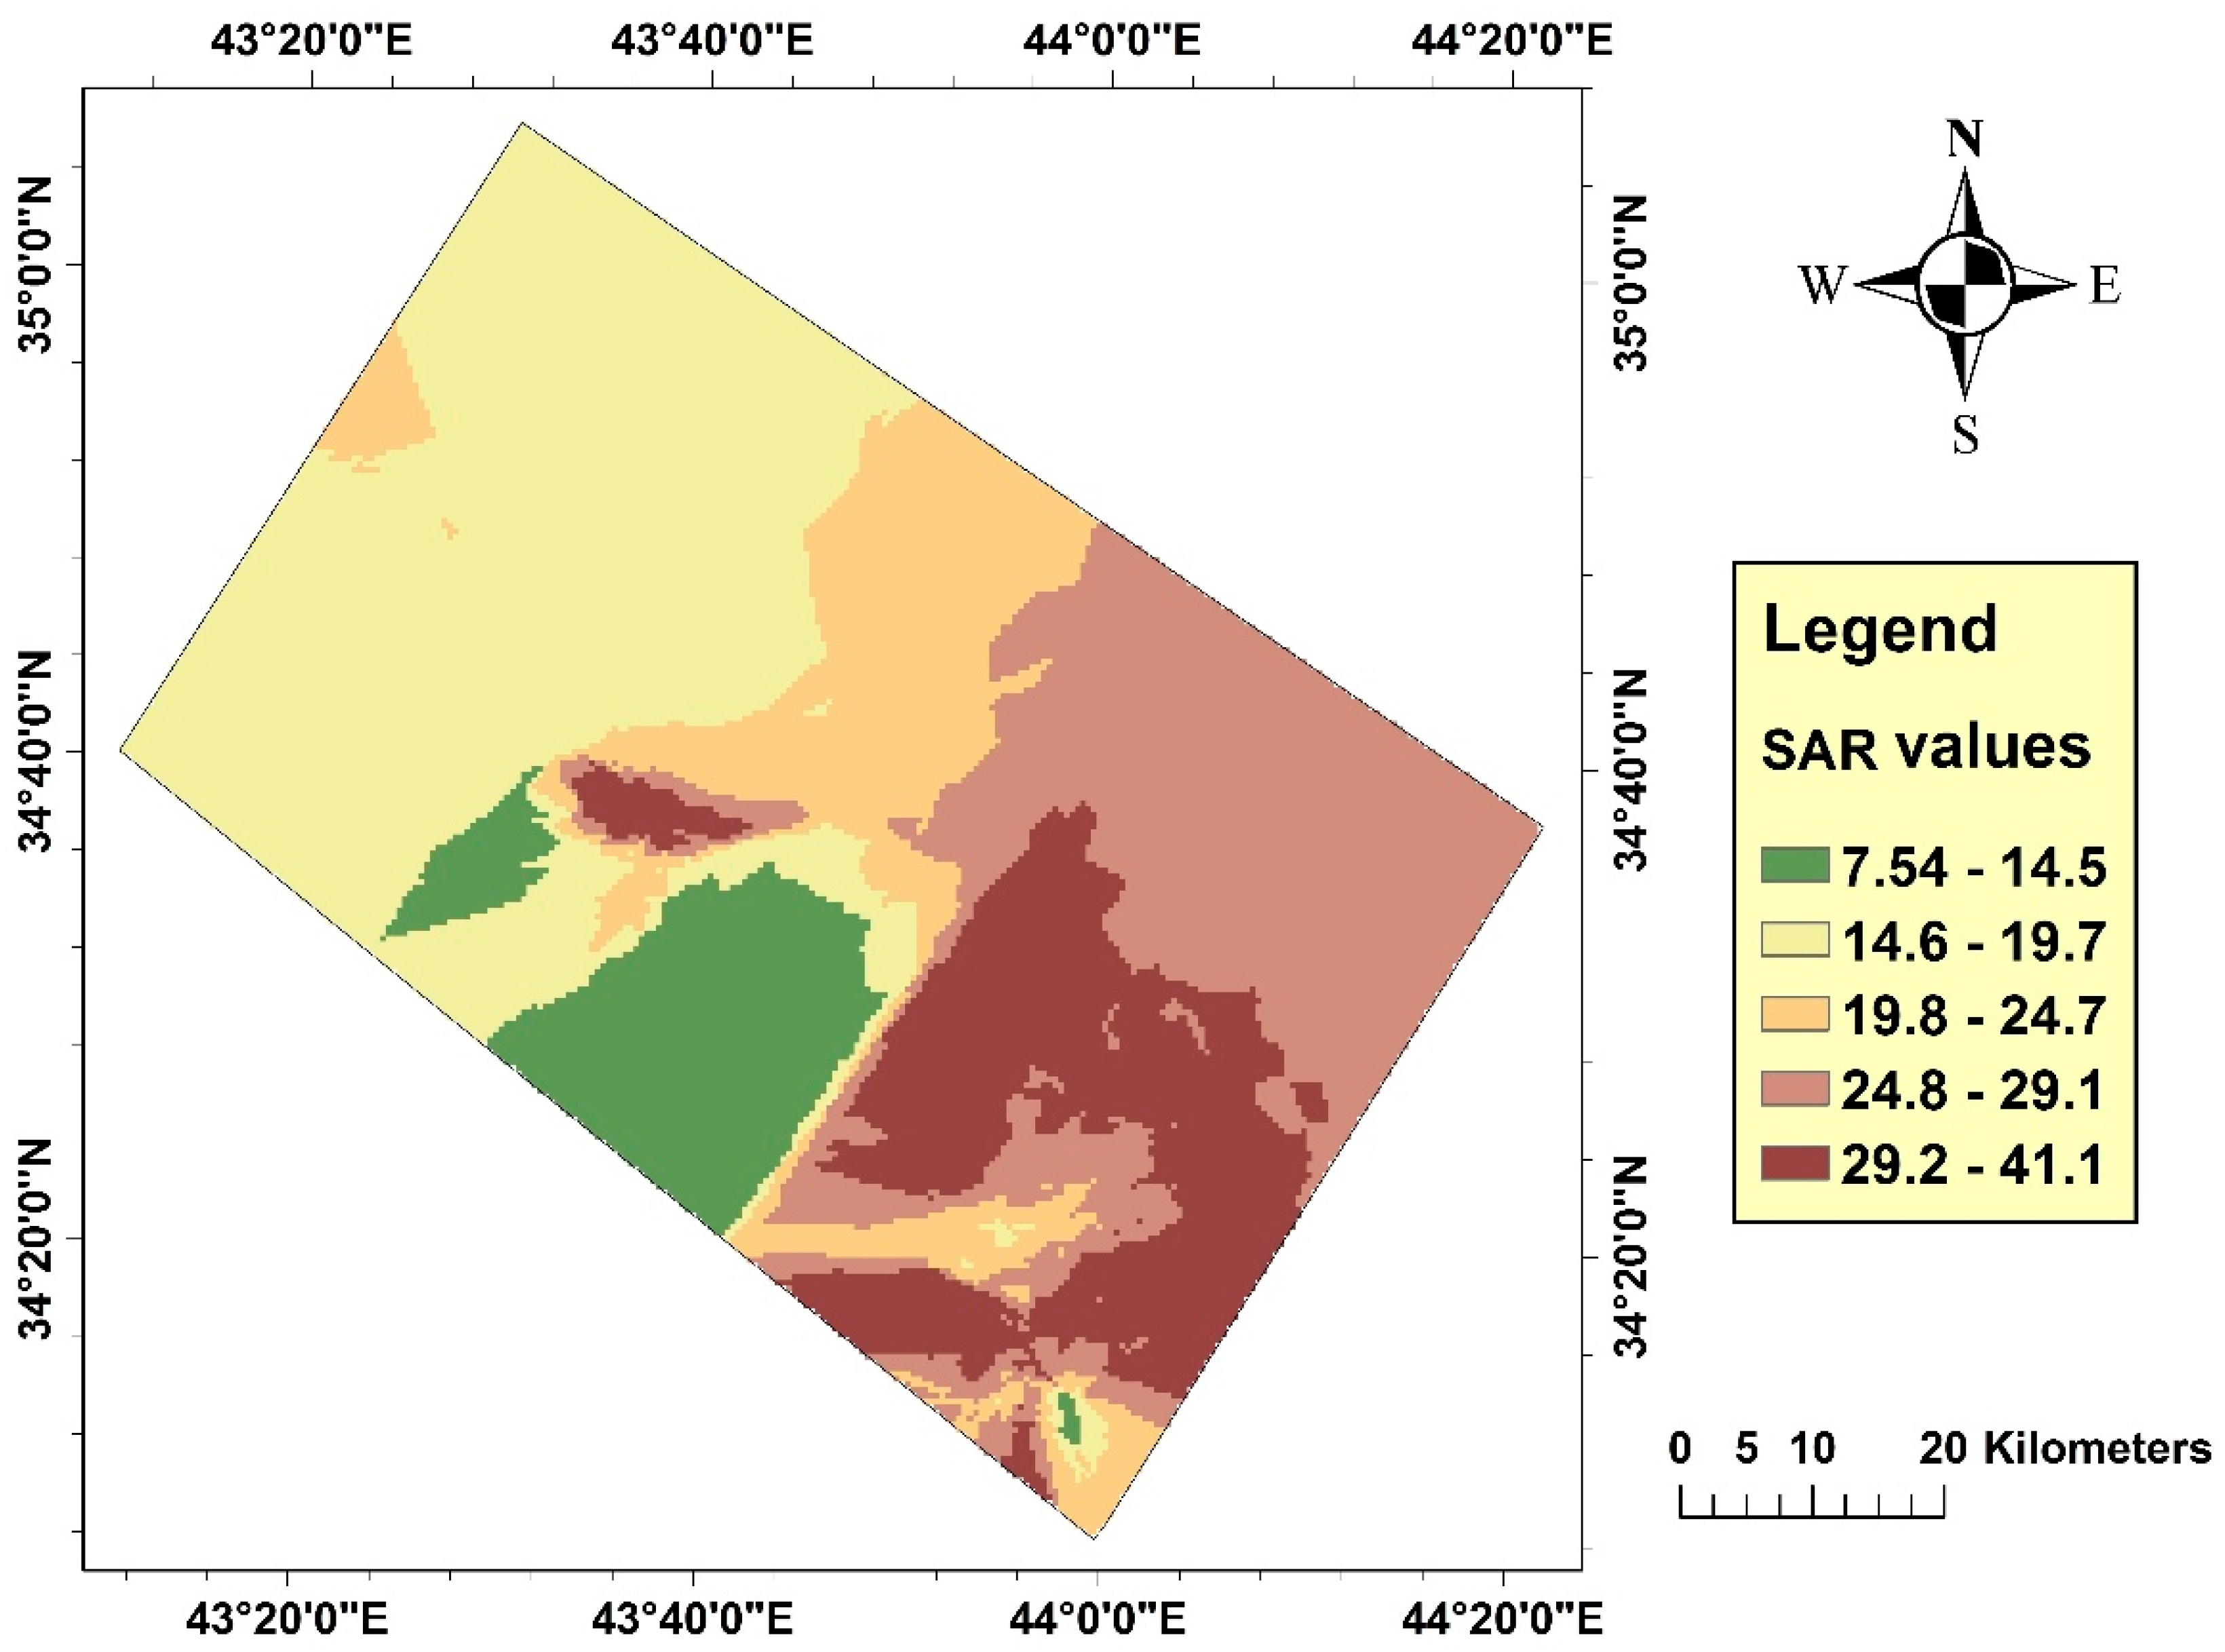
where the ionic sodium, calcium, and magnesium concentrations are expressed in meq/L. Table 2 shows the sodium hazard classes. For this study, the SAR value is computed using equation 5 where the values of SAR lie in the range 7.54–41.1 ppm. These values are interpolated using the Ordinary Kriging method. Figure 9 illustrates the SAR value distribution in the study area.
(b) Sodium percentage (Na %)
Assessment of sodium percentage is needed to evaluate the water quality. The sodium percentage is calculated based on the relative ratio of cations existing in water, using Wilcox formula [44], the sodium percentage, expressed in meq/L, is defined as:
Na % = N a + K K + c a + M g + N a
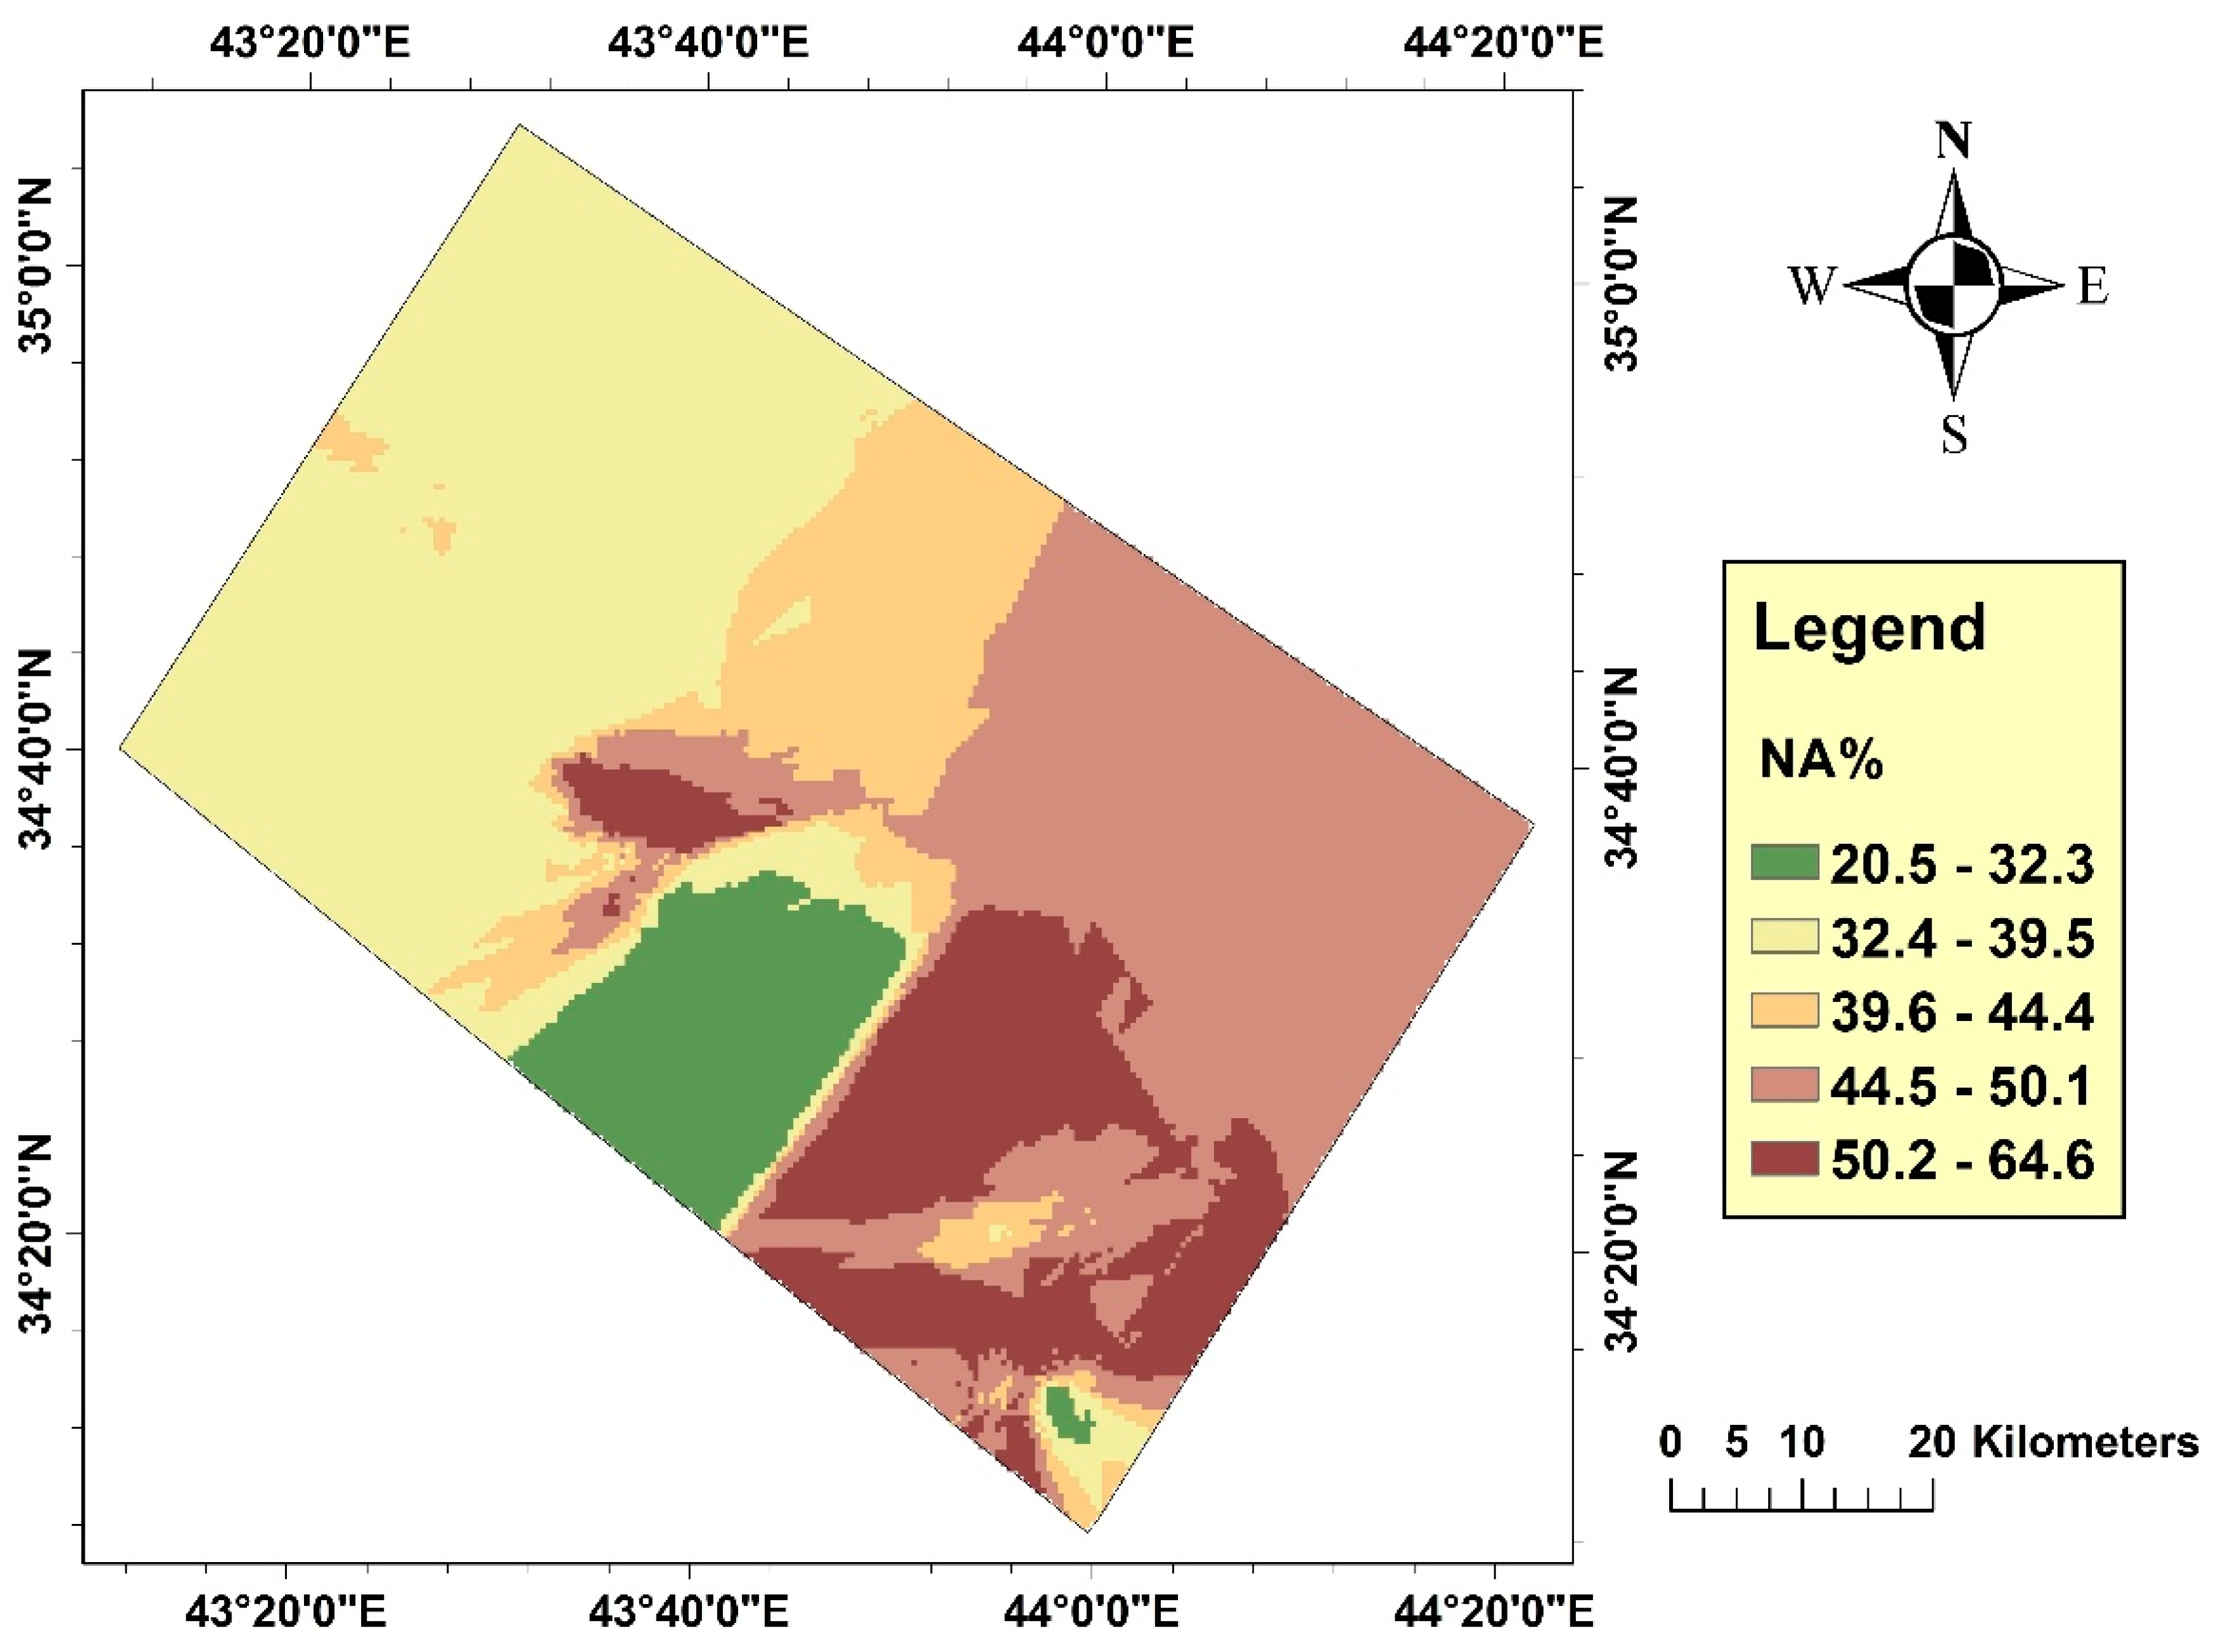
Table 3 illustrates the various classes of water based on Na% values. For this study, the values of Na% are computed using equation 6; the values lie in the range 20.5–64.6. These values are interpolated using the Ordinary Kriging method. Figure 10 illustrates the Na% values distribution in the study area.

2.4.4. Magnesium Adsorption Ratio (MAR)

Magnesium Adsorption Ratio is one of the essential qualitative criteria for evaluating the water quality for irrigation purposes [45]. MAR is calculated by the following formula:
MAR = M g 100 C a + M g
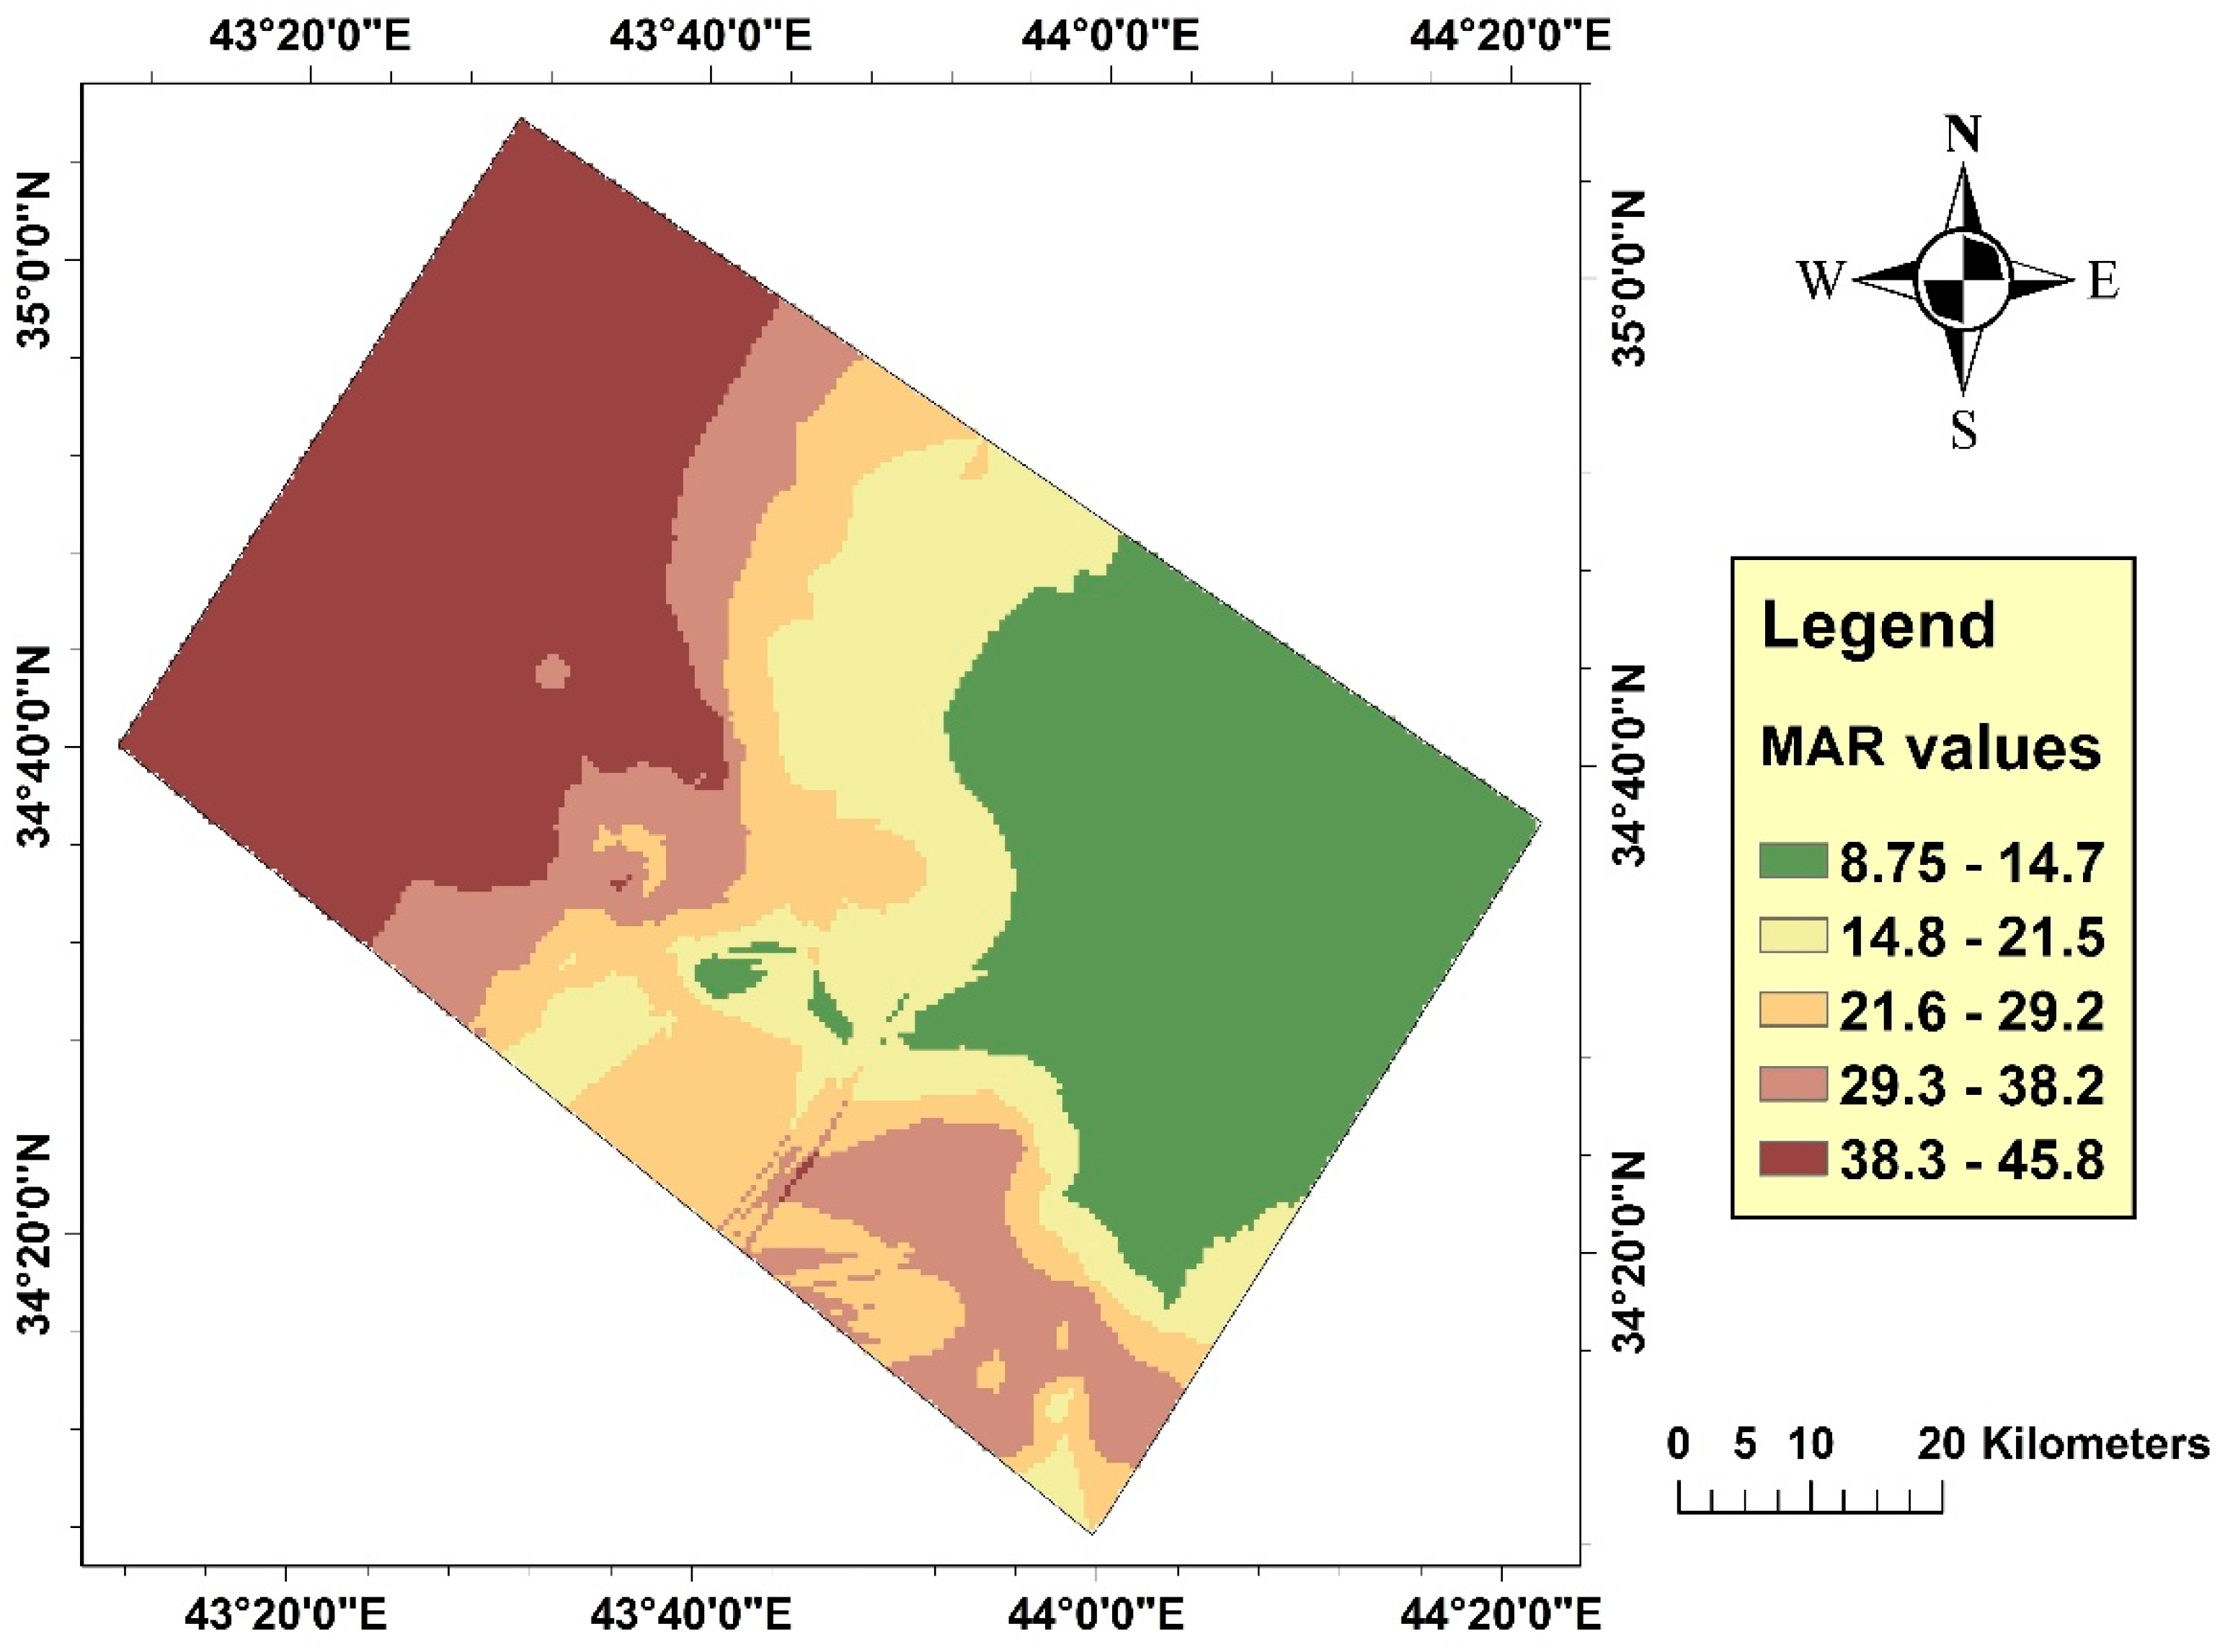
High magnesium adsorption ratio affects the soil negatively when the MAR ratio exceeds 50. For this study, MAR values lie in the range of 8.75–45.8 ppm. Figure 11 illustrates the MAR values distribution in the study area.

2.4.5. Kelly’s Ratio (KR)

Kelly in 1957 defined Kelly’s Ratio as [46]:
KR = Na Ca + Mg
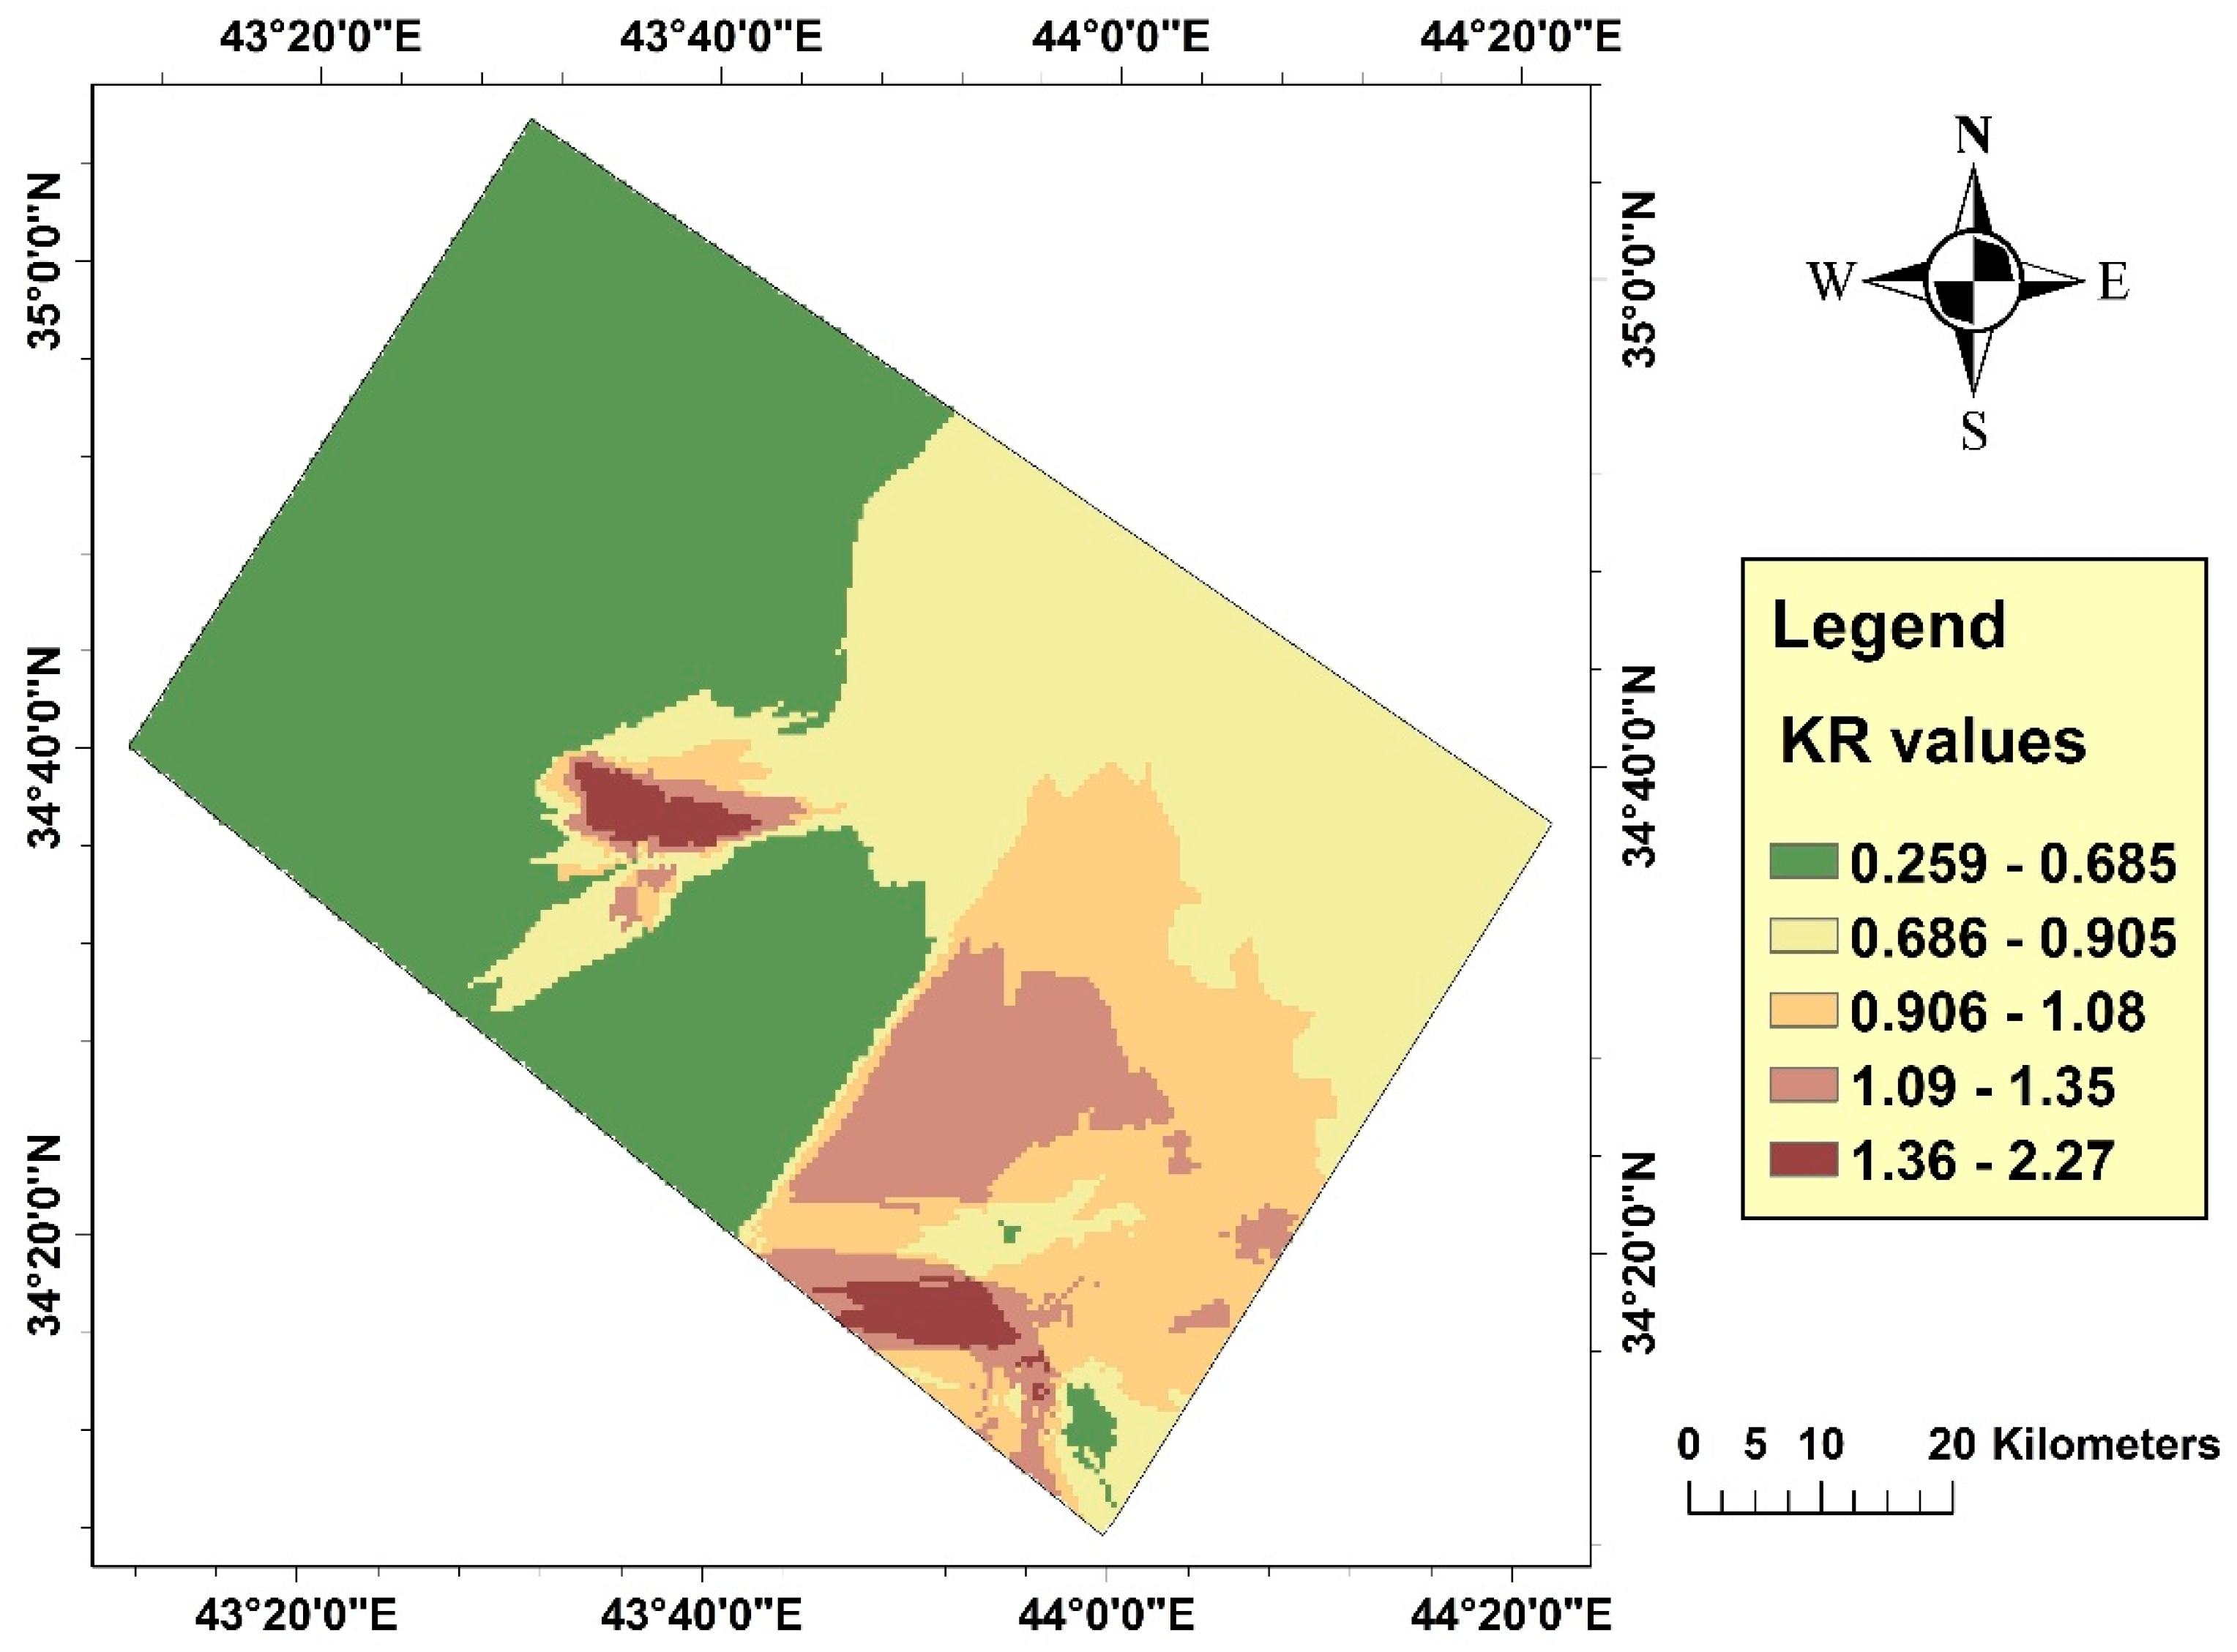
When KR less than one, the water quality is classified as good, while water with a ratio of more than one is considered not suitable for irrigation purposes. For this study, the values of KR lie in the range 0.259–2.27. Figure 12 illustrates the KR value distribution in the study area.

2.5. Climate Factor

In this study, the climate factor is considered to identify a suitable location for groundwater use. Lang factor (Kf) is employed to estimate the possibilities of groundwater recharge during wintertime.

Precipitation Factor by Lang (Kf)

This factor is based on the relationship between precipitation and air temperature. It is expressed as follows:
Kf = Z T
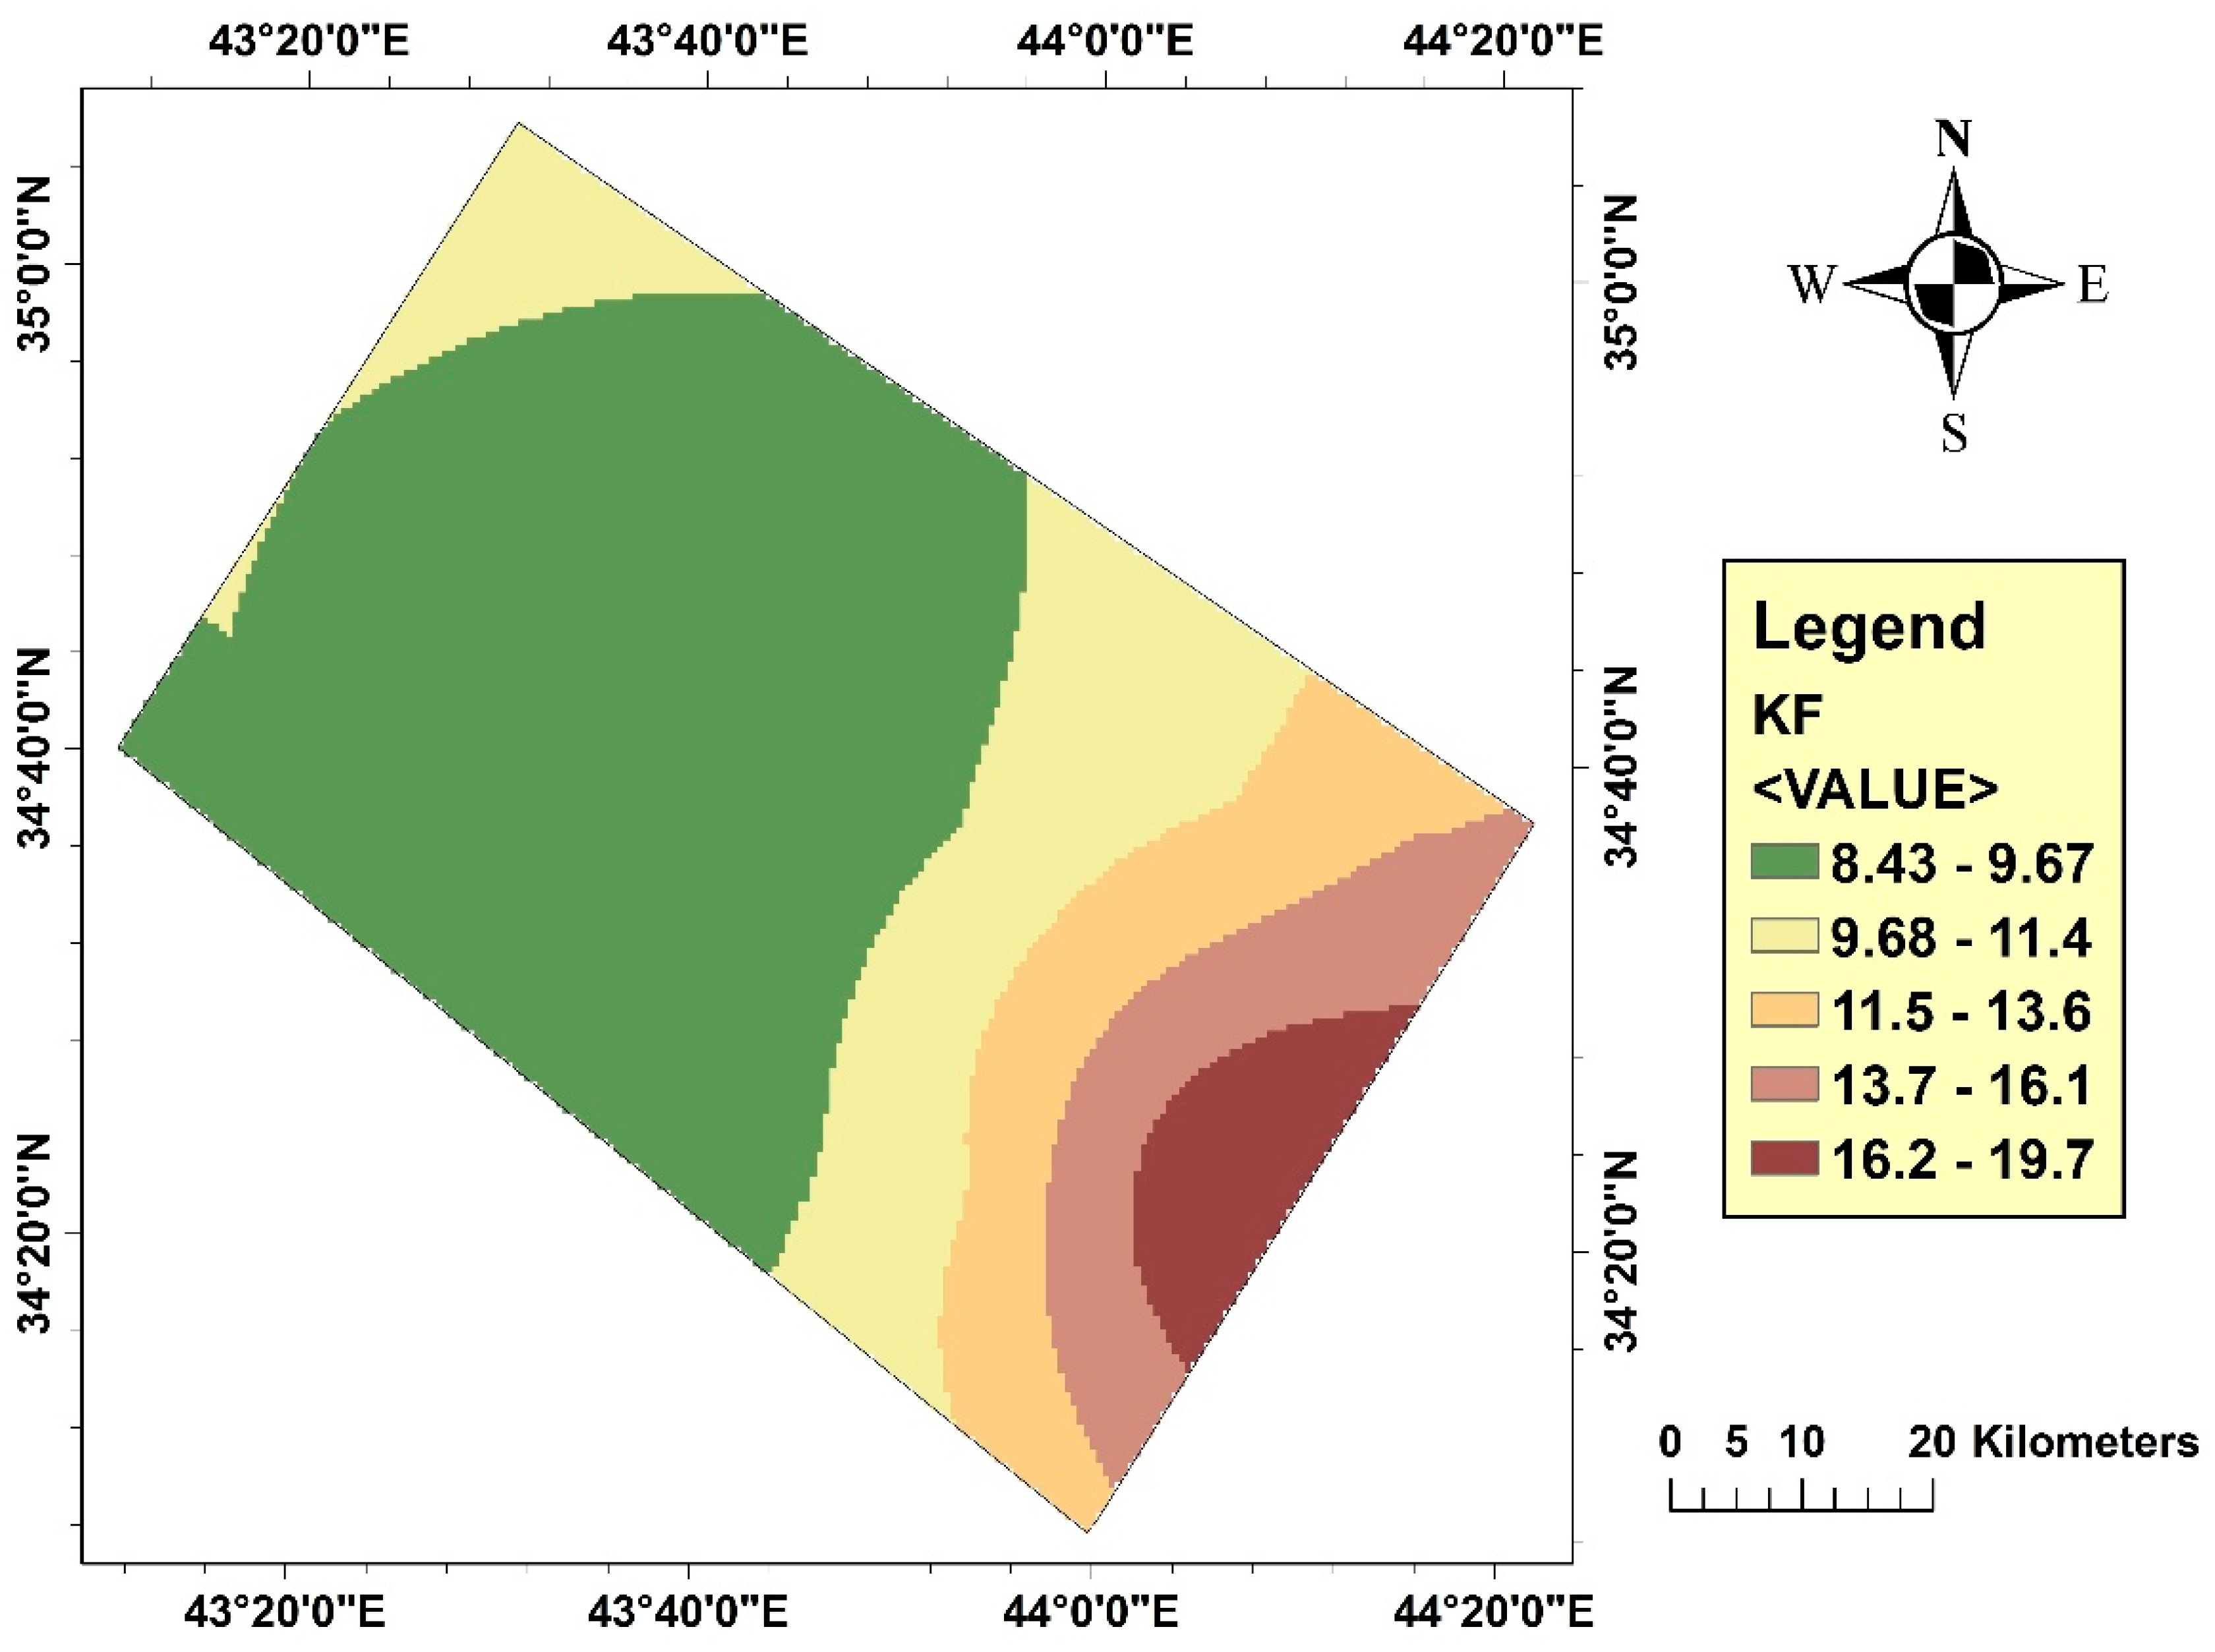
where Z is the total precipitations calculated for each year (mm) and the parameter T is the average annual air temperature in individual years (°C). Climatic regions, which are classified by this method, are shown in Table 4. For this study, the values of Kf lie in the range of 8.43 to 19.7; all the regions lie in the first category, which is a dry condition (irrigation required). A Lang factor (Kf) value of less than 20 indicates smaller possibilities of groundwater recharge during wintertime. The groundwater recharge is proportional to Kf, where the highest value refers to a location that is more suitable. Figure 13 illustrates the Kf values distribution in the study area.

2.6. GIS-Based Multi-Criteria Decision Analysis

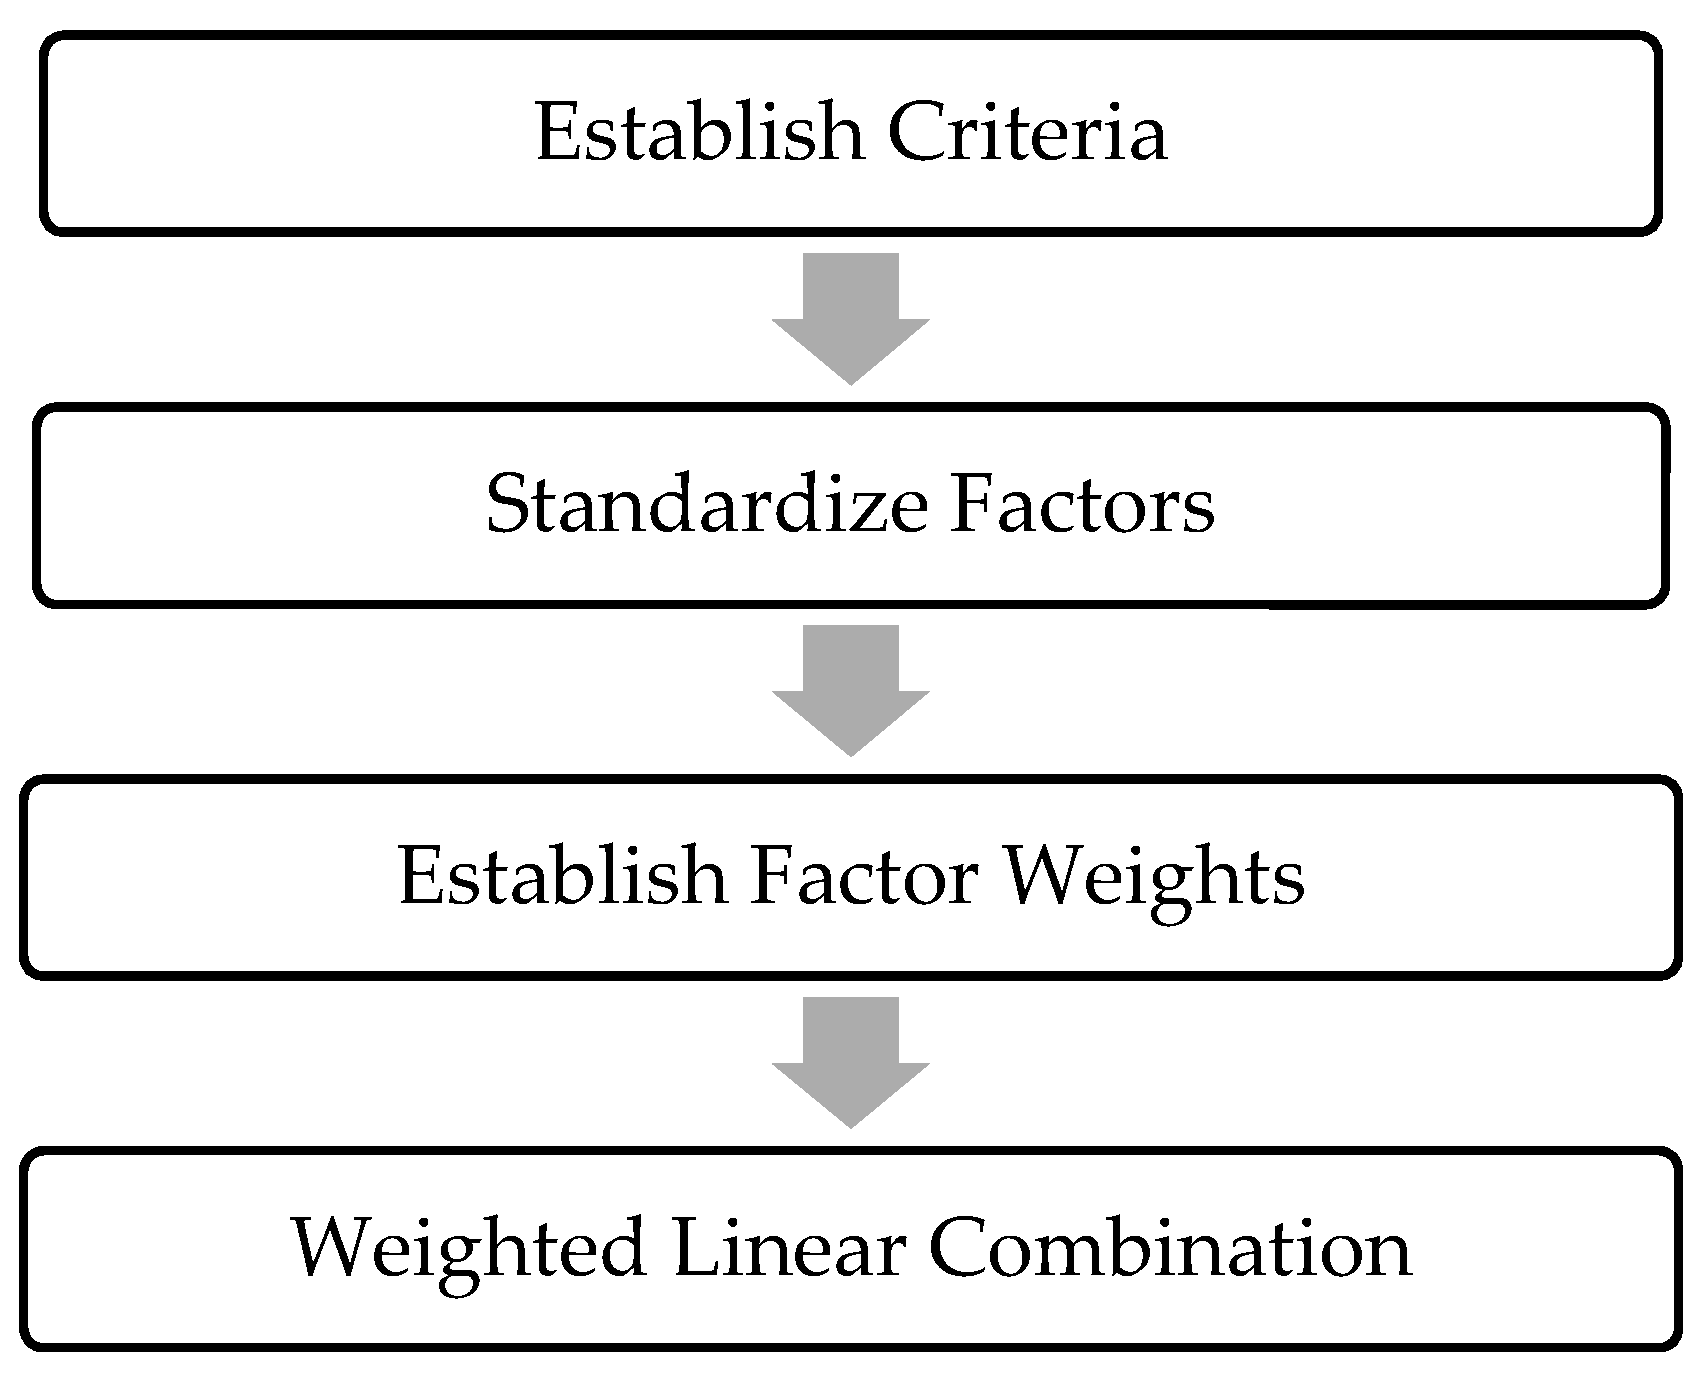
GIS-based MCDA is the process that integrates and transforms geospatial data and values to get an overall evaluation of the decision alternatives. GIS techniques play a significant role in the decision analysis method by recognizing them as a decision-support system that integrates spatial reference data into a problem-solving environment. GIS-based suitability analysis is the process used to evaluate the suitability for a specific area for a definite purpose, for example, urban development, agriculture, and livelihood projects. In the MCDA process, every criterion is given an accurate weight, which represents the importance of this criterion. Figure 14 illustrates the multi-criteria evaluation flow chart. Nine criteria are used in this study to find out the groundwater suitability for irrigation purpose, which are EC, pH, Na%, SAR, MAR, KR, Climate factor, aquifer thickness, and the aquifer elevation. Table 5 summarizes the standardized scales and weights for each layer. The standardization commonly referred to as the process that converts the data to a uniform numeric scales. Usually, the standardized criteria are combined by the weighted linear combination, where each factor is multiplied by the assigned weight, and then the results collected to reach a multi-standard solution [21]:
Suitability = Σ   WfXf Π   Ci
where
  • Wi = Weight of factor f
  • Xi = criterion score of factor f
  • Cj = constraint i.

3. Results and Discussion

Analysis of the results of this study reveals that the values of EC are lying in the range 2700–5400 μS/cm, where all values fall in the fourth category (very high salinity water). The pH range is 5.93–8.54, which indicates that water is slightly alkaline. SAR range is 7.54–41.1 ppm that fall in all categories. The higher the SAR values in the water, the greater the risk of sodium. If the SAR values are high, the irrigation water will cause permeability problems with shrinking and swelling in clayey soils. For this study, the values range of Na% is 20.5–64.6 (excellent to doubtful, respectively). MAR values are less than 50 ranging from 8.75 to 45.8 ppm. KR varies from 0.259 to 2.27, values less than one are classified as good, while higher values are considered as not suitable for irrigation purposes. The sodium present in irrigation water reacts with soil causing absorptivity problems, which affect soil structure that becomes more compact with permeability reduction leading to little or no plant growth. The precipitation factor Kf values in this study are less than 20, indicating the dry condition (irrigation is required) that means smaller possibilities of groundwater recharge during wintertime.

3.1. Weighted Overlay Analysis

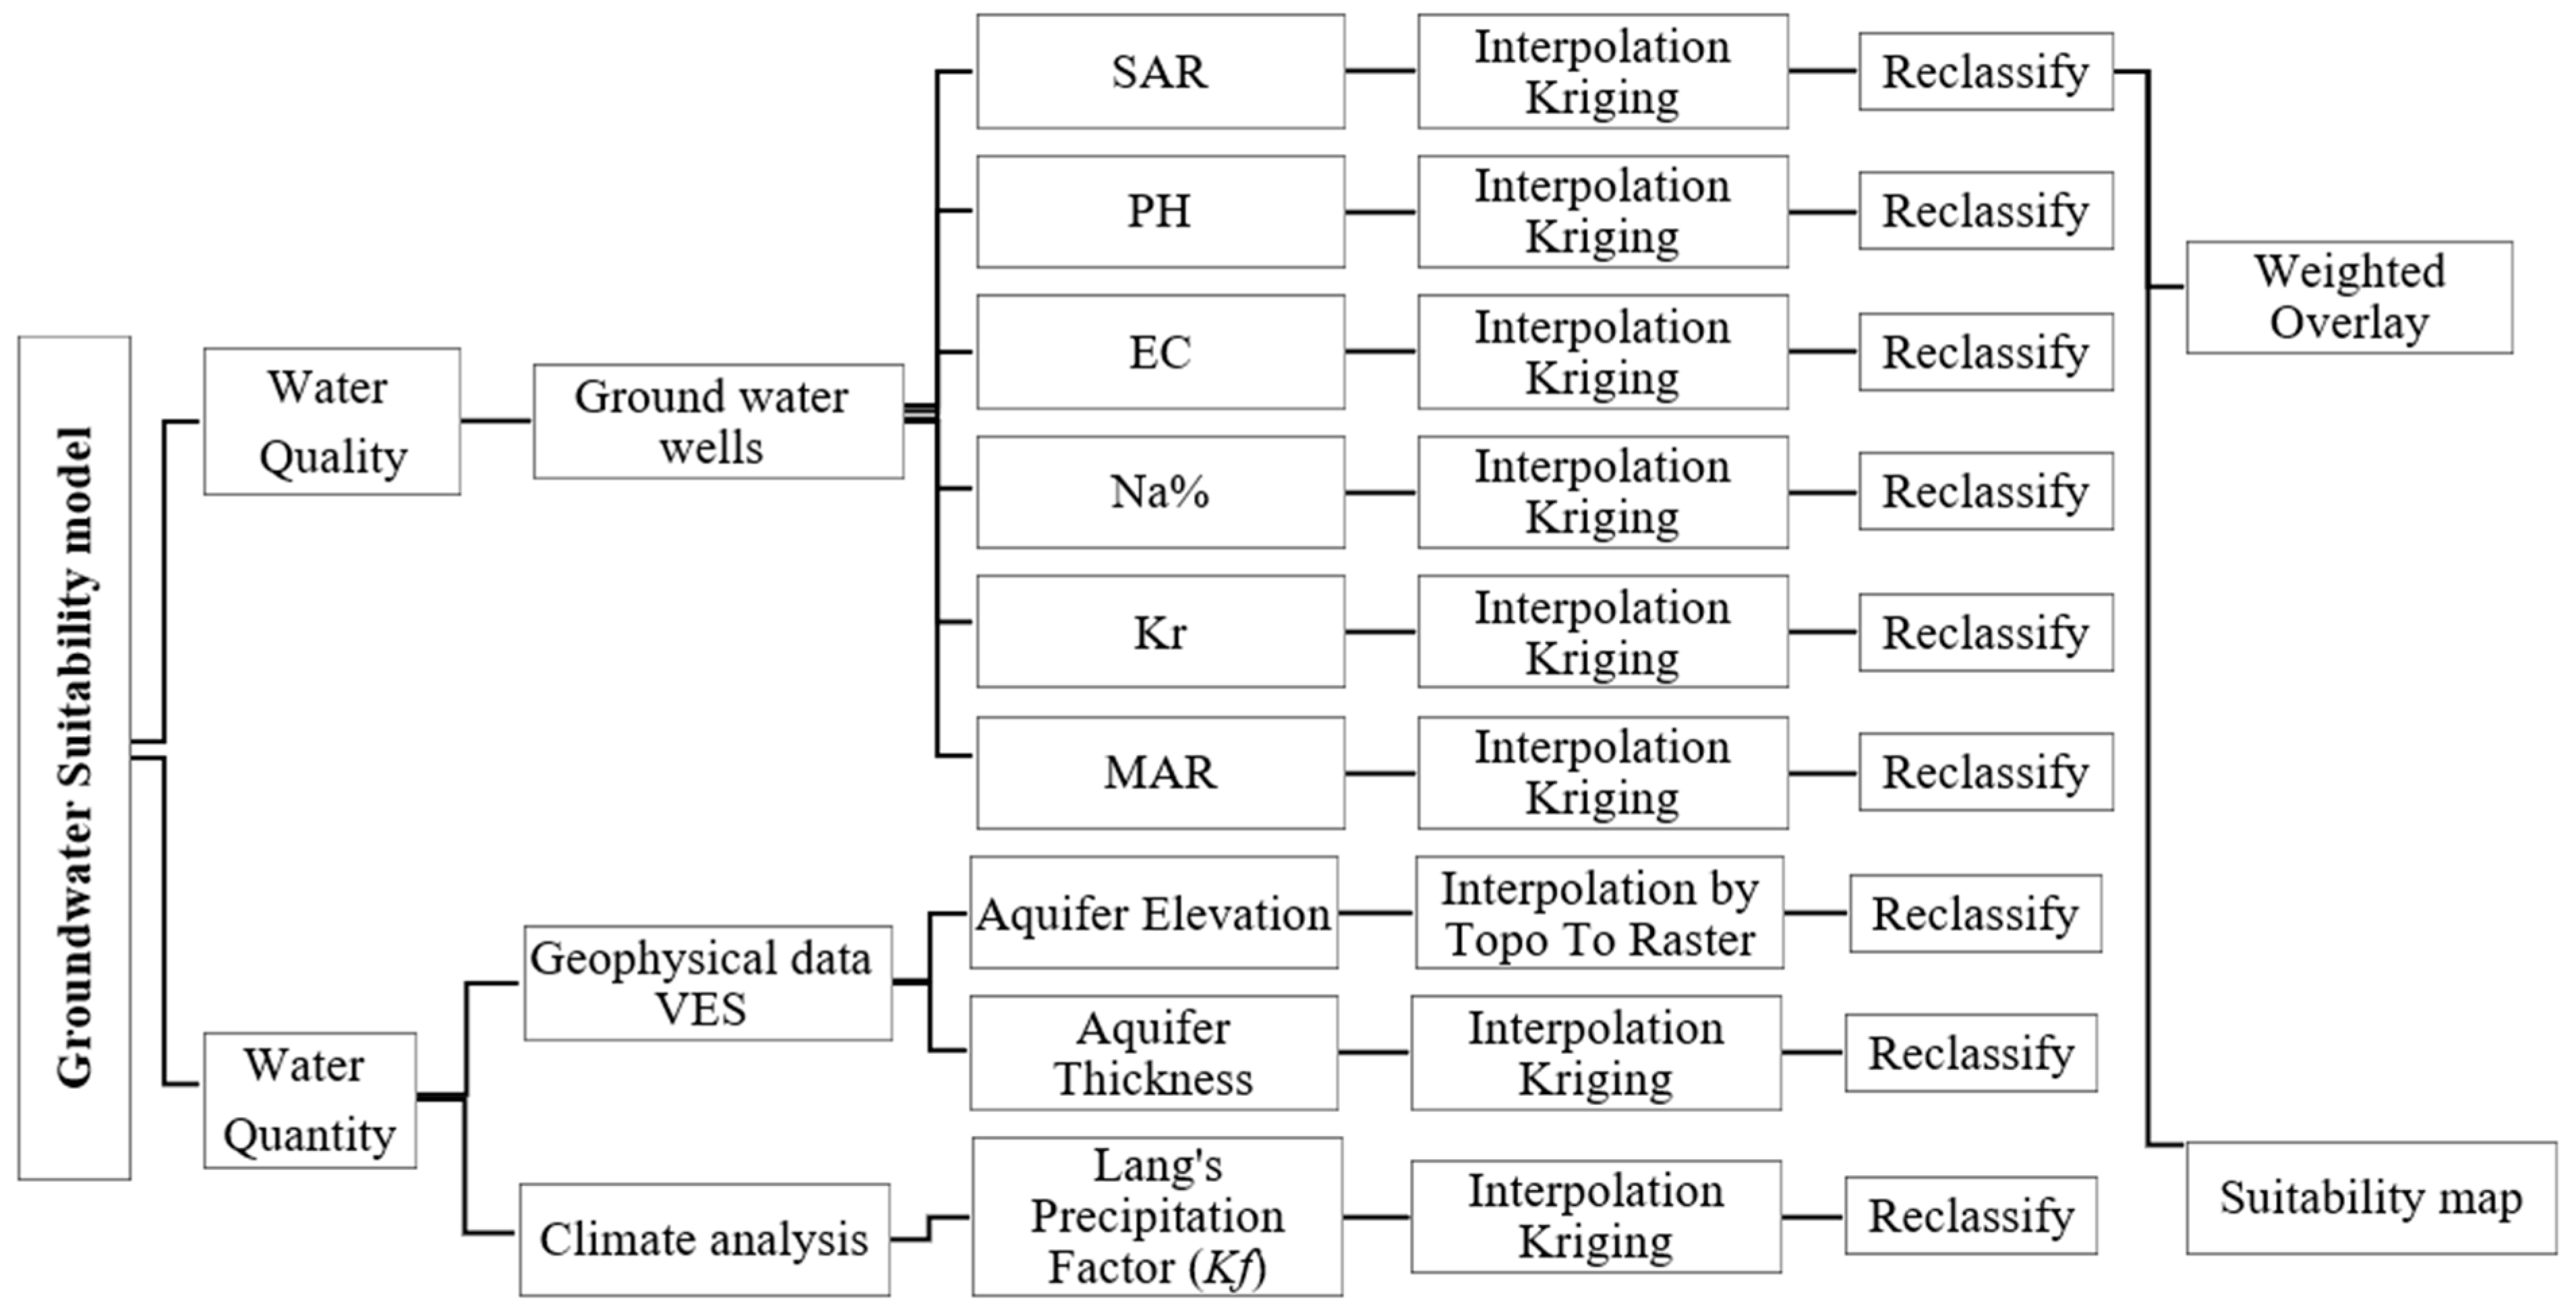
The weighted overlay is a process applied to put common measures of values to a variety of dissimilar and miscellaneous inputs to create an integrated analysis. Geospatial problems often require an analysis of different criteria using GIS. In this study, weighted overlay analysis in ArcGIS 10.5 is used to generate the final suitability map of the groundwater reservoir for irrigation (Figure 15). The primary task of the weighted overlay is that for each spatial data set the cell values of the input are multiplied by the weight of the raster (the weight of the standard).

3.2. Reclassifying Datasets

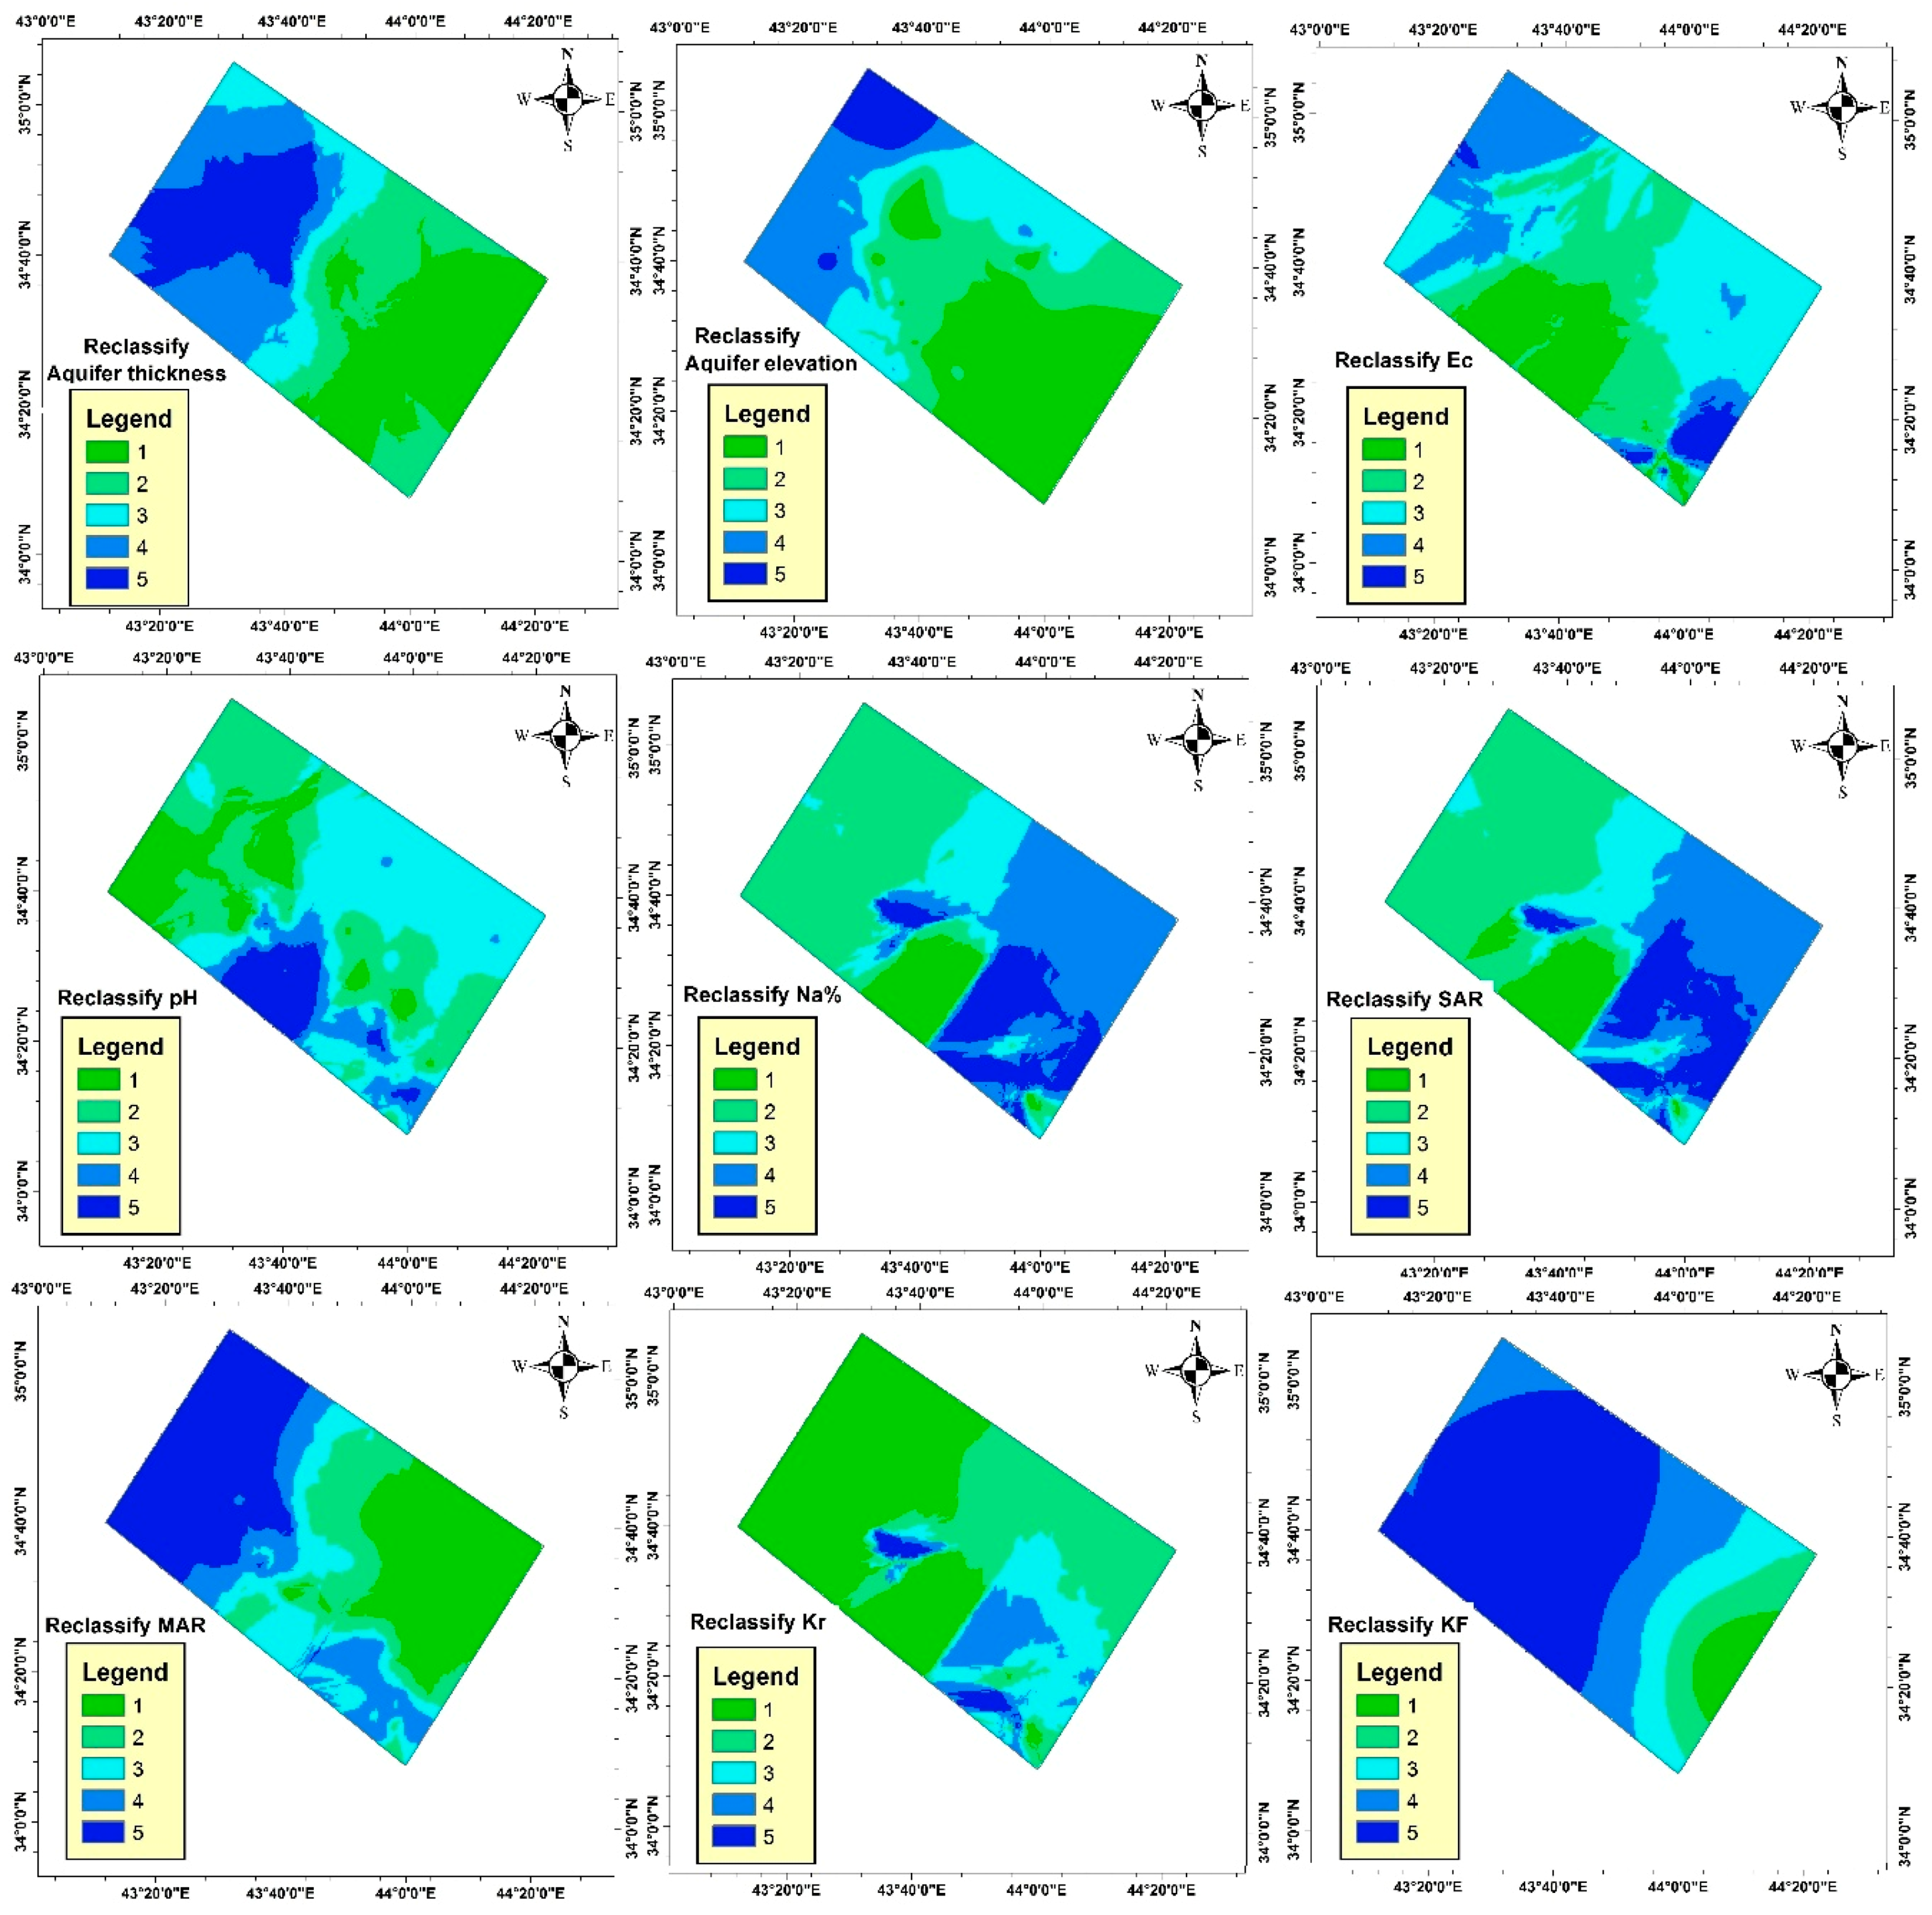
The first step to build the suitability model is the derivation of databases. In this approach, for every criterion input, each cell in the study area has a different value for each layer. The suitability map is created by combining the derived layers to identify suitable groundwater locations for irrigation. As it is not possible to combine these layers in this form, the next step is to reclassify the previous maps into a relative five classes to have a common value. In the resulted maps, the suitable locations are referred to as number one, while number five indicates unsuitable locations. Figure 16 shows the reclassified map for the nine criteria used in this study.

3.3. Suitability Map

MCDA is an appropriate and significant tool for suitability analysis of groundwater in terms of their adequacy levels by measuring the various criteria under consideration. In this context, various studies utilized MCDA for groundwater suitability analysis with successful results. For example, Aziz et al. [25] selected the best site to drill groundwater wells in the Fadak farm, South Iraq for irrigations purposes. The optimal location was selected depending on the hydrogeophysical data including resistivity, depth, thickness, and transmissivity of the aquifer. These parameters were integrated precisely into GIS to find the preferable sites. Finally, the region was divided into three classes; good, medium, and bad. In addition, Ebuka et al. [19] selected the best drilling site of new groundwater exploration wells using GIS. The optimal locations were selected depending on the geophysical data including longitudinal conductance, aquifer thickness, apparent resistivity, and transmissivity. According to the results, the region was divided into three classes; not suitable, moderately suitable and highly suitable with respect to the input factors using the Fuzzy overly method. Khalil et al. [48] used Landsat (ETM+) images, GIS, hydrological modeling and geoelectrical resistivity techniques, in an integrated manner, to identify the groundwater potentialities in West Sinai, Egypt. The results revealed the successful integration amongst the geoelectrical parameters, hydrological data, and GIS in the site selection process to identify the optimum locations for dam construction.
In this study, GIS-based Multi-Criteria Decision Approach is used to identify suitable locations to use groundwater for irrigation purposes in Salah-Al-Din Governorate. Various criteria are adopted including Electrical Conductivity (EC), Power of Hydrogen (pH), Sodium percentage (Na%), Sodium Adsorption Ratio (SAR), Magnesium Adsorption Ratio (MAR), Kelly’s Ratio (KR), climate factor, aquifer thickness, and aquifer elevation. The criteria layers are assessed using the MCDA by combining them using the weighted overlay function in ArcGIS 10.5. Appropriate weights are assigned and integrated into GIS to create the groundwater suitability map for irrigation. The final suitability map is classified into three categories, high suitability, low suitability and unsuitable (excluded) as shown in Figure 17. In addition, the total area and percentage are determined for each class as shown in Table 6.

4. Conclusions

This study is directed to identify the suitable groundwater location for irrigation purposes in Salah Al-Din Governorate, Iraq. Three datasets are integrated to produce the suitability model, including geophysical data, groundwater wells data and satellite-based climate data to define the groundwater quality and quantity. The criteria layers are assessed using the MCDA approach by combining them using the weighted overlay function in ArcGIS 10.5. Weighted overlay of the geospatial dataset seems to be an effective method to identify the suitability classes of groundwater for irrigation purposes in this study. Integration of GIS technology with MCDA can provide a good guideline regarding the identification of groundwater natural resource condition and for the sustainability of this valuable resource. According to the irrigation water classification based on electrical conductivity, it can be concluded that the water of the study area falls in the high saline category that may harm the plants with low tolerance to salinity. The suitability of the study area for irrigation purposes is classified into three classes according to the set criteria used for this purpose: high suitability (35.41% of the total area), low suitability (44.22% of the total area), and unsuitable (20.37% of the total area) depending on the specific criteria used for this purpose. It is suggested that this classification is to be adopted by farmers in the study region, plan makers and governmental authorities. Further studies in this field are recommended to establish a cornerstone for a planned, scientifically based approach for water management in Iraq. The resulted information should be available for all persons involved in the agricultural sector in Salah Al-Din governorate.

Author Contributions

Methodology N.A.A.; software N.A.A.; supervision, H.H.K. and I.A.A.; writing—original draft preparation, N.A.A.; writing—review and editing, H.H.K., and I.A.A.

Funding

This research received no external funding.

Conflicts of Interest

The authors declare no conflict of interest.

References

  1. Alwan, I.A.; Karim, H.H.; Aziz, N.A. Investigate the optimum agricultural crops production seasons in Salah Al-Din Governorate utilizing climate remote sensing data and Agro-climatic zoning. Iraqi J. Sci. 2019. accepted. [Google Scholar]
  2. Food and Agriculture Organization of the United Nations (FAO). Iraq—Agriculture Sector Note: Country Highlights; Report No. 4; Investment Centre Division 2012: Rome, Italy, 2011. [Google Scholar]
  3. Iraq Energy Institute. Towards Sustainable Water Resources Management in Iraq; Iraq Energy Institute: Erbil, Iraq, 2018. [Google Scholar]
  4. Zektser, I.S.; Everett, L. Groundwater Resources of the World: And Their Use; IhP Series on Groundwater. No. 6; Unesco: Paris, France, 2004. [Google Scholar]
  5. Cosgrove, W.J.; Loucks, D.P. Water management: Current and future challenges and research directions. Water Resour. Res. 2015, 51, 4823–4839. [Google Scholar] [CrossRef] [Green Version]
  6. Mohamed, S.; Ibrahim, S.; Sulaiman, W.; Latif, P. Groundwater resources assessment using integrated geophysical techniques in the southwestern region of Peninsular Malaysia. Arab. J. Geosci. 2013, 6, 4129–4144. [Google Scholar] [CrossRef]
  7. Karim, H.H.; Schanz, T.; Ibrahim, A.N. Integration between surface geoelectrical and geotechnical datasets in Salah Al-Din area, Central Iraq. Eng. Tech. J. 2013, 31, 237–261. [Google Scholar]
  8. Chowdhury, A.; Jha, M.K.; Chowdary, V.M.; Mal, B.C. Integrated remote sensing and GIS-based approach for assessing groundwater potential in West Medinipur district, West Bengal, India. Int. J. Remote Sens. 2009, 30, 231–250. [Google Scholar] [CrossRef]
  9. Chan, F.; Kumar, N.; Tiwar, M.; Lau, H.; Choy, K. Global supplier selection: A fuzzy-AHP approach. Int. J. Prod. Res. 2008, 46, 3825–3857. [Google Scholar] [CrossRef]
  10. Convertino, M.; Baker, K.; Vogel, J.; Lu, C.; Suedel, B.; Linkov, I. Multi-criteria decision analysis to select metrics for design and monitoring of sustainable ecosystem restorations. Ecol. Indic. 2013, 26, 76–86. [Google Scholar] [CrossRef] [Green Version]
  11. Mileu, N.; Queirós, M. Integrating Risk Assessment into Spatial Planning: RiskOTe Decision Support System. ISPRS Int. J. Geo Inf. 2018, 7, 184. [Google Scholar] [CrossRef]
  12. Wang, Y.; Hong, H.; Chen, W.; Li, S.; Pamučar, D.; Gigović, L.; Drobnjak, S.; Tien Bui, D.; Duan, H. A Hybrid GIS Multi-Criteria Decision-Making Method for Flood Susceptibility Mapping at Shangyou, China. Remote Sens. 2019, 11, 62. [Google Scholar] [CrossRef]
  13. Gigović, L.; Pamučar, D.; Bajić, Z.; Drobnjak, S. Application of GIS-Interval Rough AHP Methodology for Flood Hazard Mapping in Urban Areas. Water 2017, 9, 360. [Google Scholar] [CrossRef]
  14. Jeong, J.S.; García-Moruno, L.; Hernández-Blanco, J. A site planning approach for rural buildings into a landscape using a spatial multi-criteria decision analysis methodology. Land Use Policy 2013, 32, 108–118. [Google Scholar] [CrossRef]
  15. Gühnemann, A.; Laird, J.; Pearman, A. Combining cost-benefit and multi-criteria analysis to prioritise a national road infrastructure programme. Transp. Policy 2012, 23, 15–24. [Google Scholar] [CrossRef]
  16. Gigović, L.; Pamučar, D.; Lukić, D.; Marković, S. GIS-Fuzzy DEMATEL MCDA model for the evaluation of the sites for ecotourism development: A case study of “Dunavski ključ” region, Serbia. Land Use Policy 2016, 58, 348–365. [Google Scholar] [CrossRef]
  17. Gigović, L.; Pamučar, D.; Božanić, D.; Ljubojević, S. Application of the GIS-DANP-MABAC multi-criteria model for selecting the location of wind farms: A case study of Vojvodina, Serbia. Renew. Energy 2017, 103, 501–521. [Google Scholar] [CrossRef]
  18. Abudeif, A.M.; Abdel Moneim, A.A.; Farrag, A.F. Multicriteria decision analysis based on analytic hierarchy process in GIS environment for siting nuclear power plant in Egypt. Ann. Nucl. Energy 2015, 75, 682–692. [Google Scholar] [CrossRef]
  19. Ebuka, A.O.; Aziz, N.A.; Abdulrazzaq, Z.T.; Etuk, S.E. Integrated Geophysical Data and GIS Technique to Forecast the Potential Groundwater Locations in Part of South Eastern Nigeria. Iraqi J. Sci. 2019, 60, 1013–1022. [Google Scholar]
  20. Gigović, L.; Pamučar, D.; Bajić, Z.; Milićević, M. The Combination of Expert Judgment and GIS-MAIRCA Analysis for the Selection of Sites for Ammunition Depots. Sustainability 2016, 8, 372. [Google Scholar] [CrossRef]
  21. Chowdhury, A.; Madan, K.J.; Chowdary, V.M.; Mal, B.C. Selection of artificial recharge zones in West Midnapur district of West Bengal, India, A GIS approach. In Proceedings of the International Conference on Groundwater Dynamics and Global Change, Jaipur, India, 19–22 March 2008. [Google Scholar]
  22. Jha, M.; Chowdary, V.M.; Chowdhury, A. Groundwater assessment in Salboni Block, West Bengal (India) using remote sensing, geographical information system and multi-criteria decision analysis techniques. Hydrogeol. J. 2010, 18, 1713–1728. [Google Scholar] [CrossRef]
  23. Adiat, K.; Nawawi, M.; Abdullah, K. Application of Multi-Criteria Decision Analysis to geoelectric and geologic parameters for spatial prediction of groundwater resources potential and aquifer evaluation. Pure Appl. Geophys. 2013, 170, 453. [Google Scholar] [CrossRef]
  24. Mogaji, K.A.; Lim, S.H. Groundwater potentiality mapping using geoelectrical-based aquifer hydraulic parameters: A GIS-based multi-criteria decision analysis modeling approach. Terr. Atmos. Ocean. Sci. 2017, 28, 479–500. [Google Scholar] [CrossRef] [Green Version]
  25. Aziz, N.A.; Hasan, R.H.; Abdulrazzaq, Z.T. Optimum site selection for groundwater wells using integration between GIS and hydrogeophysical data. Eng. Technol. J. 2018, 36, 596–602. [Google Scholar] [CrossRef]
  26. Jassim, S.Z.; Goff, J. Geology of Iraq; Dolin, Prague and Moravian Museum: Brno, The Czech Republic, 2006; p. 341. [Google Scholar]
  27. Al-Minshid, F.H. Groundwater Study at Al-Dibaii Area by Used Electrical Resistivity Survey and Wells Pumping Test Data. Master’s Thesis, University of Baghdad, Baghdad, Iraq, 2001. [Google Scholar]
  28. Al-Shehmany, H.K. Using the Shlumberger Array for Hydrogeological Investigation between Baiji and Tikrit-Iraq. Master’s Thesis, College of Science, University of Baghdad, Baghdad, Iraq, 2001. [Google Scholar]
  29. Al-Ibrahimi, A. The Use of Resistivity and Well Logging Methods to Study Tikrit Basin. Master’s Thesis, College of science, University of Baghdad, Baghdad, Iraq, 2009. [Google Scholar]
  30. Abdulrazzaq, Z.T. Application of Vertical Electrical Sounding to Delineate and Evaluate of Aquifers Characteristics in Baiji-Tikrit Basin. Master’s Thesis, College of Science, University of Tikrit, Tikrit, Iraq, 2011. [Google Scholar]
  31. Alwan, I.A.; Karim, H.H.; Aziz, N.A. Agro-Climatic Zones (ACZ) Using Climate Satellite Data in Iraq Republic. IOP Conf. Ser. Mater. Sci. Eng. 2019. [Google Scholar] [CrossRef]
  32. Abdulrazzaq, Z.T.; Aziz, N.A.; Mohammed, A.A. Flood modelling using satellite-based precipitation estimates and digital elevation model in eastern Iraq. Int. J. Adv. Geosci. 2018, 6, 72–77. [Google Scholar] [CrossRef]
  33. Matheron, G. Principles of geostatistics. Econ. Geol. 1963, 58, 1246–1266. [Google Scholar] [CrossRef]
  34. Isaaks, E.; Srivastava, R. An Introduction to Applied Geostatistics; Oxford University Press Inc.: New York, NY, USA, 1989; p. 561. [Google Scholar]
  35. Muhamad, M.Z.; Othman, F. Selection of variogram model for spatial rainfall mapping using Analytical Hierarchy Procedure (AHP). Sci. Iran. 2017, 24, 28–39. [Google Scholar] [CrossRef]
  36. Rostami, N.; HabibiB, V.; Moghadam, R.K. Comparing deterministic and geostatistical methods in spatial distribution study of soil physical and chemical properties in arid rangelands (case study: Masileh Plain, Qom, Iran). J. Rangel. Sci. 2015, 5, 181–191. [Google Scholar]
  37. Ramzan, S.; Wani, M.A.; Bhat, M.A. Assessment of spatial variability of soil fertility parameters using geospatial techniques in temperate Himalayas. Int. J. Geosci. 2017, 8, 1251–1263. [Google Scholar] [CrossRef]
  38. Mahdian, M.H.; Rahimi Bandarabady, S.; Sokouti, R.; Norouzi Banis, Y. Appraisal of the geostatistical methods to estimate monthly and annual temperature. J. Appl. Sci. 2009, 9, 128–134. [Google Scholar] [CrossRef]
  39. Yang, F.-g.; Cao, S.-y.; Liu, X.-n.; Yang, K.-j. Design of groundwater level monitoring network with ordinary Kriging. J. Hydrodyn. B 2008, 20, 339–346. [Google Scholar] [CrossRef]
  40. Thornde, W.; Petersohn, B. Irrigated Soils, 2nd ed.; The Blakiston Company: New York, NY, USA, 1954. [Google Scholar]
  41. Kovda, V.A. Irrigation, Drainage and Salinity; Hutchinson Co.: London, UK, 1973. [Google Scholar]
  42. WHO (World Health Organization). Guidelines for Drinking Water Quality, 3rd ed.; WHO: Geneva, Switzerland, 2006. [Google Scholar]
  43. Richards, L.A. Diagnosis and Improvement of Saline and Alkali Soils; United States Department of Agriculture: Washington, DC, USA, 1954; Volume 60, p. 160.
  44. Wilcox, L.V. Classification and Use of Irrigation Water; Circular No. 969; USDA: Washington, DC, USA, 1955.
  45. Szabolcs, I.; Darab, C. The Influence of irrigation water of high sodium carbonate content of soils. In Proceedings of the 8th International Congress of ISSS, Trans, Hungary, 1964; Volume 2, pp. 803–812. [Google Scholar]
  46. Kelly, W.P. Adsorbed Sodium, cation exchange capacity and percentage sodium adsorption in alkali soils. Science 1957, 84, 473–477. [Google Scholar]
  47. Gregor, M. Surface-and Groundwater Quality Changes in Periods of Water Scarcity; Springer Science & Business Media: Bratislava, Slovakia, 2013. [Google Scholar]
  48. Khalil, M.H.; Ahmed, K.S.; Elnahry, A.E.H.; Hasan, A.N. Integrated Geophysical, Remote Sensing and GIS Studies for Groundwater Assessment, Abu Zenima Area, West Sinai, Egypt. Int. J. Geosci. 2014, 5, 882–907. [Google Scholar] [CrossRef] [Green Version]
Figure 1. Location of the study area (based on Landsat 8 image-March 2017).
Agriengineering 01 00023 g001
Figure 2. Distribution of VES data points.
Agriengineering 01 00023 g002
Figure 3. Vertical electrical sounding (VES) data: (A) Aquifer thickness, (B) Aquifer elevation.
Agriengineering 01 00023 g003
Figure 4. Annual time-averaged map of precipitation based on TRMM data.
Agriengineering 01 00023 g004
Figure 5. Time-averaged map of near-surface air temperature based on the GLDAS model.
Agriengineering 01 00023 g005
Figure 6. Groundwater wells distribution.
Agriengineering 01 00023 g006
Figure 7. Interpolation map for Electrical Conductivity (EC) values of the study area.
Agriengineering 01 00023 g007
Figure 8. Interpolation map for pH values of the study area.
Agriengineering 01 00023 g008
Figure 9. Interpolation map for sodium adsorption ratio (SAR) values of the study area.
Agriengineering 01 00023 g009
Figure 10. Interpolation map for Na% values of the study area.
Agriengineering 01 00023 g010
Figure 11. Interpolation map for Magnesium Adsorption Ratio (MAR) values of the study area.
Agriengineering 01 00023 g011
Figure 12. Interpolation map for Kelly’s Ratio (KR) values of the study area.
Agriengineering 01 00023 g012
Figure 13. Interpolation map for Kf values of the study area.
Agriengineering 01 00023 g013
Figure 14. Stages of Multi-criteria evaluation.
Agriengineering 01 00023 g014
Figure 15. Groundwater suitability modeling flowchart.
Agriengineering 01 00023 g015
Figure 16. Reclassify map for the studied nine criteria.
Agriengineering 01 00023 g016
Figure 17. The suitability map.
Agriengineering 01 00023 g017
Table 1. US Salinity Laboratory’s grouping of irrigation water [41].
Classification of Water SalinityElectrical Conductivity (μs/cm)DescriptionSalt Concentration
LowO < EC < 250Used for crops irrigation on most soils.<0.20
Medium250 < EC < 750Used in case of moderate amount of leaching occurs.0.20–0.50
High750 < EC < 2250Cannot be used in soil with restricted drainage.0.50–1.50
Very high2250 < EC ≤ 5000Used under special circumstances. The soils must be permeable, irrigation water must be applied in excess to provide considerable leaching, drainage must be adequate, and salt tolerant crops should be selected.5–3
Table 2. Sodium hazard classes [40].
SAR ValueSodium Hazard Classes
0 < SAR < 10S1: Low
10 < SAR < 18S2: Medium
18 < SAR < 26S3: High
SAR > 26S4: Very High
Table 3. Classes of water based on Na%.
Na%Water Class
Up to 20Excellent
20–40Good
40–60Permissible
60–80Doubtful
>80Unsuitable
Table 4. Climatic regions classification [47].
KfArea
<60Dry, irrigation required
60–70Relatively dry
70–80Transient
80–100Wet
>100Very wet
Table 5. Standardization layers used in groundwater weighted overlay model.
No.Thematic LayerValueSourceTypeInterpolation
Method
ReclassifyWeight
1Aquifer Thickness66–347 MeterVES DataPointKriging/Gaussian1 = 347 (good)30
5 = 66 (Bad)
2Aquifer Elevation53–160 MeterVES DataPointTopo To Raster1 = 53 (good)10
5 = 160 (Bad)
3Kf Factor8.43–19.7 mm/°CSatellite-based Precipitation and TemperaturePointKriging/Spherical1 = 20 (good)10
5 = 8.43 (Bad)
4EC2700–5400 μs/cmGroundwater WellsPointKriging/Spherical1 = 2700 (good)10
5 = 5400 (Bad)
5SAR7.54–41.1 ppmGroundwater WellsPointKriging/Exponential1 = 7 (good)5
5 = 41 (Bad)
6NA%20.5–64.6 ppmGroundwater WellsPointKriging/Exponential1 = 19 (good)5
5 = 65 (Bad)
7MAR8.75–45.8 ppmGroundwater WellsPointKriging/Exponential1 = 8 (good)10
5 = 45 (Bad)
8Kr0.259–2.27Groundwater WellsPointKriging/Exponential1 = 0.2 (good)10
5 = 2.2 (Bad)
9pH5.93–8.54Groundwater WellsPointKriging/Exponential1 = 6 (good)10
5 = 8.5 (Bad)
Table 6. Percent area under the three category.
CategoryArea (km2)Percentage
High suitability1999.4835.41%
Low suitability2496.2344.22%
Unsuitable 1150.3820.37%
Total Area5646.09 km2