An Algorithm for Severity Estimation of Plant Leaf Diseases by the Use of Colour Threshold Image Segmentation and Fuzzy Logic Inference: A Proposed Algorithm to Update a “Leaf Doctor” Application


Abstract
:1. Introduction and Related Work
2. Tools and Methods
2.1. Tools
2.2. Methodology
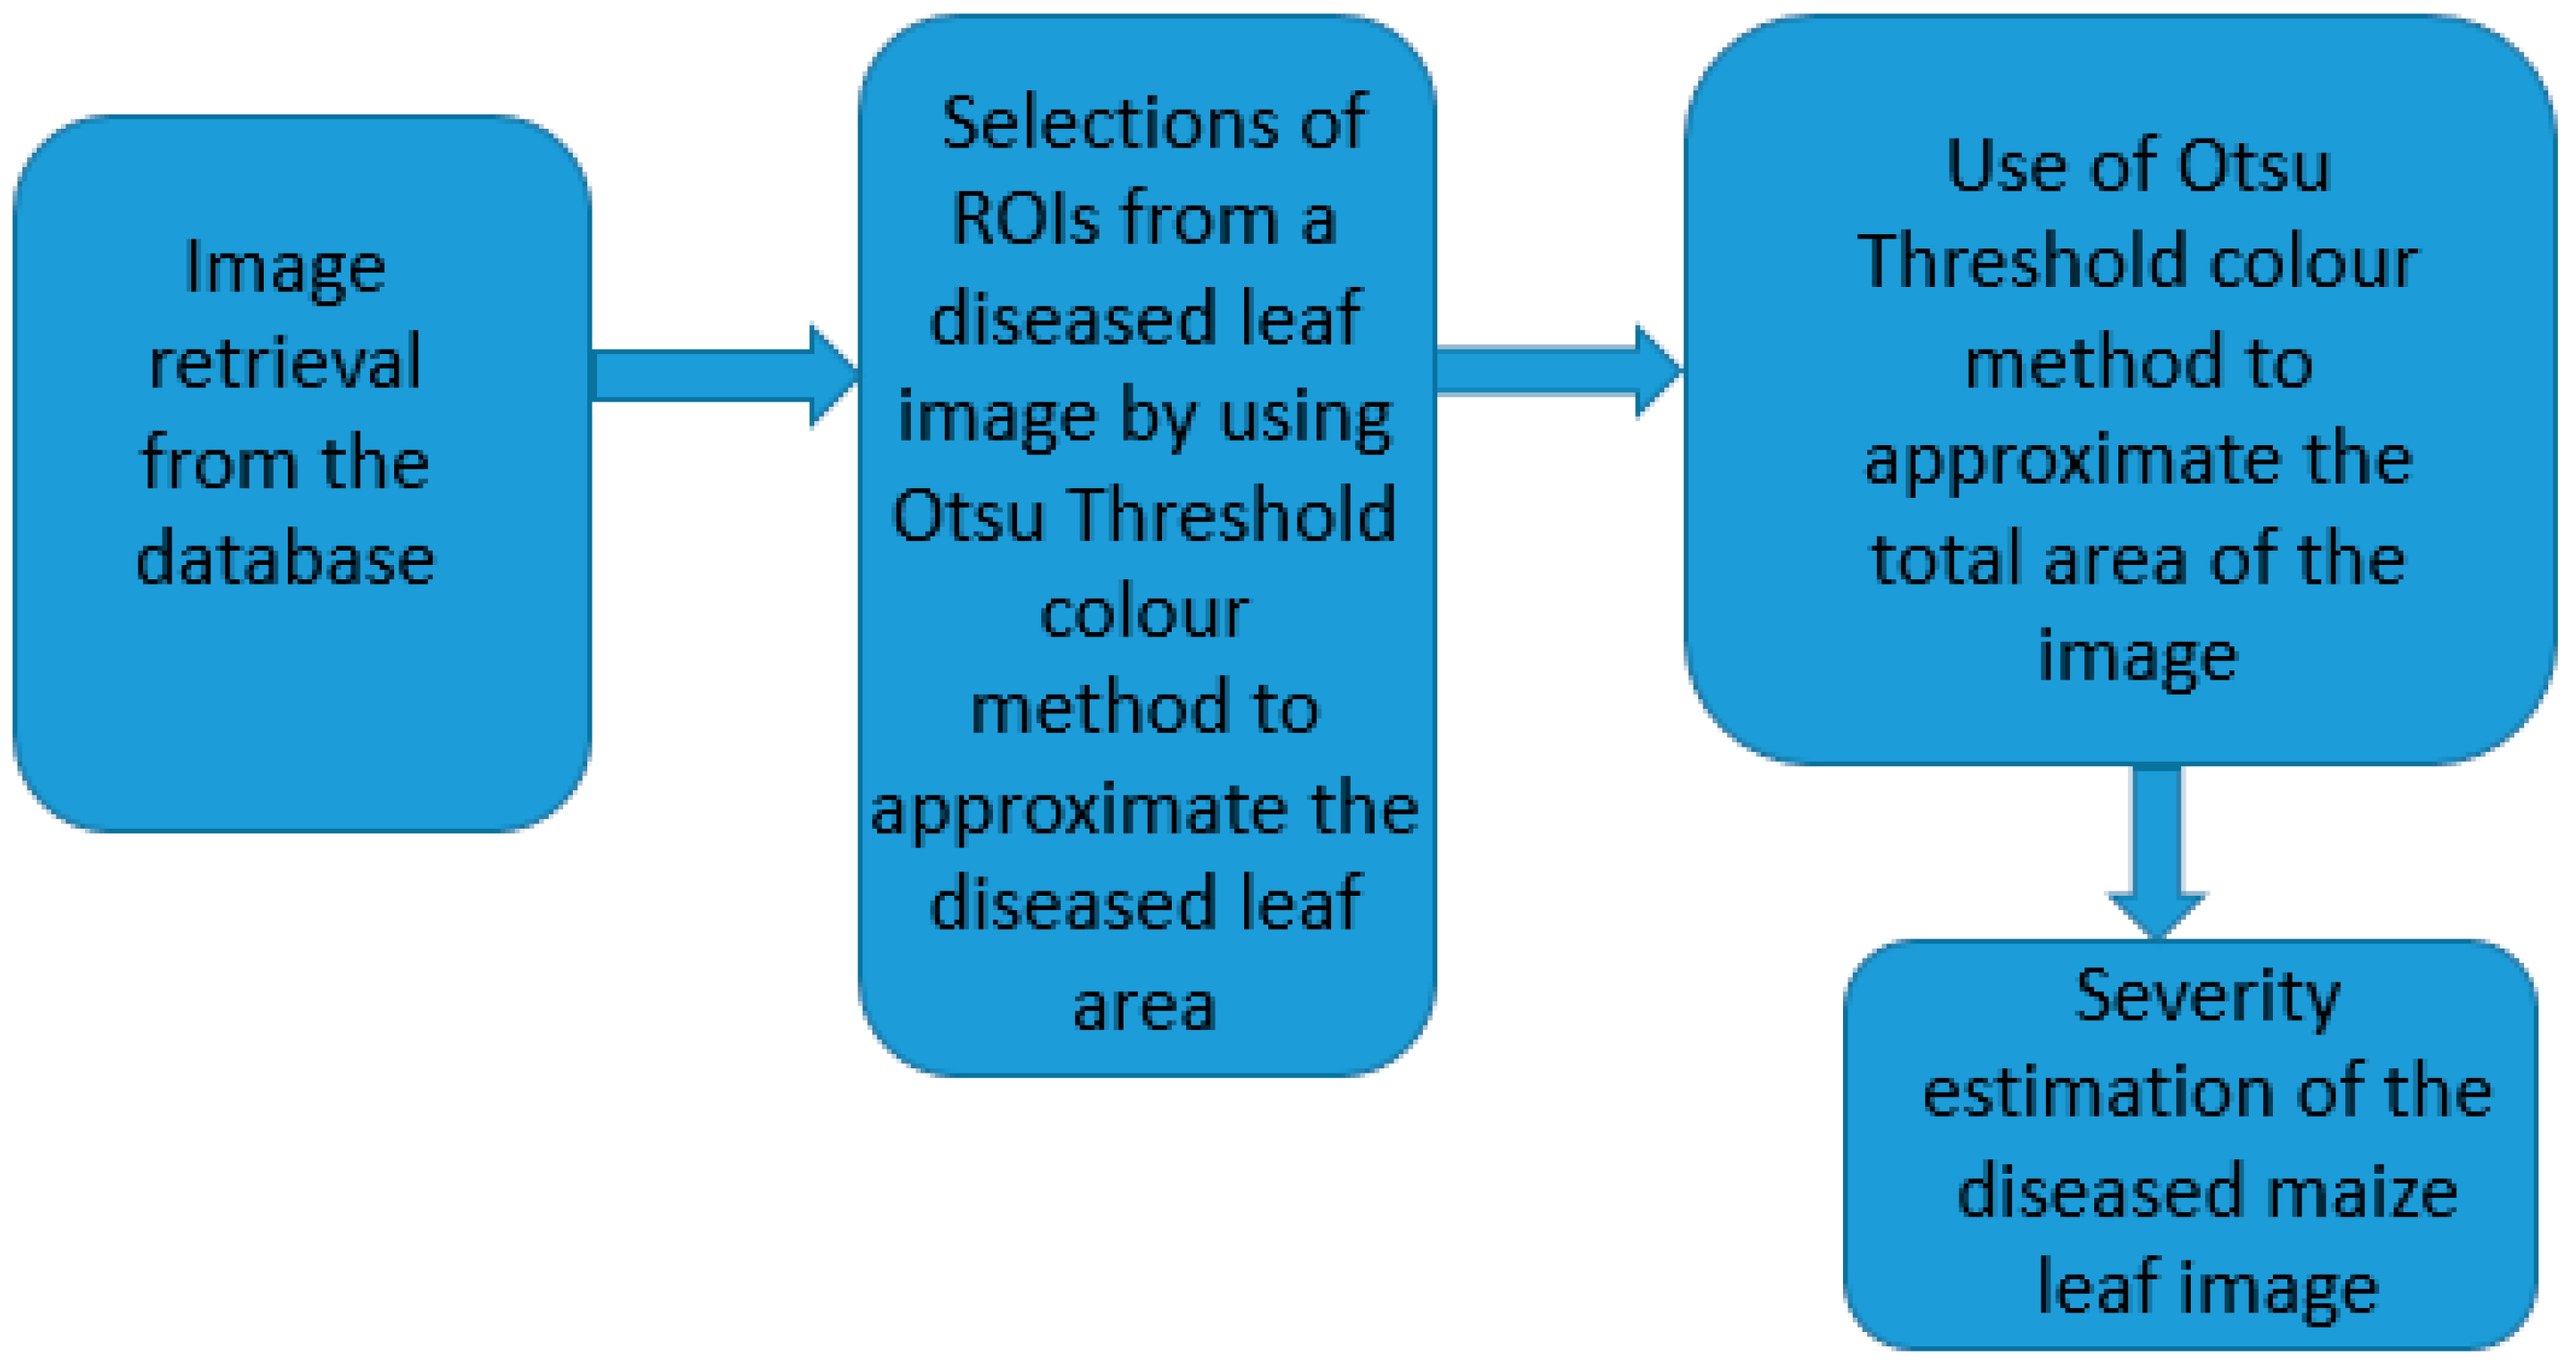
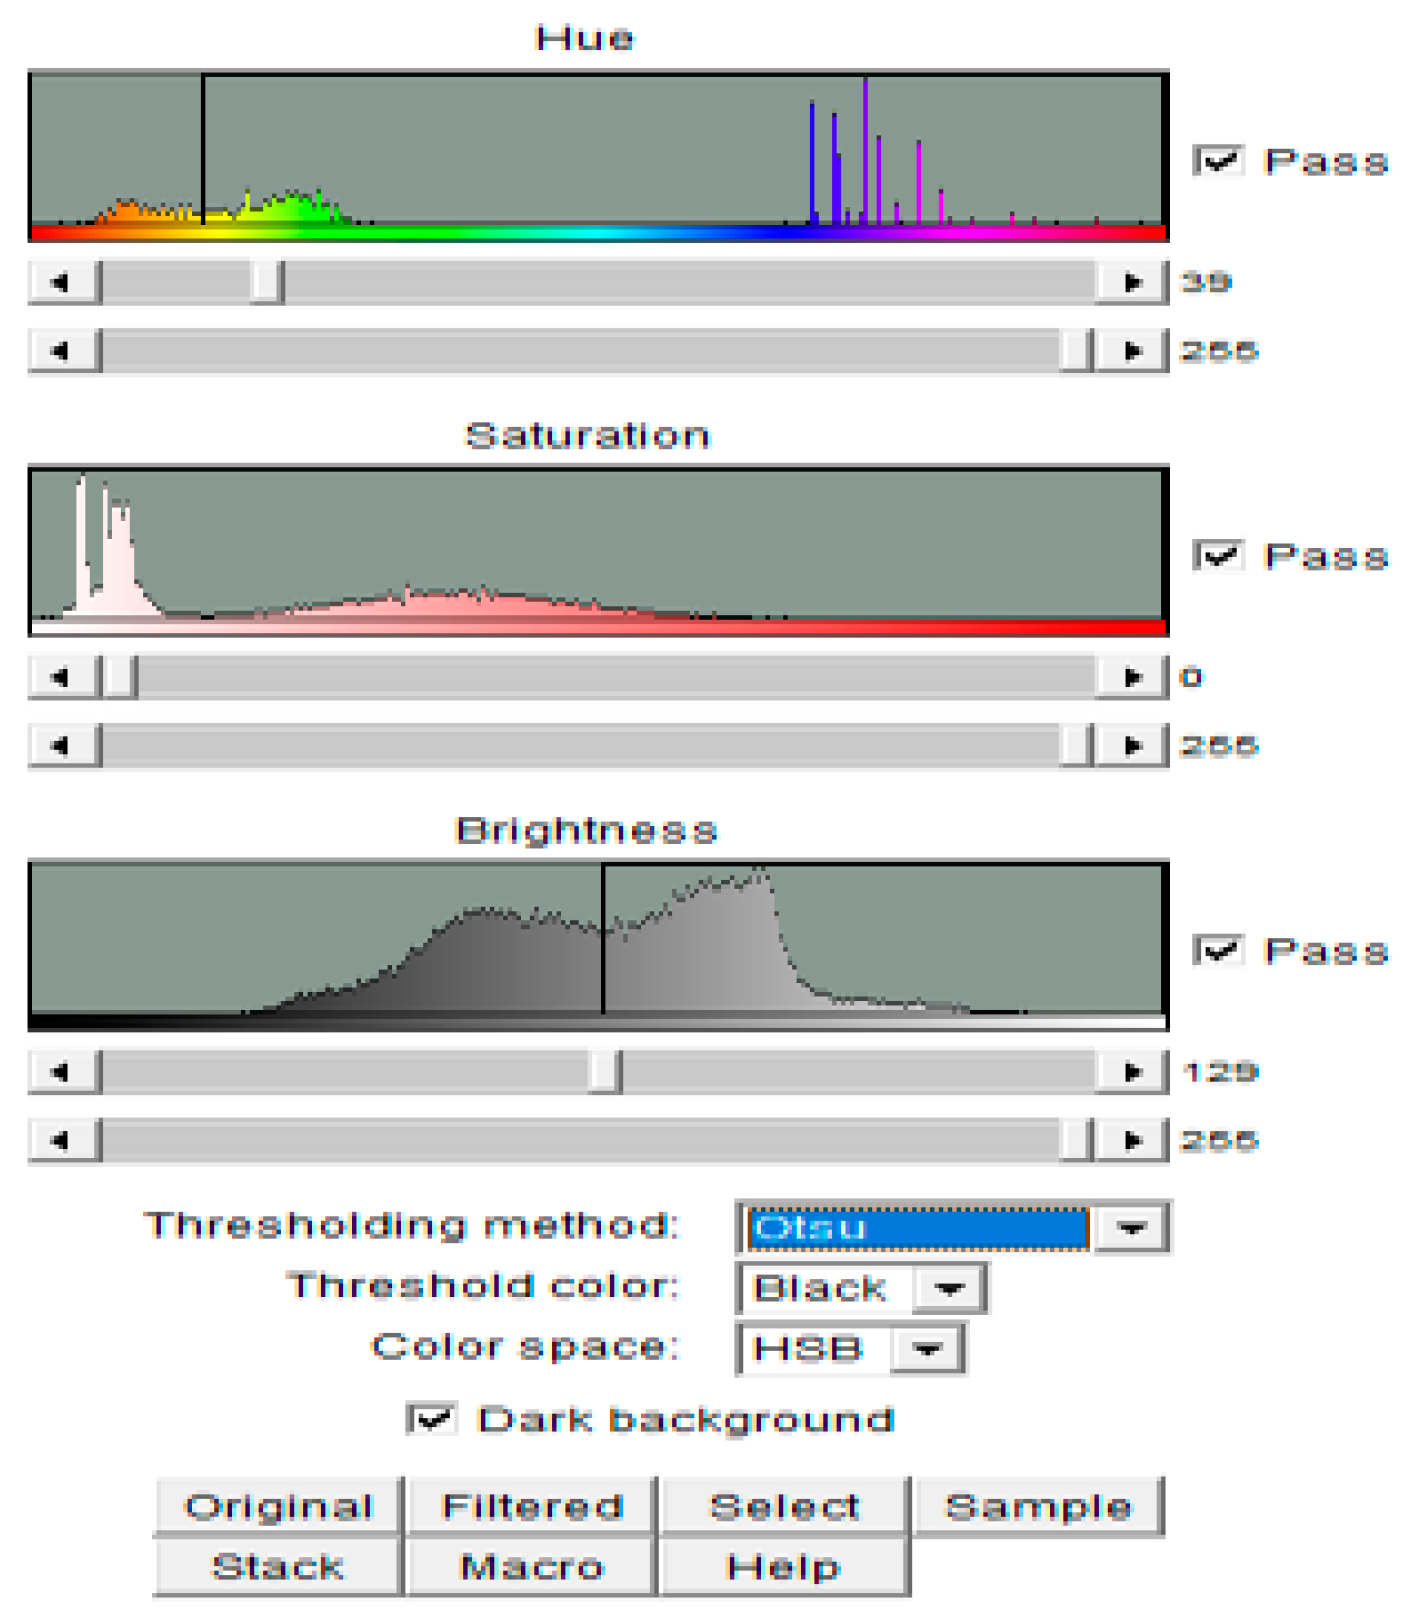
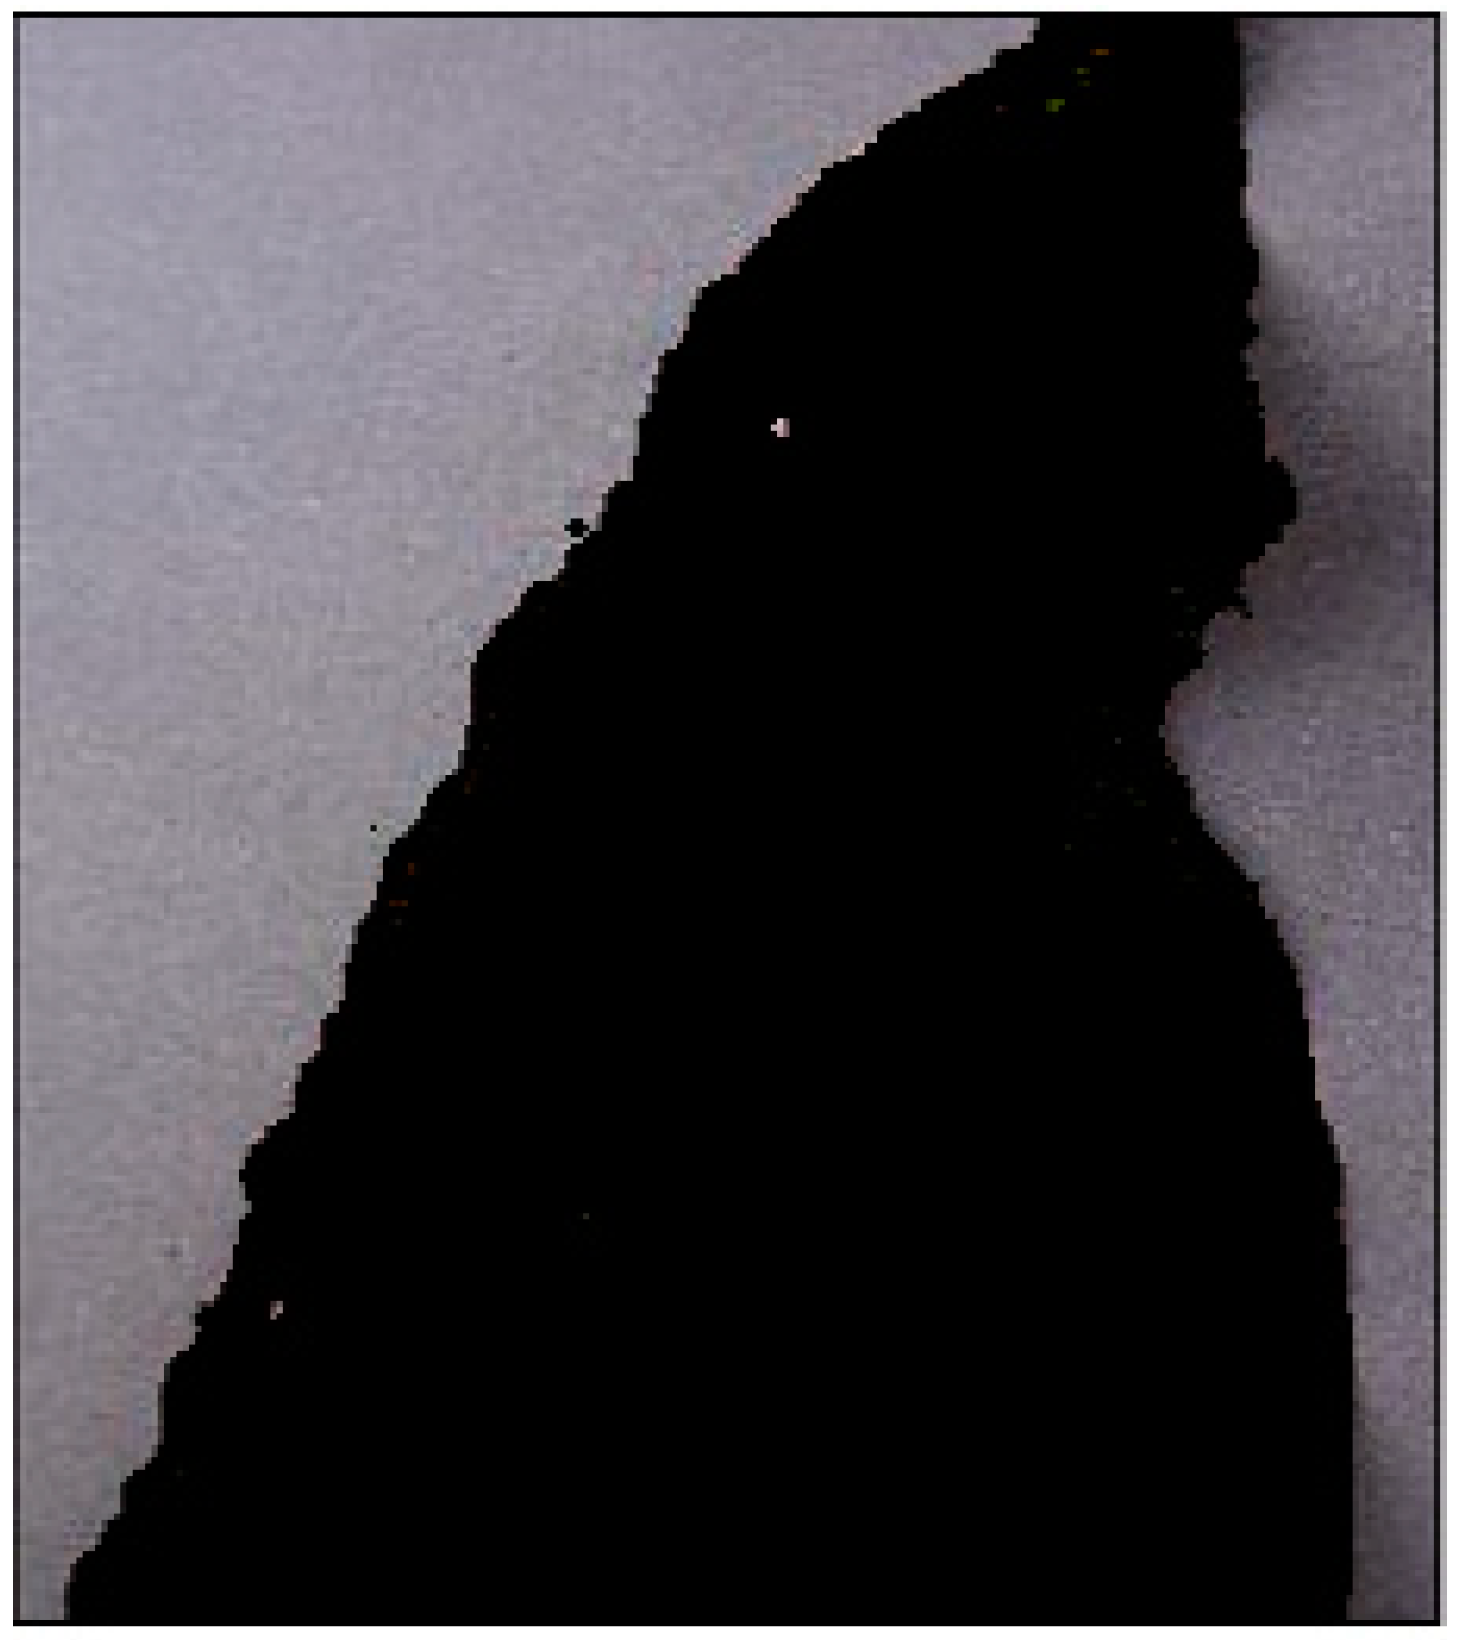
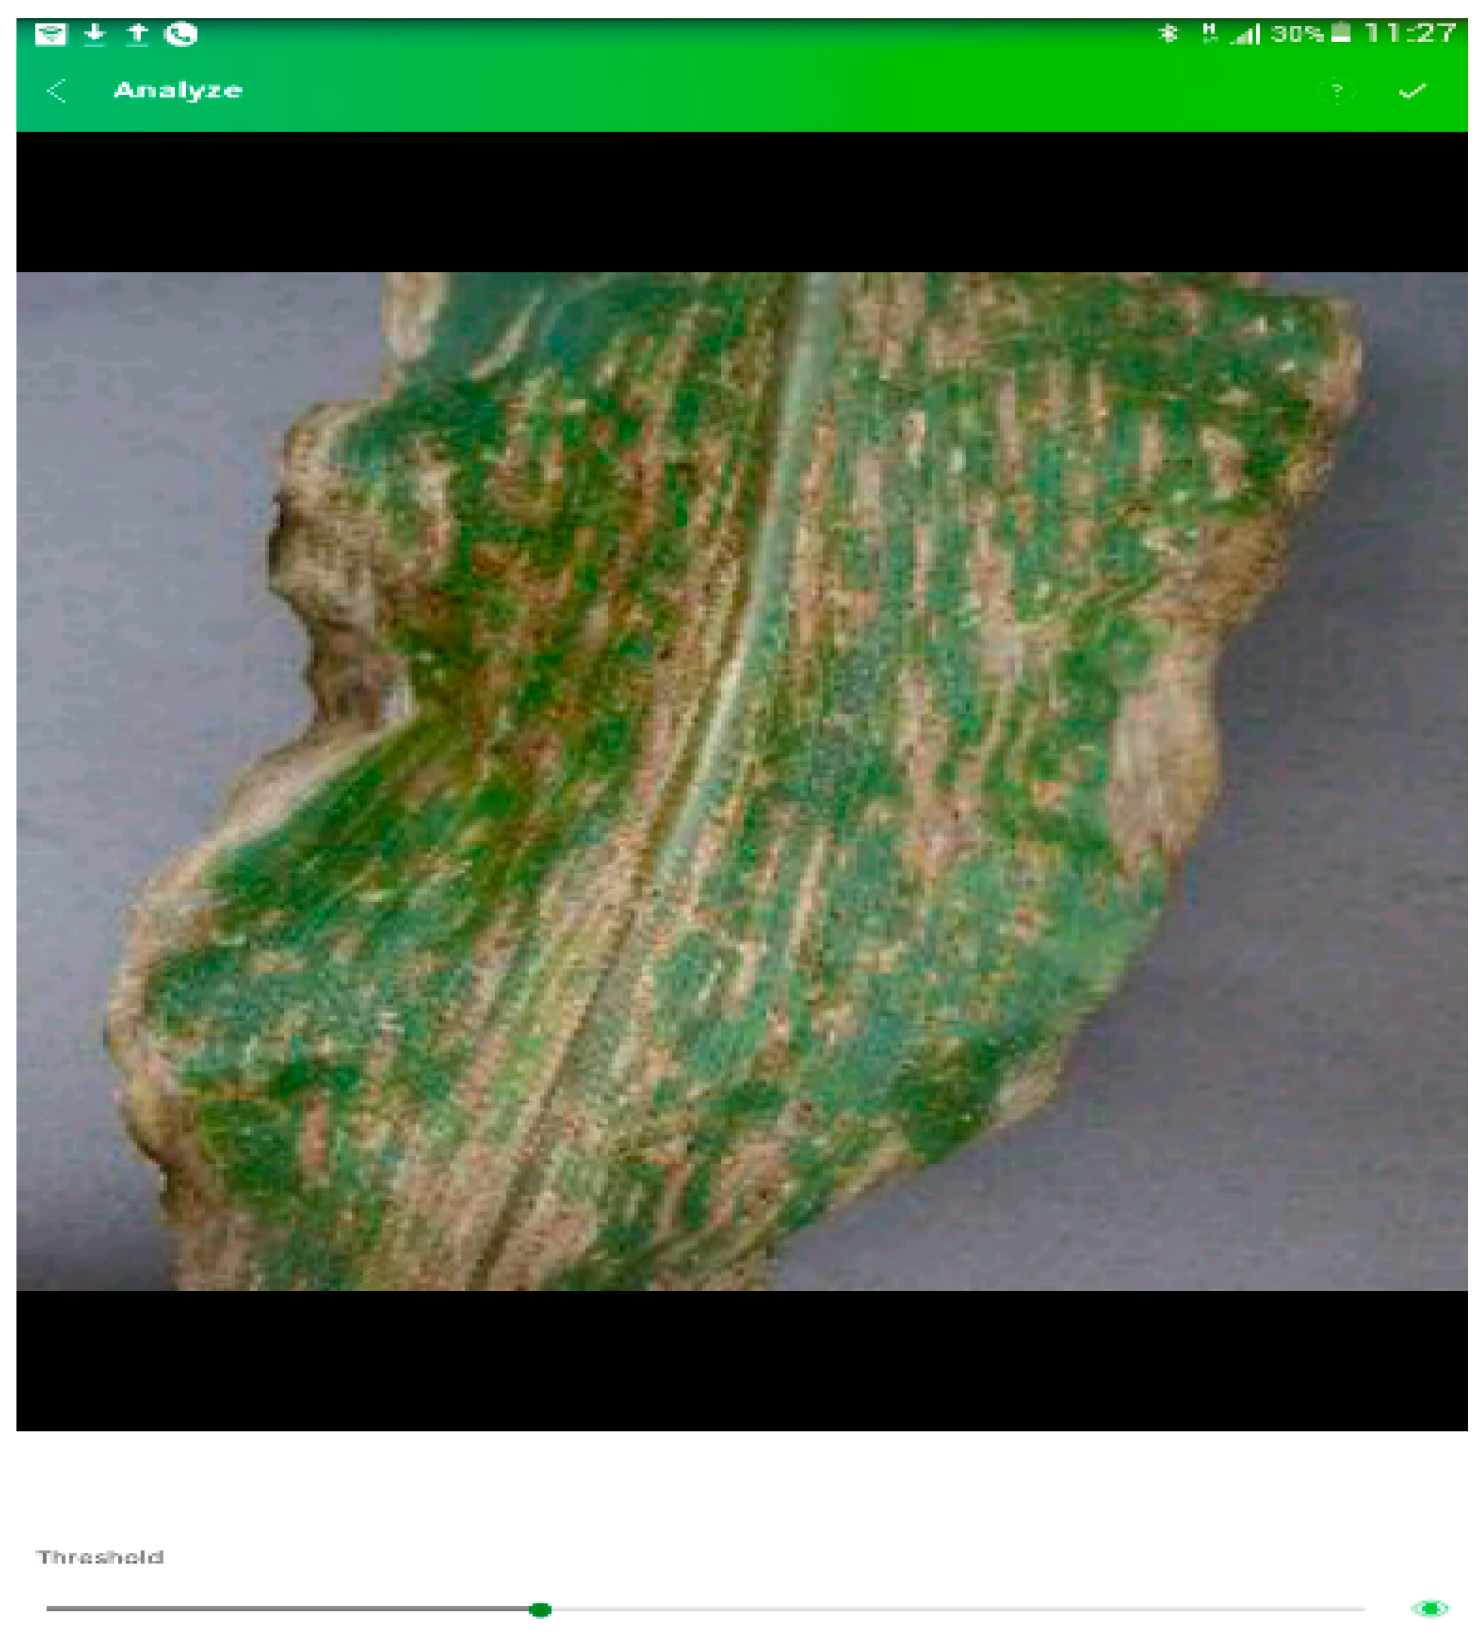
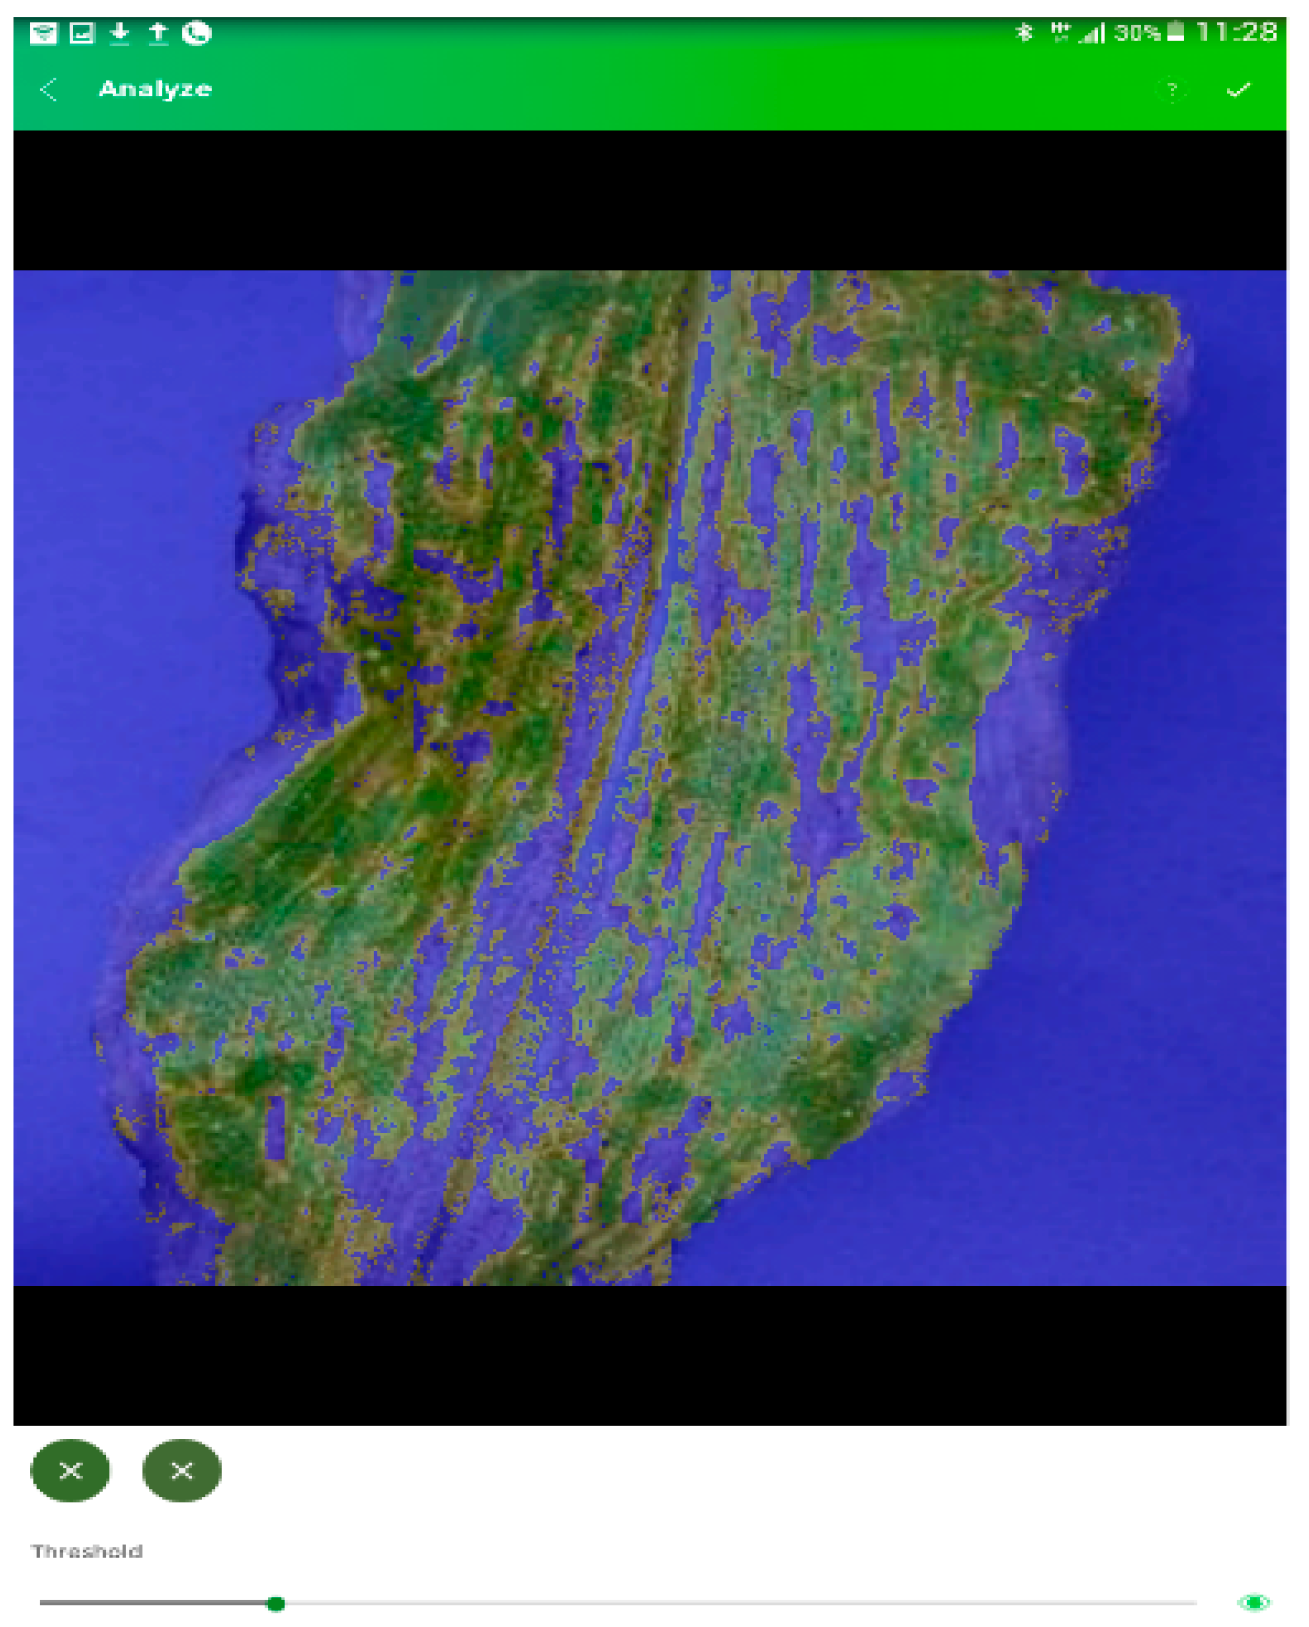
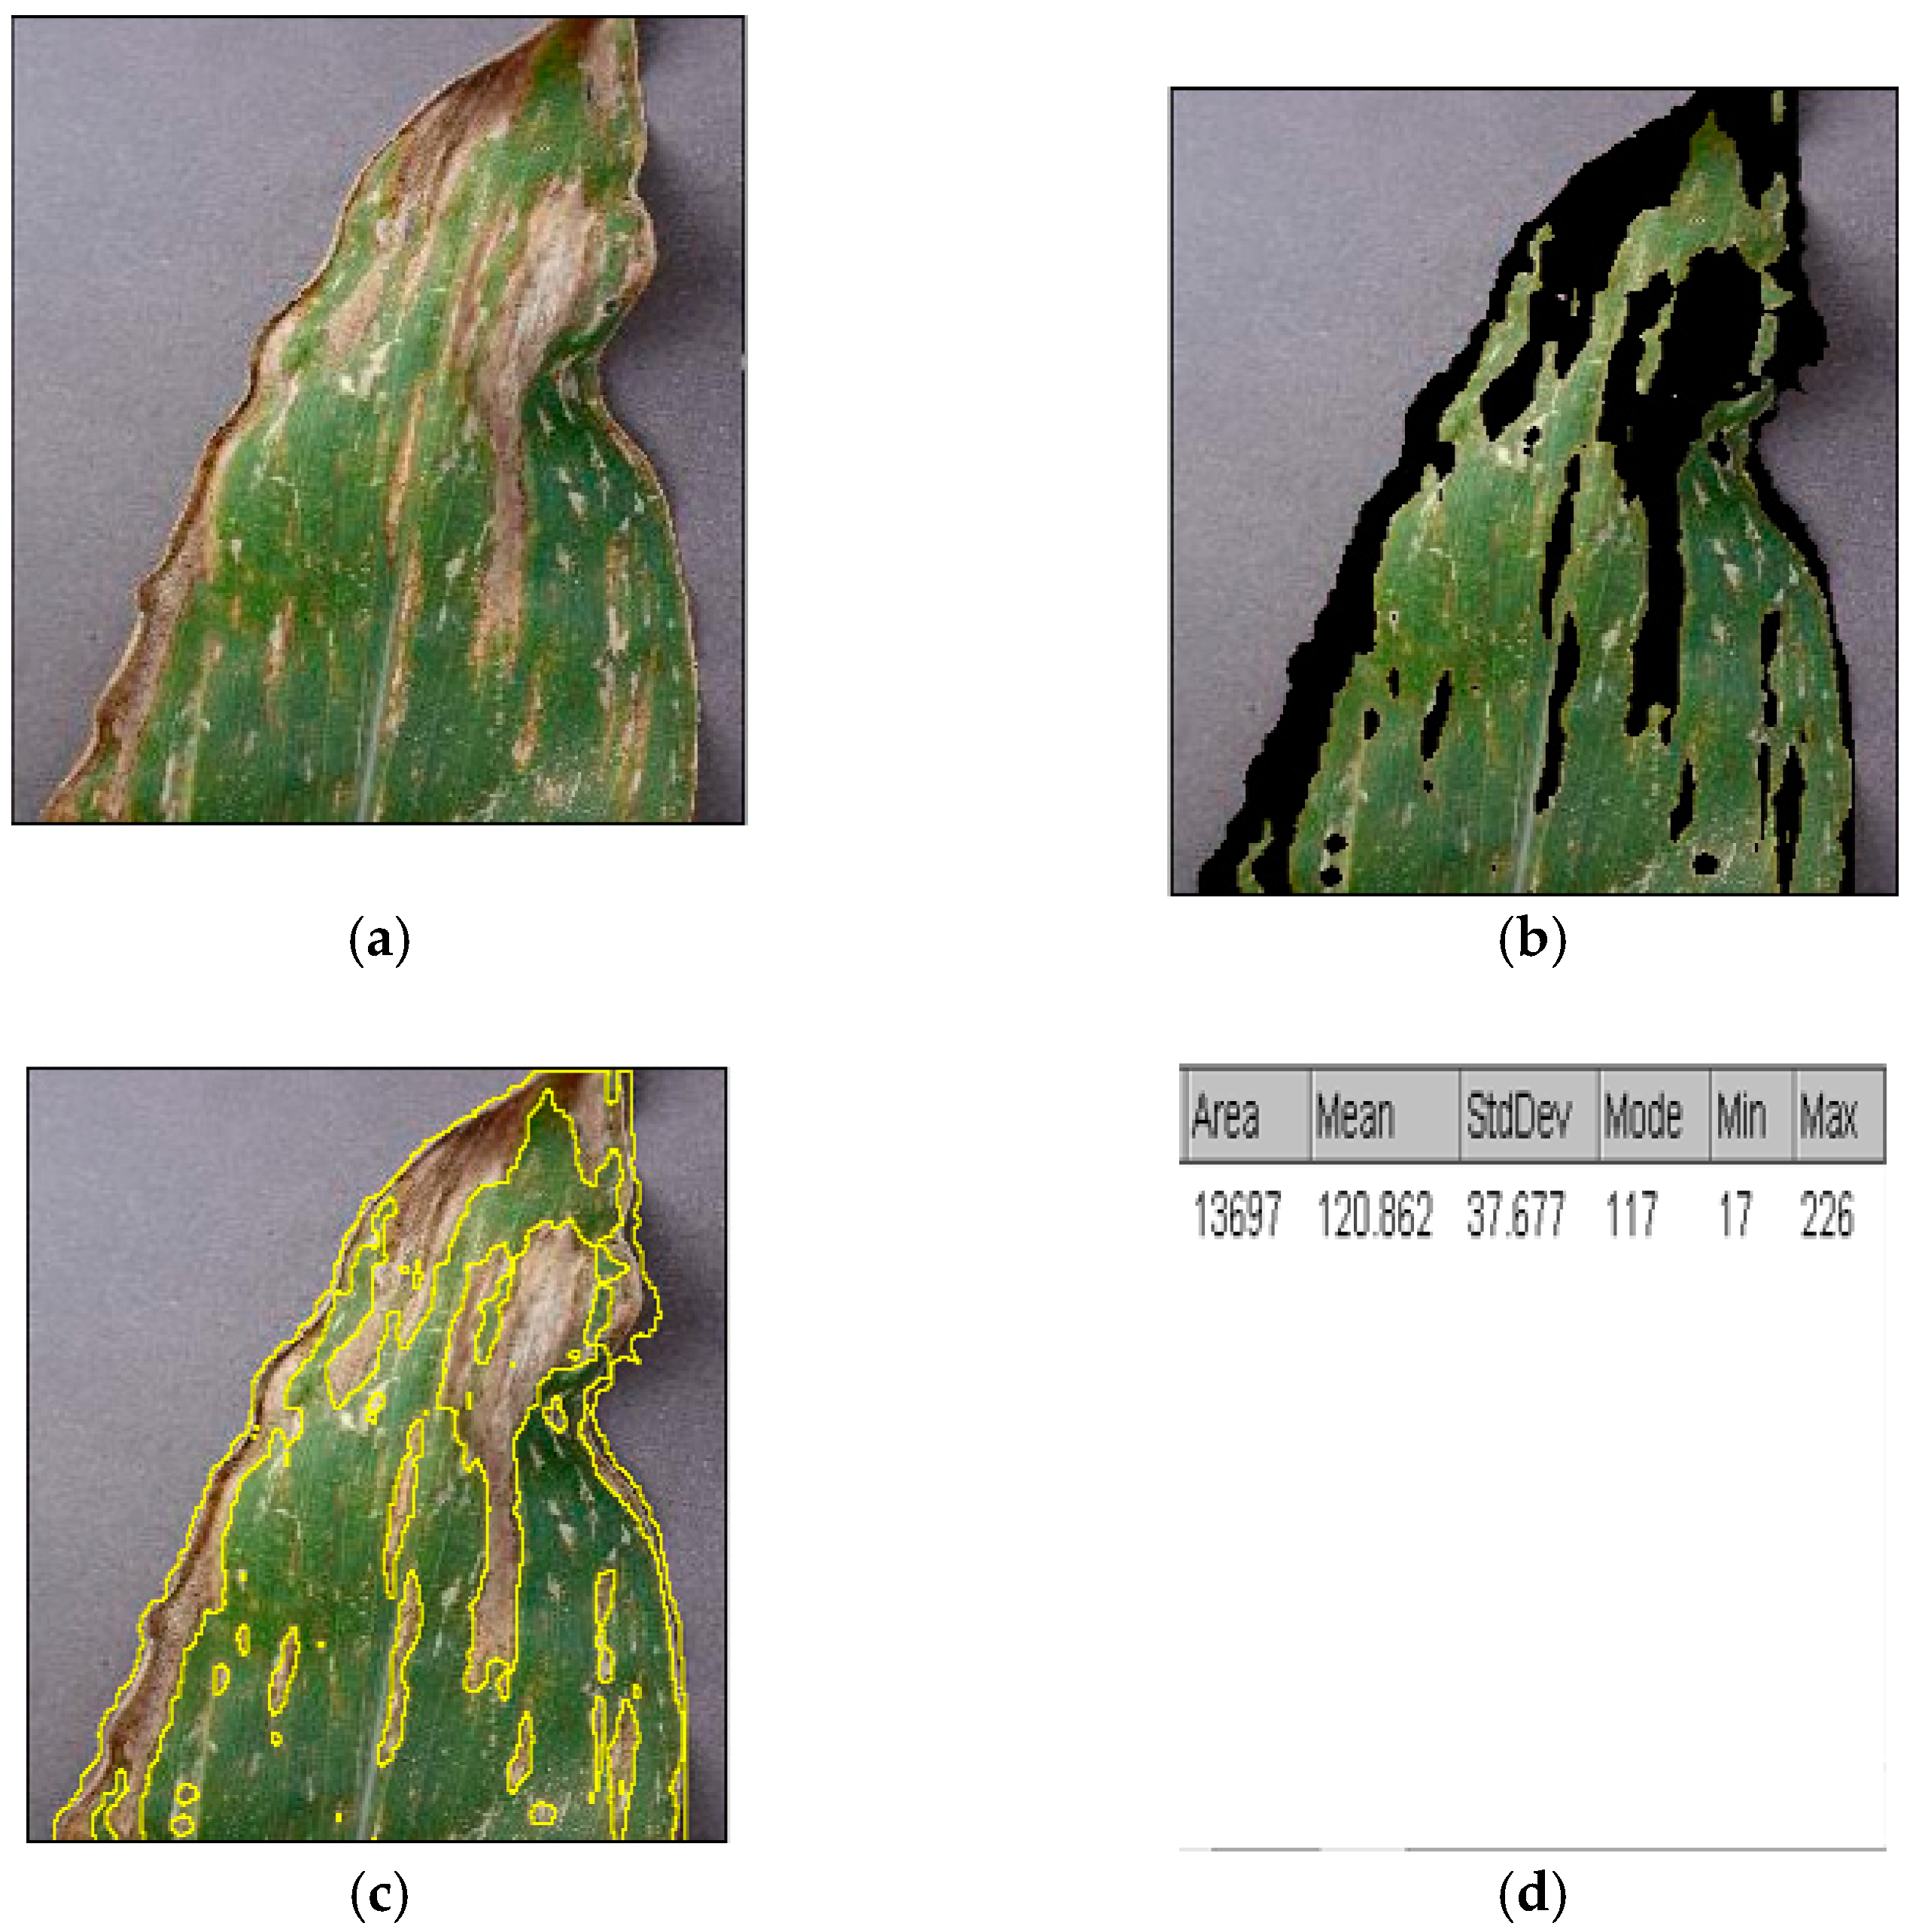
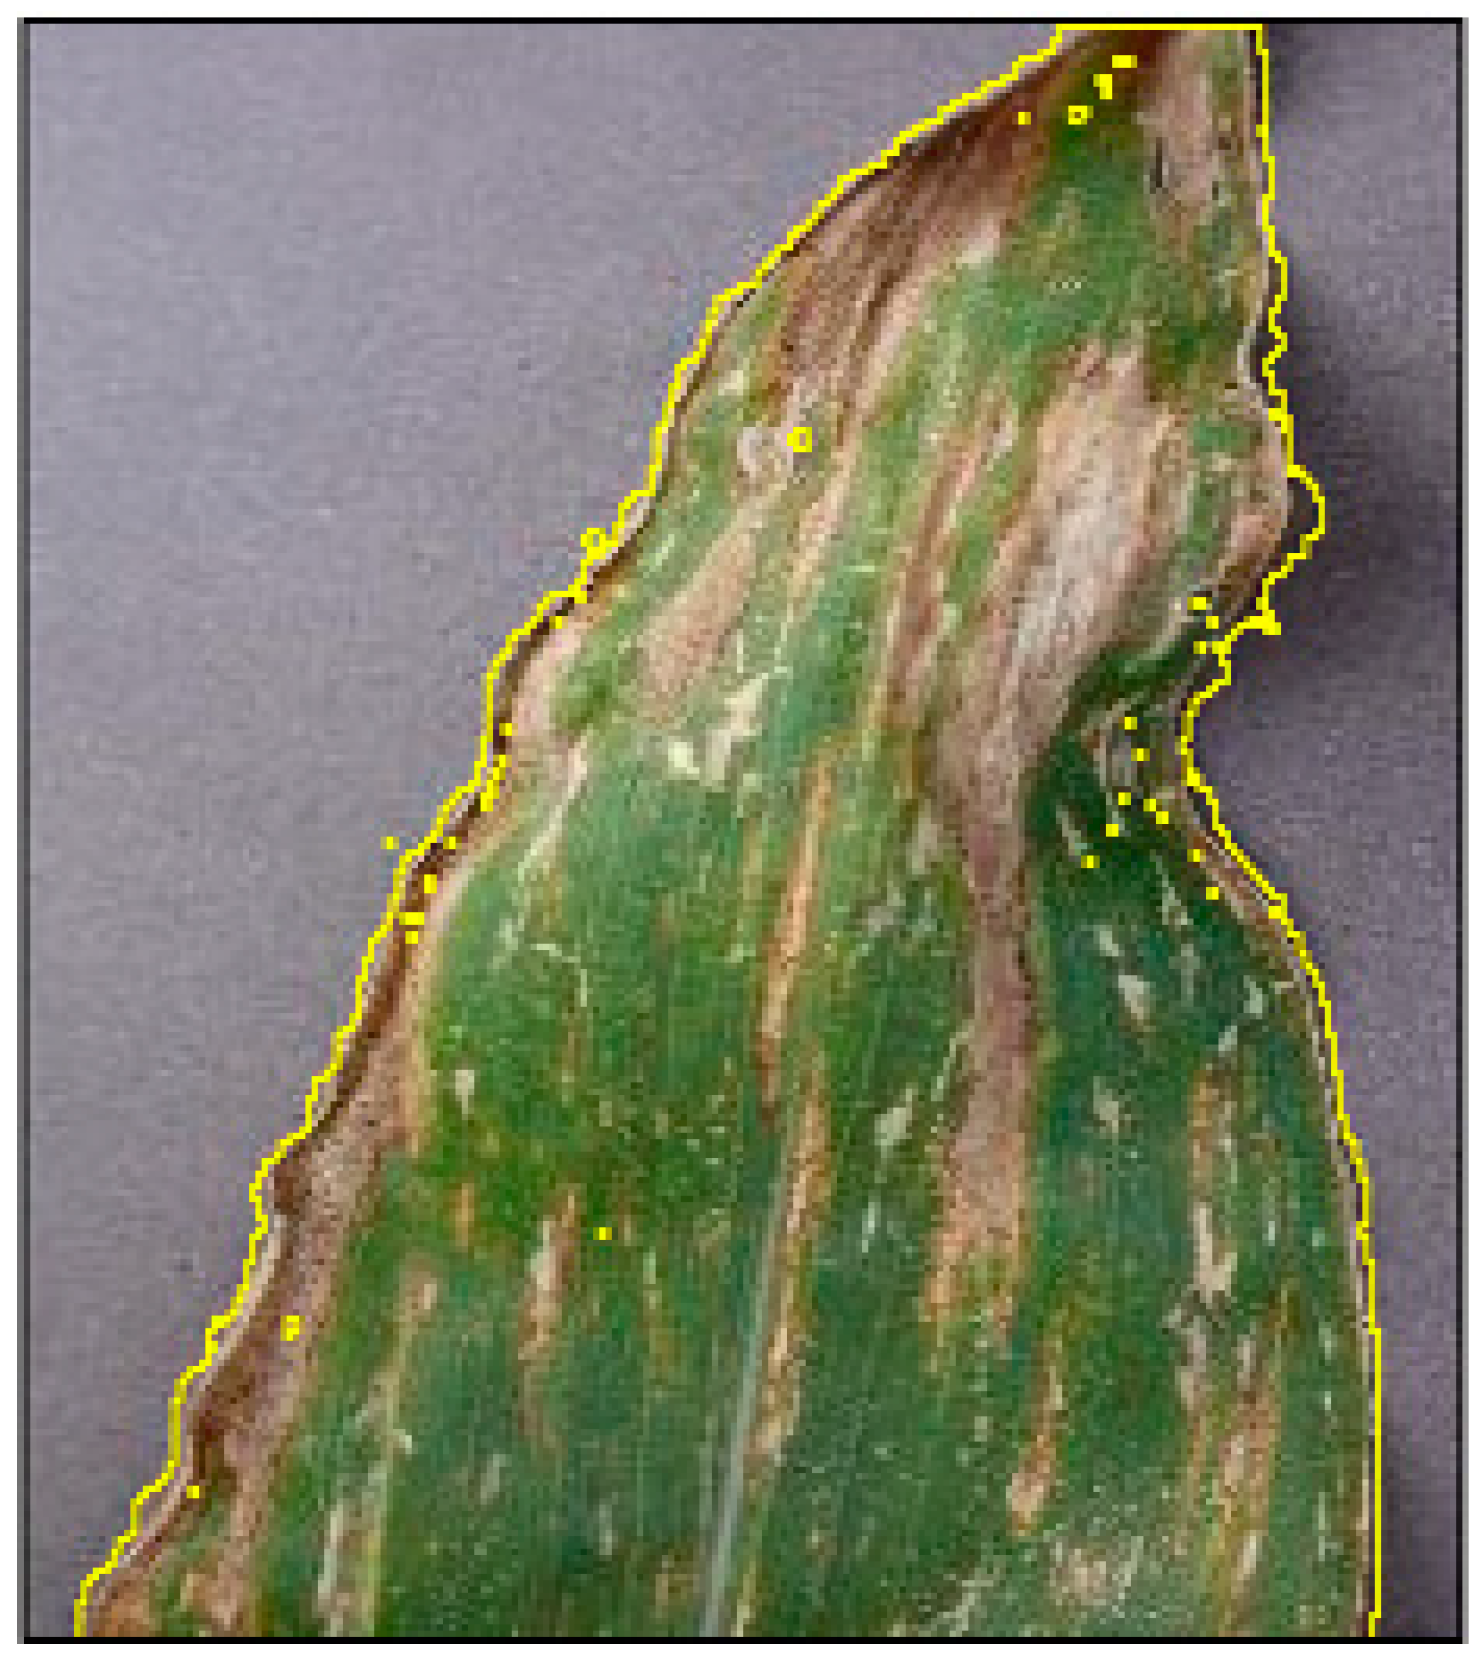
2.3. Procedure of Image Segmentation by Threshold Colour
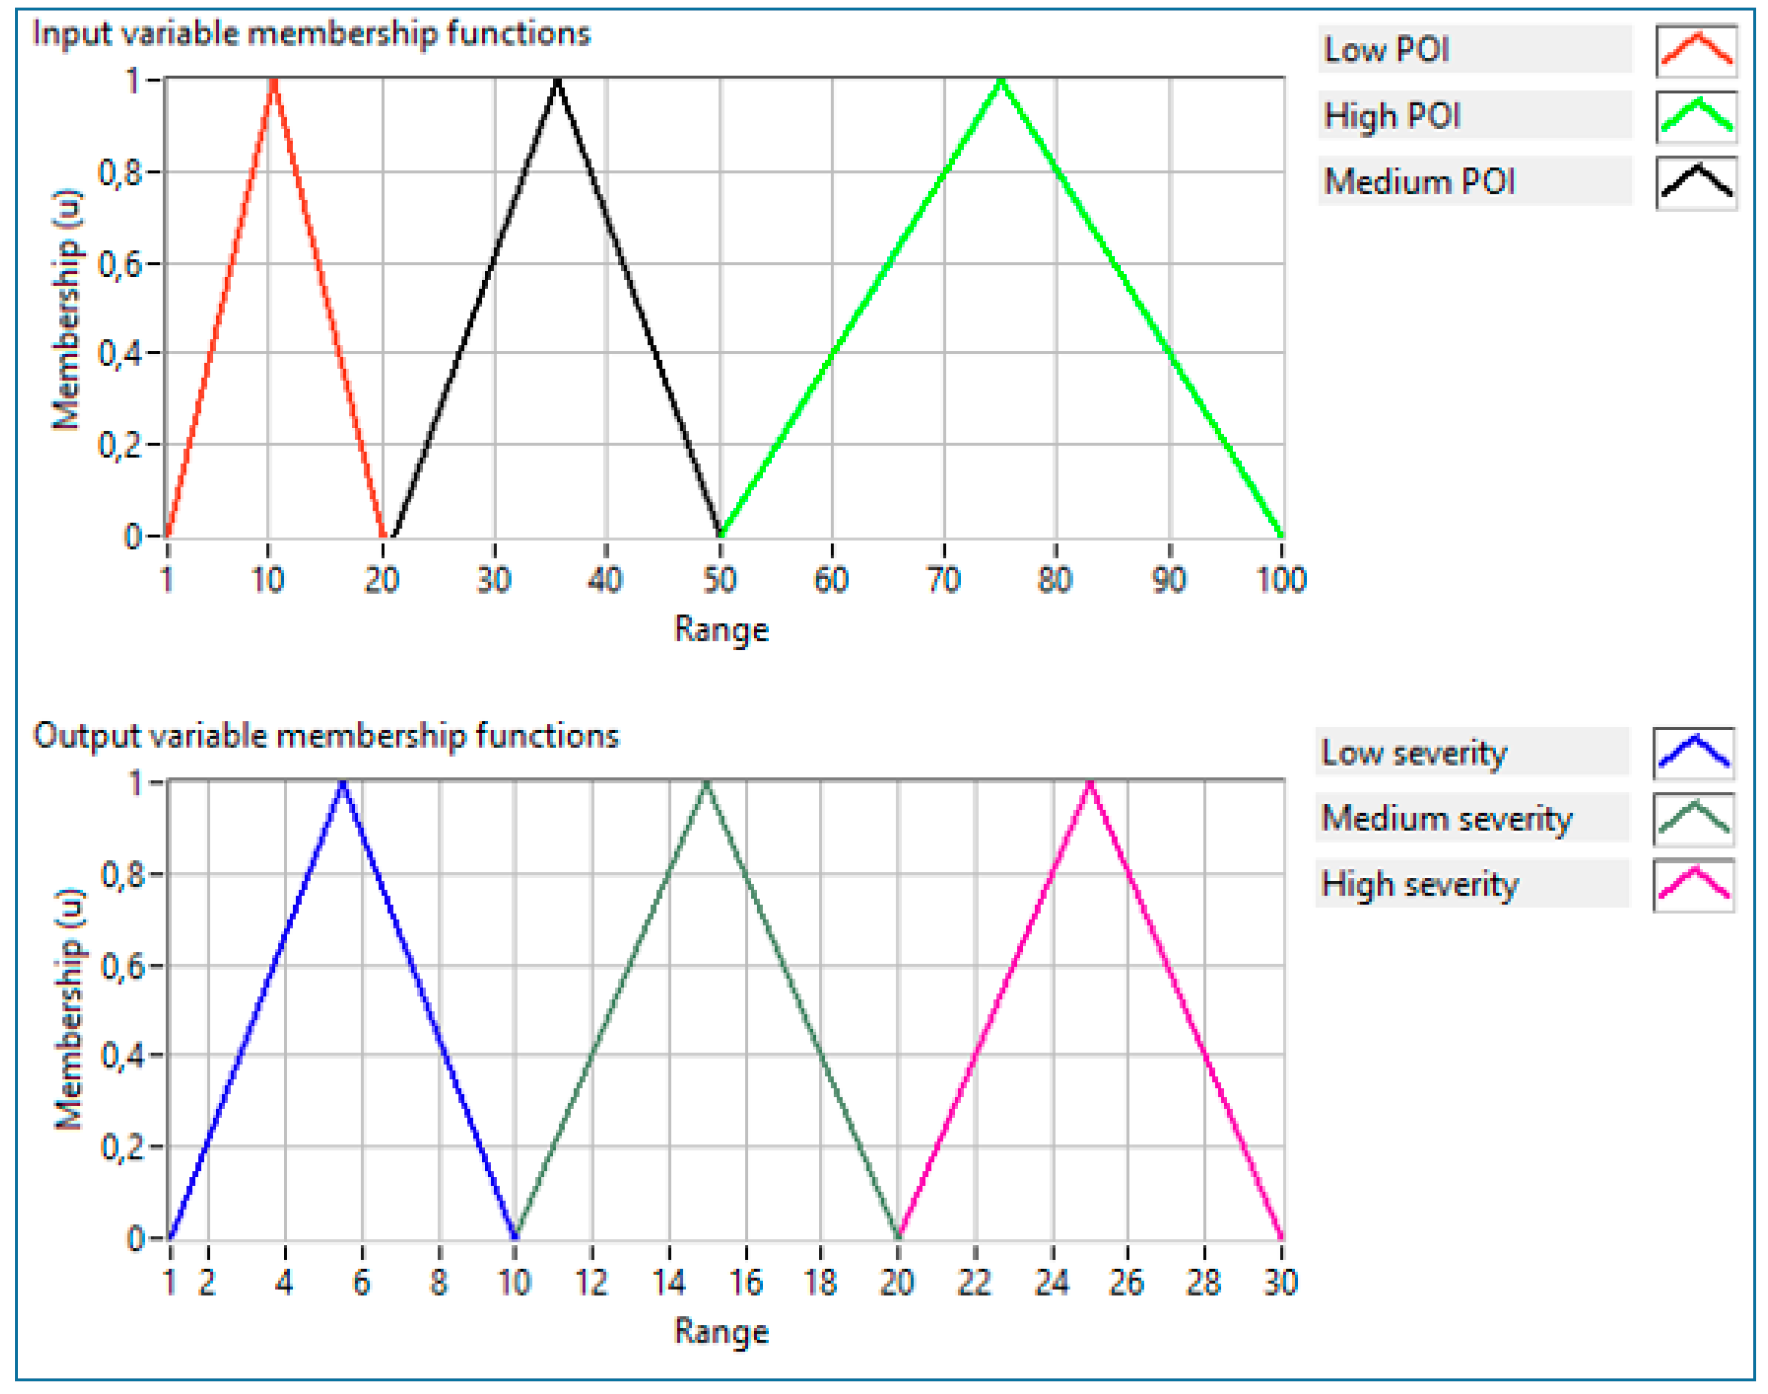
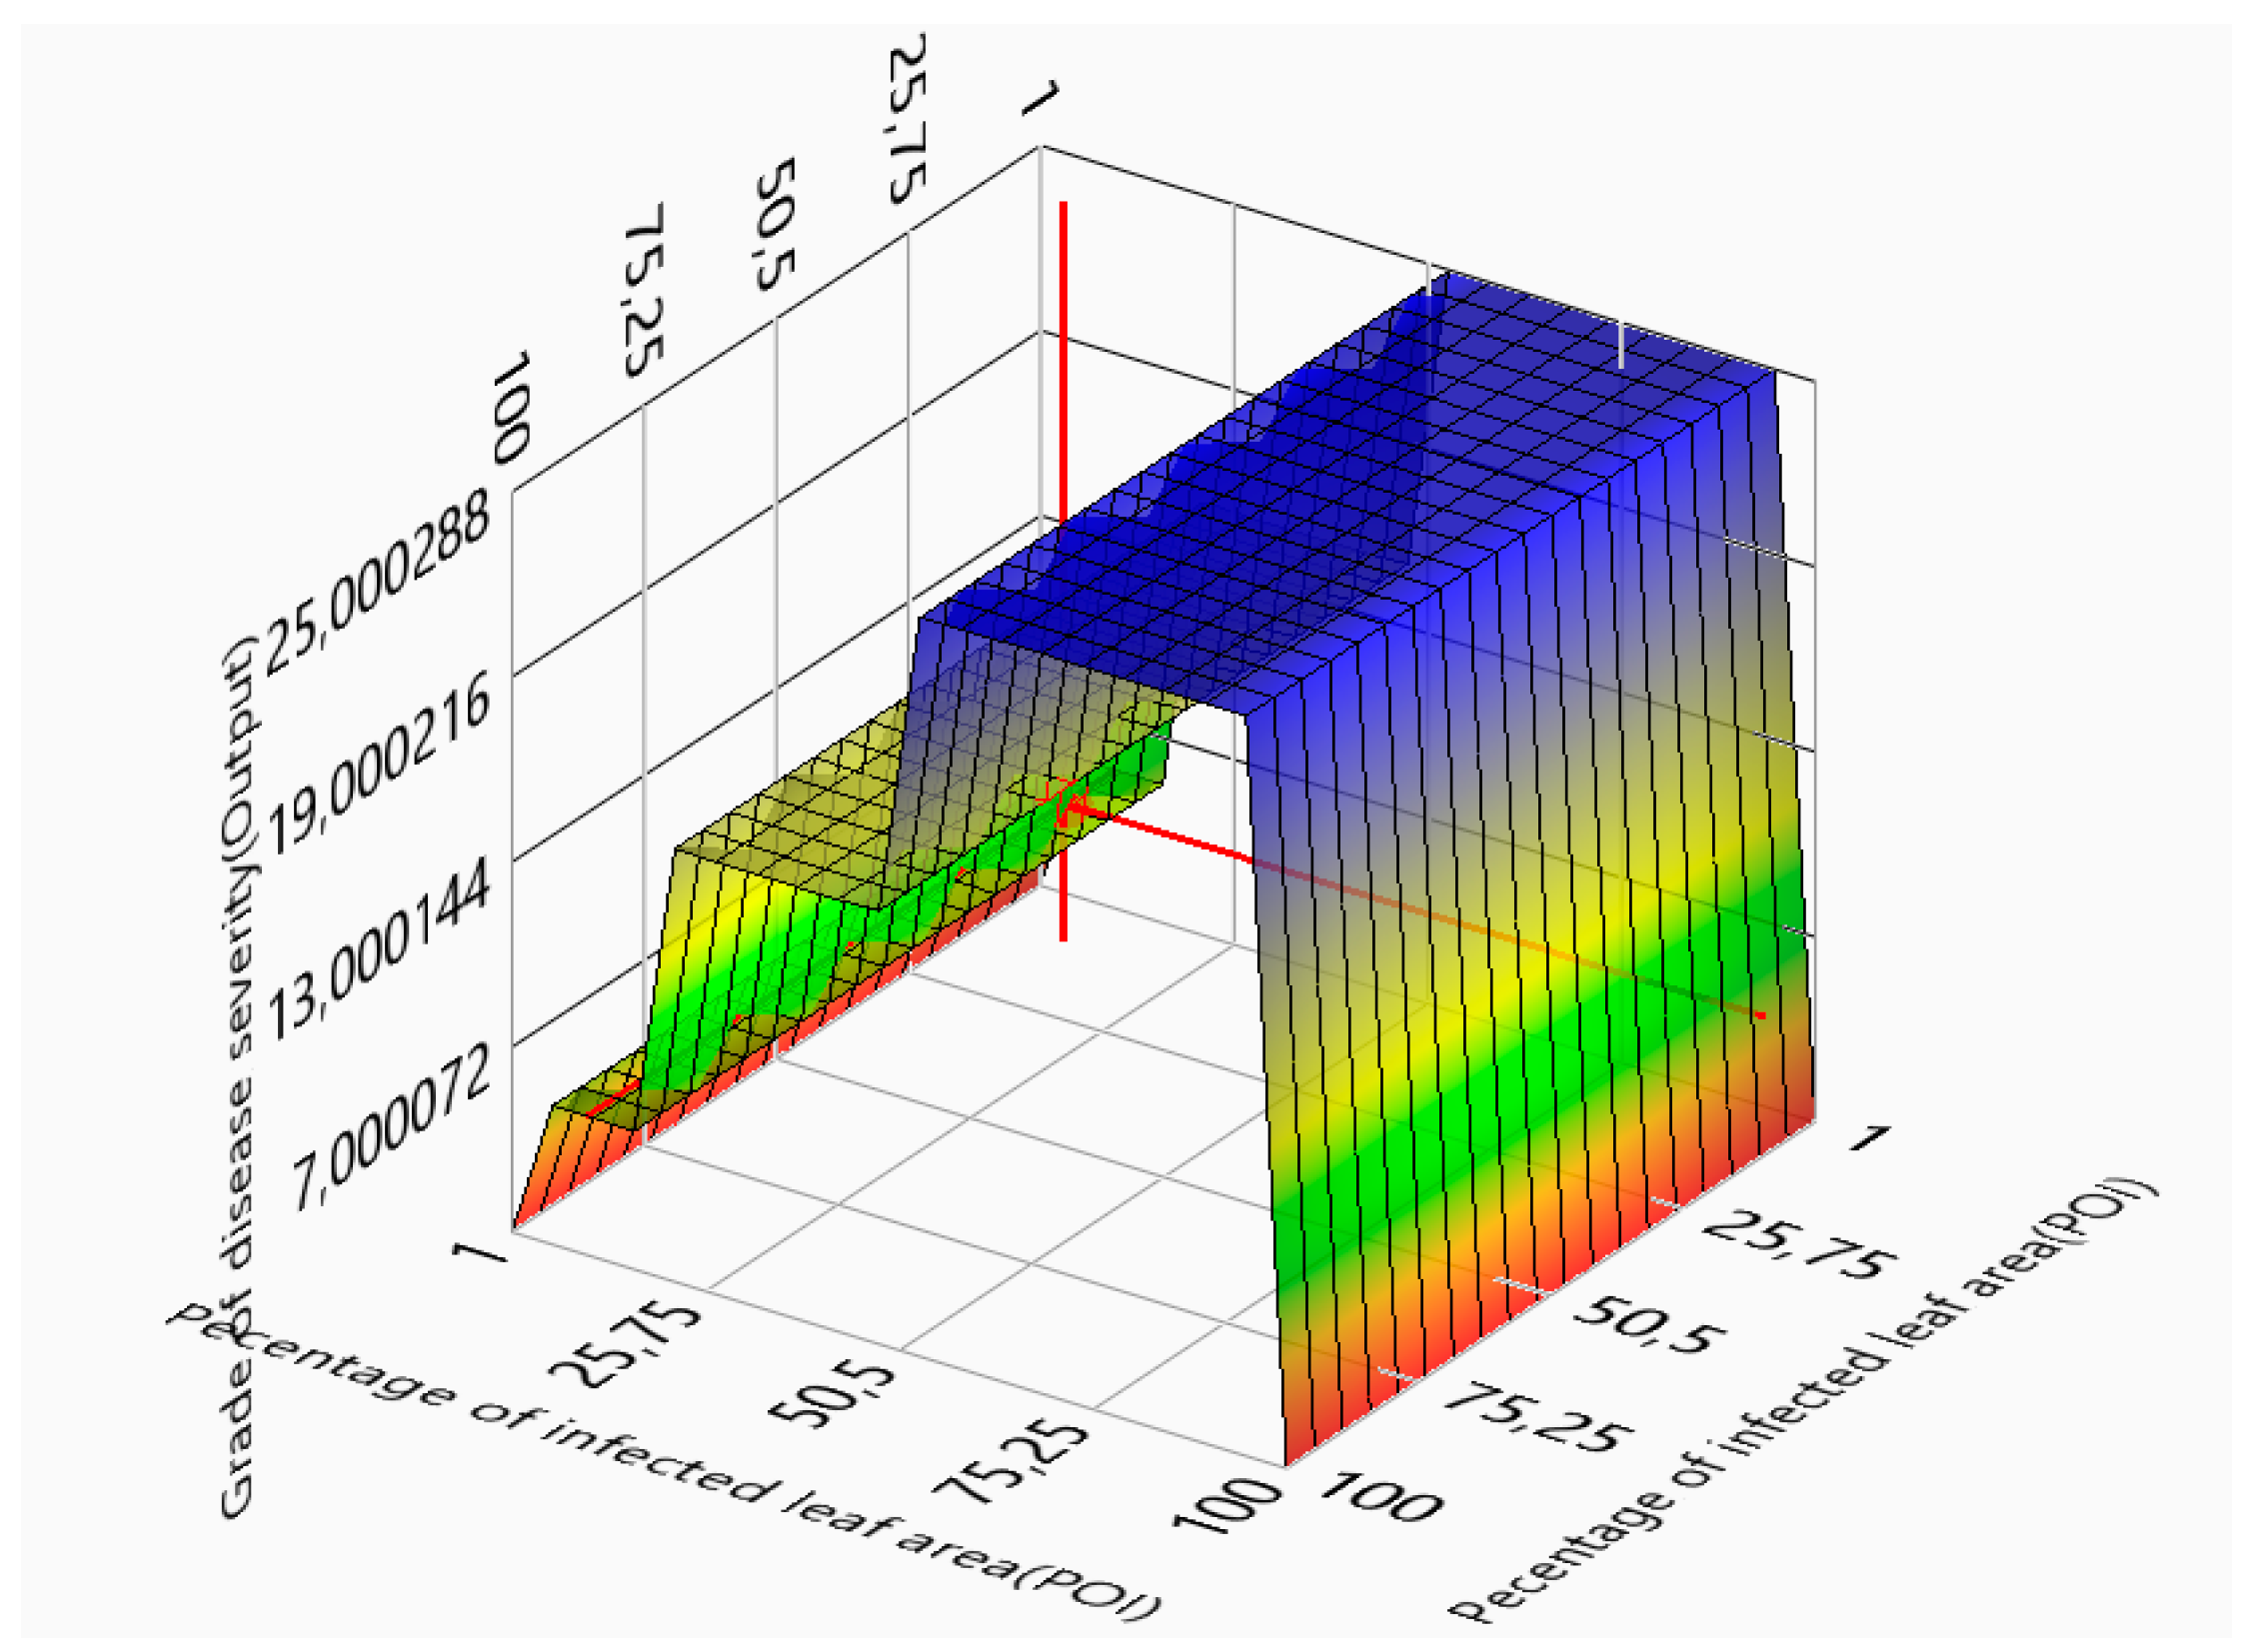
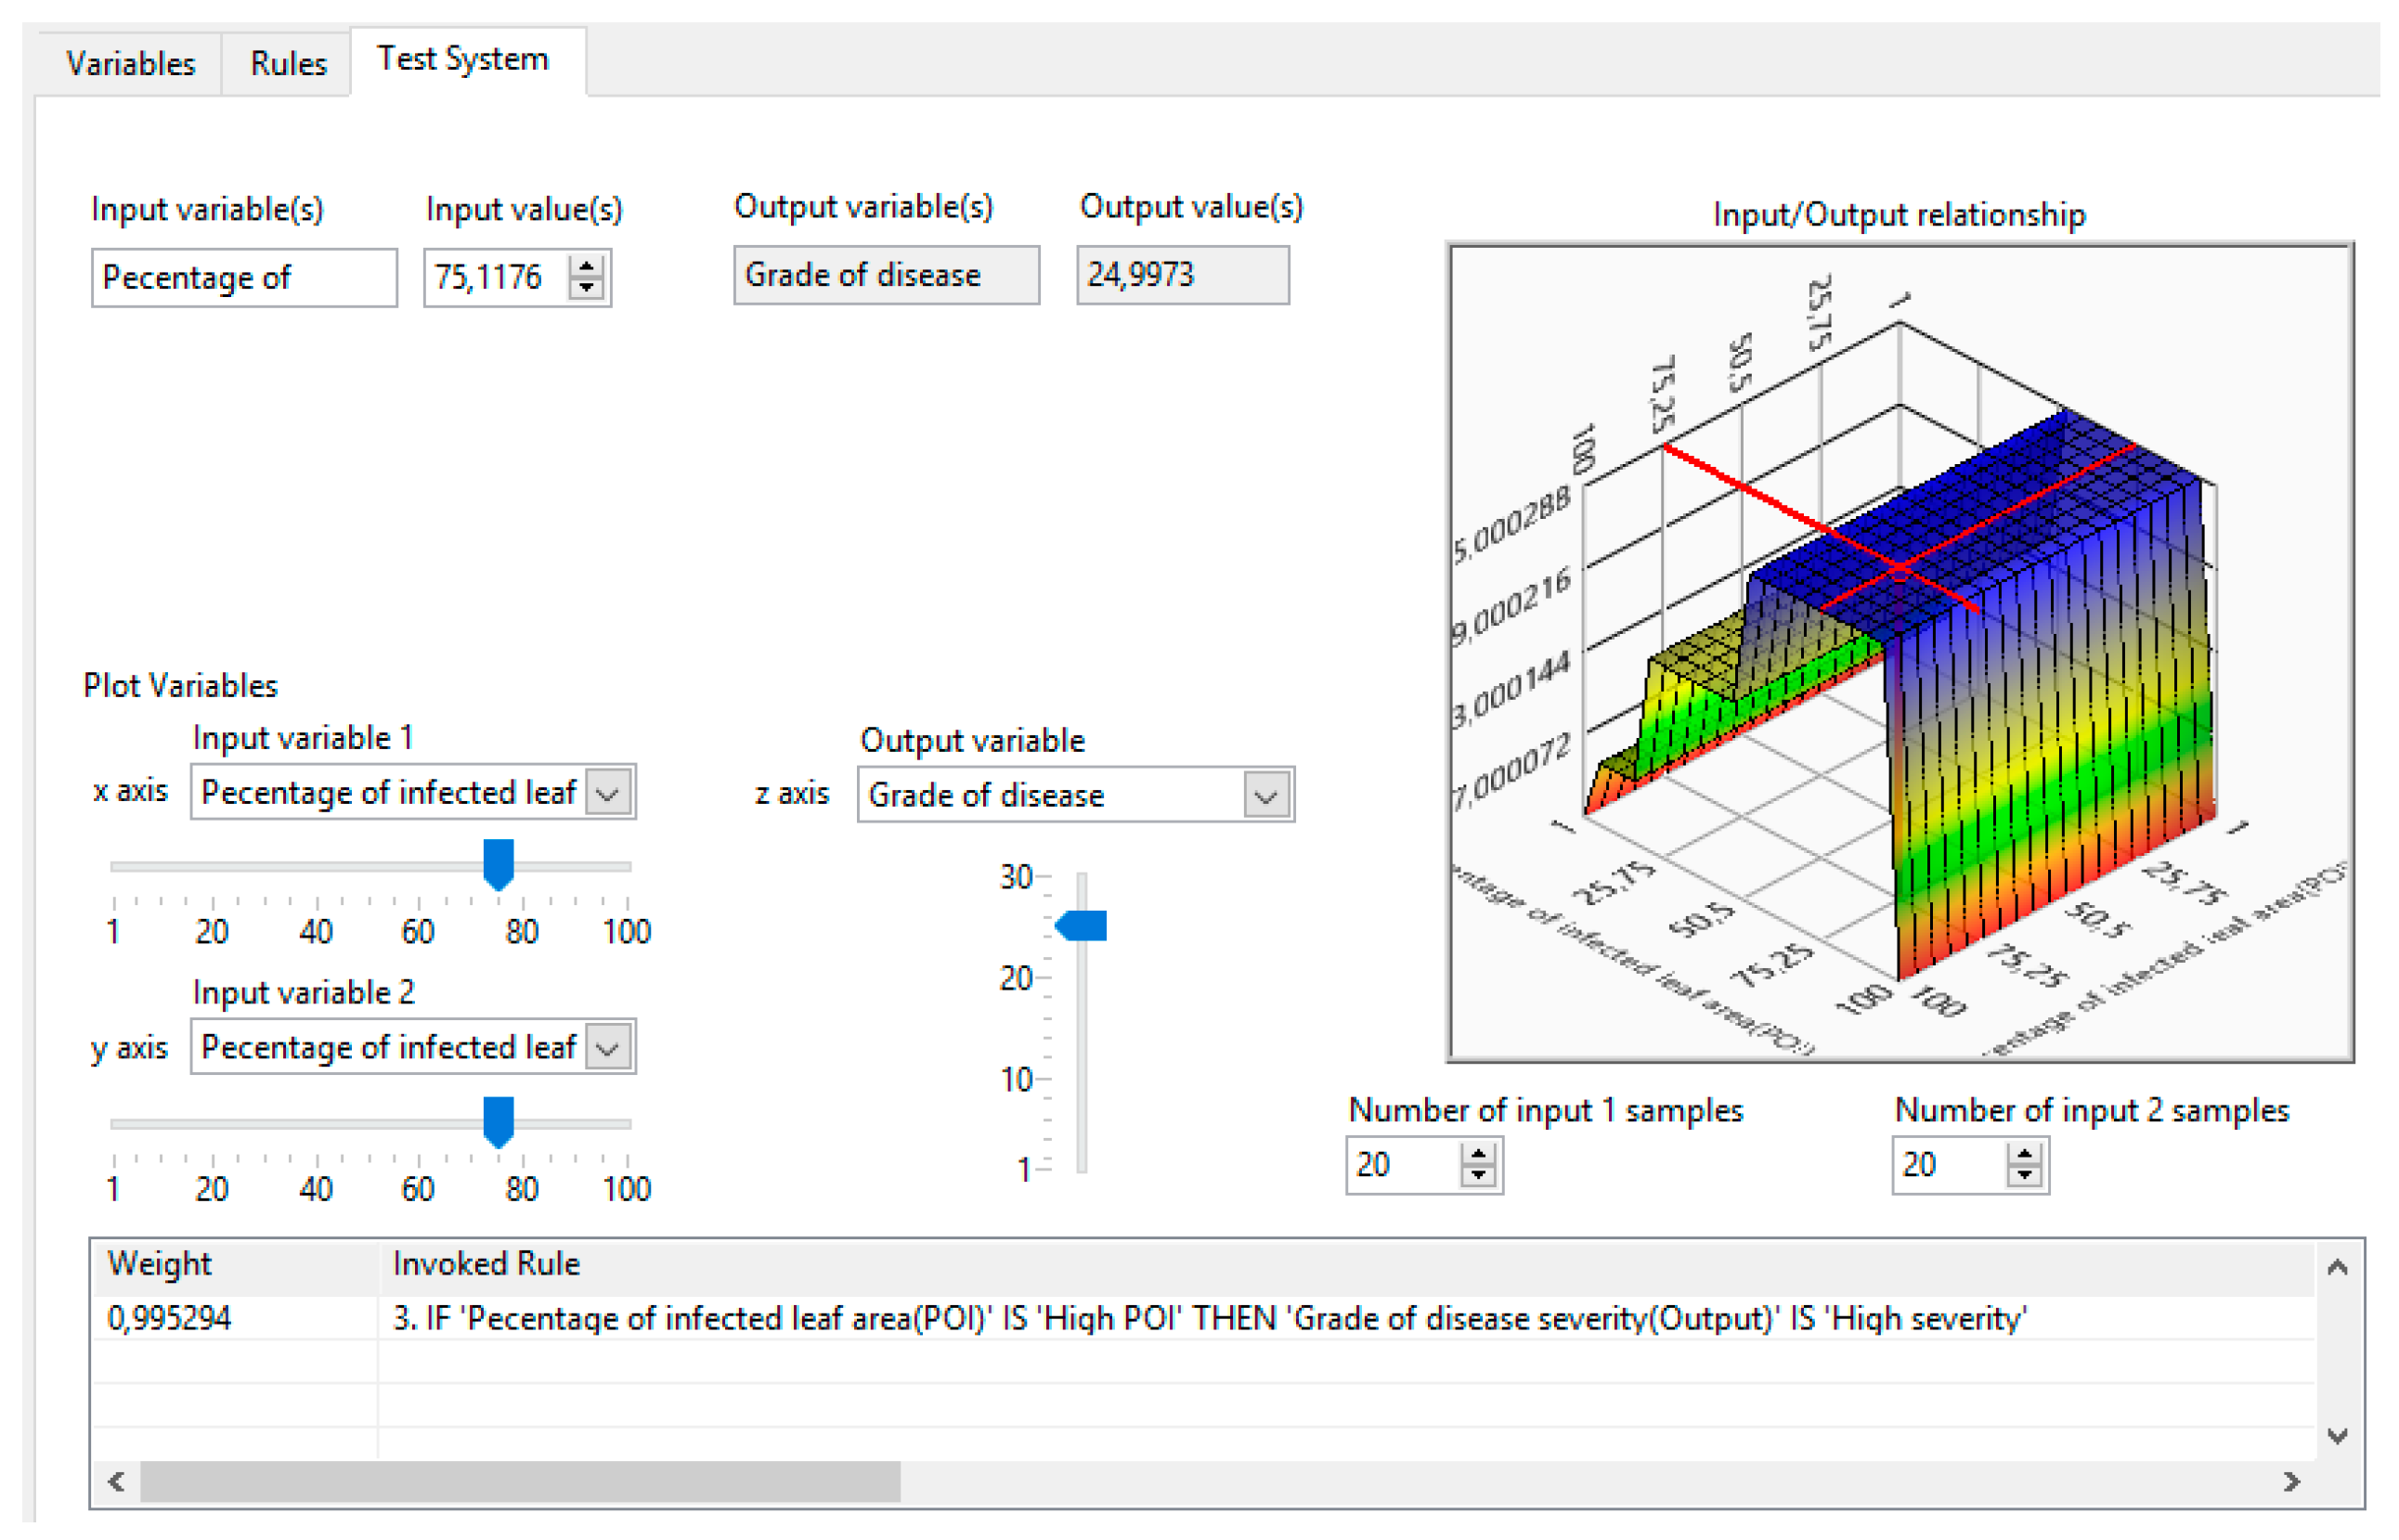
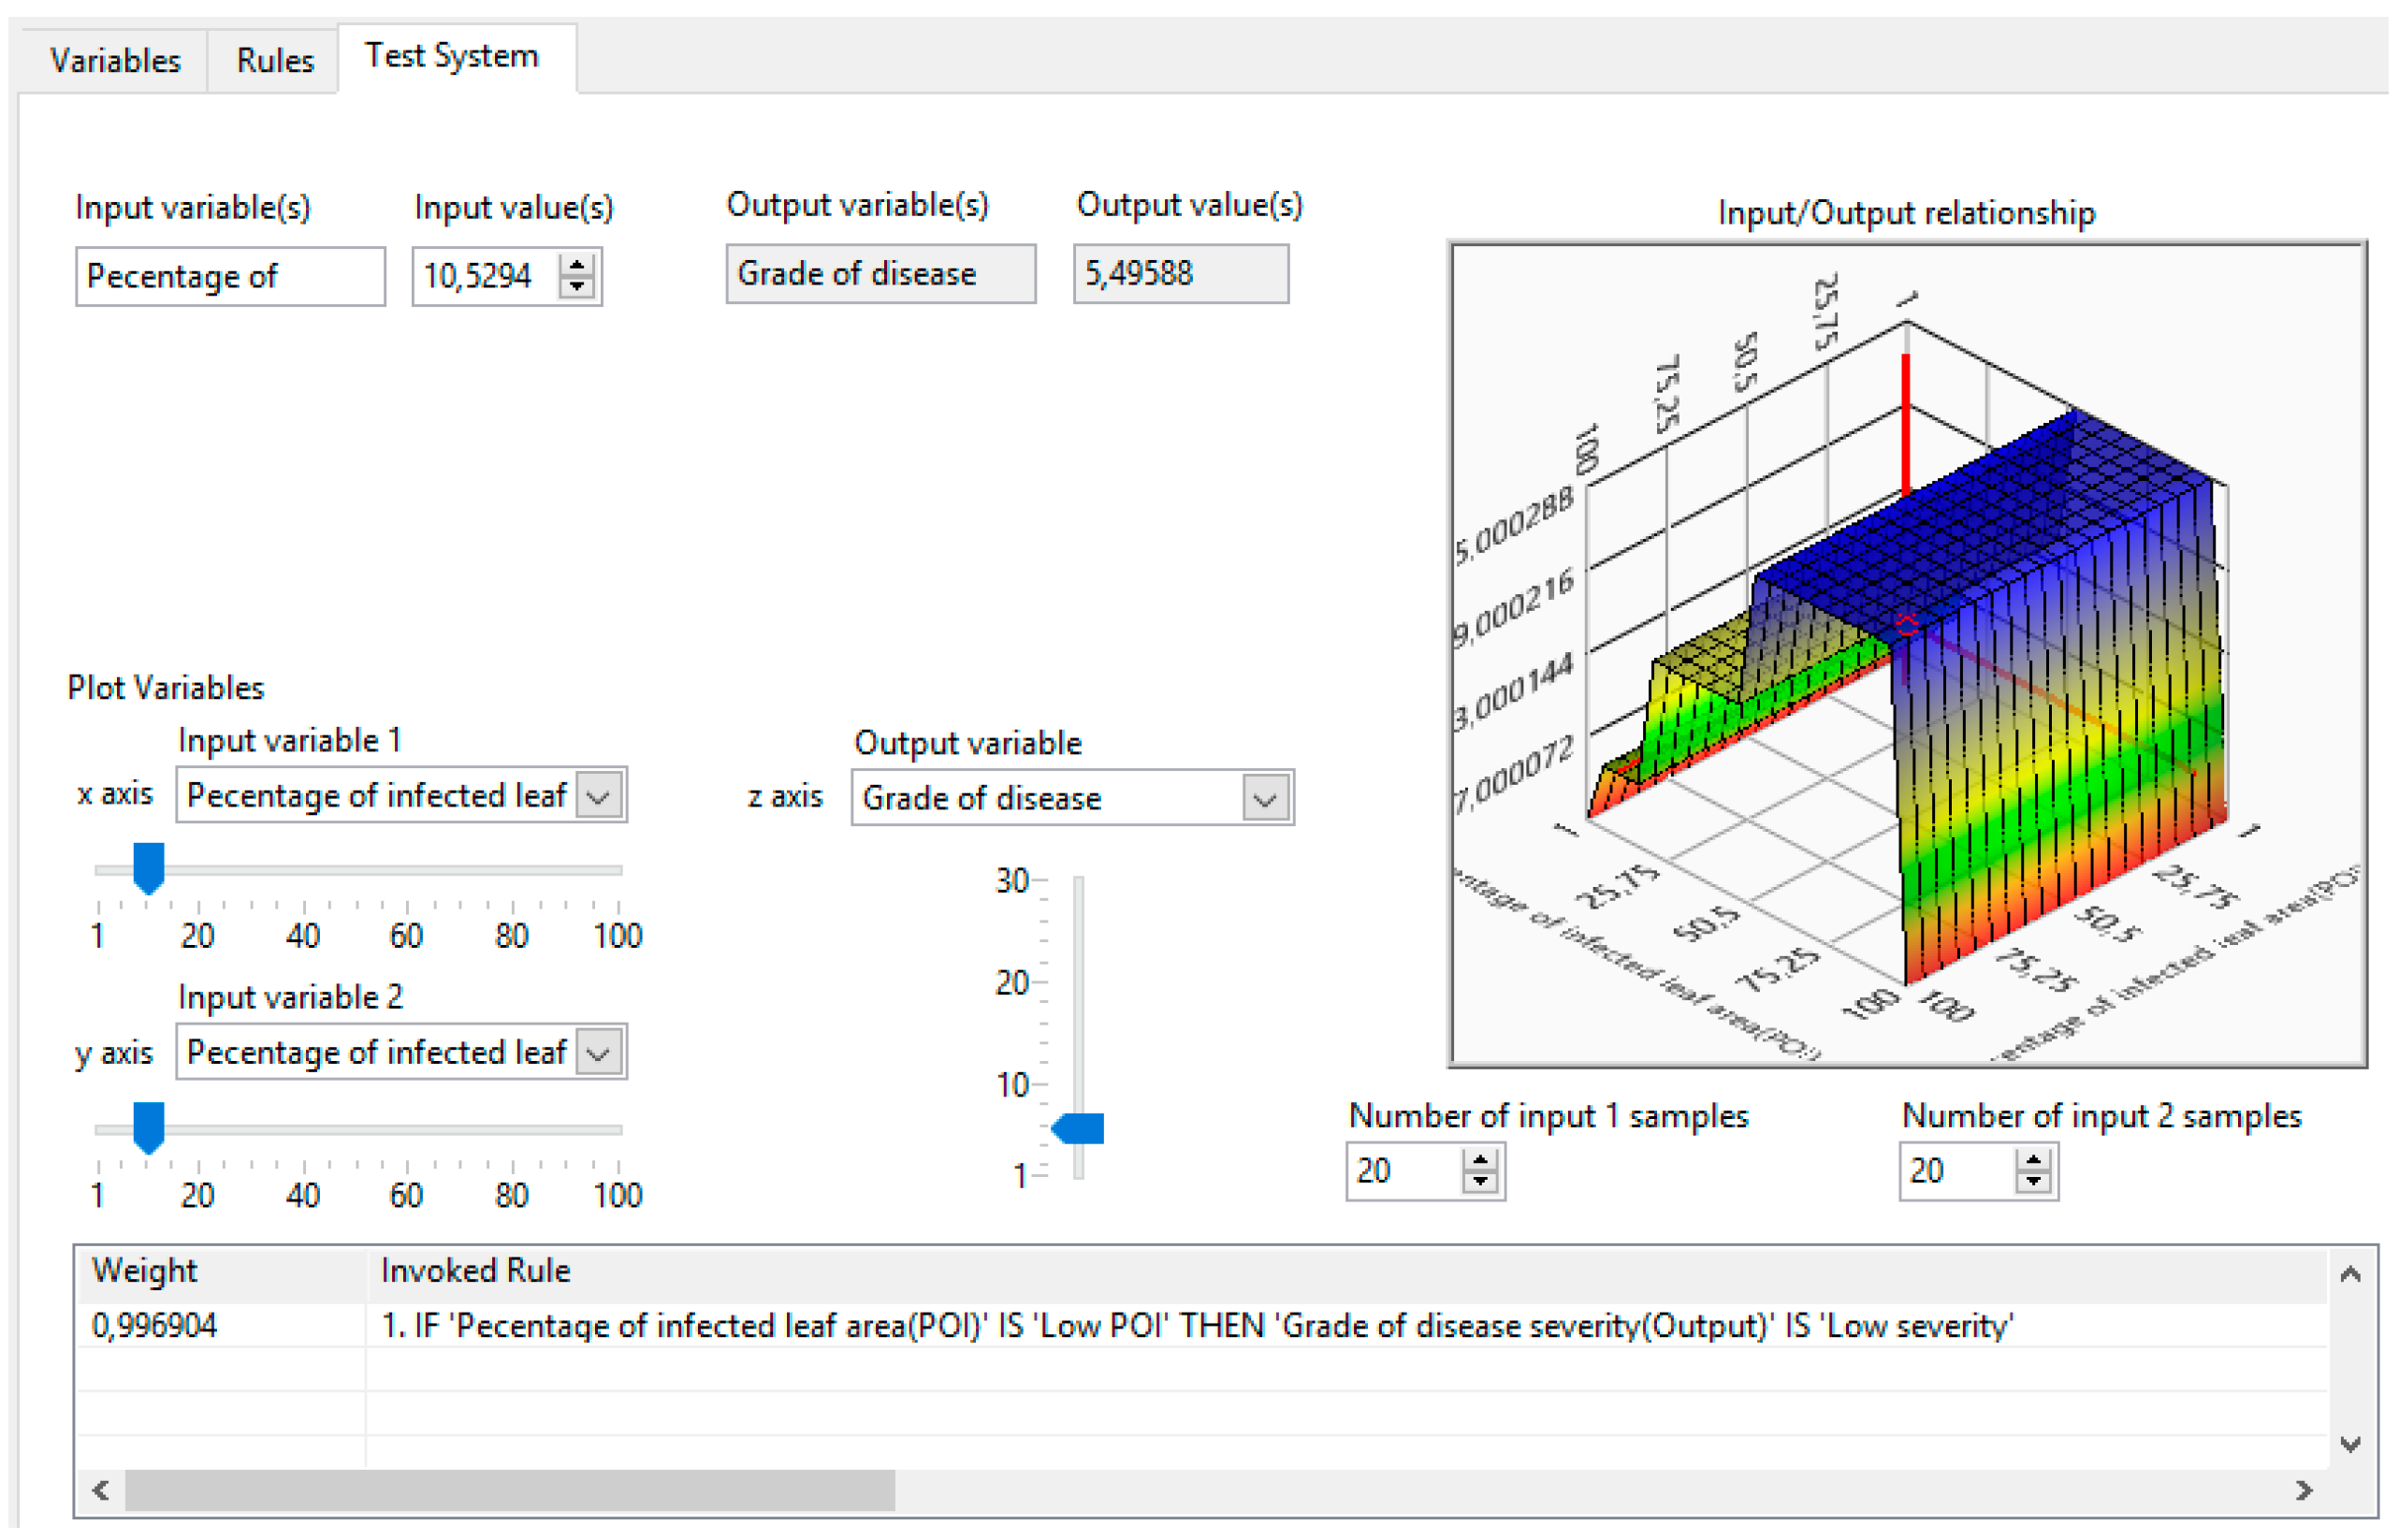
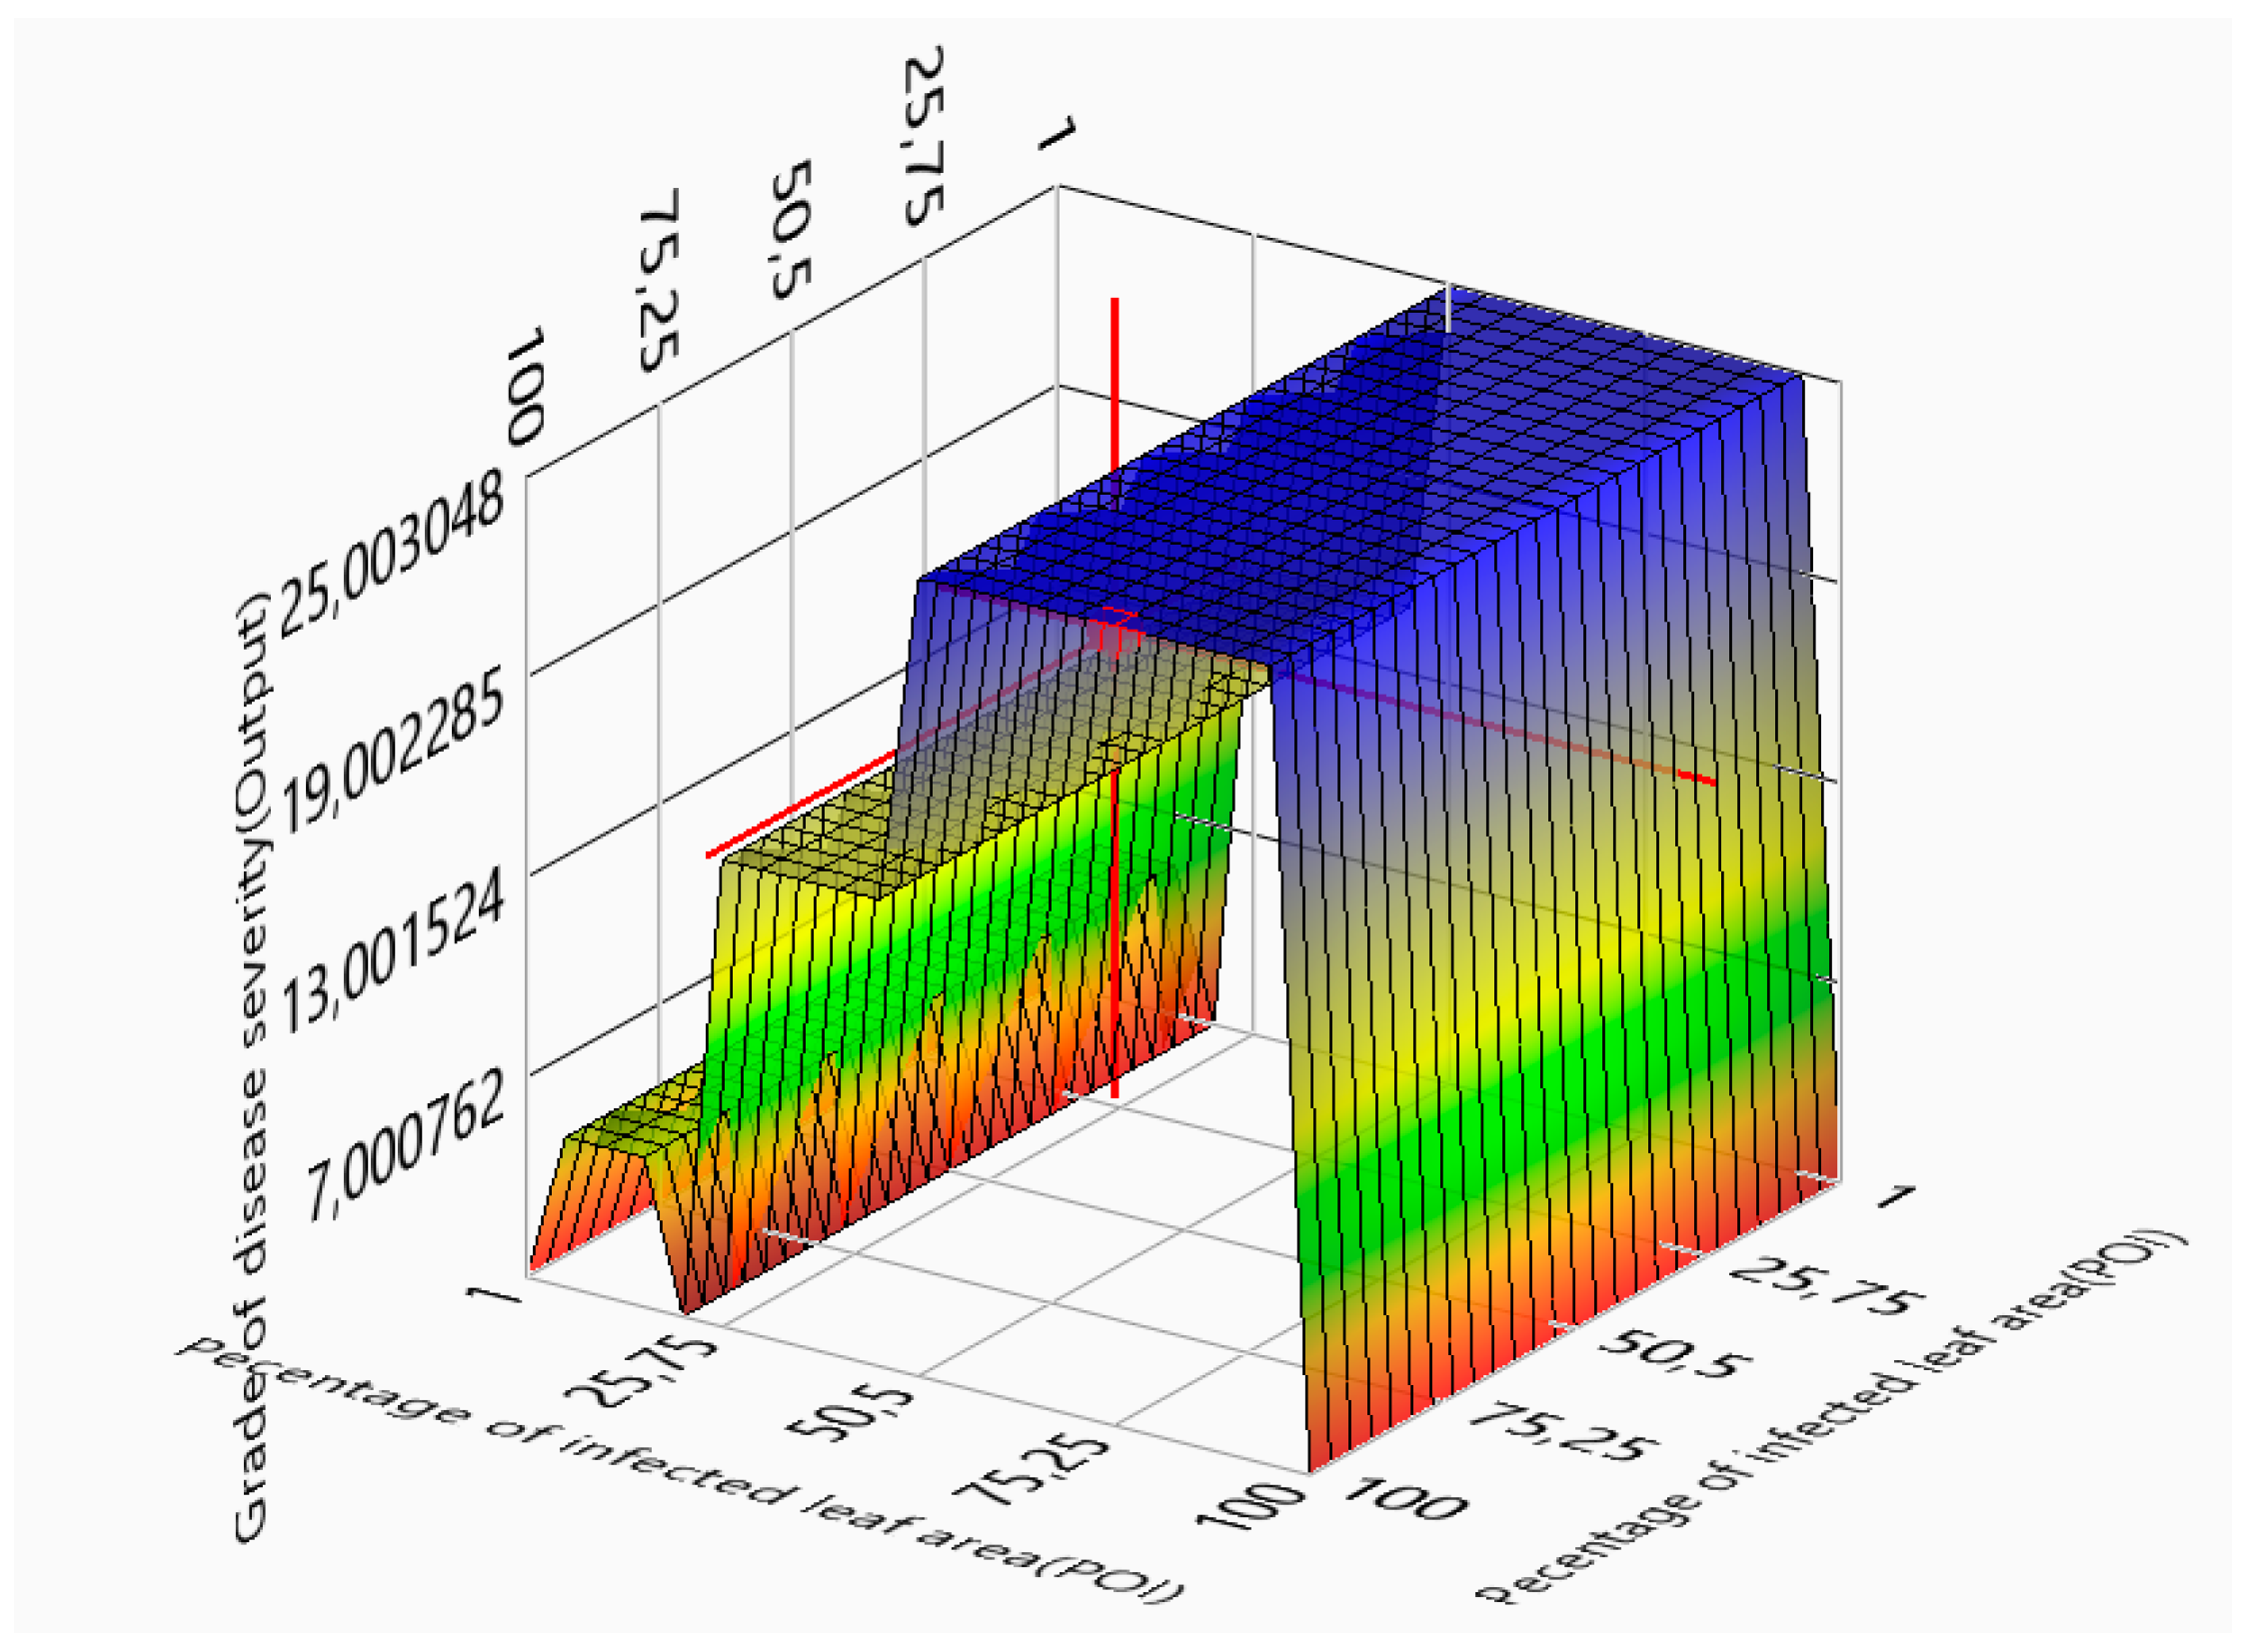
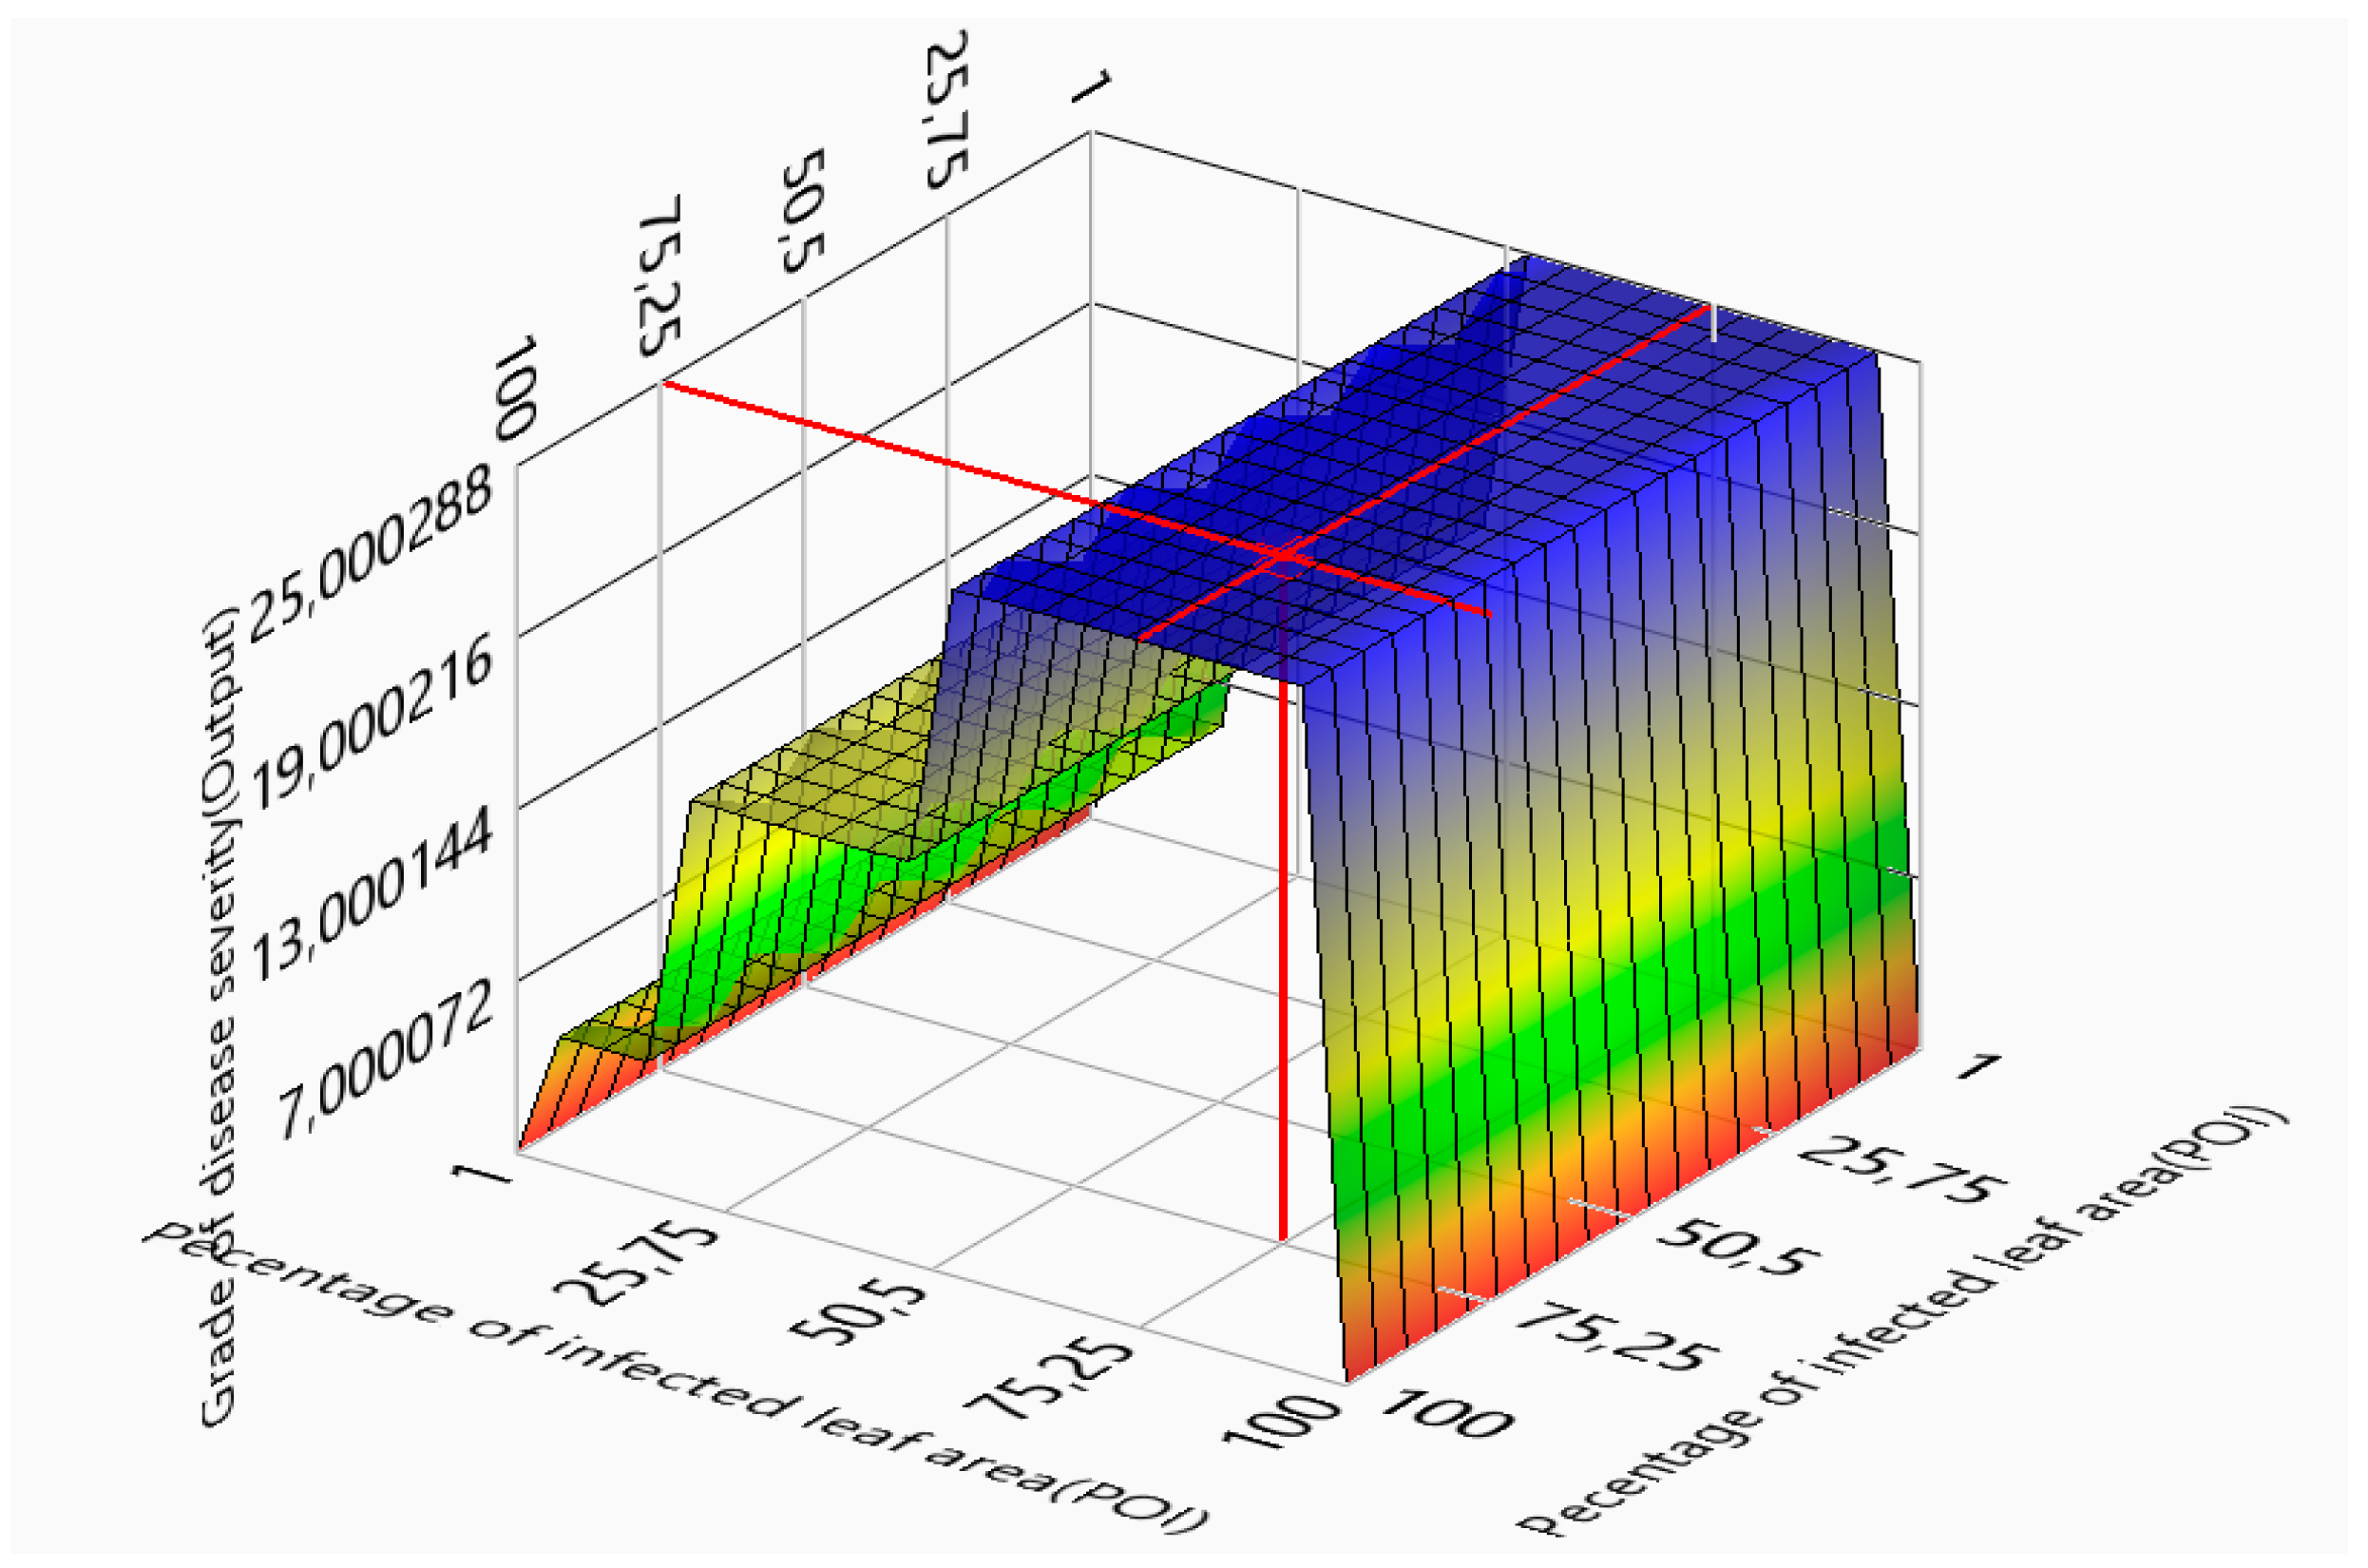
2.4. Model of Fuzzy Logic Inference System
- Rule 1: If ‘Percentage of infected leaf area (POI)′ IS ‘Low POI’ THEN ‘Grade of disease severity (OUTPUT)’ IS ‘Low severity’.
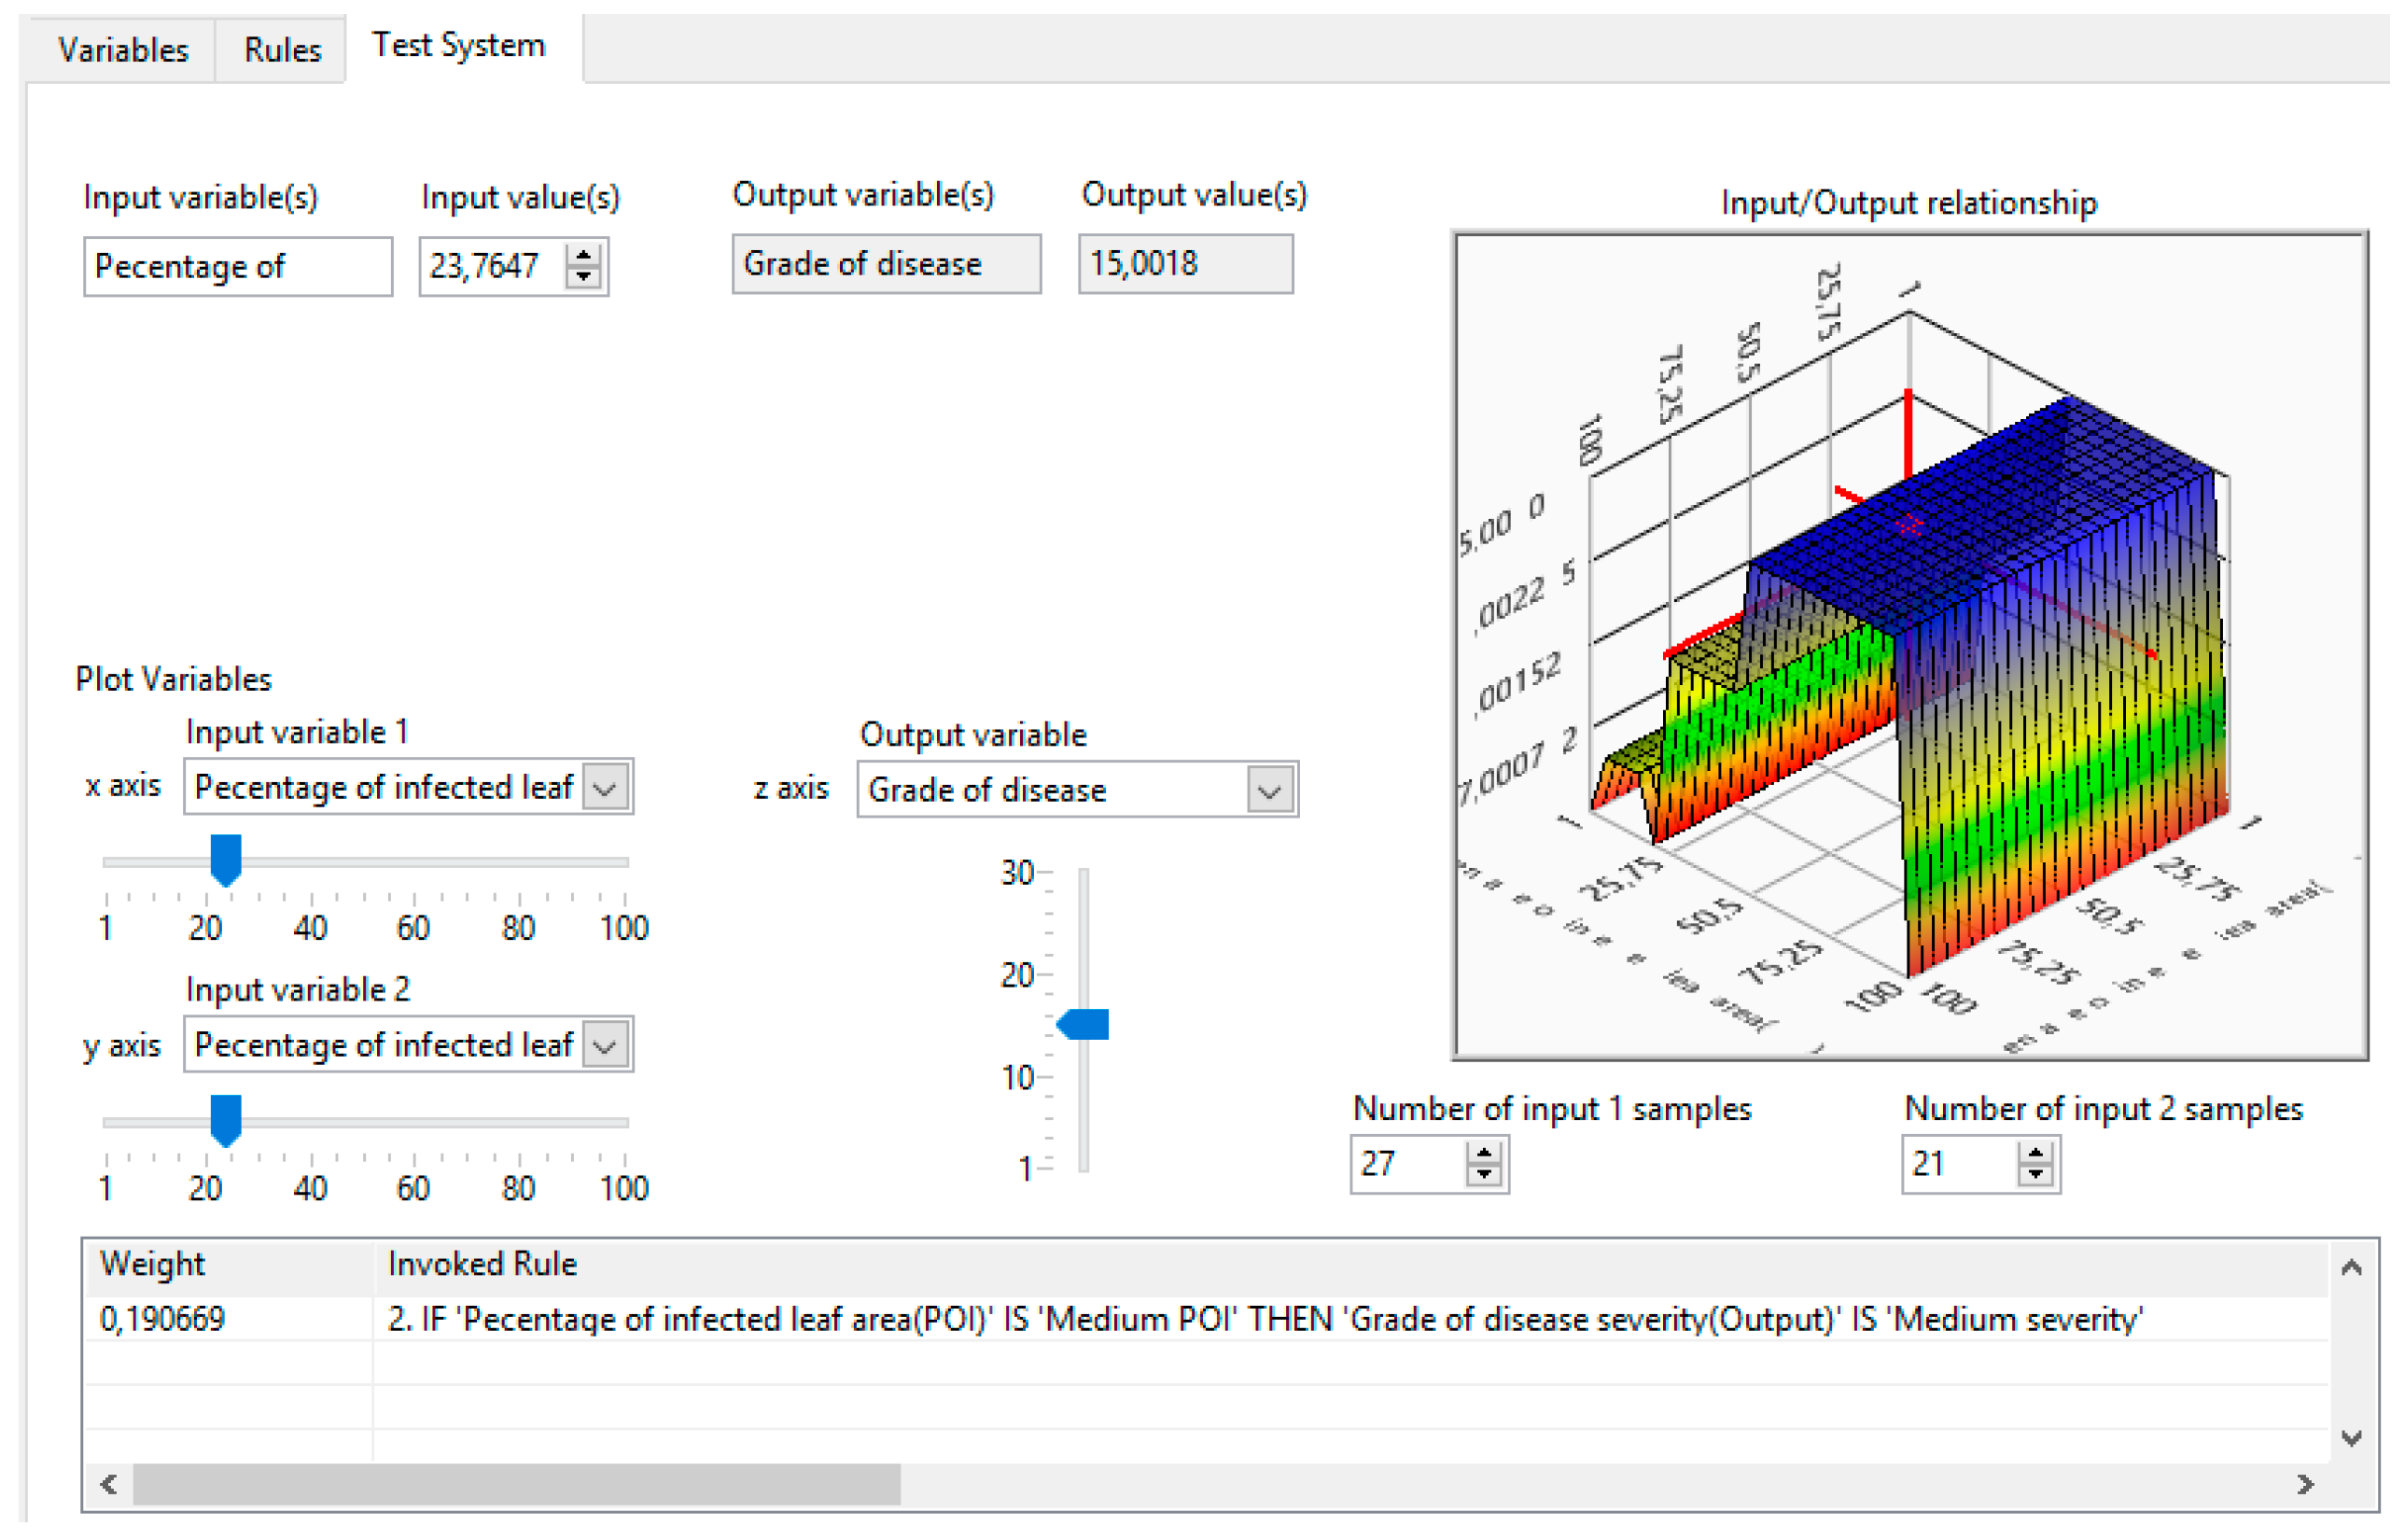
- Rule 2: If ‘Percentage of infected leaf area (POI)′ IS ‘Medium POI’ THEN ‘Grade of disease severity (OUTPUT)’ IS ‘Medium severity’.
- Rule 3: If ‘Percentage of infected leaf area (POI)′ IS ‘High POI’ THEN ‘Grade of disease severity (OUTPUT)’ IS ‘High severity’.
3. Results
4. Discussion
- The Fiji ImageJ package is an open source software package that is meant for image processing and segmentation.
- Data acquisition is not done by means of expensive cameras that are computationally demanding.
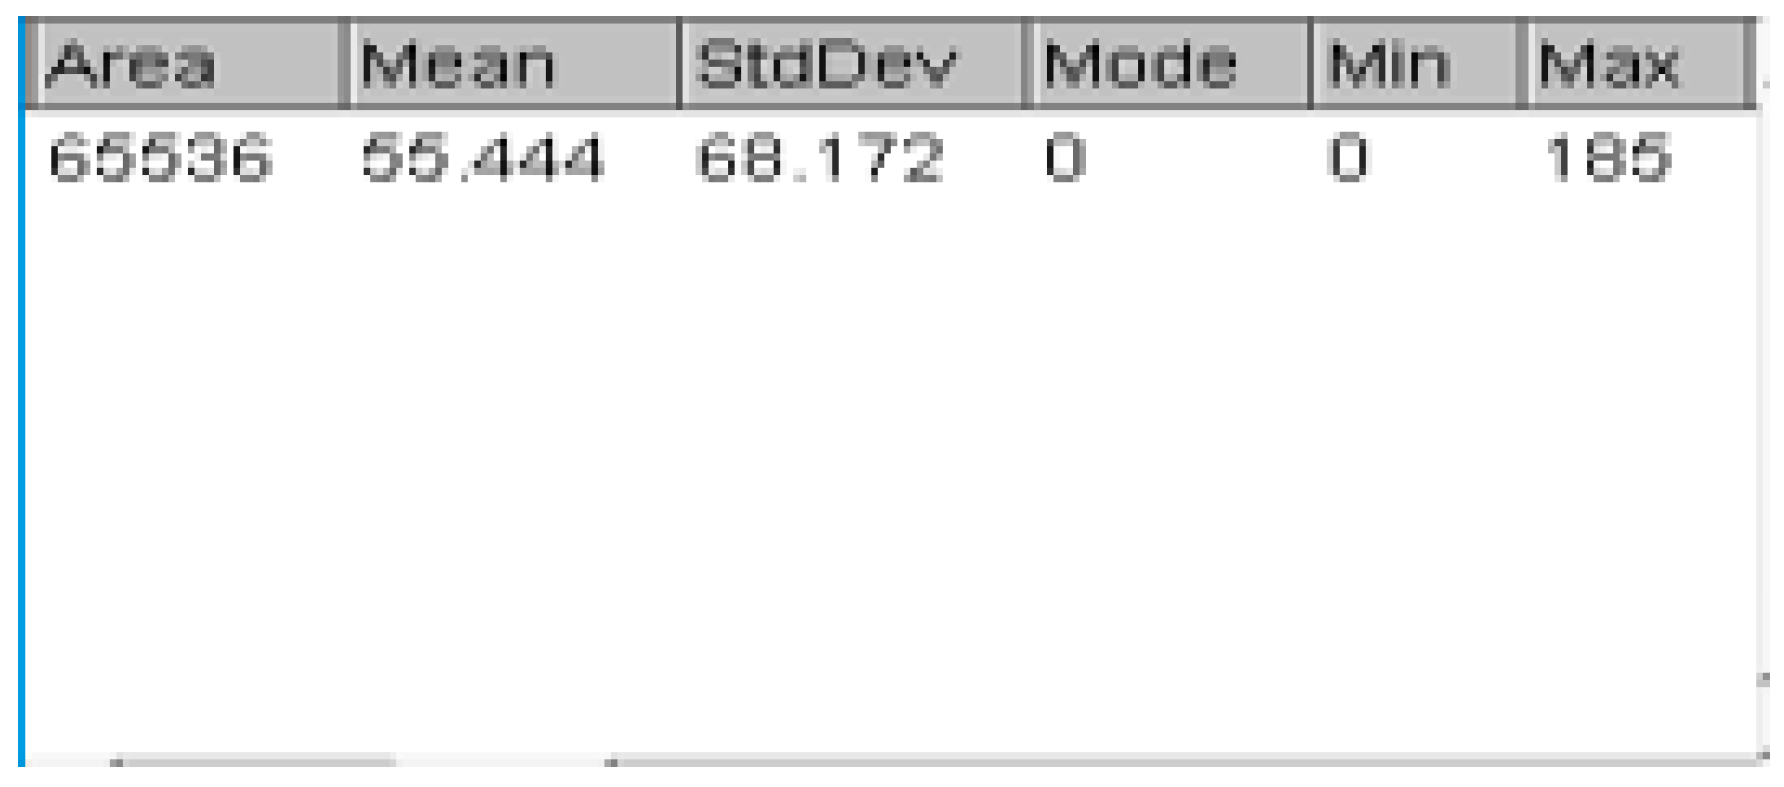
- Threshold colour segmentation is conducted based on the differentiation of colour on the image, and the areas of the segmented regions of interest can be approximated in the results window of the Fiji ImageJ.
5. Conclusions
Author Contributions
Funding
Acknowledgments
Conflicts of Interest
References
- Sladojevic, S.; Arsenovic, M.; Anderla, A.; Culibrk, D.; Stefanovic, D. Deep Neural Networks Based Recognition of Plant Diseases by Leaf Image Classification. Comput. Intell. Neurosci. 2016, 2016, 1–11. [Google Scholar]
- Mohanty, S.P.; Hughes, D.P.; Salathé, M. Using Deep Learning for Image-Based Plant Disease Detection. Front. Plant Sci. 2016, 7, 1419. [Google Scholar] [CrossRef] [PubMed]
- Amara, J.; Zhang, J.; Naik, H.S.; Assefa, T.; Sarkar, S.; Reddy, R.V.; Singh, A.; Ganapathysubramanian, B.; Singh, A.K. Computer Vision and Machine Learning for Robust Phenotyping in Genome-Wide Studies. Inf. Process. Agric. 2017, 4, 1–11. [Google Scholar]
- Fang, Y.; Ramasamy, R.P. Current and Prospective Methods for Plant Disease Detection. Biosensors 2015, 5, 537–561. [Google Scholar] [CrossRef] [PubMed]
- Sannakki, S.S.; Rajpurohit, V.S.; Nargund, V.B.; R, A.K.; Yallur, P.S. Leaf Disease Grading by Machine Vision and Fuzzy Logic. Int. J. Comp. Tech. Appl. 2011, 2, 1709–1716. [Google Scholar]
- Wang, G.; Sun, Y.; Wang, J. Automatic Image-Based Plant Disease Severity Estimation Using Deep Learning. Comput. Intell. Neurosci. 2017, 2017, 1–8. [Google Scholar] [CrossRef] [PubMed]
- Sun, H.; Wei, J.; Zhang, J.; Yang, W. A Comparison of Disease Severity Measurements Using Image Analysis and Visual Estimates Using A Category Scale for Genetic Analysis of Resistance to Bacterial Spot in Tomato. Eur. J. Plant Pathol. 2014, 139, 125–136. [Google Scholar] [CrossRef]
- el Jarroudi, M.; Kouadio, A.L.; Mackels, C.; Tychon, B.; Delfosse, P.; Bock, C.H. A Comparison between Visual Estimates and Image Analysis Measurements to Determine Septoria Leaf Blotch Severity in Winter Wheat. Plant Pathol. 2015, 64, 355–364. [Google Scholar] [CrossRef]
- Service, F.; Murakami, P.F.; Turner, M.R.; van den Berg, A.K.; Schaberg, P.G. An Instructional Guide for Leaf Color Analysis Using Digital Imaging Software; General Technical Report NE-327; United States Department of Agriculture: Newtown Square, PA, USA, 2005.
- Wijekoon, C.P.; Goodwin, P.H.; Hsiang, T. Quantifying Fungal Infection of Plant Leaves by Digital Image Analysis Using Scion Image Software. J. Microbiol. Methods 2008, 74, 94–101. [Google Scholar] [CrossRef] [PubMed]
- Barbedo, J.G.A. An Automatic Method to Detect and Measure Leaf Disease Symptoms Using Digital Image Processing. Plant Dis. 2014, 98, 1709–1716. [Google Scholar] [CrossRef] [PubMed]
- Patil, S.B.; Bodhe, S.K. Leaf Disease Severity Measurement Using Image Processing. Int. J. Eng. Technol. 2011, 3, 297–301. [Google Scholar]
- Pallottino, F.; Menesatti, P.; Figorilli, S.; Antonucci, F.; Tomasone, R.; Colantoni, A.; Costa, C. Machine Vision Retrofit System for Mechanical Weed Control in precision agriculture applications. Sustainability 2018, 10, 2209. [Google Scholar] [CrossRef]
- Owomugisha, G.; Mwebaze, E. Machine Learning for Plant Disease Incidence and Severity Measurements from Leaf Images. In Proceedings of the 2016 15th IEEE International Conference on Machine Learning and Applications, Anaheim, CA, USA, 18–20 December 2016; IEEE: Piscataway, NJ, USA, 2017; pp. 158–163. [Google Scholar] [CrossRef]
- Bock, C.H.; Cook, A.Z.; Parker, P.E.; Gottwald, T.R. Automated Image Analysis of the Severity of Foliar Citrus Canker Symptoms. Plant. Dis. 2009, 93, 660–665. [Google Scholar] [CrossRef] [PubMed]
- Pethybridge, S.J.; Nelson, S.C. Leaf Doctor: A New Portable Application for Quantifying Plant Disease Severity. Plant. Dis. 2015, 99, 1310–1316. [Google Scholar] [CrossRef] [PubMed]
- Mamdani, E.H. Application of Fuzzy Logic to Approximate Reasoning Using Linguistic Synthesis. In Proceedings of the IEEE Sixth International Symposium on Multiple-Valued Logic, Logan, Utah, USA, 25–28 May 1976; Computer Society Press: Washington, DC, USA, 1976; pp. 196–202. [Google Scholar]


| Threshold Method | Threshold Colour | Colour Space |
|---|---|---|
| Default | Red | HSB (Hue, Saturation, Brightness) |
| Inter modes | White | RGB (Red, Green, Blue) |
| Huang | Black | Lab |
| IsoData | Black and White | YUV (Luminance and the Chroma) |
| Li | ||
| MaxEntropy | ||
| Mean | ||
| Minimum | ||
| Otsu |
| Number of Sample Test Images | Input POI (Percentage of Infections) | Input POI Membership Functions | Output Rating Scale of Disease Severity | Output Membership Grade of Disease Severity |
|---|---|---|---|---|
| 10 | 1–20% | Low POI | 1–10 | Low severity |
| 12 | 20–50% | Medium POI | 10–20 | Medium severity |
| 14 | 50–100% | High POI | 20–30 | High severity |
| Input Degree of Membership | Input POI | Associated Input POI Membership Functions | Output Scale of Disease Severity | Output Membership Grade of Disease Severity | Rules Invoked |
|---|---|---|---|---|---|
| 0.99 | 10.529% | Low POI | 5.49 | Low severity | Rule 1 |
| 0.19 | 23.76% | Medium POI | 15 | Medium severity | Rule 2 |
| 0.99 | 75.11% | High POI | 24.9 | High severity | Rule3 |
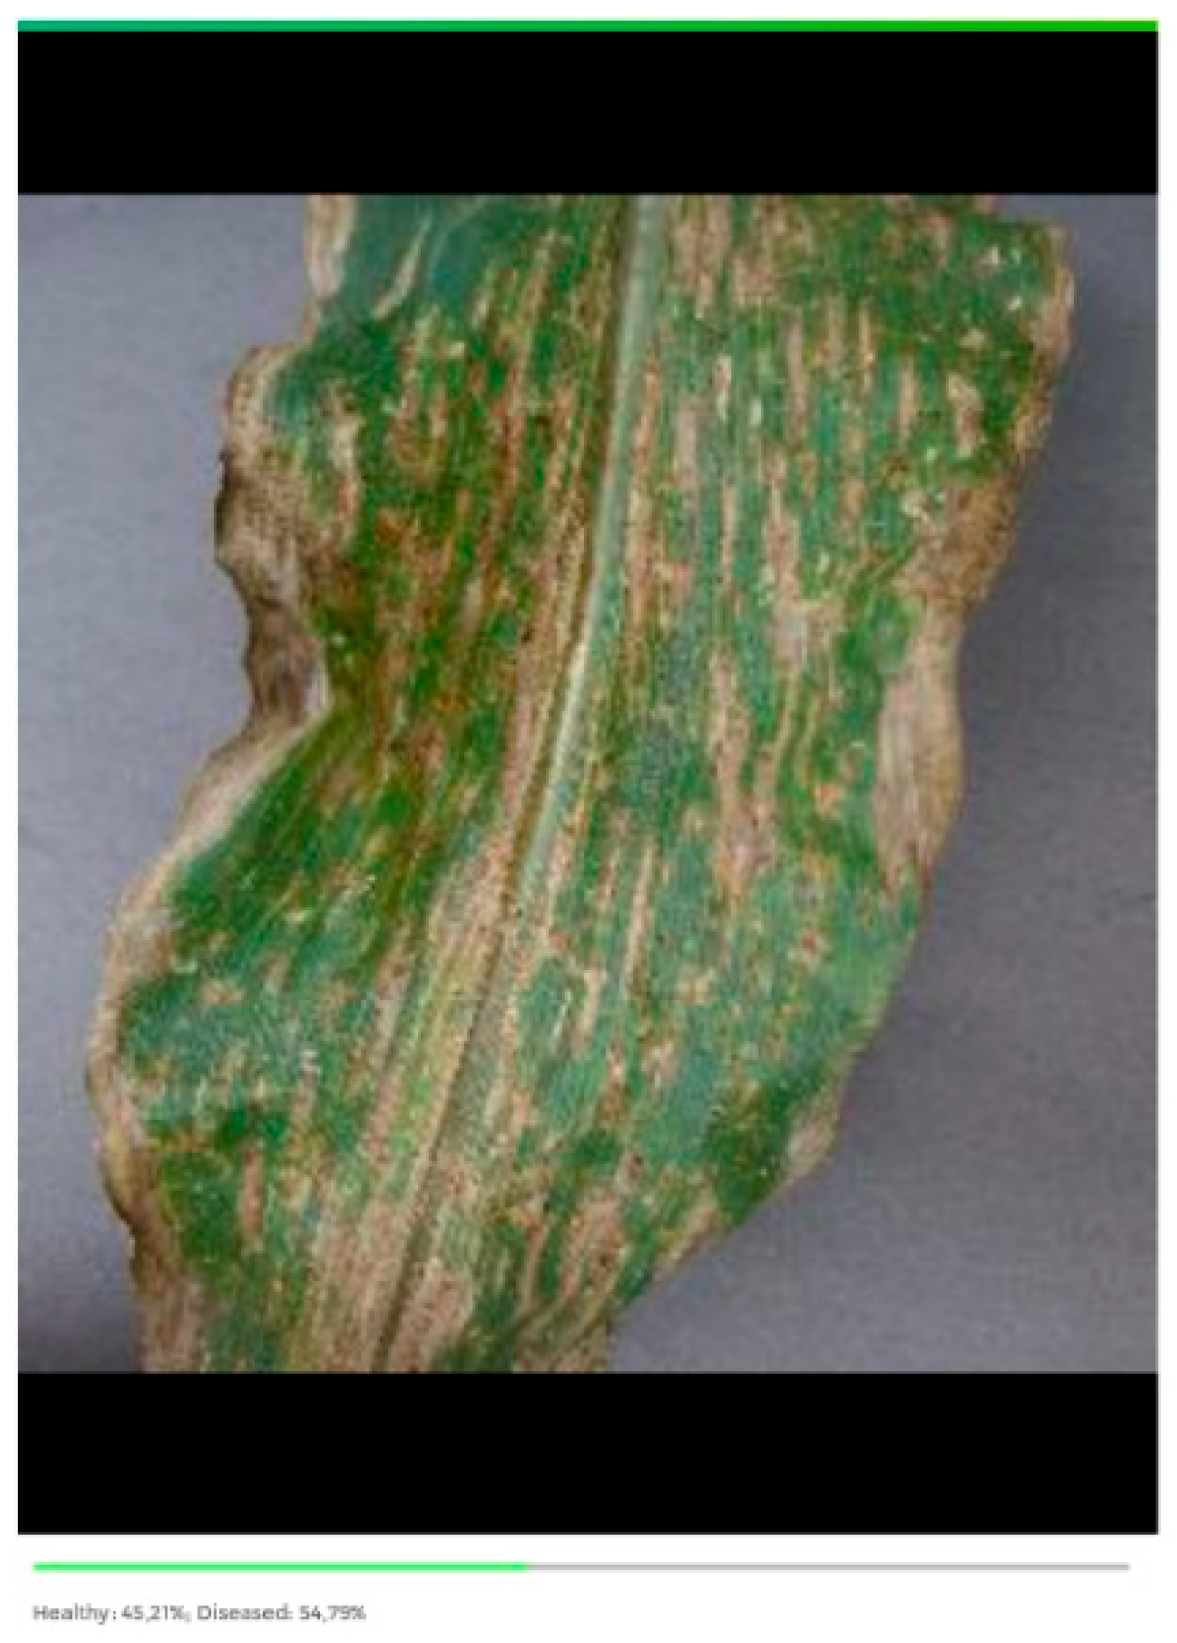
| Current Display of Results in “Leaf Doctor” without Fuzzy Logic | Display of Results in “Leaf Doctor” as Recommended by Our Proposed Method with Fuzzy Logic |
|---|---|
| Healthy: 45.21% Diseased: 54.79% | Healthy: 45.21% Diseased: 54.79%, High severity |
© 2019 by the authors. Licensee MDPI, Basel, Switzerland. This article is an open access article distributed under the terms and conditions of the Creative Commons Attribution (CC BY) license (http://creativecommons.org/licenses/by/4.0/).
Share and Cite
Sibiya, M.; Sumbwanyambe, M. An Algorithm for Severity Estimation of Plant Leaf Diseases by the Use of Colour Threshold Image Segmentation and Fuzzy Logic Inference: A Proposed Algorithm to Update a “Leaf Doctor” Application. AgriEngineering 2019, 1, 205-219. https://doi.org/10.3390/agriengineering1020015
Sibiya M, Sumbwanyambe M. An Algorithm for Severity Estimation of Plant Leaf Diseases by the Use of Colour Threshold Image Segmentation and Fuzzy Logic Inference: A Proposed Algorithm to Update a “Leaf Doctor” Application. AgriEngineering. 2019; 1(2):205-219. https://doi.org/10.3390/agriengineering1020015
Chicago/Turabian StyleSibiya, Malusi, and Mbuyu Sumbwanyambe. 2019. "An Algorithm for Severity Estimation of Plant Leaf Diseases by the Use of Colour Threshold Image Segmentation and Fuzzy Logic Inference: A Proposed Algorithm to Update a “Leaf Doctor” Application" AgriEngineering 1, no. 2: 205-219. https://doi.org/10.3390/agriengineering1020015
APA StyleSibiya, M., & Sumbwanyambe, M. (2019). An Algorithm for Severity Estimation of Plant Leaf Diseases by the Use of Colour Threshold Image Segmentation and Fuzzy Logic Inference: A Proposed Algorithm to Update a “Leaf Doctor” Application. AgriEngineering, 1(2), 205-219. https://doi.org/10.3390/agriengineering1020015