1. Introduction
The concept of smart cities has undergone significant transformation, evolving to encompass a variety of definitions and dimensions [
1]. Initially, foundational discussions helped establish the multifaceted nature of smart cities. Harrison et al. [
2] provided an extensive overview, emphasizing the integration of multiple technologies, data streams, and systems to enhance urban functionalities. Caragliu et al. [
1] underscored the importance of information and communication technologies (ICT) in bolstering city efficiency and competitiveness. Over time, the concept matured, with scholars increasingly focusing on sustainability within smart city initiatives [
3,
4]. This evolution has led to a comprehensive approach that addresses environmental, social, and economic challenges through innovative technologies and data-driven solutions [
2].
In efforts to identify smart cities, a diverse array of methods and indicators have been employed by researchers and practitioners. A key aspect of these efforts is sustainability, which includes reducing resource consumption, promoting renewable energy, and enhancing environmental quality [
5,
6]. The term ‘smartness’ often refers to the integration and application of advanced technologies, which play a crucial role in distinguishing smart cities [
7,
8]. Performance indicators are commonly used to assess the effectiveness and efficiency of smart city projects [
9]. These indicators cover various dimensions such as governance, innovation, quality of life, and economic development [
10,
11]. By using these indicators, researchers and policymakers aim to quantify and compare the ‘smartness’ of different cities, demonstrating the evolving integration of IoT-enabled technologies and AI in transforming urban environments towards greater sustainability and efficiency [
12,
13].
Despite the extensive use of classical methods for identifying smart cities, these approaches often depend on manual data collection and subjective evaluations, which can limit their scalability, objectivity, and accuracy [
14]. The potential of machine learning (ML) techniques offers a solution to these limitations, providing new methods and tools for analysis. Machine learning has been widely adopted in various fields due to its predictive capabilities and its ability to extract significant patterns from large datasets [
15]. In the realm of smart cities, machine learning shows promise for enhancing identification and evaluation processes [
16,
17].
Machine learning techniques can leverage big data analytics to yield valuable insights for smart city planning and management [
18,
19]. By processing vast amounts of data from urban sensors, social media, and other sources, machine learning algorithms can uncover patterns, trends, and correlations that might be overlooked by human analysts [
18,
19]. This data-driven approach facilitates evidence-based decision-making, proactive interventions, and enhanced urban intelligence [
20]. For example, machine learning algorithms have been used to predict disease outbreaks, optimize resource allocation, and improve healthcare services [
21]. In transportation, these algorithms help predict traffic congestion, optimize routing, and enhance mobility solutions [
22].
While machine learning applications have achieved success in various domains, their use in identifying and defining smart cities remains relatively unexplored [
16]. Most research has focused on specific urban aspects like transportation and energy, or used social media analysis [
16,
19,
23]. Leveraging machine learning algorithms, researchers can develop models that learn from historical data to identify and assess smart cities. Kitchin [
20] discusses the potential of big data and smart urbanism for creating real-time cities, using machine learning to process vast data to support timely decision-making. Jamei et al. [
24] highlighted the role of virtual reality and machine learning in planning sustainable smart cities. Additionally, Khan et al. [
16] proposed a big data analytics framework for smart city planning, utilizing machine learning to analyze large-scale urban data.
Machine learning can predict future urban challenges and guide policymaking, with applications in predicting energy consumption patterns, optimizing resource allocation, and enhancing energy efficiency in buildings and infrastructure [
25,
26]. It also supports urban resilience and livability assessments to improve quality of life [
27]. Recent studies emphasize the role of AI in promoting urban sustainability, focusing on predictive maintenance and real-time decision-making in the field of urban infrastructure [
28,
29,
30]. For instance, integrating IoT and AI can transform smart city infrastructures, enhancing sustainability, productivity, and comfort [
12], while the addition of self-learning 6G networks can significantly enhance the efficiency and effectiveness of these infrastructures [
17].
Despite its potential, successfully integrating machine learning into smart city assessments poses several challenges. Data quality and availability are critical, as machine learning models rely on accurate, comprehensive data for reliable insights. Ensuring data accessibility, standardization, and quality control is essential [
31]. Additionally, ethical considerations such as data privacy and algorithmic fairness must be addressed to ensure the responsible deployment of machine learning in smart cities [
32].
The application of machine learning in identifying smart cities remains an underexplored area, presenting a significant gap in the literature. This study aims to bridge this gap by developing a comprehensive scientific approach for identifying smart cities using machine learning. By leveraging machine learning, this research seeks to provide a reliable and objective framework for understanding and assessing smart cities, facilitating more accurate, data-driven decision-making for urban development.
In this updated version of our study, we have refined our methodology to deepen our understanding of the characteristics defining smart cities. Enhancements to our machine learning models have improved precision and interpretability, including advanced data encoding techniques and detailed classification reports. These improvements allow for a more nuanced examination of critical urban indicators. Building on our previous framework, this update introduces new quantitative analyses and visual representations, enriching our understanding of urban dynamics. This progression extends our prior findings, offering a detailed, data-driven analysis that underscores the multifaceted nature of urban intelligence and provides actionable insights for city planners and policymakers.
The primary purpose of this study is to develop an objective, data-driven framework for identifying and assessing smart cities by leveraging advanced machine learning techniques. The hypothesis underpinning this research is that machine learning models, when applied to extensive urban data, can effectively and accurately identify the defining characteristics of smart cities. This approach is expected to overcome the limitations of traditional methods, offering a scalable, objective, and precise means of evaluating urban smartness.
2. Materials and Methods
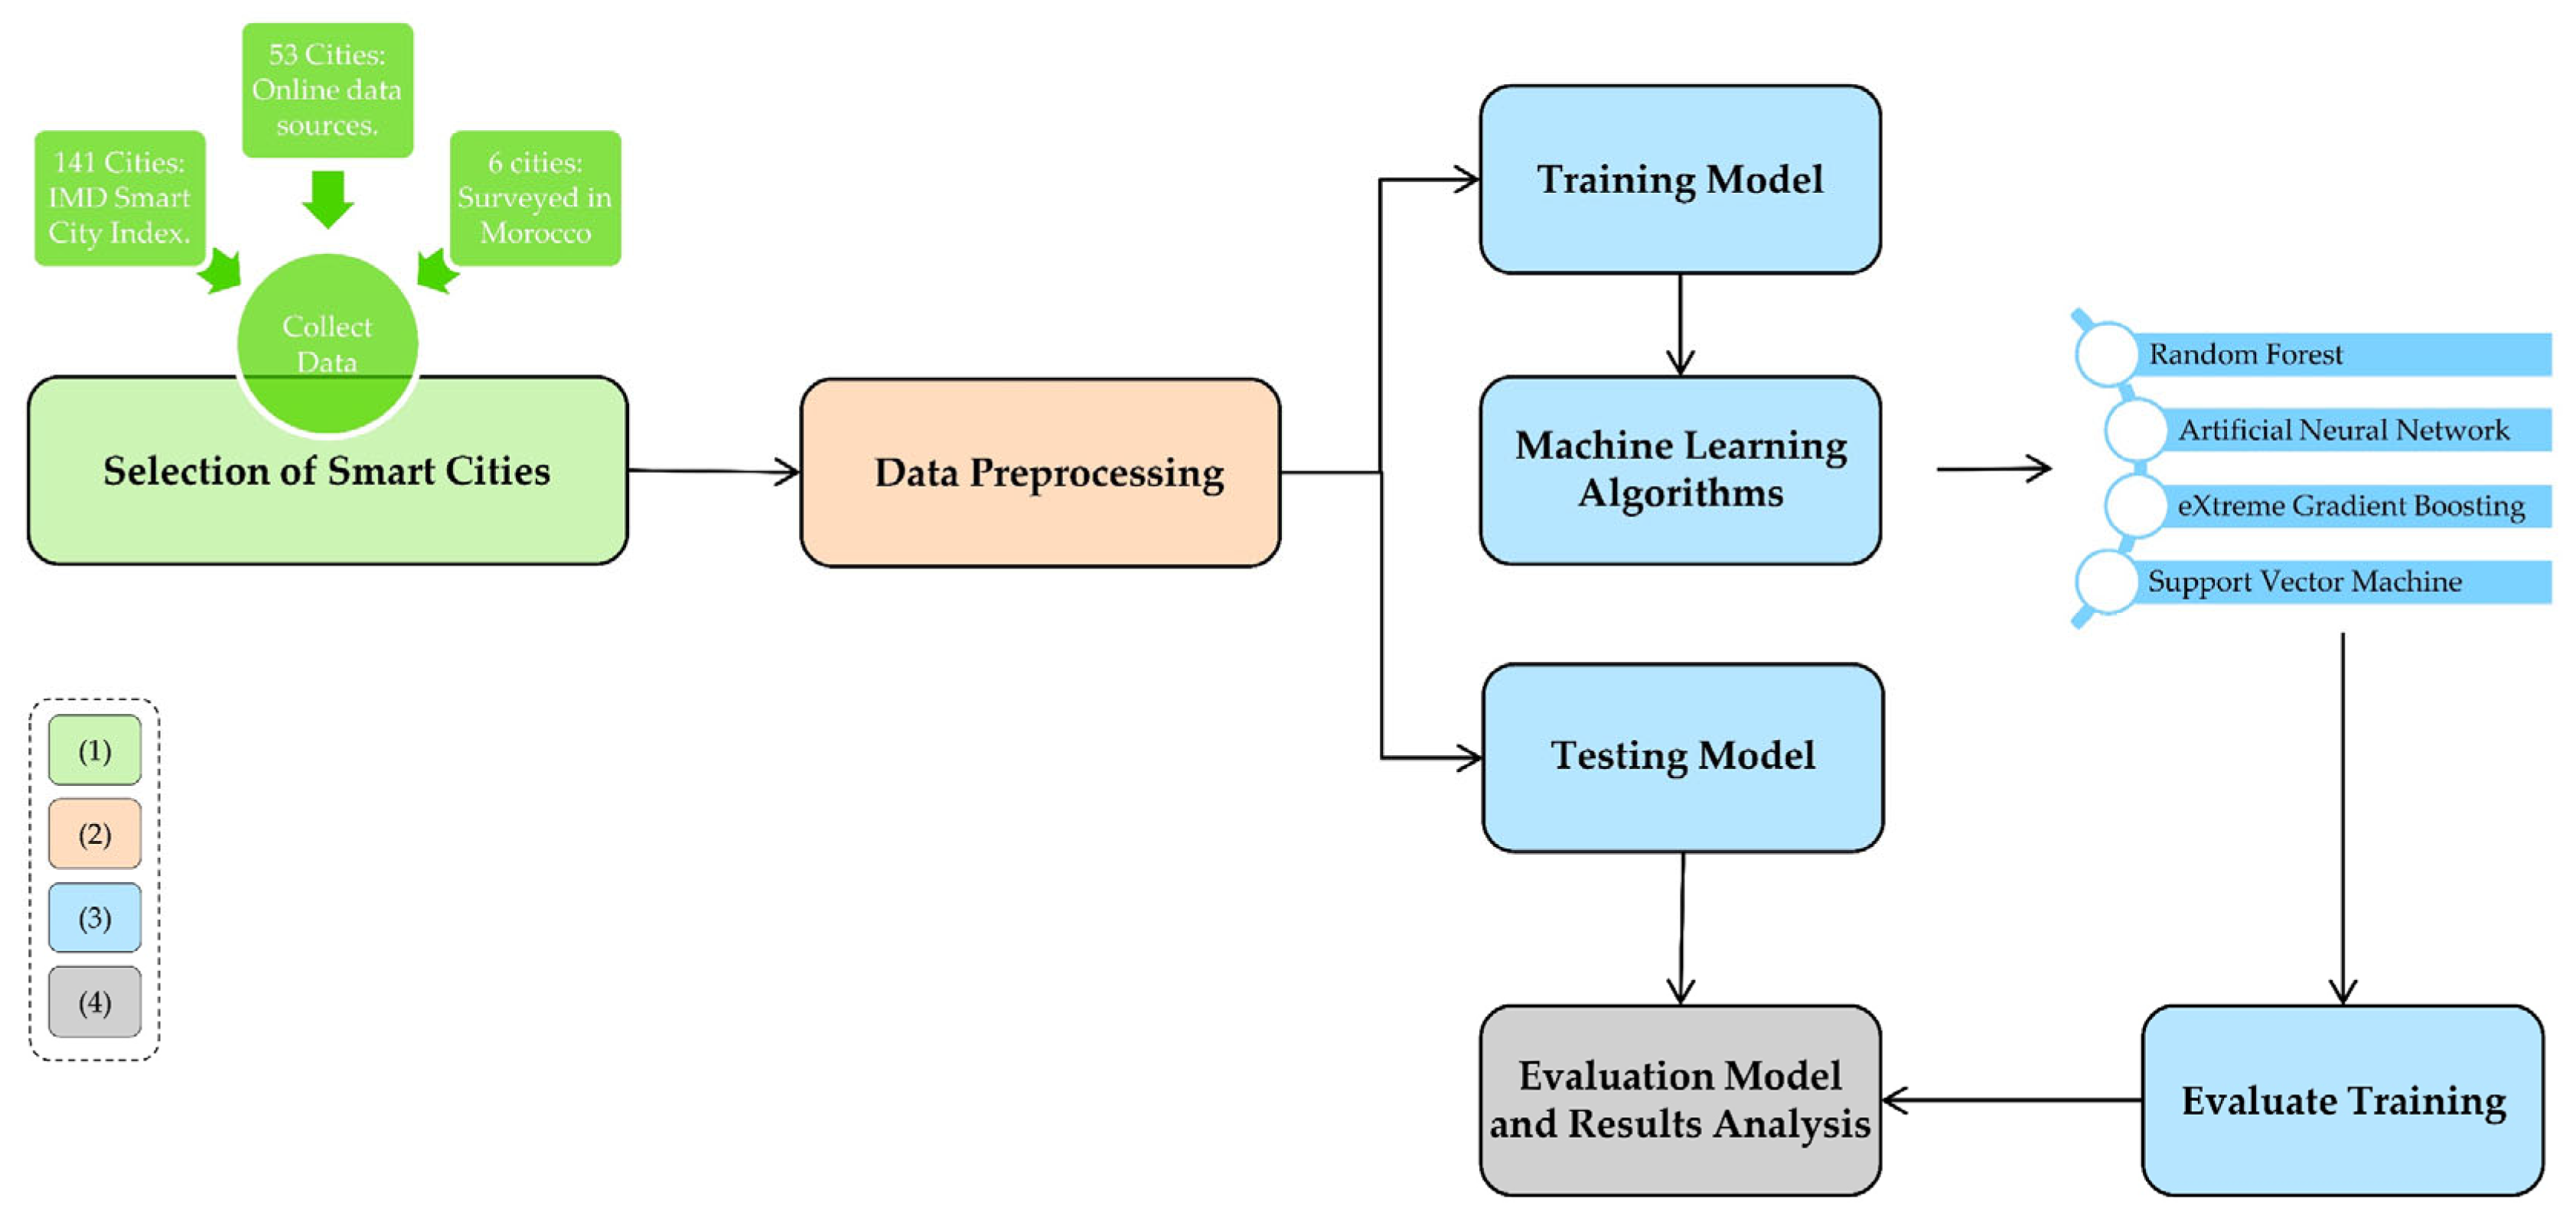
Figure 1 depicts the proposed methodological approach, which can be summarized by the following steps: (1) Selection of smart cities that will serve as the subjects of our study/will constitute the experimental basis of our research. (2) Classification, organizing and processing of collected data from non-structured to semi-structured format. (3) Testing various machine learning algorithms to train and test models using the processed data. (4) Results analysis and discussion evaluating the models’ performance and discussing the insights and implications derived from the analysis.
2.1. Selection of Smart Cities
During our study, we relied upon the study articulated by Lai and Cole in their research on “Measuring progress of smart cities: Indexing the smart city indices”, published in
Urban Governance [
9]. The principal aim of this study was to critically examine the integrity and quality of existing smart city indices, subsequently discerning those indices that possess the requisite attributes for effective international comparative analysis.
As a result of this study, we found that The Smart City Index (SCI), an ongoing initiative by the IMD World Competitiveness Center since 2019 [
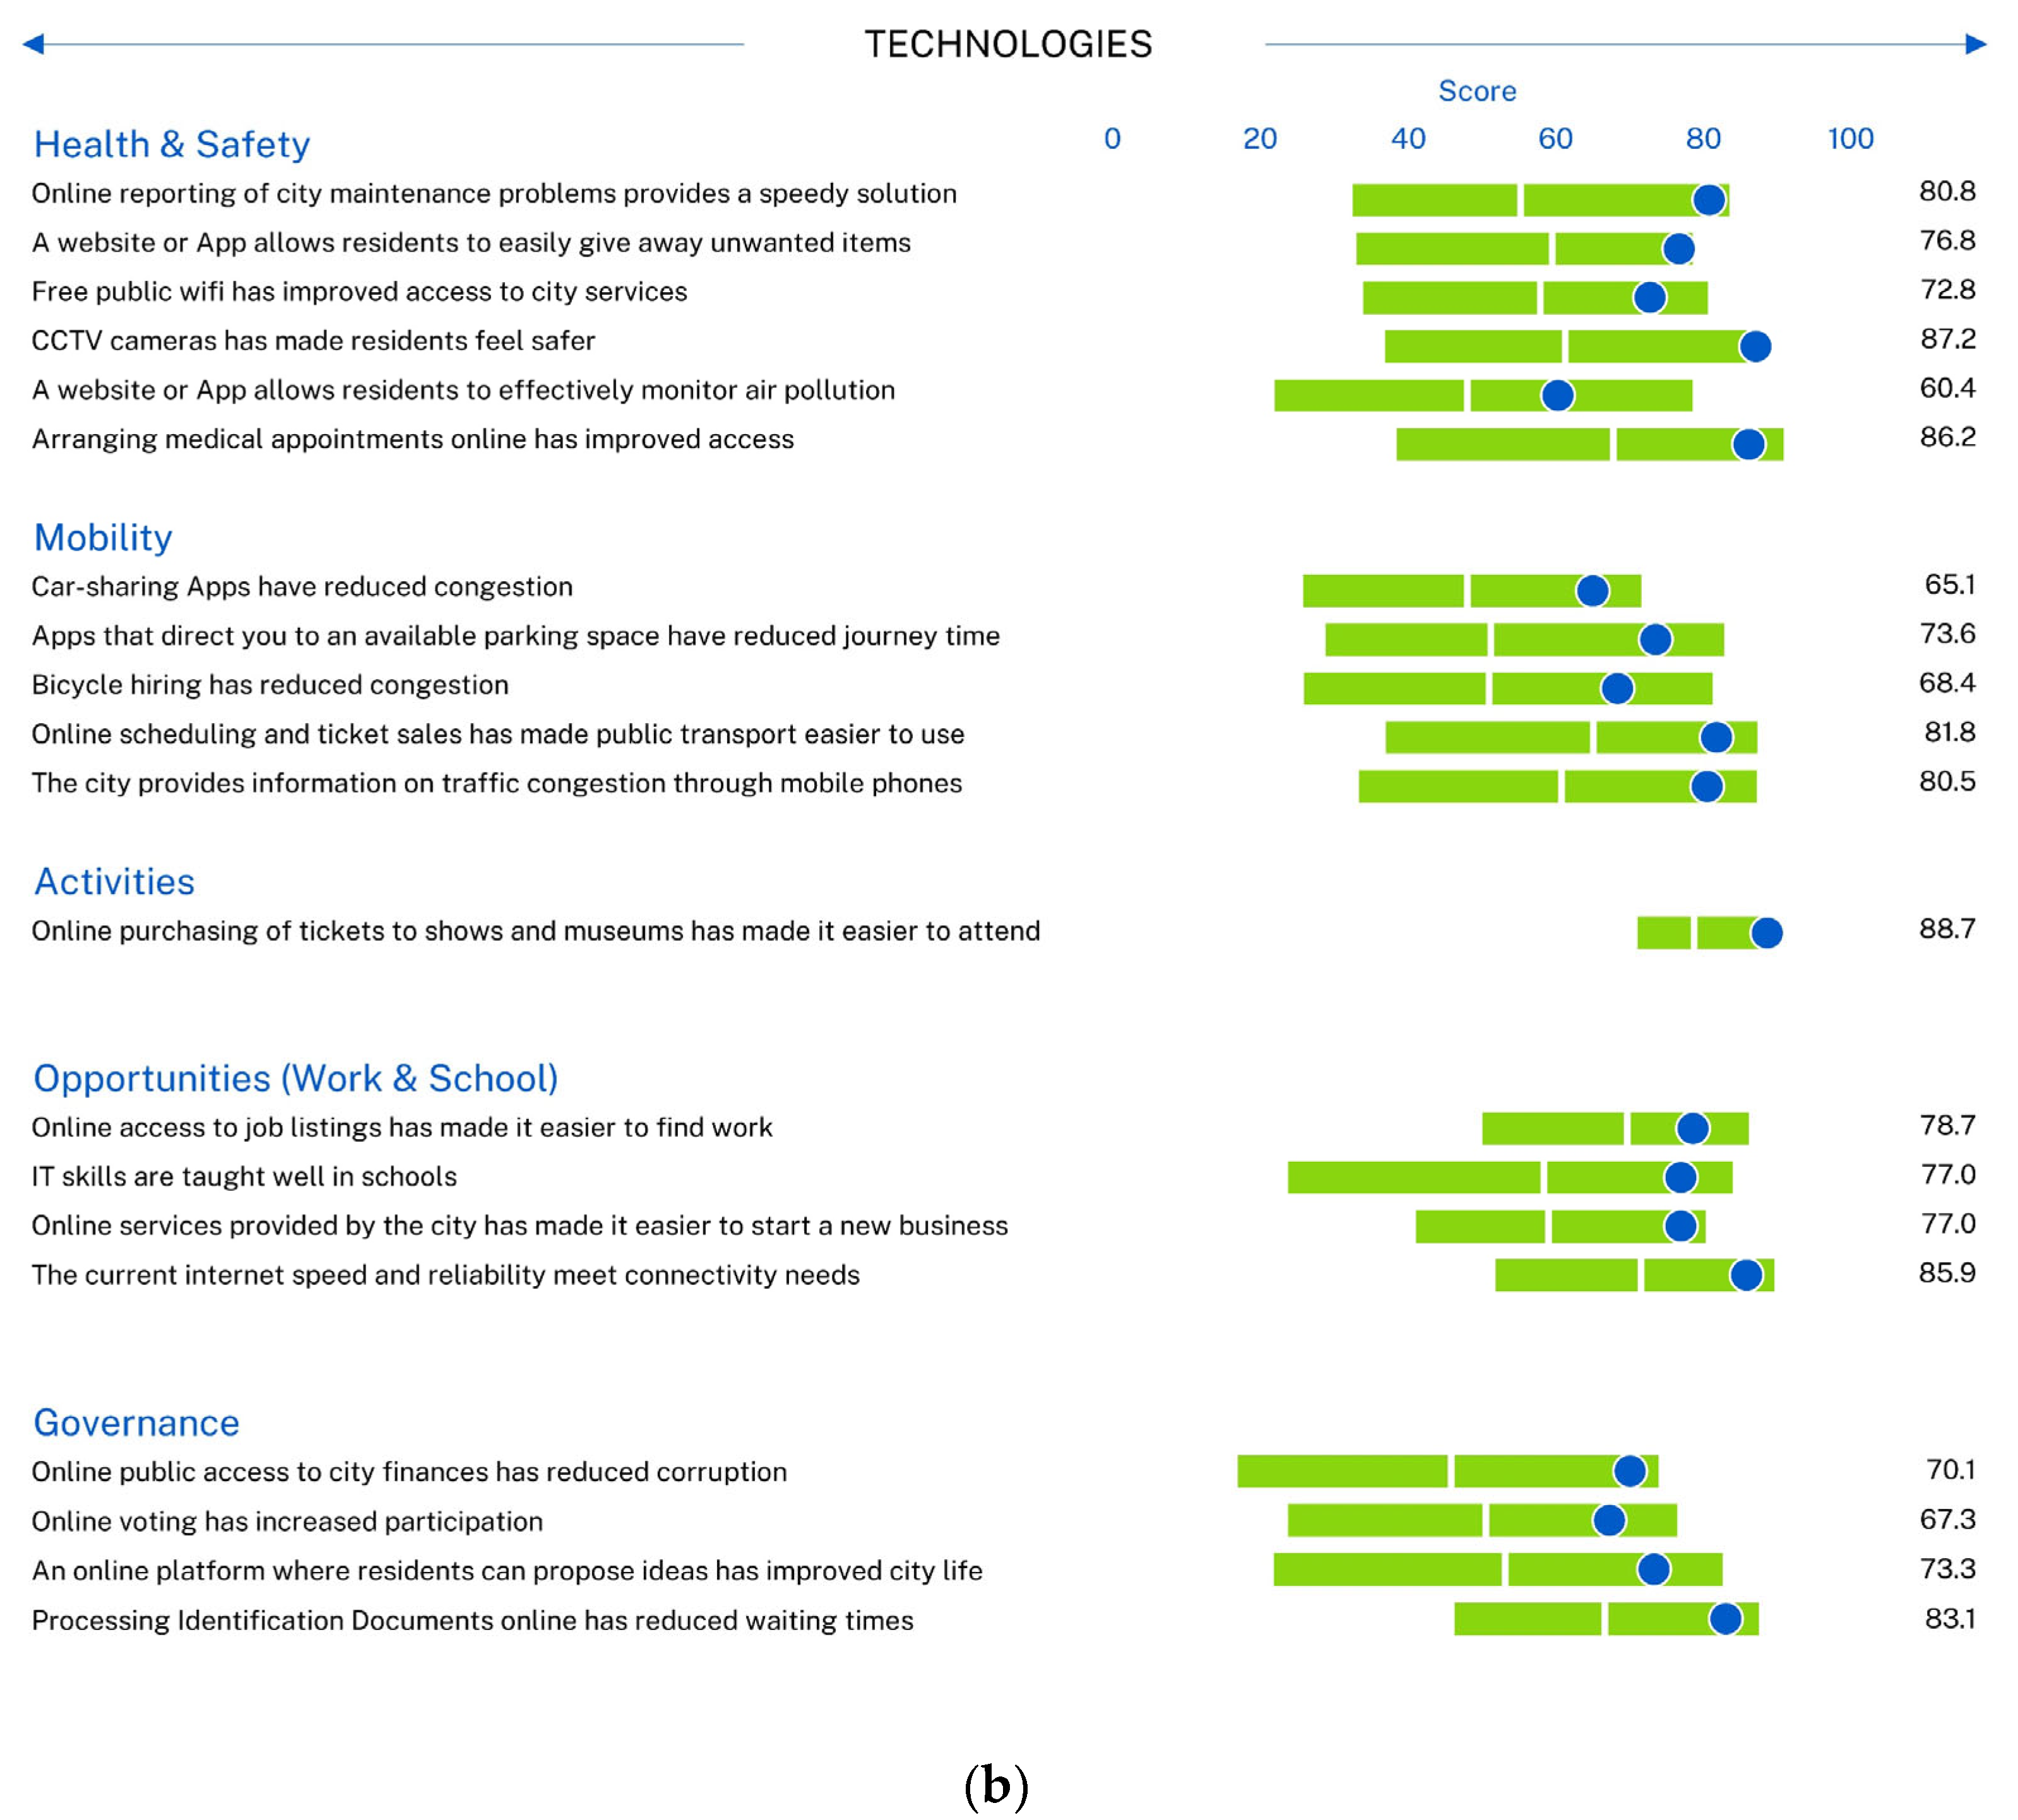
33], has emerged as a pivotal tool within the domain of smart city assessment. Its annual evaluations, encompassing a diverse array of indicators across distinct categories, encapsulate a rigorous and comprehensive approach to assessing the multifaceted dimensions of smart urbanization (see
Figure 2 for the full set of indicators). The SCI’s systematic framework, designed to gauge key aspects such as health and safety, mobility, activities, opportunities, and governance, lends credibility to its effectiveness as a robust evaluation mechanism. Furthermore, the SCI’s reliance on data gathered through citizen surveys enhances its utility, as it reflects the direct perceptions and sentiments of local residents. This participatory approach not only underscores its accuracy, but also positions it as a reliable source for insights into citizens’ priorities and attitudes towards smart city development. As demonstrated by its consistent application and adaptability, the SCI stands as a dependable foundation for future research endeavors seeking to delve deeper into the complex landscape of smart urbanization.
The methodology employed in the IMD research encompasses a global assessment of 141 cities. The Smart City Index 2023 meticulously gauges residents’ perceptions concerning the urban infrastructure and technological applications available within their cities. It ranks 141 cities by soliciting the perceptions of 120 residents in each city. These perceptions are gathered within two pivotal pillars: Structures, focusing on existing infrastructure, and Technology, encapsulating available technological services. These pillars encompass key evaluation areas such as health and safety, mobility, activities, opportunities, and governance. Data, presented in tabular form, juxtapose city scores against group benchmarks, facilitating comprehensive indicator comparisons.
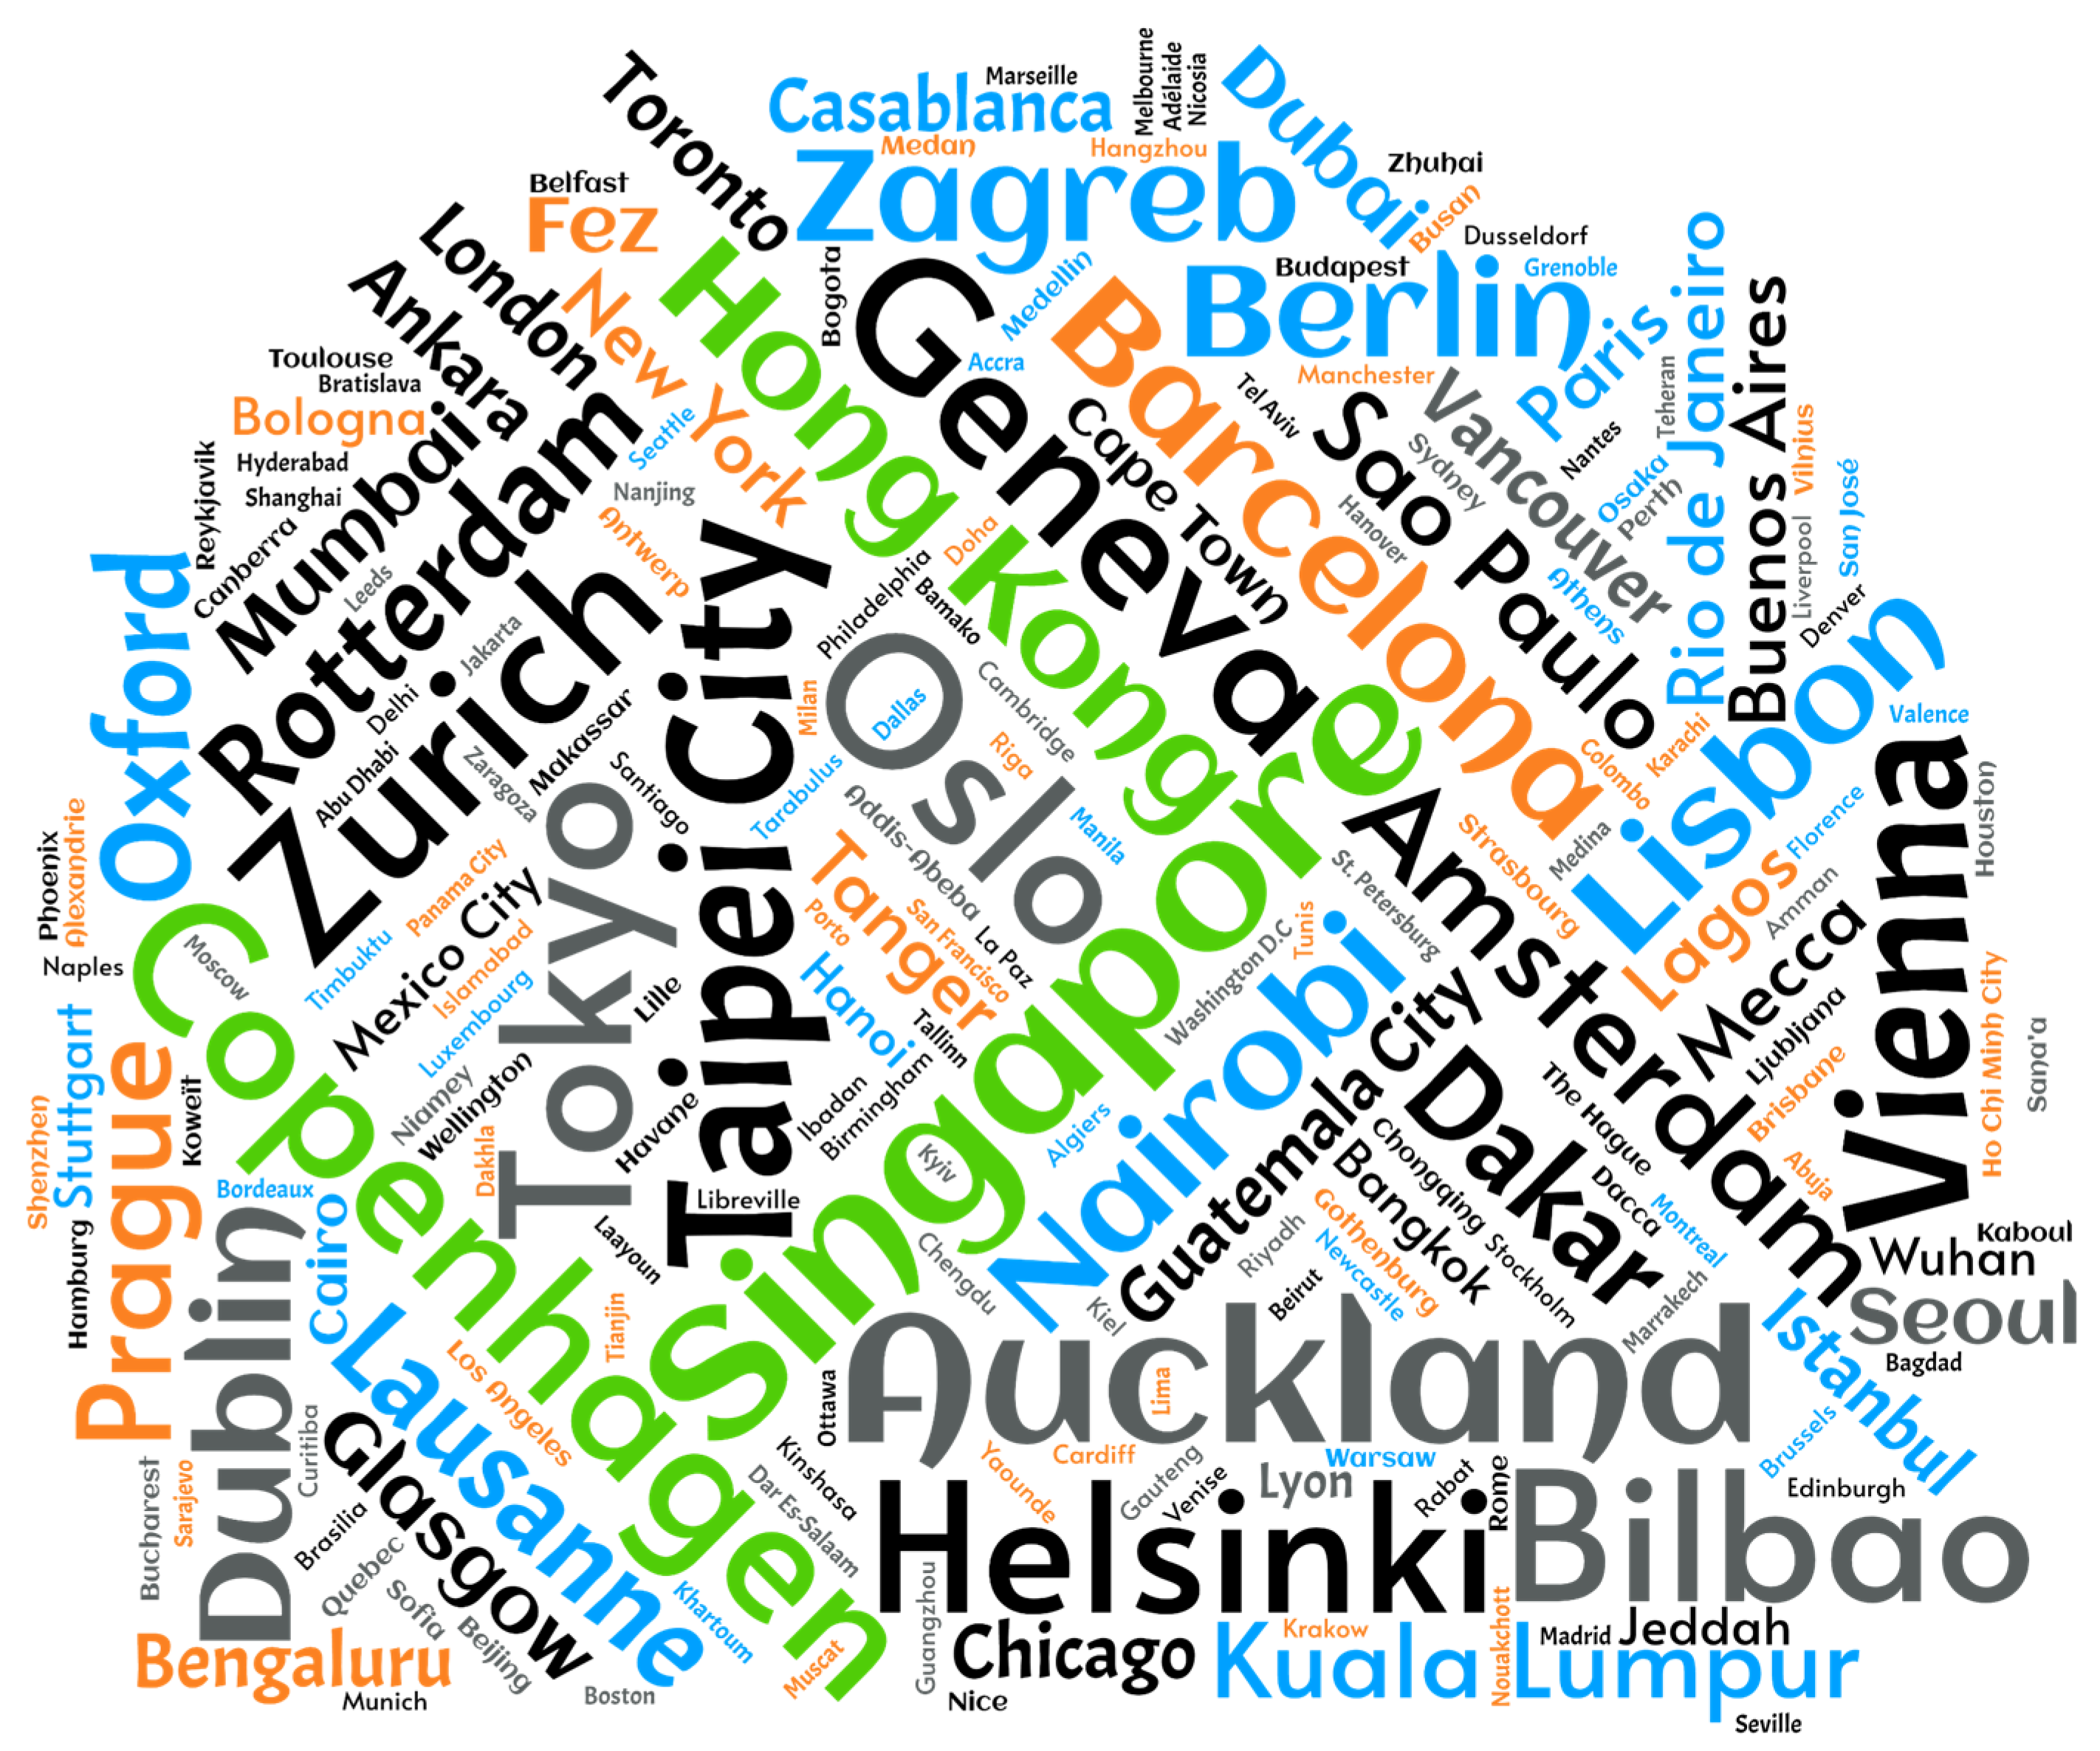
To augment our research scope, we targeted 200 cities (
Figure 3). In an intentional effort to create a balanced dataset, we deliberately included cities worldwide that are clearly not categorized as smart. This strategic approach was taken to establish an objective model that encompasses a diverse range of urban characteristics.
For this extended dataset, which now includes an additional 59 cities, we conducted a comprehensive research initiative. The data collection process involved both in-house research and a survey, thereby adhering to Bhattacherjee’s [
34] guidance on the significance of source diversity and Fowler Jr.’s [
35] benchmarks for survey excellence, enhancing the study’s methodological credibility and reliability. Specifically, we conducted a survey among local residents of six Moroccan cities: Casablanca, Fes, Marrakech, Tangier, Dakhla, and Laayoun. This survey was administered online via a Google Form, distributed through a link that participants filled out anonymously and voluntarily. To ensure ethical considerations and data privacy, all personal data collected through surveys were anonymized, and participants provided informed consent for the use of their data in this exploratory research study. The survey consisted of closed-ended questions designed to align with the 39 indicators mentioned in the study. We chose binary response options to facilitate both data transmission and subsequent analysis. For the remaining 53 cities, we meticulously reviewed official city websites to collect information and respond to the 39 indicators set in the study with a simple affirmative or negative response.
All the collected data, derived from the literature, collected indexes, online sources, and survey responses, were subsequently subjected to our machine learning model for training and analysis, contributing to the strength and comprehensiveness of our smart city identification framework.
2.2. Processing the Collected Data
The second section of the methodology delves into the classification and organization of the collected data, as outlined in
Section 1, transitioning from a non-structured to a semi-structured format.
To achieve this, the collected data (see
Figure 4 for a graphical representation of the original data) underwent a transformation into a binary format, where information is represented using only two distinct values, typically 0 and 1. This binary representation serves the purpose of facilitating data manipulation and transmission. Each value derived from the survey lower than 50% was encoded as the binary digit zero (0), while every value greater than or equal to 50% was depicted by the binary digit one (1). The adoption of a binary format streamlined data processing through simple logical operations.
The chosen binary format aligns with the objective of our study, which aims to determine whether a given city qualifies as “smart”. To enhance this determination, we introduced an additional column labeled “target”. Given the utilization of 39 indicators, we established a criterion where any city surpassing a strict cumulative score of 20 out of 39 would be recognized as “smart”. This qualification is then denoted as a value of 1 in the “target” field for subsequent analysis.
Throughout this processing and normalization stage, careful consideration was given to the choice of a binary format, ensuring its suitability for the study’s objectives. Challenges encountered during this process were systematically addressed to maintain the integrity and accuracy of the data.
2.3. Testing Different Algorithms of Machine Learning
In this study, we propose a framework that integrates various machine learning models for the first time to comprehensively investigate the smartness of cities worldwide, relying on a set of indicators. The classification techniques employed include the Artificial Neural Network (ANN), Random Forest (RF), Support Vector Machine (SVM), and Gradient Boost (XGB). These models predict the level of smartness, treated as categorical variables, based on the values of indicators categorized under two pillars: Structure and Technology.
Artificial Neural Network (ANN): Utilized for predicting smartness level based on Structure and Technology indicators, ANN implements a neural network architecture for complex pattern recognition.
Random Forest (RF): Employed in the prediction of smartness, treating it as a categorical variable, RF is an ensemble learning method using multiple decision trees to enhance predictive accuracy.
Support Vector Machine (SVM): Applied for predicting smartness levels, particularly in categorizing cities, SVM is effective in handling non-linear relationships between indicators.
Gradient Boost (XGB): Utilized to predict smartness levels by sequentially training decision trees, XGB is an ensemble method providing improved accuracy and reduced variance.
For the evaluation of these models, a multi-criteria performance assessment is conducted. This assessment combines numerous heterogeneous indicators across the Structure and Technology pillars in a standardized manner, resulting in a single synthetic score. This approach facilitates a comprehensive understanding of smartness, enabling effective model evaluation and contributing to the reliability of our smart city identification framework.
As for the tools and processes, we used Python 3 as the programming language with Jupyter Notebook version 6.5.2 as our development environment. The primary libraries utilized were Pandas for data manipulation and analysis, Scikit-learn for model selection, preprocessing, and evaluation metrics, XGBoost for implementing the Gradient Boosting algorithm, Matplotlib for data visualization, and Keras for implementing and training the Artificial Neural Network (ANN).
For the data processing, we used label encoding to convert categorical data into a numerical format. The dataset was divided into training and testing sets using an 80/20 ratio to ensure unbiased evaluation. This method ensures that the training set provides the model with a comprehensive understanding of the data, while the testing set is used to evaluate the model’s performance on unseen data.
By leveraging these tools and processes, we ensured that our models were trained and evaluated using a robust and reproducible framework. The combination of various machine learning models and a standardized approach to data processing and evaluation enhances the reliability and comprehensiveness of our smart city identification framework.
3. Results
Initially, we evaluated the smartness of all 200 cities worldwide to answer the research question regarding the extent to which present-day smart cities engage in the collaborative creation of infrastructure and technology within their development models. For each row, scores across each aspect under the Structure and Technology pillars were added to forecast the smartness level of each city.
Different ML algorithms were trained on the data for the smart cities (a total of 7800 data points) to predict whether a city is smart or not, based on the values for the indicators under each aspect. Thus, the input vector for the assessment of the Structural aspect comprised 19 predictors. Similarly, for the Technological aspect, the indicators related to health and safety, mobility, activities, opportunities in work and school, and governance (a total of 20 indicators) were used as predictors that determined the response variable, namely, the level of smartness. The dataset was split into train and test sets that comprised 80% and 20% of the complete dataset, respectively.
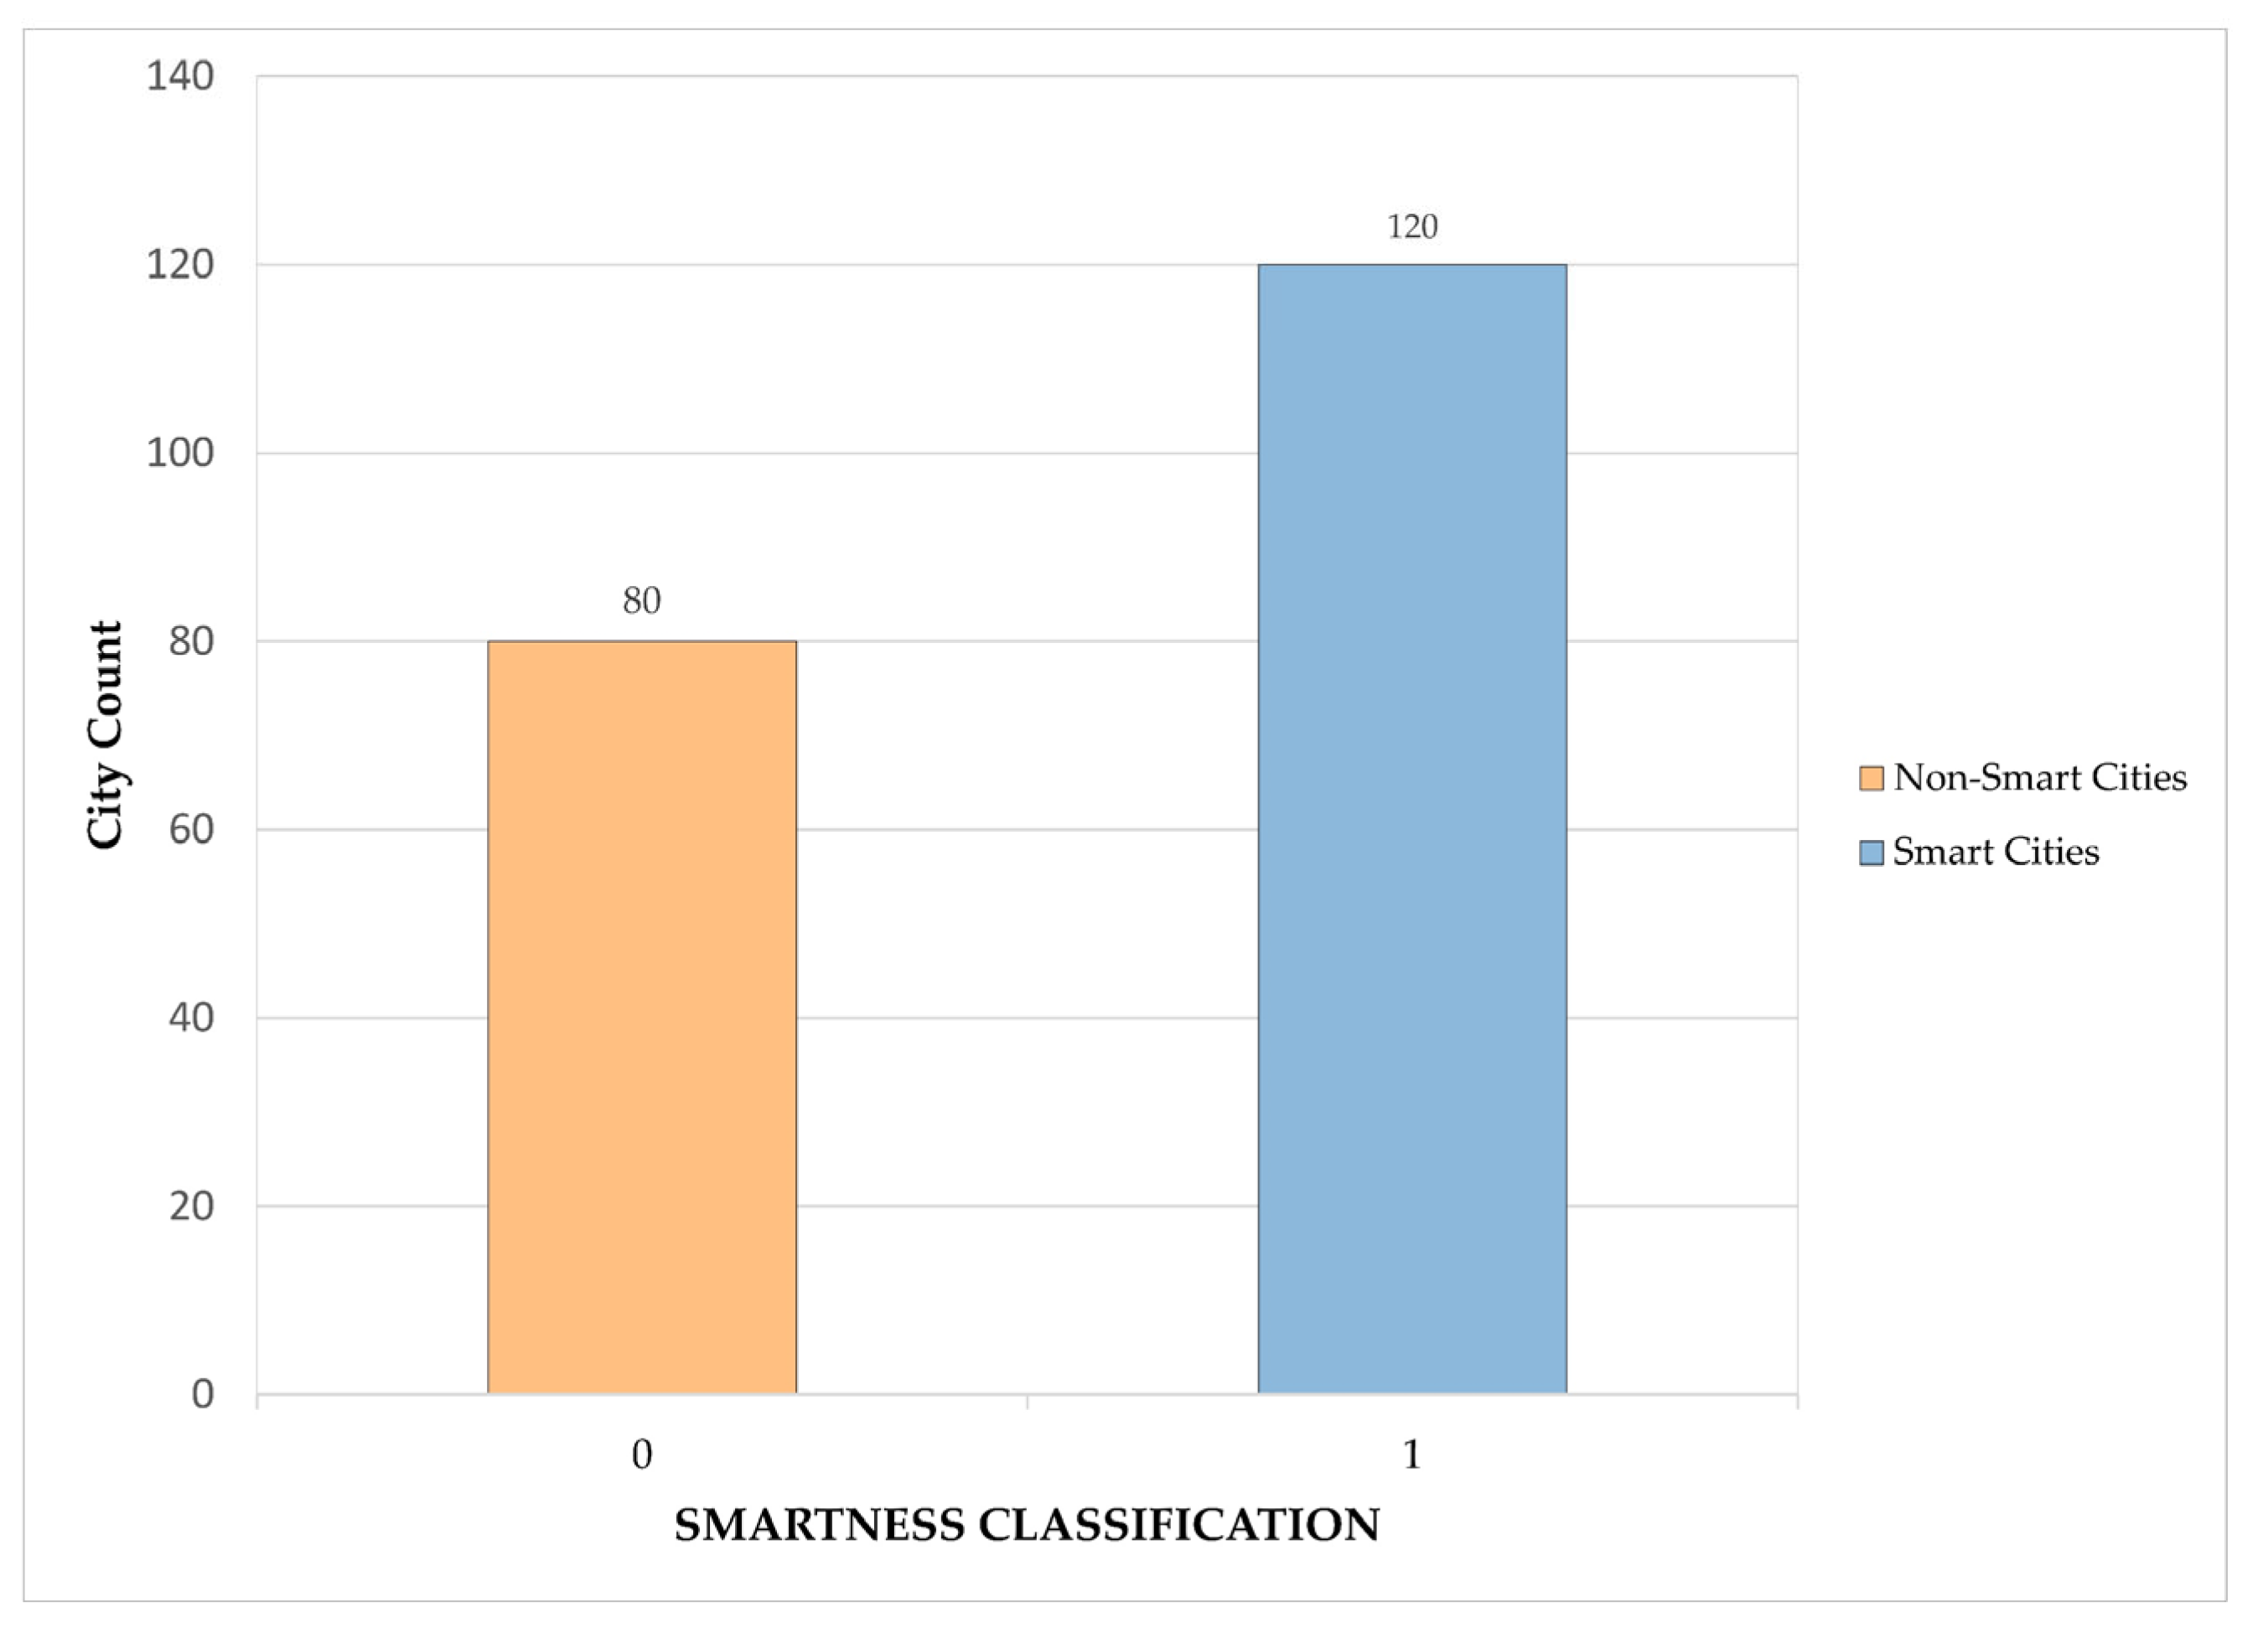
Building upon this analysis conducted on 200 cities under the two pivotal pillars—Structural and Technological—it was noteworthy that the study found a distinct pattern. Among the examined cities, a significant majority, accounting for 60%, were classified as ‘smart’, while the remaining 40% fell into the ‘non-smart’ category (
Figure 5). This distribution implies a clear contrast in the developmental orientation and integration of these cities, forming the basis for understanding the defining factors that delineate ‘smartness’.
To compare the classification models, we used overall accuracy (ACC) as the metric. Among the individual models, the Artificial Neural Network (ANN) and Random Forest (RF) showed the highest performance in predicting the smartness of cities with the training dataset, achieving an accuracy of 97.5%. The XGBoost (XGB) model exhibited a closely competitive performance, with an accuracy of 97%. On the other hand, the Support Vector Machine (SVM) classifier, while slightly trailing, still showed a high performance with an accuracy of 95% (
Figure 6).
A further analysis of model performances showed that the RF model not only achieved high accuracy (as reported in
Table 1), but also demonstrated robustness in handling various data types and complex structures within the dataset. This model’s ability to maintain high performance across both binary and multiclass classifications underscores its utility in handling diverse urban datasets, which often contain intricate and heterogeneous data structures.
The Artificial Neural Network (ANN) demonstrates commendable precision, highlighting its strength in accurately identifying true positives without misclassifying non-smart cities as smart (see
Table 2). This precision is crucial for applications where the cost of a false positive is high, such as in targeted urban development and resource allocation. The slightly lower accuracy compared to RF, yet high ROC area, suggests that while it may occasionally misclassify, its predictions are generally on point and reliable across varied urban scenarios.
XGBoost (XGB) showcases a balance between accuracy and computational efficiency, making it a competitive choice for processing the large datasets common in urban studies (see
Table 3). The model’s accuracy is nearly comparable with that of RF, highlighting its capability to adapt and learn from complex and high-dimensional data swiftly. The high ROC area score further confirms its ability to discriminate between the classes effectively, which is essential for nuanced urban analysis.
Support Vector Machine (SVM), while trailing slightly in accuracy (as reported in
Table 4), still performs commendably with a 95% accuracy rate. This model is particularly noted for its effectiveness in higher-dimensional spaces, which is typical of urban data involving multiple indicators. This high performance, coupled with a perfect ROC curve area, suggests that SVM is exceptionally capable of defining decision boundaries clearly and precisely between smart and non-smart cities.
These metrics highlight each model’s effectiveness in urban classification and emphasize the importance of choosing the right model for specific project needs. While RF and XGBoost excel in accuracy, ANN and SVM stand out for their precision and ability to delineate clear decision boundaries between smart and non-smart cities. This detailed insight into each model’s capabilities allows for more targeted and effective applications in urban studies.
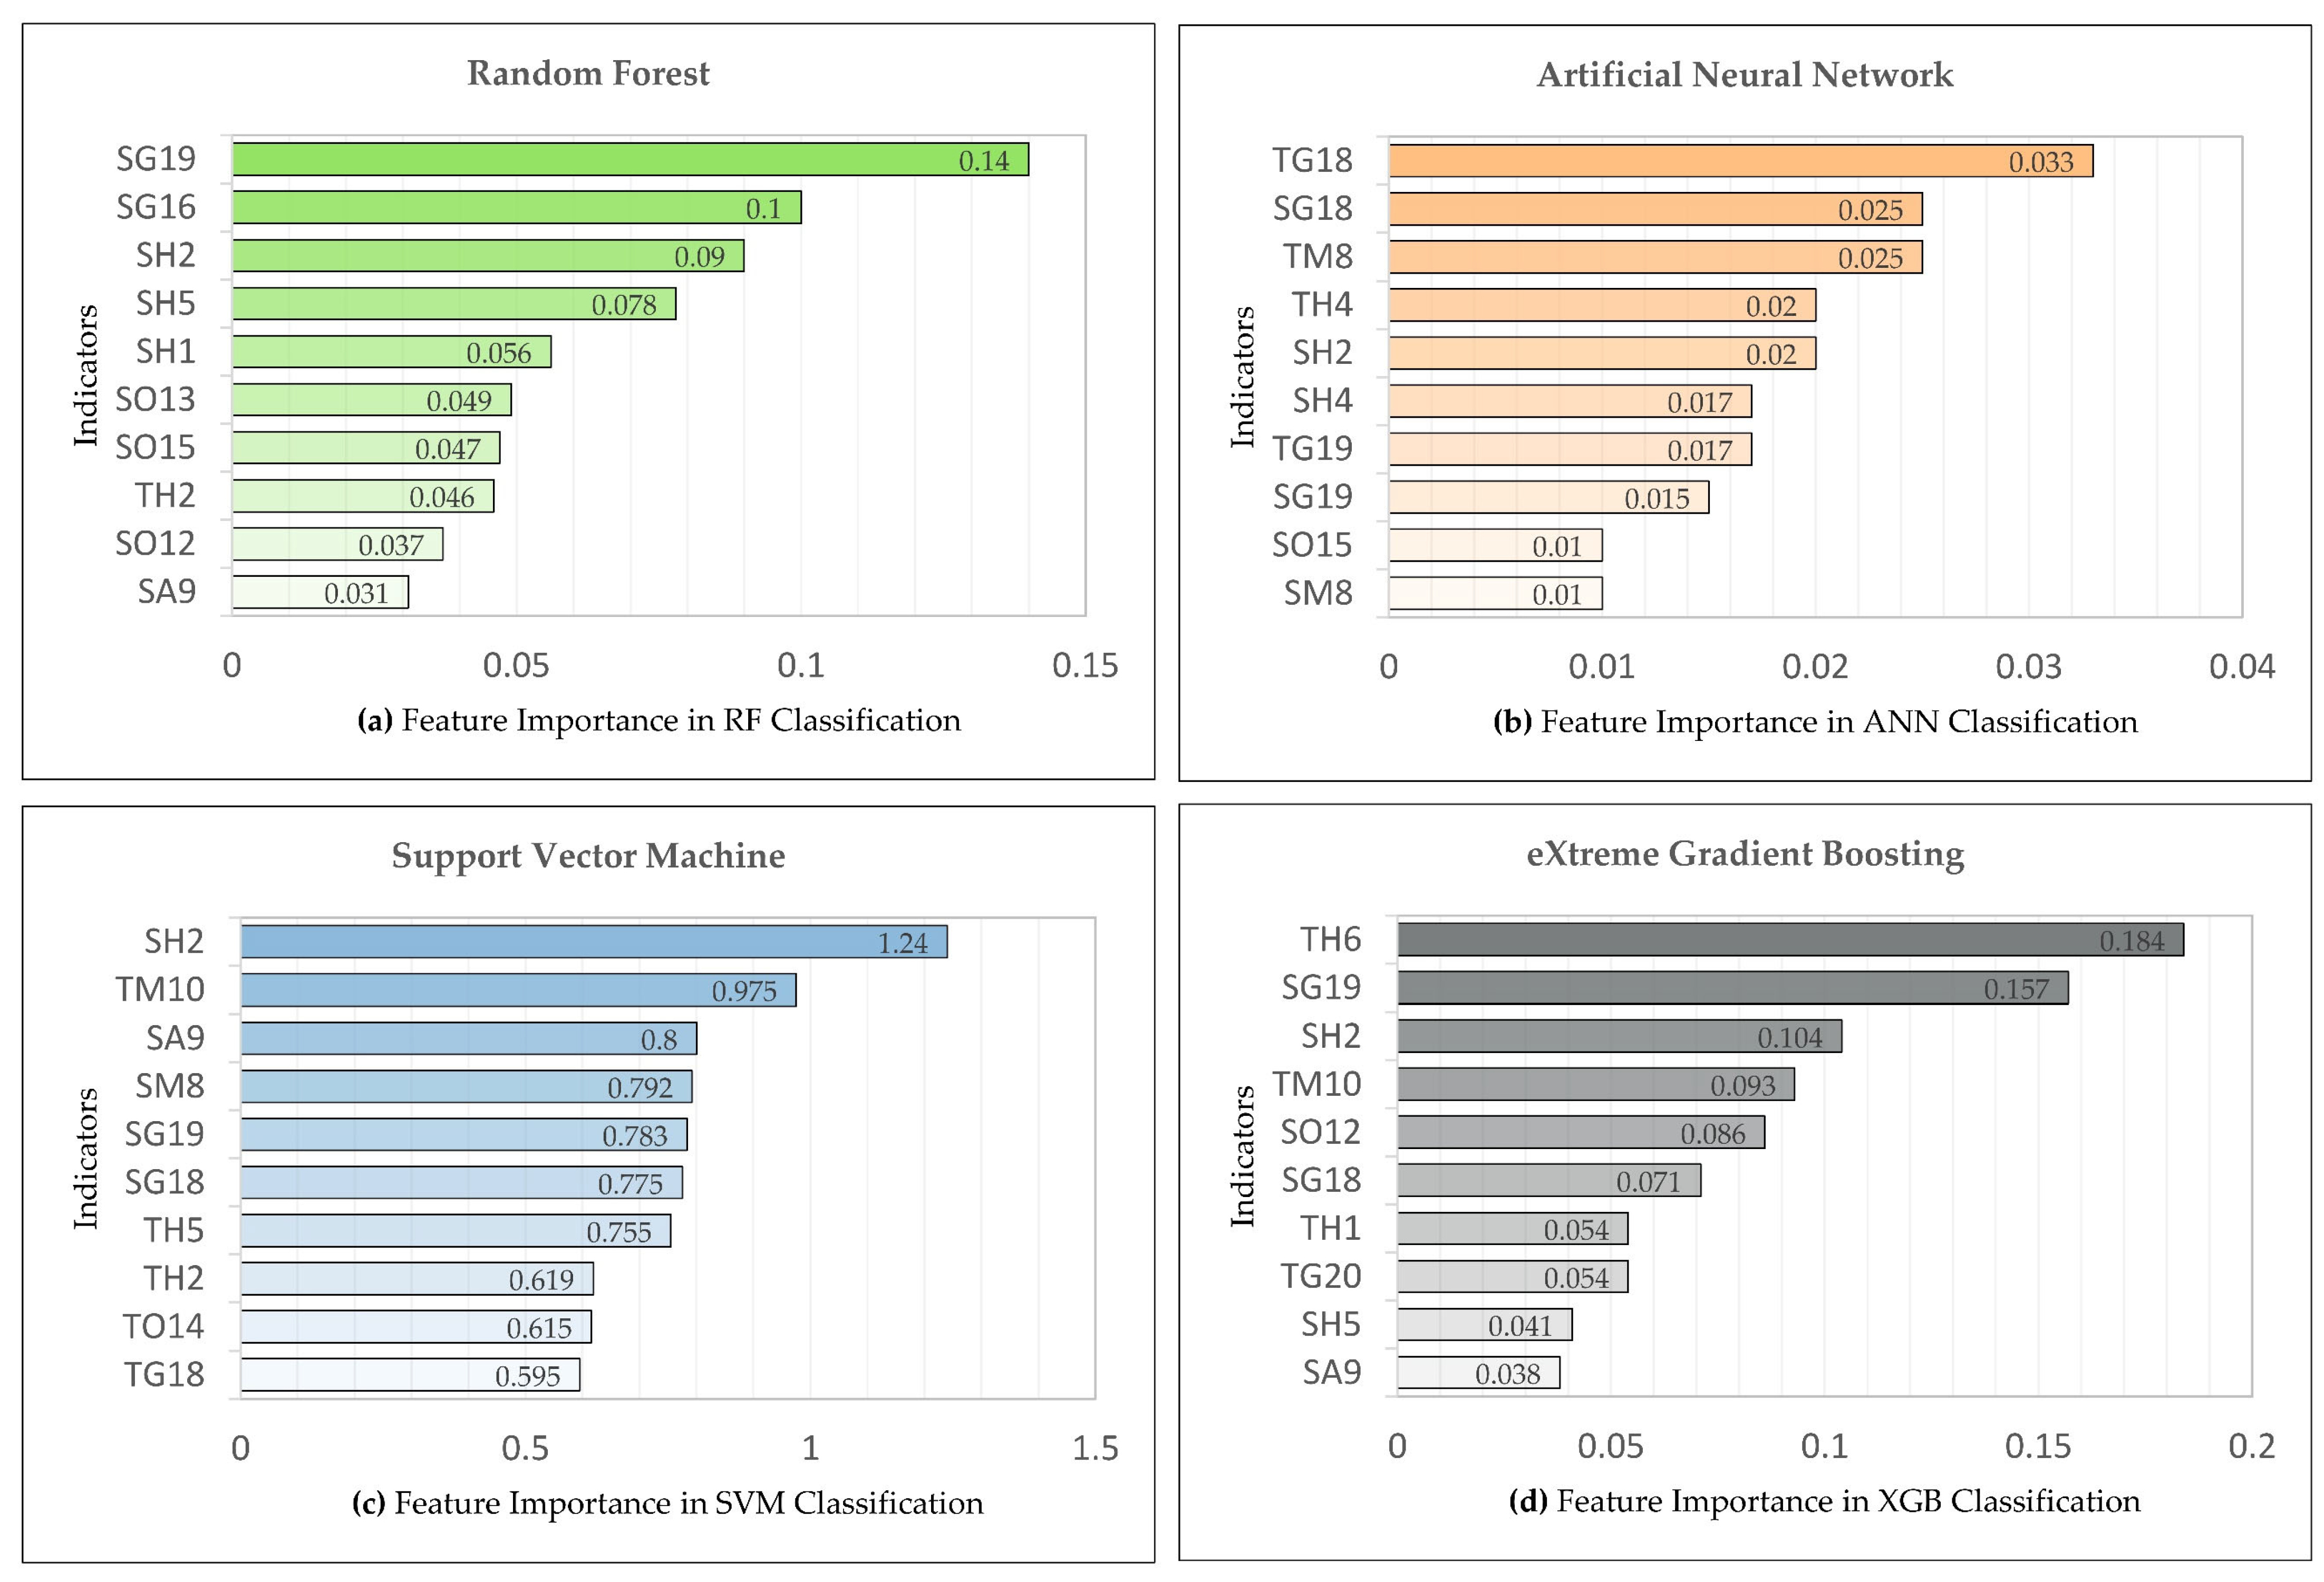
Building on this analysis, our enhanced approach further explores the implications of these findings, leveraging advanced analytics to deepen our understanding of the pivotal indicators that define smart cities. This refined exploration has enabled a clearer description of the key facets of urban functionality and development, providing a nuanced perspective on the structural and technological dimensions that characterize smart urban environments (
Figure 7). Each model highlights different facets of urban functionality and development through their identification of key indicators.
Random Forest strongly emphasizes the importance of governance and health and safety. Key governance indicators such as community feedback mechanisms (SG19) and access to information on government decisions (SG16) underscore a model of smart cities where community engagement and transparency are fundamental. In the realm of health and safety, the model highlights the critical roles of sustainable waste management practices (SH2) and reliable medical service provision (SH5), marking them as vital for promoting environmental sustainability and ensuring public health—both essential components of smart urban development.
Similarly, XGBoost underscores the importance of governance with a significant focus on community feedback mechanisms (SG19), and also highlights the role of technology in enhancing health services with features like online medical appointment scheduling (TH6). This suggests a strong commitment to integrating digital solutions to streamline health service operations. Additionally, online scheduling and ticket sales for public transportation (TM10) and online reporting systems for city maintenance (TH1) demonstrate XGBoost’s emphasis on improving urban mobility and maintenance through technology.
The Artificial Neural Network highlights the pivotal role of governance, technology, and mobility in smart cities. Key indicators such as online voting to increase civic participation (TG18) and resident participation in local government decision-making (SG18) are noted as essential for fostering civic engagement and enhancing government transparency. Mobility solutions such as apps for locating parking spaces (TM8) are emphasized for their role in boosting transportation efficiency. The model also points to environmental sustainability and public health through effective recycling services (SH2) and the management of air quality (SH4).
The Support Vector Machine showed a strong emphasis on the integration of urban services and governance. It particularly highlights the role of recycling services (SH2) and public transport efficiency (SM8), underscoring a commitment to environmental sustainability and efficient transportation. The significance of green spaces (SA9) is also recognized as critical to enhancing urban livability. Additionally, governance is emphasized through resident feedback (SG19) and resident participation in governance (SG18), indicating a comprehensive approach to urban planning that values community involvement and sustainable practices. Technological advancements such as a website or app for air pollution monitoring (TH5) and online voting systems (TG18) further reflect the commitment to using modern technology to improve urban living conditions.
This analysis not only reinforces the efficacy of the models used but also highlights the multifaceted nature of urban intelligence. By leveraging diverse machine learning techniques, the study provides a nuanced understanding of how various aspects of a city interact to foster a smart urban environment. The comparison of the four different models reveals that while they all exhibit high accuracy in identifying smart cities, they emphasize different indicators, underscoring the importance of a diverse analytical approach. This diversity in analysis allows us to see which indicators consistently appear across models, suggesting a robust framework for cities aiming to enhance their ‘smartness’.
These findings illustrate that no single aspect of urban development can singularly define ‘smartness’—rather, it is the collective enhancement across governance, health, mobility, and technology that characterizes truly smart cities. The consistent emphasis on community feedback mechanisms, sustainable waste management practices, and active resident participation in governance across multiple models underscores the pivotal role of these aspects in categorizing cities as ‘smart’ or ‘non-smart’. Cities that excel in fostering civic engagement, environmental consciousness, and open governance align more closely with the criteria for ‘smart cities’. Therefore, cities aiming to transition from ‘non-smart’ to ‘smart’ should focus on adopting and enhancing these key aspects, which have been repeatedly validated across different models, to upgrade their urban infrastructure and services effectively.
4. Discussion
This study introduced a novel assessment framework, combining multivariate data and diverse machine learning models to evaluate the smartness of 200 cities worldwide based on selected indicators. The proposed approach integrates the co-creation of structural and technological pillars within existing development models of smart cities. The analysis of multivariate data and city scores facilitates a comprehensive understanding of cities’ performance in structural and technological aspects, enabling ongoing performance monitoring for smart cities.
Transitioning from data collection to analysis, the application of various machine learning classifiers was targeted at predicting the smartness levels of each city. Among these classifiers, the ANN and RF, followed closely by XGB, stood out for their high accuracy, as evidenced by their high ACC values. These findings highlight the critical importance of both individual and ensemble models in effectively predicting urban intelligence, with each contributing to high levels of accuracy in their respective applications.
The pivotal difference distinguishing ‘smart’ cities primarily lies within the realm of technological prowess. It is the overwhelming prevalence of specific technological indicators that emphasizes the critical role of technological integration in shaping a city’s ‘smartness’. To earn the label of ‘smart’, a city must prioritize and advance its technological infrastructure. This aspect serves as the distinctive feature and hallmark of comprehensive advancement, seamlessly integrating technology into daily life.
Technological capabilities serve as the primary driver in distinguishing a city’s ‘smart’ status, outlining the imperative nature of technological advancement in modern urban development (as shown in
Figure 8). Embracing innovation and integrating technology into urban infrastructure signify the evolution towards a smarter status. Such initiatives attract investments, expertise, and talent, fostering economic growth and defining the trajectory of smarter cities.
However, while our findings are robust, they are not without limitations. The generalizability of the results may be influenced by inherent biases in the data collection methods or the specific selection of cities. Future research should consider a broader dataset and potentially incorporate real-time data to more accurately capture the evolving dynamics of urban environments. Furthermore, addressing challenges such as data privacy, ethical considerations in AI applications, and the standardization of data quality across different urban settings will be crucial for enhancing the reliability and applicability of machine learning models in smart city assessments.
The findings discussed in the results section highlight the critical role of technological advancements, sustainable practices, and civic engagement in enhancing a city’s smartness. Implementing sustainable waste management and ensuring reliable medical services not only support environmental and health objectives, but also foster a more engaged, informed, and healthy population. For example, Zurich has demonstrated the effectiveness of sustainable waste management [
36], while Singapore’s advanced healthcare systems have significantly enhanced its urban environment [
37,
38]. These practices suggest that cities focusing on these aspects can develop resilient infrastructures capable of adapting to future challenges, thus maintaining their smart status over time.
Enhancing civic engagement through online platforms and improving mobility with smart applications greatly contribute to a city’s smartness. Focusing on environmental sustainability and public health is crucial for creating a livable and sustainable urban environment. By leveraging these strategies, cities can become more interactive and efficient, like in Copenhagen, where emphasis on civic engagement and environmental sustainability has significantly contributed to its reputation as a leading smart city [
39]. Cities that successfully integrate these technological and governance improvements are likely to experience increased citizen satisfaction and better quality of life, reinforcing their status as smart cities.
Furthermore, integrating these technologies into urban infrastructure can lead to more efficient service delivery, reduced operational costs, and improved quality of life for residents. By adopting such technologies, cities can make urban living more convenient and sustainable. Focusing on these factors can significantly enhance urban livability and sustainability, thereby contributing to the overall smartness of cities.
Building on this foundation, it is imperative that urban development models learn from the success stories of cities that have effectively integrated smart technologies. These models serve as blueprints for progress, providing actionable insights that can be tailored to the unique needs of cities aiming to transition towards smarter urban environments. The development of these intelligent urban spaces is not only about technological integration, but also about fostering livable, inclusive, and resilient communities.
In conclusion, this study has provided a comprehensive and detailed analysis of the factors that define smart cities. By leveraging machine learning techniques and a refined methodological approach, we have enhanced our understanding of urban smartness, offering a richer, data-driven perspective that supports effective decision-making and strategic urban planning.
5. Conclusions
This study has developed a novel assessment framework combining multivariate data analysis with diverse machine learning models to evaluate the smartness of cities worldwide. By integrating structural and technological indicators, we have provided a comprehensive approach to understanding and monitoring the performance of smart cities. Machine learning techniques, particularly the Artificial Neural Network (ANN), Random Forest (RF), Support Vector Machine (SVM), and XGBoost (XGB), have demonstrated high accuracy in predicting city smartness based on selected indicators. Each model highlights different facets of urban functionality, emphasizing the multifaceted nature of urban intelligence.
Key insights reveal that technological integration significantly contributes to a city’s smart status. Enhancing civic engagement and improving mobility through smart applications are also crucial for creating interactive, efficient, and sustainable urban spaces. The consistent identification of key indicators across models suggests a robust framework for cities aiming to enhance their smartness.
In conclusion, this study has provided a comprehensive and detailed analysis of the factors that define smart cities. By leveraging machine learning techniques and a refined methodological approach, we have enhanced our understanding of urban smartness, offering a richer, data-driven perspective that supports effective decision-making and strategic urban planning. Our hypothesis that machine learning models, when applied to extensive urban data, can effectively and accurately identify the defining characteristics of smart cities has been validated. This research contributes to the growing body of knowledge on smart city assessment and provides actionable insights for city planners and policymakers to foster livable, inclusive, and resilient communities.
