Article

Should Autonomous Vehicles Collaborate in a Complex Urban Environment or Not?

1
College of Information Technology, United Arab Emirates University, Abu Dhabi 15551, United Arab Emirates
2
Emirates Center for Mobility Research (ECMR), United Arab Emirates University, Abu Dhabi 15551, United Arab Emirates
*
Author to whom correspondence should be addressed.
Smart Cities 2023, 6(5), 2447-2483; https://doi.org/10.3390/smartcities6050111
Submission received: 12 July 2023 / Revised: 7 August 2023 / Accepted: 10 August 2023 / Published: 20 September 2023

Abstract

:
A specialized version of collaborative driving is convoy driving. It is referred to as the practice of driving more than one vehicle consecutively in the same lane with a small inter-vehicle distance, maintaining the same speed. Extensive research has been conducted on convoys of heavy-duty trucks on the highway; however, limited research has studied convoy driving in an urban environment. The complex dynamics of an urban environment require short-lived collaboration with varying numbers of vehicles rather than collaborating over hours. The motivation of this research is to investigate how convoy driving can be realized to address the challenges of an urban environment and achieve the benefits of autonomous driving such as reduced fuel consumption, travel time, improved safety, and ride comfort. In this work, the best-fitted coalitional game framework is utilized to formulate the convoy driving problem as a coalition formation game in an urban environment. A hypothesis is formulated that traveling in a coalition is more beneficial for a vehicle than traveling alone. In connection with this, a coalitional game and an all-comprehensive utility function are designed, modeled, and implemented to facilitate the formation of autonomous vehicle coalitions for convoy driving. Multiple solution concepts, such as the Shapley allocation, the Nucleolus, and the Core, are implemented to solve and analyze the proposed convoy driving game. Furthermore, several coalition formation strategies such as traveling mode selection, selecting optimal coalitions, and making decisions about coalition merging are developed to analyze the behavior of the vehicles. In addition to this, extensive numerical experiments with different settings are conducted to evaluate and validate the performance of the proposed study. The experimental results proved the hypothesis that traveling in a convoy is significantly more beneficial than traveling alone. We conclude that traveling in a convoy is beneficial for coalition sizes of two to four vehicles with an inter-vehicle spacing of less than 4 m considering the limitations of an urban environment. Traveling in a coalition allows vehicles to save on fuel, minimize travel time and enhance safety and comfort. Furthermore, the findings of this research state that achieving the enormous benefits of traveling in a coalition requires finding the right balance between inter-vehicle distance and coalition size. In the future, we plan to extend this work by studying the evolving dynamics of the coalitions and the environment.

1. Introduction

The realization of autonomous driving can significantly reduce road traffic accidents, congestion, and excessive fuel consumption by transferring driving control from humans to autonomous vehicles. The Society of Automotive Engineers (SAE) [1] classifies autonomous vehicles (AVs) into five levels of autonomy. Currently, available autonomous driving features in Level 2 (L2), and L3 vehicles primarily consist of Advanced Driving Assistance Systems, initially deployed in controlled and structured environments. However, in complex urban and uncontrolled settings, the presence of a mix of AVs, conventional vehicles, vulnerable road users, and dynamic unexpected events pose challenges to safe navigation, minimizing travel delays, and avoiding congestion. Defining the complex urban environment is difficult as there is no universally agreed-upon definition. Based on our research, we provide our own definition of a complex environment and present a high-level abstract (Figure 1) that encapsulates the most relevant dynamics representative of a complex urban environment. To facilitate understanding and highlight challenges in specific urban settings, we break down the environment into various scenes such as fewer dynamics, roundabout challenges, sharp turns, etc., as depicted in Figure 1 (readers are highly encouraged to refer to the authors’ recent publication [2] for further details).
To address the challenges posed by the urban environment, the traditional autonomous driving systems at L2 and L3 are striving towards achieving L5, which represents fully autonomous driving. In line with this objective, both the industry and research communities have been actively developing and offering solutions, such as collaborative autonomous driving [3], to enable a higher degree of autonomy.
Collaborative autonomous driving solutions have been present for some time, but their focus has primarily been on lower levels of automation and vehicular networks. The tasks of behavioral planning, local planning, and inter-vehicular communication for these lower levels of automation are relatively more straightforward compared to the envisioned higher levels of automation. The higher levels involve complex scenarios such as congested settings, multi-lane roads with vehicles of different speeds, roundabouts, intersections, pedestrians, and more. These complex dynamics of an urban environment require short-lived collaboration with varying numbers of vehicles.
A specialized version of collaborative driving is convoy driving. Convoy driving refers to the practice of multiple vehicles driving consecutively in the same lane with small distances between them, maintaining the same speed [3]. While extensive research has been conducted on platooning heavy-duty trucks on highways, limited research has studied convoy driving in an urban environment [4]. Moreover, most studies on urban vehicle platooning have focused on analyzing platoons consisting of only two or three vehicles, with limited exploration of larger platoon sizes [5].
The motivation of this research is to investigate how convoy driving can be realized to address the challenges of the urban environment and achieve the benefits of autonomous driving such as reduced fuel consumption, travel time, and improved safety and ride comfort. Moreover, we formulate a hypothesis that traveling in a coalition is more beneficial than traveling alone. Researchers have been showing great interest in game-theoretical learning approaches such as coalitional games focusing on collaborative driving by developing customized mathematical models of the problems rather than using ready-made black-box machine-learning approaches.
Given the nature of the proposed research, we have chosen to employ a cooperative game theory—a coalitional game framework, which is the best-fitted solution for this problem. We model convoy driving as a coalition formation game. The proposed framework allows us to investigate the dynamics of convoy driving and analyze the potential advantages of forming coalitions among vehicles.
Some of the overarching contributions of this research are as follows:
  • Modeling convoy driving in an urban environment leveraging the coalition game framework. The novel and all-comprehensive utility functions are designed to realize the coalition formation of autonomous vehicles to drive collaboratively.
  • Utilizing multiple solution concepts, such as the Shapley allocation, the Core, and the Nucleolus, to solve and analyze the game, providing an understanding of the outcomes and implications of the coalition formation process.
  • Modeling and implementing several effective coalition formation strategies, including joining a coalition, selecting optimal coalitions, and making decisions about coalition merging.
  • Carried out numerical experiments to validate the real-world benefits of convoy driving such as reduced fuel consumption, travel time enhanced safety, and ride comfort.
The paper is organized into seven sections. Section 2 provides the background knowledge and presents an overview and comparison of the relevant studies. Section 3 elaborates on the formulation of the convoy driving problem leveraging coalition game theory, proposed utility functions, assumptions, and constraints to model the game. Section 4 analyzes the game, leveraging different solution concepts. Section 5 discusses different coalition implementation strategies. Section 6 discusses the numerical experiments and results in detail. Section 7 elucidates the conclusion of the study.

2. Background and Related Work

This section provides a discussion of the prerequisite background knowledge and related work necessary to comprehend the contents of this paper.

2.1. Coalition

In coalition game theory (CGT), a coalition refers to a group of two or more rational players who join together, coordinate their actions and jointly achieve their common objectives aiming to obtain a better payoff than they could by acting alone. In the context of game theory, a player is a strategic decision-maker who participates in the game. In this paper, the players are the vehicles. Therefore, we use the terms player and vehicle interchangeably. The players within a coalition share out the payoff of collaboration amongst themselves according to some agreed-upon scheme, such as an equal sharing of profits or proportional sharing based on their contribution to the coalition.

2.2. Utility Function

A utility function is a mathematical function designed to assign a numerical value to each outcome of a game, representing the degree of preference or satisfaction that a player derives from that outcome. In CGT, a utility function is used to model the players’ preferences over the possible payoffs resulting from different coalitions. The utility value assigned to each coalition represents the degree of satisfaction that the players derive from that coalition’s payoff (the term payoff and utility are used interchangeably in this paper). Each player has their own utility function, reflecting their individual preferences and goals.

2.3. Solution Concept

It is a way of allocating the payoff to the players in a game, given that they collaborate and form coalitions. It provides a criterion for deciding how the total payoff should be distributed among the players in a way that is considered fair or stable. Several solution concepts such as the Core, the Shapley value, and the Nucleolus are available in the game theory.

2.4. Related Work

Vehicle merging is a common reason for traffic congestion on highways. Due to various factors like traffic flow, driver behavior, and travel goals, it is challenging for vehicles to merge smoothly. Hang et al. [6] proposed a solution to address the multi-lane merging issue for Connected and Autonomous Vehicles (CAVs) by leveraging a cooperative decision-making framework based on coalitional game theory. The proposed framework involved a motion prediction module that forecasted the motion of vehicles and a cost function that considered safety, comfort, and traffic efficiency. The coalitional game with Model Predictive Control was used to coordinate the decision making of CAVs at multi-lane merging zones. The experimental results of two case studies, which tested four coalition types and various driving scenarios, indicated that CAVs could make rational decisions. Furthermore, the cost associated with each CAV in the grand coalition allocated by the Shapley method was lower than that in a single-player coalition, providing evidence of the grand coalition’s superiority. In another study, Hang et al. [7] developed a cooperative lane change decision-making framework for AVs using a coalitional game strategy that accounted for human-like driving traits such as aggressive, moderate, and conservative. The cost function for decision making was designed based on three performance indices—safety, comfort, and efficiency. Finally, simulation tests were conducted to verify the viability and efficacy of the proposed approach. The experimental results demonstrated that the algorithm could make safe and accurate lane change decisions for AVs.
Managing traffic at junctions, particularly in urban areas, can be a challenging task. Hang et al. [8] proposed a solution to address the coordination and decision-making problems of CAVs at unsignaled intersections. They first employed a Gaussian potential field approach to construct a driving risk assessment algorithm that evaluated the safety risk of nearby vehicles and reduced the complexity of the decision-making system. The authors incorporated driving safety and passing effectiveness of the CAVs to develop the decision-making cost function. They also formulated several decision-making constraints, including control, comfort, efficiency, and stability. Based on the cost function and constraints, two types of fuzzy coalitional game techniques were developed—single-player coalition and grand coalition—to address the decision-making problem of CAVs at unsignaled junctions, representing both individual and social advantages. The experimental results demonstrated that the proposed decision-making framework could help CAVs make safe, effective, and rational decisions. In another research, Hoai et al. [9] utilized a coalitional game-based approach among intersection controller agents to enhance traffic flow by reducing the wait time of vehicles at various intersections. To achieve this, they presented a distributed merge and split algorithm for coalition formation, which determines how to cooperate among agents for dynamically controlling traffic lights at intersections. Moreover, the proposed method leverages real-time traffic flow data collected from CAVs to control traffic at intersections. The authors leveraged the Nash equilibrium solution concept to analyze the payoffs of each individual player’s actions. Finally, the suggested technique was evaluated by developing various traffic flow rates to demonstrate its effectiveness in terms of the number of vehicles passing through intersections at a given time and the waiting time of vehicles. Netlogo, an agent-based modeling simulator, was used to simulate traffic light control at intersections. The simulation results showed that the proposed strategy outperformed conventional approaches in controlling traffic at various intersections. Wei et al. [10] devised a hierarchical game-in-game framework aimed at improving traffic safety by reducing collision rates and enhancing intersection throughput. Their strategy involved a multi-layered approach that accounted for both cooperative and non-cooperative games. The first layer employed the Platoon Structure Formation Algorithm (PSFA), which formed a coalitional game to group vehicles into platoons and schedule their passage through the intersection, thus increasing throughput and traffic flow smoothness. The second layer involved a strategic game designed to prevent collisions within the intersection. Ultimately, the proposed framework utilized Nash equilibrium solutions to manage intersection traffic effectively.
In another research, Angel et al. [11] aimed to improve safety [12], traffic flow, fuel consumption, and platoon stability using coalitional game theory to create platoons while simultaneously managing intra and inter-platoon coordination through a cooperative communication strategy. They employed three utility functions—individual, coalitional, and global functions—to evaluate the game. The individual utility considered the local environment, including its state vector and information from infrastructure, while the coalitional utility motivated the formation of a coalition. Finally, the global utility involved players forming coalitions rather than remaining as individuals. The proposed framework was tested by evaluating two parameters: load per path and transit time to destination. Furthermore, the payoff to each player is distributed using Shapley values. Khan et al. [13] conducted research that employed a hardware wireless Convoy Driving Device (CDD) to design a coalition formation strategy that assists drivers in deciding whether to join or leave a platoon, thereby influencing the platoon’s speed and formation. The CDDs could communicate with each other and make decisions regarding platoon formation based on various parameters, such as the vehicles’ current and desired speeds, their limitations, and the road speed limits. The vehicles cooperatively agreed on a consistent platoon speed and then altered their speed to maintain the platoon’s stability, ideally with uniform following distances. Two algorithms were also developed to determine whether to join the coalition. The results showed that using the speed and proximity information of neighboring vehicles can create rational coalitions. Moreover, the social potential field-based influence scheme can not only form coalitions but also regulate the vehicle-to-vehicle distance within the coalition.
Bouchery et al. [14] conducted a study on platoon formation from a system-wide optimization perspective, where they formulated the underlying optimization problem and presented exact and approximate solution approaches that demonstrated promising results for practical scenarios. The authors suggested that truck platooning could be more efficiently developed by multiple operators through cost-sharing, which requires a shift in their business relations. To analyze cost allocation among players, they employed the coalition game and utilized Core and Shapley allocation. Their analysis revealed that a trade-off between existence, stability, and computational efficiency is necessary. Nonetheless, they proposed cost allocation rules for cooperative platooning games that demonstrated high stability in practice. Hadded et al. [15] devised a scenario of a shared transportation system in an urban area where drivers were tasked with collecting abandoned vehicles. These drivers, referred to as platoon leaders, had to drive the collected vehicles as a platoon to a designated location, such as an airport or a train station. To tackle this issue, the authors formulated a Hedonic coalition game to determine the following: (i) the allocation of unused vehicles to the minimum number of platoons; (ii) the best route for each platoon, and (iii) the minimum energy required to collect all vehicles. In the coalitional game, the parked vehicles were treated as players, and the vehicle platoons as coalitions. Three optimization criteria were used to assess the quality of the solution after the game converged to a stable result. The simulation-based outcomes demonstrated the efficacy of the proposed approach in addressing the multi-objective optimization problem.
The comparative summary of the previous research based on ten different parameters is discussed and presented in Table 1. These parameters include the type of coalition, use case/objective, coalition implementation strategies, utility function parameters, utility function, constraints, assumptions, solution concept, and simulator/language. The parameter coalition implementation strategies are further divided into three items: (i) Travel: alone or coalition—which shows how a vehicle decides to travel alone or in a coalition; (ii) Coalition Selection Decision—which shows how a new vehicle entering the road and seeking to join a coalition chooses between two or more already-formed coalitions based on the best utility value; and (iii) Merge/Split—which involves the formation and dissolution of coalitions among the vehicles. Merging occurs when two or more existing coalitions join together to form a larger coalition while splitting occurs when an existing coalition breaks apart into two or more smaller coalitions. The solution concept parameter is also further divided into four parts: the Shapley, Core, Nucleolus, and the other category.
After reviewing the literature, we identify some limitations of previous studies, including the following: (i) studies focus solely on single-use cases such as lane change or lane merging; (ii) only a few studies directly applied the coalition game framework to address the convoy driving problem; (iii) mostly studies model utility function using one or two variables; (iv) based on Table 1, none of the studies implemented the coalition selection decision strategy, and only two studies [9,14] implemented the Merge/Split strategy; (v) analysis shows that only one study [14] implemented two solution concepts (Shapley and Core) to analyze the game; (vi) none of the studies analyzed the game using the Nucleolus, and most of the studies utilized either the Shapley allocation or the Nash equilibrium to find the solution to the game. However, in this research, efforts are made to address these research gaps by designing and modeling a generalized coalitional game framework to realize the convoy driving in an urban environment. The all-inclusive utility functions are designed comprising various objectives that a vehicle desires to achieve in an urban environment. Multiple solution concepts are implemented to analyze the coalitional game. Furthermore, several coalitional strategies are developed to analyze the behavior of vehicles.

3. Convoy Driving—A Coalitional Formation Game

This section formulates convoy driving as a coalition formation game and discusses the utility functions, assumptions, and constraints to model the problem.

3.1. Problem Formulation

We model a system of region R of road segment of K kilometers characterized by a set of autonomous vehicles denoted as N = 1 , 2 , 3 , n , n = | N | . The number n can be 2, 2 2 , or 2 3 , where all autonomous vehicles are equipped with communication technologies and capable of communicating, cooperating, and coordinating with neighboring vehicles N V within a range of distance d. At any time t a subset of autonomous vehicles S ( t ) N are capable of driving collaboratively and forming a coalition C with N V traveling in the same direction and route R aiming to enhance the road efficiency and safety. In this research, we define the term coalition as below:
Definition 1
(Coalition). A coalition C is defined as a set of two or more vehicles N = 1 , 2 , 3 , n traveling on the road with the same speed V and small inter-vehicle spacing δ. Each vehicle is assigned an ID that specifies the coalition C that a vehicle belongs to and its position in the coalition.
It is not necessary for an ego vehicle V i to be in a coalition C at all time steps. Each V N can be in one of the two traveling modes T m : travel alone or travel in coalition. The preference P of traveling mode of V i is based on the highest payoff it achieves. Furthermore, for V i to travel in a coalition it has to accept certain terms of conditions such as speed V, inter-vehicle distance δ , etc. Different types of vehicles can join and form a coalition; however, the size of the coalition is assumed to be limited by the η threshold to maintain the stability and efficiency of the complex urban environment. Furthermore, we model that at time t the V i can be part of only one coalition, C o a l i t i o n ( i ) C o a l i t i o n ( j ) = , i , j N . However, some of the crucial questions here are (i) when it is beneficial for V i to collate, (ii) who should collate with whom, and (iii) how to form the optimal coalitions and distribute the benefits among the members of the coalition.
Given the collaborative nature of the research problem, we leverage the best-fitted solution approach, the coalitional game theory (CGT), a framework to model convoy driving as the coalition formation problem. The CGT is formally defined in Definition 2.
Definition 2
(Coalition Game). A coalitional game G is defined by a pair N , ν , where N = { 1 , 2 , , n } is the finite set of players who seek to form coalition C such that C 2 N . The  C consisting of only one player is referred to as a single-player coalition and C with all players is referred to as a grand coalition. The ν is a real-valued function, called characteristic function such that ν : 2 N R maps each possible coalition C N to its payoff ν ( C ) . (Note: Although by definition characteristics function is relevant to the coalition game. However, in this paper, we use the characteristic function and utility function interchangeably.)
In the context of the convoy driving problem in an urban environment, the coalitional game framework is adapted to model the collaboration among vehicles to form convoys aiming to achieve autonomous driving benefits. In what follows next, we break down the elements of the coalitional game framework and explain their application in this context:
  • Players: Individual vehicles in the urban environment where each vehicle aims to achieve its objectives, such as reducing fuel consumption, minimizing travel time, and maximizing passenger comfort.
  • Coalition: Groups of vehicles forming convoys. A convoy is a formation where vehicles travel closely together, synchronized in their movements.
  • Characteristic Function: The function, denoted as ν , assigns a value to each coalition. In the convoy driving problem, the characteristic function captures the benefits and costs associated with forming a convoy. It takes into account several factors such as fuel efficiency gains, reduced air resistance, improved travel time, and potential trade-offs related to coordination and constraints imposed on individual vehicles.
The characteristic function ν is a utility function where each player or coalition tries to maximize its value. The design and modeling of the proposed utility functions are discussed in detail in Section 3.3. The utility of a coalition C is the cumulative sum of the utilities of all vehicles within that coalition. The coalition formation allows the vehicles to save on fuel, minimum travel time, and increase safety and comfort. Furthermore, it incentivizes vehicles with an additional value that fosters the coalition formations to improve road efficiency. Vehicles may observe multiple coalitions on the road, where the V i joins the optimal coalition by maximizing its utility. Considering the dynamic nature of the road environment, the members of the coalition V C can leave the coalition at any time considering the terms and conditions; however, the vehicles remain in their coalitions until a better one is proposed or until they have a common route. A generic representation of convoy driving is depicted in Figure 2. The blue vehicle in L2 can take a decision to travel alone or in a coalition of size three based on its utility.

3.2. Assumptions

Some of the main assumptions considered in this research are:
A1:
All the simulated vehicles are autonomous vehicles capable of communicating and coordinating with each other.
A2:
At the time t, a vehicle V i can be a part of one coalition C ( i ) C ( j ) = , i , j N , implying that V i cannot travel as part of two coalitions at a time.
A3:
A minimum of two vehicles are required to form and travel in a coalition C .
A4:
The utility of the players depends solely on the members of the coalition C , implying that any external entity does not influence it.
A5:
Any new vehicle desiring to join the coalition C can only be added at the end of the coalition as the last vehicle.
A6:
The proposed algorithms execute on all the vehicles, assisting them in making decisions.

3.3. Proposed Utility Functions for Autonomous Vehicles

In this section, we design and model two utility functions for V i to travel alone and in a coalition.
The utility function of V i traveling alone is a multi-objective function computed using Equation (1).
U i , A = γ 1 FC i , A + γ 2 S i , A + γ 3 RC i , A + γ 4 TT i , A
i = 1 n γ i = 1
In Equation (1), FC i , A , S i , A , RC i , A , TT i , A represent the fuel consumption, safety, ride comfort, and travel time of V i , respectively, when traveling alone, whereas γ 1 , γ 2 , γ 3 , γ 4 represent the weighting coefficients and the sum of these coefficients is set to 1. The formulae to compute FC i , A , S i , A , RC i , A , and TT i , A are discussed in detail in Section 3.3.2.
In what follows next, we discuss the utility function of V i traveling in a coalition.
The proposed multi-objective decision-making utility function handles multiple decision parameters, objectives, and cost functions to compute the utility of a vehicle V i that desires to travel in a coalition C .
We now detail the basic requirements of the proposed utility function:
1.
The function ought to integrate all the criteria to form a single metric to assess the benefits of joining a coalition C .
2.
Weighting co-efficients are assigned to each criterion involved in decision making to indicate its relative significance.
3.
The inclusion of decision-making parameters is scenario dependent.
4.
The characteristic of each modeled parameter is captured realistically.
5.
Normalization is applied since the parameters are measured in different units. The normalization values span between the interval [ 1 , 5 ] .
Now that we have discussed the basic requirements, we present the proposed utility function. Let U i , C represents the utility function of a vehicle i when join the coalition C is given as in Equation(3):
U i , C : = [ ( α × τ c ) × e G ] J c
We decompose the utility function into three components as discussed below:
  • ( α × τ c ) : a Time to collate function that calculates the duration during which a V i intends to join a coalition.
  • e G : a Gain function that computes the gain G that a vehicle V i will achieve by traveling within a coalition C .
  • J c : a Cost function which calculates the cost that a V i incurs by joining C .
In what follows next, we discuss each component in detail:

3.3.1. Time to Collate

The time to collate τ c function is designed to compute the time for which a vehicle V i desires to be part of a coalition C . The  τ c computed in Equation (4) is based on various crucial factors such as the (i) complexity of the environment C ε of V i , (ii) the overlapping route θ r between the V i , and the C , (iii) the estimated time T d A of V i to reach the destination d alone and (iv) the speed difference Δ V d i f between the desired speed of V i and the speed offered by C . ω 1 , ω 2 , ω 3 and ω 4 are the weighting coefficients that capture the sensitivity of each factor and the sum of these weighting coefficients is set to 1. The weighting coefficients are adjustable and experimented with different sets of values in different scenarios.
τ c = ω 1 C ε + ω 2 θ r + ω 3 T d A + ω 4 Δ V d i f
i = 1 n ω i = 1
The optimal value of τ c of V i for a given situation varies depending on the specific factors involved. For instance, in a highly complex environment, such as roundabouts, vehicles may be more interested in joining a C for a shorter τ c to navigate the roundabout safely. Roundabouts are challenging due to the merging and diverging traffic flows, hence, requiring precise coordination between vehicles. Therefore, forming a coalition C of AVs can leverage the benefits of collaborative driving, such as increased awareness, improved safety, and safely navigating the roundabout in a shorter time. In contrast, in a relatively less complex environment such as highways, there may be more opportunities for AVs to form longer-lasting coalitions, as the driving conditions are more stable and predictable. In such cases, AVs can collaborate together to maintain a safe distance, adjust their speed and inter-vehicle spacing to optimize their safety, comfort, fuel efficiency, etc.
We believe that computing the τ c is a critical factor in the forming coalitions of AVs, particularly in complex driving environments. By optimizing the τ c based on specific driving conditions, vehicles can benefit from the increased safety, efficiency, and convenience of collaborative driving.
In what follows next, we discuss each component of τ c in detail:
  • Complexity of the Environment C ε —The complexity of the environment for V i refers to the level of difficulty and diversity of the conditions, events, and obstacles that the vehicle encounters in its operation. This includes factors such as traffic flow, road conditions, weather, and pedestrian and cyclist presence, as well as the presence of other vehicles and infrastructure elements like traffic signals and signs. The environment in which V i travels, such as at intersections, junctions, and other high-traffic areas, plays an imperative role for V i in deciding on whether to form a coalition with other vehicles or not. These areas often require precise collaboration and communication among multiple vehicles to ensure safe and efficient navigation. Therefore, the V i must be able to evaluate the C ε in its immediate vicinity to take an optimal decision of coalition formation.
    The traffic environment comprises various external factors that affect autonomous driving systems, such as road conditions, weather conditions, and the behavior of other traffic participants. However, these factors are subject to continuous or discrete variations within a certain range, resulting in an infinite number of potential traffic scenarios. Therefore, we believe that the complexity of the road traffic environment is an objective characteristic that primarily depends on the physical attributes of the environmental elements. These elements are broadly classified into two categories:
    1.
    Static Element Complexity C ζ —This includes road sections, tunnels, signs, markings, plants, ancillary facilities, and other similar stationary environmental elements.
    2.
    Dynamic Element Complexity C D —This refers to the environmental elements that are constantly in motion, such as vulnerable road users, vehicles, and non-motorized vehicles.
    To compute the complexity of the current driving environment of V i , we adopt the equation from the research conducted by Cheng et al. [16]. The complexity of static and dynamic elements is weighted and summed to obtain the traffic environmental complexity as computed using Equation (6).
    C ε = Ω 1 C ζ + Ω 2 C D
    where C ε represents the complexity of the environment as determined by the C ζ and C D , while Ω 1 and Ω 2 are the respective weighting coefficients assigned to the C ζ and C D element complexities. The values of Ω 1 and Ω 2 have been set as 0.35 and 0.65, respectively.
    Furthermore, based on the values of C ε computed from Equation (6), the traffic environment complexity for V i is quantified into different categories as shown in Equation (7). The explanation of these categories with their characteristics and examples is presented in Appendix A Table A1.
    C ε = 0.8 C ε 1 E x t r e m e l y C o m p l e x 0.6 C ε < 0.8 M o r e C o m p l e x 0.4 C ε < 0.6 A v e r a g e 0 < C ε < 0.4 S i m p l e
  • Estimated Time to Reach Destination—The estimated time to reach the destination of a vehicle V i is the amount of time t that it is expected to take for the vehicle V i to travel from its current location L i ( x , y ) to its destination d, based on factors such as distance, speed, and any stops or delays along the way. The estimated travel time of V i to reach its d alone is computed using Equation (8).
    T d A = D V + ( N s v i × S t v i )
    where T d A is the time V i takes to reach the destination d alone; D is the distance that the vehicle V i needs to cover to reach d; V it is the speed at which the V i travels; N s v i is the number of stops that the V i may make on the way to its destination d; and S t v i is the amount of time the V i spends at each stop.
    Calculating the T d A is an important factor. For instance, if V i calculates its T d A and determines that it will arrive at its d within a short period, it may not be beneficial for the V i to form a coalition. This is because the time saved by forming a coalition may not outweigh the additional cost of coordinating with other vehicles and modifying the vehicle’s route. In such cases, the vehicle may choose to continue on its own, potentially saving resources and time. Therefore, calculating T d A helps the vehicle to make informed decisions regarding the formation of C , taking into account the potential benefits and costs.
  • Speed Difference—The speed difference between the V i and the coalition C is computed using Equation (9). It determines the difference between the speed at which the V i desires to travel on the road and the speed V that is offered by C to V i at which the C of vehicles is currently traveling.
    Δ V d i f = 1 V d V C V d f o r V m i n V C V m a x 0 O t h e r w i s e
    where V d is the desired speed of vehicle V i ; V C is the speed offered by the coalition C to V i ; V m i n is the minimum speed limit for V i ; and the V m a x is the maximum speed limit for V i . We assume that overall, the lower value of Δ V d i f is better for V i . If the V d of V i is higher ( V d = 50 km/h) than the V C ( V C = 45 km/h), in this case the V i may not see the potential of being the part of C since the offered V is less. However, if the V d of V i is lower ( V d = 40 km/h) than the V C ( V C = 50 km/h), then it may be desirable in certain ways for V i to be the part of the coalition as it can reach the destination quickly. Given this, it is also important for V i to consider fuel consumption and maintain safe and optimal driving conditions.
  • Overlapping Route—The overlapping route θ r refers to the route of length L r that the V i and the coalition C can travel along towards the same direction dir by following the same path at the same time. In order to travel safely and efficiently in C , all vehicles need to be synchronized and follow the same path.
    To compute the θ r , the V i leverages a variety of sensors and communication technologies to collect and transmit information such as speed V, location L i ( x , y ) , and the travel path P i with neighboring vehicles N V or the coalition C if it is already formed. The intended travel path P i of V i and the path P c of C are shared with each other, and similarities between the two paths are used to compute the L r of the road where their routes overlap.
    In urban scenarios, the overlapping route θ r may only be a short distance before the vehicles diverge onto different paths. However, in highway scenarios, the overlapping route θ r may cover a significant portion of the journey given the T d A and other factors.

3.3.2. Gain Function

The gain function is a pivotal component that plays a crucial role in determining the benefits that a V i can achieve while traveling in C . In this research, we design and model the gain function by considering four all-comprehensive benefits as discussed in Equation (10).
G = ξ 1 μ FC + ξ 2 μ S + ξ 3 μ RC + ξ 4 μ TT
where ξ is the weighting coefficient that captures the sensitivity of each component and their sum is set to 1:
i = 1 n ξ i = 1
The gain function G is further decomposed into four components:
1.
FC : calculates the fuel consumption of V i traveling alone and in a coalition.
2.
S : calculates the safety of V i traveling alone and in a coalition.
3.
RC : computes the ride comfort of V i traveling alone and in a coalition.
4.
TT : computes the travel time to destination of V i traveling alone and in a coalition.
Furthermore, we introduce the μ user preference indicator function in Equation (12) which allows the user to have flexibility in choosing any subset or all of the gain components in the proposed gain function. This function acts as an indicator of the user’s preferences and determines which components should be included in the calculation of the gain.
μ = 1 i f p a r a m e t e r i s c h o s e n 0 O t h e r w i s e
In what follows next, we discuss each component of the gain function in detail:
  • Fuel Consumption: One of the main motivations for traveling in a coalition is saving a significant amount of fuel. Traveling in a C can be more fuel efficient than traveling alone, especially for long journeys. This is due to the reduction in aerodynamic drag, which is one of the primary causes of fuel consumption at high speeds.
    A vehicle traveling alone creates a disturbance in the air around it, which results in a pressure difference between the front and the rear of the vehicle. This pressure difference causes aerodynamic drag force which opposes the forward motion of the vehicle. The magnitude of this drag force increases with the square of the vehicle’s speed V. Therefore, the faster a vehicle travels, the greater the aerodynamic drag force becomes.
    In contrast, when vehicles travel in a C , the lead vehicle breaks through the air, creating a low-pressure zone behind it. The subsequent vehicles in the C follow in the low-pressure zone, which reduces their aerodynamic drag. As a result, the following vehicles require less fuel to maintain their speed than if they were traveling alone.
    Several fuel consumption models have been studied in the literature to compute the fuel consumption of a vehicle such as the VT-micro model [17], MEF model [18], and ARRB model. In this research, we leverage a physics-based model to compute the fuel consumption of a vehicle traveling alone and in a C . This model simulates the operation of a vehicle under different driving conditions, taking into account the effects of engine efficiency, aerodynamics, and road conditions. It relies on physics-based equations to calculate the forces acting on the vehicle and the resulting fuel consumption. We also model the aerodynamic drag component based on inter-vehicle distance δ and its effect on fuel consumption which is important in computing the fuel consumption of a coalition.
    1. Fuel consumption of a vehicle traveling alone—The steps to compute the fuel consumption of a vehicle V i traveling alone over distance D are discussed below in detail:
    -
    Force due to air resistance The air resistance force is calculated using the drag coefficient C D A , frontal area A , air density ρ A , and speed of the vehicle V. The equation used to compute the air resistance force F A r A is shown in Equation (13).
    F A r A = 1 2 × ρ A × A × C D A × V 2
    The C D A and A vehicle-specific parameters affect the aerodynamic drag on the vehicle. The  ρ A is determined by the temperature, pressure, and humidity of the surrounding air.
    -
    Force due to rolling resistance: The rolling resistance force F R o l l A is calculated using the rolling resistance coefficient C r A , the mass of the vehicle m, and acceleration due to gravity g. The equation used to calculate the rolling resistance force is discussed in Equation (14).
    F R o l l A = C r A × m × g
    -
    Total force: The total force acting on the vehicle V i is the sum of the air resistance force F A r A and the rolling resistance force F R o l l A . The equation used to calculate the total force is discussed in Equation (15).
    F T o t a l A = F A r A + F R o l l A
    -
    Power output of the engine: The power output of the engine P o A of a vehicle traveling alone is calculated by multiplying the total force F T o t a l A by the speed V of the vehicle V i . The equation used to calculate the power output is shown in Equation (16).
    P o A = F T o t a l A × V 3.6
    -
    Fuel consumption rate: The fuel consumption rate F C r A is calculated by dividing the P o A by the product of the V, efficiency E, and lower heating value L H V of the fuel. The equation used to calculate the F C r A is given in Equation (17).
    F C r A = P o A ( V × E × L H V )
    The efficiency E of the engine is the ratio of the useful output P o A to the energy input (fuel energy). The  L H V of the fuel is the amount of energy released when the fuel is completely burned.
    -
    Total fuel consumption: Finally, the total fuel consumption F C t o t a l A of vehicle V i traveling alone for a distance of D kilometers is calculated by multiplying the F C r A by the time t traveled. The equation used to calculate the total fuel consumption is given in Equation (18):
    F C t o t a l A = F C r A × t
    2. Fuel consumption of a vehicle traveling in a coalition—The steps to compute the fuel consumption of V i traveling in a coalition C of N vehicles over distance D are discussed below in detail.
    -
    Force due to air resistance: The air resistance force of a vehicle traveling in a C is calculated using Equation (19) where V [ i ] 2 is the speed V of the i - t h vehicle V i in the C .
    F A r C = 1 2 × ρ C × A × C D C × V [ i ] 2
    -
    Force due to rolling resistance: The rolling resistance force F R o l l C is calculated using Equation (20) where m is the mass of the i - t h vehicle in the C .
    F R o l l C = C r C × m × g
    -
    Total force: The total force acting on the i - t h vehicle V i is calculated using Equation (21).
    F T o t a l , i C = F A r C + F R o l l C
    -
    Power output of the engine: The power output of the engine P o C for each vehicle V i in the coalition C is calculated. If the V i is the leading vehicle, then the power output is calculated as shown in Equation (22).
    P o , L C = F T o t a l , i C × V [ i ] 3.6
    If the vehicle V i is not the leading vehicle, then the power output P o , F C of the following vehicle is calculated as Equation (23).
    P o , F C = F T o t a l , i C × ( V i V i 1 × δ V i V i 1 ) 3.6
    where the parameters are as follows:
    P o , F C : is the power output of the i-th following vehicle in the C .
    F T o t a l , i C : is the total force acting on the i-th following vehicle, which is the sum of the forces due to air resistance and rolling resistance.
    V i : is the speed of the i-th vehicle.
    V i 1 is the speed of the leading vehicle.
    δ is the inter-vehicle distance between the i-th and ( i 1 ) -th vehicle.
    -
    Fuel consumption rate: The fuel consumption rate F C r C calculates the fuel consumption rate of each vehicle traveling in the C by dividing the P o , F C by the product of the V [ i ] , efficiency E, and L H V of the fuel. The equation used to calculate the F C r C is given in Equation (24).
    F C r C = P o , F C V [ i ] × E × L H V
    -
    Fuel consumption of each vehicle in the coalition: Equation (25) calculates the fuel consumed by each vehicle in the C .
    F C C [ i ] = F C r C [ i ] × t [ i ]
    -
    Total fuel consumption of coalition: Finally, the total fuel consumption F C t o t a l C of all the vehicles in the C for a distance of D kilometers is calculated by multiplying the F C r C by the time t traveled. The equation used to calculate the total fuel consumption is given in Equation (26):
    F C t o t a l C = i = 1 N ( F C r C × t )
  • Safety—In this research, we model the safety of the vehicle as the time-to-collision metric. Time to collision (TTC) is a widely used safety indicator in autonomous driving to evaluate the risk of a rear-end crash in real time and assess the safety of AVs by allowing the system to predict and avoid collisions.
    The TTC of a V i at time t is a measure of the time it will take for a V i to collide with another object, such as another vehicle, pedestrian, or obstacle if the current speeds and trajectories of the vehicles are maintained. In particular, the TTC indicates how much time a vehicle has to react and take evasive action to avoid a collision.
    In what follows next, we discuss the computation of TTC of a vehicle traveling alone and traveling in a C in detail.
    1. Safety of a vehicle traveling alone—The TTC of a vehicle at time ( t ) traveling alone is computed as shown in Equation (27).
    T T C n A ( t ) = X n 1 ( t ) X n ( t ) L v V n ( t ) V n 1 ( t ) V n ( t ) > V n 1
    where X n 1 ( t ) X n are the positions of vehicle n and vehicle n 1 at time t, respectively; the V n ( t ) V n 1 ( t ) are the speeds of vehicle n and vehicle n 1 at time t, respectively; and the L v is the length of the vehicle. The condition V n ( t ) > V n 1 states that V n ( t ) must be greater than V n 1 ( t ) , which ensures that the TTC is only calculated when the preceding vehicle is moving slower than vehicle n. If the preceding vehicle is moving faster than vehicle n, the TTC would be negative, which does not make sense in the context of collision avoidance.
    2. Safety of a vehicle traveling in a coalition—The TTC of a vehicle traveling in a C is calculated similarly as calculated for the vehicle traveling alone. However, there are additional factors to consider, such as the inter-vehicle spacing δ between the vehicles in the coalition and the speeds at which the vehicles are traveling. The TTC of a vehicle n at time t traveling in a coalition C is calculated as shown in Equation (28).
    T T C n C ( t ) = X L ( t ) X n t h ( t ) L v V L ( t ) V n t h ( t )
    where the T T C n C ( t ) calculates the TTC of n t h vehicle in the C at time t, X L ( t ) X n t h ( t ) is the headway which is the distance between the front of the n t h vehicle in the C and the rear of the lead vehicle X L ( t ) at time t, V L ( t ) V n t h ( t ) is the speeds of lead vehicle V L ( t ) and n t h vehicle at time t, and L v is the length of the n t h vehicle.
    Traveling in a C can improve the TTC of a vehicle by reducing the δ and maintaining a constant speed, which decreases the chance of abrupt braking or acceleration. Contrarily, a vehicle traveling alone has to maintain a safe distance from the preceding vehicle to avoid collisions. However, this safe distance increases the gap between vehicles, which increases the TTC and reduces the traffic flow.
    Remark 1.
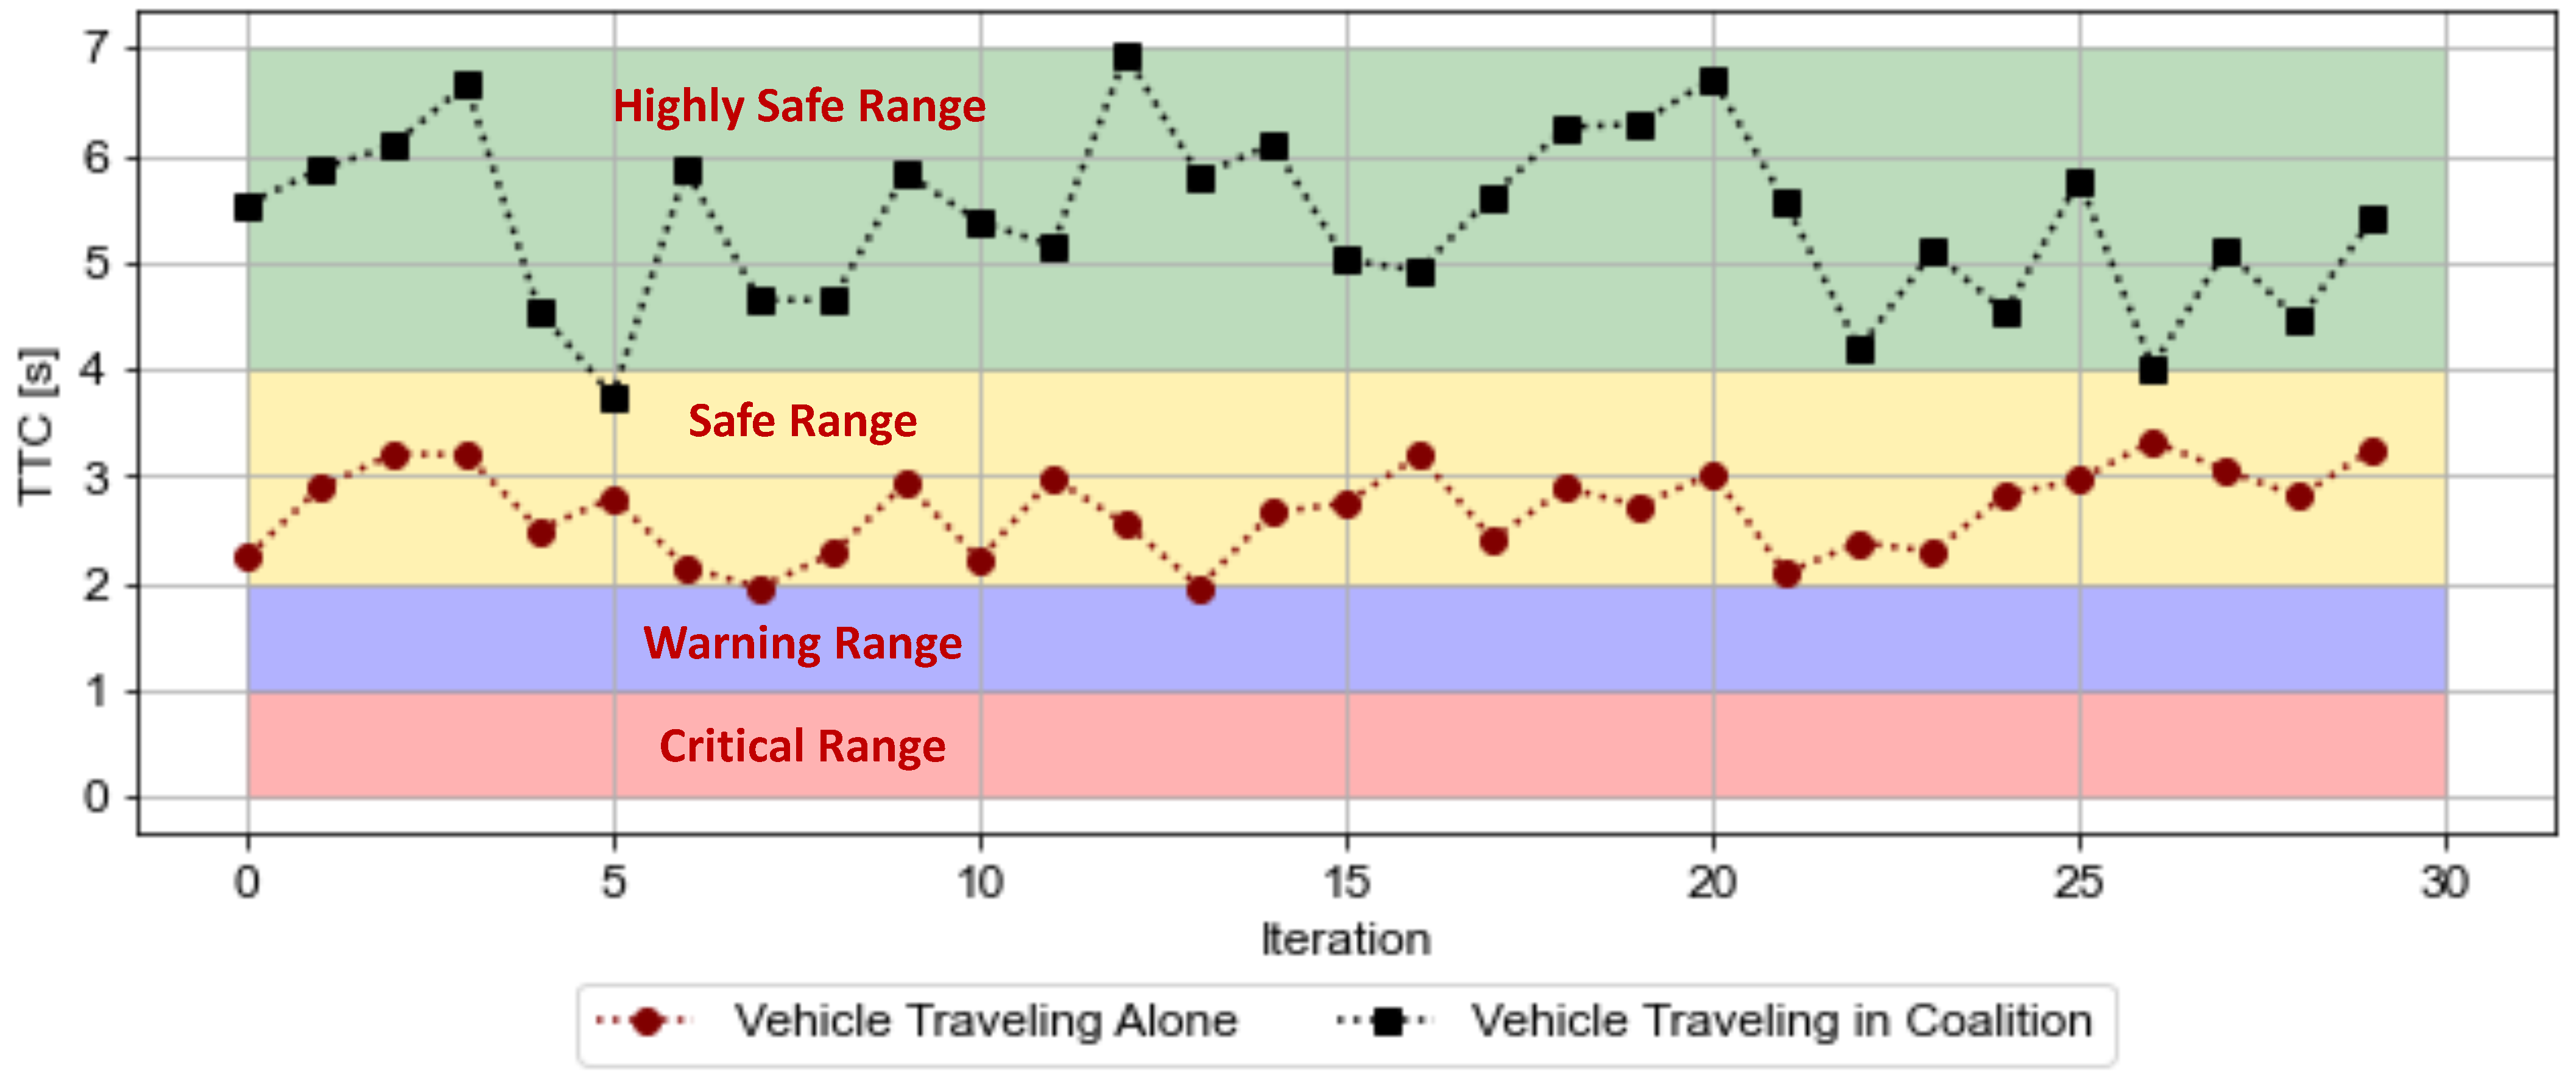
    A low TTC value indicates a higher risk of traffic crashes. To evaluate the safety of a vehicle, it is necessary to set a TTC threshold. Studies have recommended different TTC thresholds ranging from 1.5 to 5 s. However, Zhu et al. [19], experimented that a TTC threshold of 4 s is considered suitable for achieving good overall performance.
  • Ride Comfort—It is an important factor to consider which refers to the overall smoothness and quality of the ride experience for passengers. One of the key factors that influence ride comfort is the jerk of the vehicle.
    Jerk refers to the sharpness or abruptness of the vehicle’s movements. When a vehicle undergoes sudden changes in acceleration, such as when it accelerates rapidly or comes to a sudden stop, the jerk is high. Research studies have shown that the level of discomfort experienced by passengers is directly related to the magnitude of the jerk. The higher the acceleration and jerk, the greater the discomfort. This is because sudden changes in velocity can cause the body to experience forces that are not expected, leading to discomfort.
    In what follows next, we discuss the ride comfort of a vehicle traveling alone and traveling in a coalition in detail.
    1. Ride comfort of a vehicle traveling alone—The jerk of a vehicle V i is the rate of change in its acceleration with respect to time. It is the third derivative of the vehicle’s position with respect to time. Mathematically, the jerk is defined as:
    j A ( t ) = d 3 a ( t ) d t 3
    where j A ( t ) is the jerk; a ( t ) is the acceleration; d a d t is the rate of change in acceleration over t and d 3 a ( t ) d t 3 is the third derivative of acceleration a with respect to t. To calculate the j A ( t ) , we use the numerical differentiation methods, such as the gradient function in NumPy [20], to approximate the derivative of the a with respect to time t.
    2. Ride comfort of a vehicle traveling in a coalition—Generally, traveling in a coalition reduces the jerk and improves the smoothness of driving, as the vehicles are coordinated to move in a more synchronized manner. By following the lead vehicle closely and adjusting its speed and distance, the following vehicles can avoid sudden changes in acceleration or braking, which would result in higher jerks. However, there may still be some jerk present in the coalition, especially if there are abrupt changes in the lead vehicle’s speed. The level of jerk depends on the driving patterns and behavior of the lead vehicle.
    The steps to compute the jerk j C ( t ) of a vehicle traveling in a C are discussed below:
    -
    Compute the acceleration of the vehicle a ( t ) lead vehicle a l e a d ( t ) , respectively.
    -
    Calculate the relative acceleration a r e l ( t ) of the vehicle V i with respect to the lead vehicle using Equation (30).
    a r e l ( t ) = a ( t ) a l e a d ( t )
    -
    Calculate the jerk of the relative acceleration using Equation (31).
    j r e l ( t ) = d 3 a r e l d t 3
    where d a r e l d t is the rate of change in the relative acceleration over time ( t ) .
    -
    Calculate the total jerk of the vehicle V i traveling in a C by adding the jerk of the relative acceleration to the jerk of the lead vehicle’s acceleration as presented in Equation (32).
    j e r k T o t a l , i C ( t ) = j e r k r e l ( t ) + d 3 a l e a d d t 3
    Remark 2.
    It is noteworthy that we assume that the acceleration data is continuous and differentiable. A high value of jerk indicates that acceleration a is changing rapidly, which can be uncomfortable for passengers. Therefore, the higher the acceleration and the jerk the greater the discomfort. Furthermore, the positive value of jerk means acceleration increases over time and the negative value of jerk is when the acceleration decreases over time.
  • Travel Time—Traveling in a coalition C can be highly beneficial rather than traveling alone, as it can significantly reduce the time it takes to reach a destination d. This is because the inter-vehicle spacing δ between the vehicles in the C can be smaller than the spacing required for individual vehicles traveling alone on the same route. By reducing the δ between the vehicles, the C increases the flow of traffic, which ultimately leads to a shorter travel time. As a result, the vehicles reach d more quickly than they would have if traveling alone.
    In what follows next, we discuss the computation of the traveling time of a vehicle traveling alone and traveling in a C .
    1. Travel time of a vehicle traveling alone—The estimated travel time of a vehicle to reach d traveling alone is calculated using Equation (8).
    2. Travel time of a vehicle traveling in a Coalition—The estimated travel time of a coalition C of N vehicles to reach the destination d is calculated by considering different parameters. The formula to compute the travel time of a coalition C is presented in Equation (33).
    T d C = D + ( N 1 ) × δ V a + ( N s C × S t C )
    where the N is the number of vehicles in the coalition C ; δ is the inter-vehicle spacing between the vehicles in the C ; V a is the average speed of the vehicles in the C ; N s C is the number of stops that the C may make on the way to its destination d; and the S t C is the amount of time the C spends at each stop.
    The first part of Equation (33) computes the time taken to cover the distance D by the C of N vehicles at the average speed V a . The second part of the equation calculates the additional time taken due to the stops made by the C during the journey. The  δ is added between the vehicles which strongly affects the time taken for the C to reach the d. The smaller the δ is, the lesser the time will be taken to reach C to d. However, it is noteworthy that we assume the vehicles in the C maintain a constant speed and δ .

3.3.3. Cost Function

The cost of joining any coalition C is represented by a mathematical function that assigns a numerical value to it, incorporating various factors as shown in Equation (34).
J c = θ 1 × ψ c o s t χ , N l c + θ 2 × φ c o s t
The proposed cost function is decomposed into two components:
1.
θ 1 × ψ c o s t χ , N l c : the lane switching cost function which captures the cost that V i incurs while switching the lane(s) to join the C .
2.
θ 2 × φ c o s t : the coordination cost function that V i incurs to coordinate with C .
where θ is the weighting coefficient that captures the sensitivity of each component and their sum is set to 1.
i = 1 n θ i = 1
The cost function plays a crucial role in calculating the utility of coalition games, as it reflects the trade-off between the benefits of joining a coalition and the costs that must be incurred in order to do so. Players typically seek to maximize their overall utility by weighing the benefits of joining a coalition against the costs they must incur, and strategically choose to join or leave different coalitions based on their assessment of these costs and benefits.
In what follows next, we discuss each cost component in detail:
  • Lane Switching Cost—Lane switching cost ψ c o s t of V i refers to the cost incurred by switching to a different lane L in order to join the coalition C . This cost is calculated based on various factors, such as the distance, the number of lane switches, and the risk of collisions.
    We model a piecewise function to compute the cost of V i to join a C as presented in Equation (36). The function ψ c o s t χ , N l c takes in two parameters, χ and N l c , and returns a cost value based on the distance traveled and the number of lane switches.
    ψ c o s t χ , N l c = 0 i f N l s = 0 a × χ + b i f N l s = 1 K × χ 2 i f N l s > 1
    where the χ represents the distance V i needs to travel to switch lanes; N l s represents the number of lane switches required for the V i ; a, b are coefficients for the linear component of the cost function, representing the cost per unit distance of changing lanes; and the K is the coefficient for the quadratic component of the cost function, representing the cost per unit distance squared of changing lanes.
    We believe that incorporating the lane-switching cost into the cost function would enable the vehicles to make more informed decisions about whether to join the C or not considering the risk of switching lane(s).
  • Coordination Cost—The coordination cost is considered as the cost incurred by a vehicle V i that desires to join a coalition of vehicles due to the need to coordinate its speed with that of the coalition C . In particular, if the C is traveling at a higher speed than the V i that desires to join, then the V i may need to increase its speed to match the speed of the C , in order to join the coalition. This may result in additional fuel consumption and risk for the V i , which imposes a cost on the V i . Therefore, it is reasonable to consider the coordinating cost in terms of the speed difference between the V i and the C .
    φ c o s t = λ × V c u r i V c u r C V c u r i
    where the V c u r i is the current speed of V i that desires to be a part of coalition and V c u r C is the current speed of the C .
    The value of φ c o s t is 0 if the V i is already the member of C . This cost component takes into account practical considerations, such as the requirement to accelerate or decelerate to join a C , and its value depends on various factors, including the speed difference between the current speed C and the current speed of V i . Experimentally, we find the constant values between 0.05 and 0.1 to be adequate for λ .

3.4. Constraints

Some of the constraints in terms of speed, ride comfort safety, and coalition size are considered to travel in the coalition:
1.
The constraint for coalition speed is V C V C m a x . The value of V C m a x is use-case specific and may vary in urban and highway scenarios.
2.
The constraint for ride comfort is defined as j e r k T o t a l C j e r k T o t a l C ( m a x ) .
3.
The constraint for safety is given as T T C n C T T C n C ( m i n ) .
4.
The constraint for the coalition size is defined as η . The value of η varies in different scenarios and experiments.

4. Analysis of the Proposed Convoy Driving Game

The outcome of a cooperative coalition game involves allocating the payoffs fairly and finding stable coalitions. Allocating payoffs fairly refers to finding the distribution of benefits perceived as equitable among the players. Two fairness solution concepts, such as the Shapley value and the Nucleolus, are applied to fairly allocate the payoffs based on players’ contributions. However, finding stable coalitions means identifying a coalition of players who have incentives to stay together rather than defecting and forming alternative coalitions. In this research, we analyze the stability core solution concept, which captures stable allocations where no subgroup of players can benefit by forming their own coalition. In what follows next, we analyze the convoy driving game of a coalition of five players using different solution concepts. The parameter values used to model the game are discussed in Table 2.

4.1. The Shapley Allocation

Equally distributing the payoff among players is not enough as it overlooks varying contributions to the coalition. The Shapley allocation is a concept that fairly allocates the total value generated by a coalition C of players N among the individual players. The estimation of the potential payoff of all players N is crucial in determining their decision to join the game. Calculating the Shapley values involves considering all possible permutations of the vehicles within the coalition and evaluating the marginal contributions of each vehicle as it joins or leaves the coalition. This process helps identify how much value each vehicle adds to the coalition in terms of fuel savings, reduced travel time, enhanced safety, and other benefits. The Shapley value represents the anticipated share of profits for each player within the coalition and it is computed using Equation (38).
Definition 3
(Shapley value). The Shapley value of each player i N in a coalitional game G = N , ν is represented as ϕ ( i ) is defined as below:
ϕ ( i ) = C N { i } | C | ! ( N | C | 1 ) ! N ! ( v ( C { i } ) v ( C ) )
where, ϕ ( i ) denotes the Shapley value for player i, v ( C ) represents the payoff of coalition C , C is a coalition that does not include player i, C i represents the coalition formed by adding player i to coalition C , ∑ denotes the sum over all possible coalitions C that do not contain player i, C denotes the number of players in coalition C , and N represents the total number of vehicles/players in the game.
To analyze the proposed game and fairly distribute the payoffs among the players, we model the Shapley allocation with the following axioms satisfying the fair payoff allocation:
1.
Axiom 1 (Symmetric): For two players i and j who make the same contributions to every coalition C in a game G, their Shapley values ϕ should be equal.
v ( C i ) = v ( C j ) C N i , j ϕ ( i ) = ϕ ( j ) .
2.
Axiom 2 (Dummy Player): It states that if a player does not contribute to any C , their ϕ ( i ) should be zero.
C N { i } : v ( C { i } ) = v ( C ) ϕ i ( N , v ) = 0 .
3.
Axiom 3 (Additivity): It states that the ϕ of a player in a game G composed of multiple sub-games is equal to the sum of their Shapley values in each individual sub-game.
The experimental results in Table 3 depict the utility ( U ) of all the vehicles if they travel alone (computed using Equation (1)) and the Shapley value ( ϕ ) if they travel in a coalition C . The results demonstrate that for all the players, it is beneficial to travel in the coalition as it increases their utilities. The higher Shapley values of the vehicles indicate a greater contribution and influence on the coalition’s outcomes. The results show that the Shapley values represent the individual contribution of each vehicle to the coalition’s value, where the contribution is measured in terms of fuel efficiency improvements, reduction in travel time, and improved safety of a coalition. Moreover, the results state that the vehicles are motivated to actively engage in forming and maintaining coalitions, as they expect a fair share of the benefits generated.

4.2. The Nucleolus

The Nucleolus provides a unique distribution of the worth of coalitions based on a fairness criterion. Given the proposed coalitional game G defined by its characteristic function v, the nucleolus N u seeks an imputation x that satisfies several desirable properties. We model the N u aiming to find an imputation x R N that satisfies the following properties:
1.
Efficiency: The imputation x must allocate the entire worth of the grand coalition x ( N ) = v ( N ) .
2.
Individual Rationality: Each player i should receive at least their individual worth x ( i ) v ( i ) for all i N .
3.
Coalition Rationality: For any coalition C N , the worth allocated to C should not exceed its worth x ( C ) v ( C ) ) .
4.
Balanced Deviation: The N u minimizes the maximum dissatisfaction any player i can have with their allocation. Formally, for any player i N , the deviation dissatisfaction is defined as δ i ( x ) = m a x v ( C ) x ( C ) | i C N . The  N u minimizes the maximum deviation dissatisfaction such that m a x δ i ( x ) is minimized.
To compute the N u , the algorithm iteratively adjusted the imputation until it converged. It iterates through all possible imputations, filtering out infeasible ones that violate individual rationality and coalition rationality, and then selecting the imputation that minimizes the maximum deviation dissatisfaction. The nucleolus allocation of each player of the proposed collaborative driving game is presented in Table 4, where the higher N u of the players indicates a relatively larger share of the worth. Moreover, the comparison of the N u values with the utility U of the vehicles traveling alone in Table 4 also shows that for all players, it is beneficial to travel collaboratively as they achieve more payoff than traveling alone.

4.3. The Core

The convoy driving game represented by a characteristic function ν assigns a payoff to every possible coalition of players. A stable outcome is an allocation of payoffs where no coalition of players is incentivized to deviate and form a sub-coalition to obtain a better outcome. The Core C r of a game G = N , ν is a set of all stable outcomes, mathematically defined as:
C r = x | i C x i ν ( C ) C N
the C r consists of all the payoff vectors x that satisfy the feasibility and individual rationality conditions such that for every coalition C , the sum of the payoffs assigned to the players in C is greater than or equal to the worth generated by that coalition. For convoy driving, a stable outcome means that vehicles will stay within the same coalition C , and communicate and cooperate with other coalition members to optimize the coalition-level objectives such as reduced fuel consumption, travel time, and improved safety, etc.
We show that the C r of the proposed convoy driving game is non-empty and they form two stable coalition structures: a coalition of three players and a grand coalition N , as presented in Table 5. The presence of a grand coalition implies that the allocation of payoff satisfies both individual rationality and coalition stability. The core’s feasibility and individual rationality conditions ensure that each vehicle within a coalition receives a payoff that is at least as good as what it would obtain by forming smaller coalitions. This encourages cooperation and discourages defection, as no subgroup of players has the incentive to deviate and form a subgroup to obtain a better outcome. By adhering to the stable outcomes in the core, vehicles within a coalition ensure mutual benefits and promote the overall efficiency of the coalition. However, it is also important to note that sometimes the core of the cooperative coalition game can be empty [14].

5. Coalition Implementation Strategies

This section discusses the implementation of different coalition formation and decision strategies. In what follows next, we analyze each strategy with a coalition of size 5. The parameter values are discussed in Table 2.

5.1. Traveling Mode Selection Decision-Making

The proposed scenario begins with the ego vehicle V i commencing its travel, presenting a choice of whether to join a surrounding vehicle to form a coalition C (or join an existing C ) or to continue traveling alone. In what follows, we delve into the specific details of the process we model to select an optimal traveling mode T m for V i .
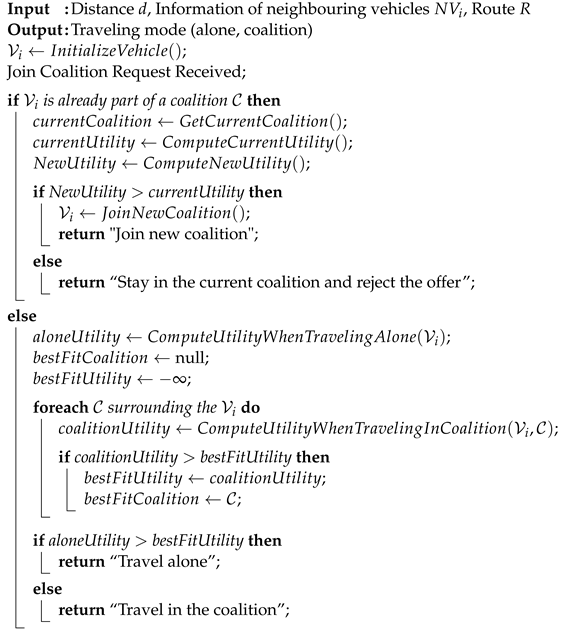
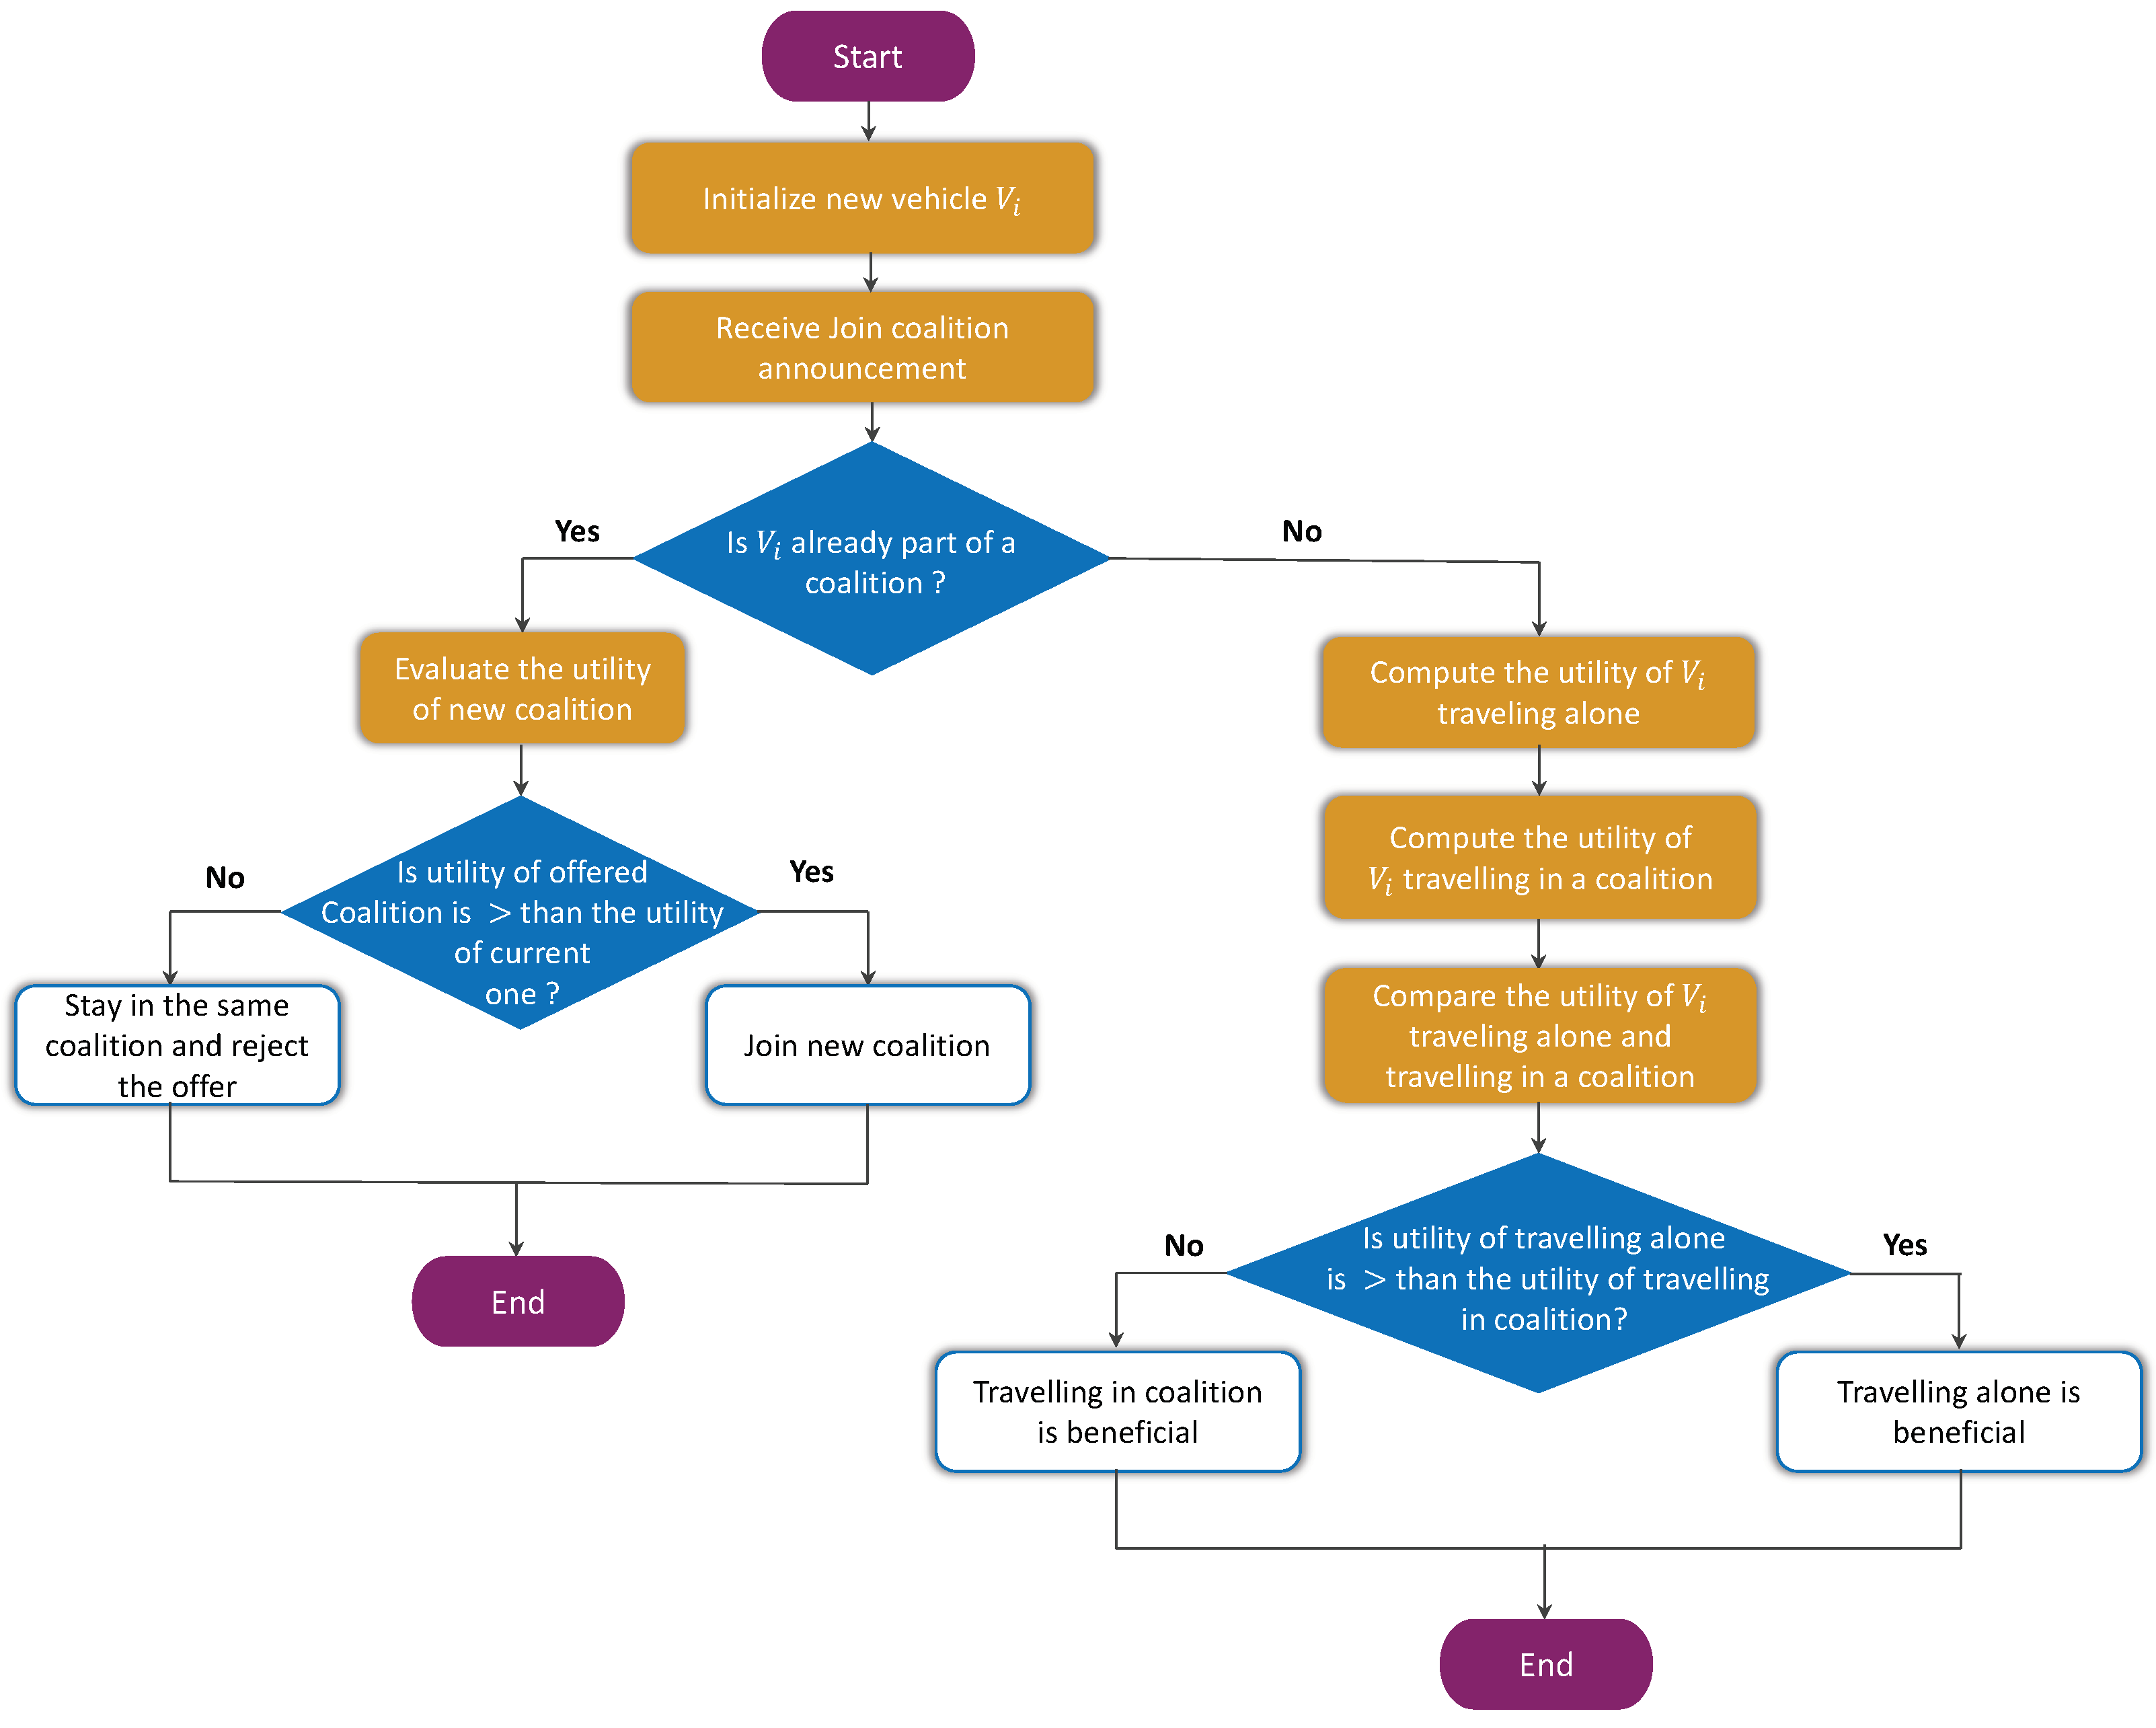
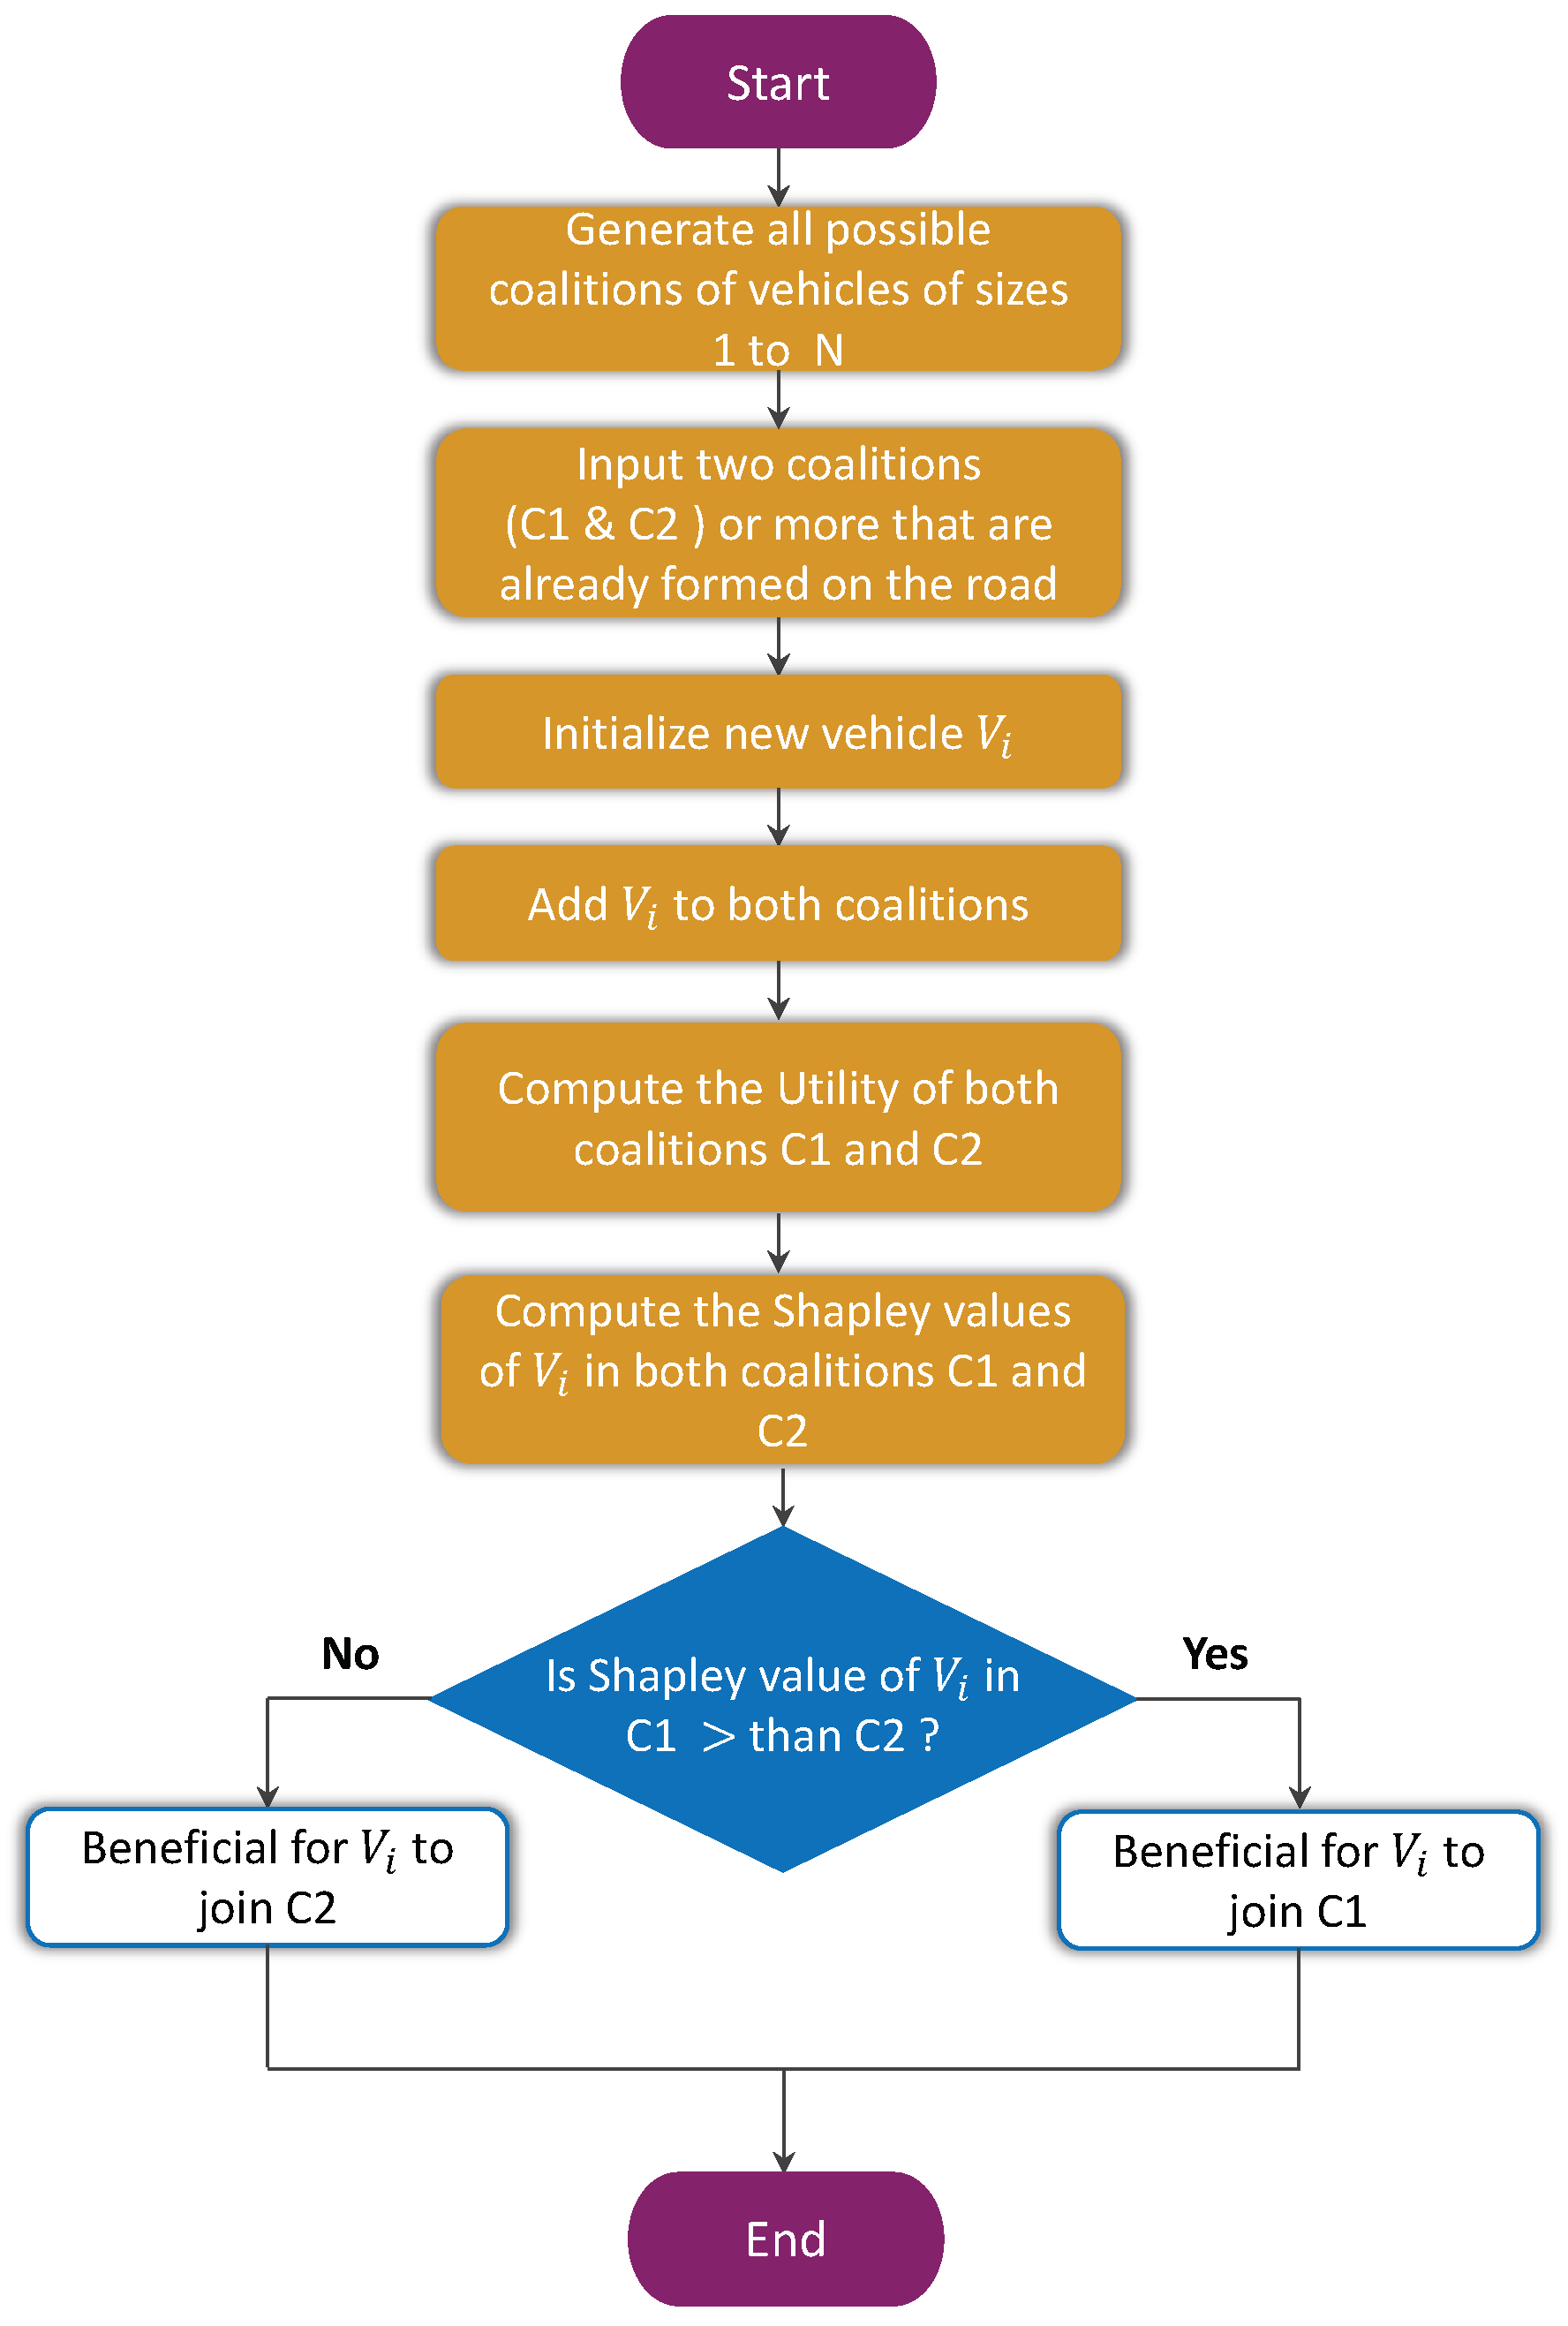
We assume that the proposed algorithm is executing on all the vehicles, assisting them to make an optimal decision. The join coalition process for the ego V i begins with the initialization of the V i . First, the V i receives data from neighboring vehicles N V i or C within a certain distance d, including information on speed V profiles and planned routes R. The surrounding information is crucial for evaluating potential coalition formations. As the V i starts operating in a dynamic environment, it may receive requests from N V i or C to join their formations. Upon receiving a join coalition request, the V i checks if it is already a part of any C . If so, it proceeds to compute its utility U i , C (using Equation (3)) in the current C and the utility U i , C of V i in the newly offered coalition C . This computation involves calculating the utility in terms of the Shapley value ϕ ( i ) of V i (using Equation (38)) in C compared to the current one. The utility calculation is performed by comparing the ϕ ( i ) of V i in C with the ϕ ( i ) of V i in the existing C . If the U i , C of V i in C is found to be greater, the V i disjoins the current C and decides to join C . However, if the U i , C of V i in C is not higher, the V i remains in the current C and rejects the offer.
In the other case, if the V i is not part of any C , then the controller of the V i computes the utility U of V i traveling alone (using Equation (1)). This evaluation considers various factors such as travel time, fuel consumption, safety, and comfort, as discussed in Section 3.3.2, establishing a baseline utility for individual travel. Afterward, the controller calculates the time to collate τ c of V i and the utility U of V i traveling in coalition C for each C surrounding the V i . This calculation is performed to identify the C that provides the best fit in terms of utility to V i . Finally, a comparison is made between the utility of traveling alone and the utility of the best fit C . If the U of traveling alone is greater, it is more beneficial for the V i to travel alone. However, if the U of the “best fit” C is higher, then it is preferable for V i to travel within a C . By following this coalition formation process, the V i can make informed decisions about whether to travel alone or in a coalition based on the utility calculations. The proposed algorithm is presented in Algorithm 1 and the flowchart in Figure A1 in Appendix A, respectively.

5.2. Optimal Coalition Selection Decision Making

When V i enters the road, it encounters a scenario where multiple coalitions of vehicles have already formed. The  V i faces the decision of selecting the most suitable coalition to join. In order to determine the optimal coalition, a procedure is modeled as follows:
Algorithm 1 Traveling mode selection decision making
Smartcities 06 00111 i001
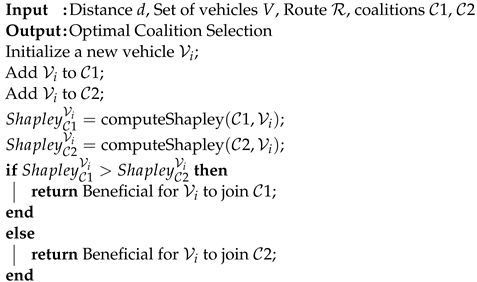
The process begins with the initialization of the new vehicle V i . As V i enters the road, it receives data from neighboring coalitions within a certain d, specifically including information on the speed V and the planned R . This information provides valuable insights into the behavior and intentions of the vehicles, assisting the V i in making an informed decision about its coalition choice. To evaluate the different possibilities, all possible combinations of coalitions of vehicles are generated C o a l i t i o n s = { C C N , C } considering various sizes from 1 to N , where N represents the set of five vehicles in this case, and C represents a coalition of vehicles. The condition C N ensures that a C is a subset of the set of vehicles, and C ensures that the coalition is not empty. This step ensures that all potential coalitions, including both smaller ones and larger, are taken into account during the decision-making process. Each coalition represents a distinct group of vehicles that are already present on the road. Subsequently, we randomly choose two coalitions, referred to as C 1 with players (players 0 and 2) and C 2 with players (players 3 and 4), as candidates for evaluation and validation, and these two coalitions serve as options for V i to consider joining.
The V i , which is player 1, is then added to C 1 , indicating its inclusion in the first coalition under examination. Additionally, V i is also added to C 2 , allowing for a fair comparison between the two coalitions. This ensures that V i has the opportunity to assess its potential benefits and costs associated with both C 1 and C 2 . To evaluate the utility U of each coalition, a utility function is computed for both coalitions, taking into account factors such as V, D , and other relevant information. Following this, the Shapley value ϕ of V i in C 1 and C 2 is computed and compared to determine which coalition offers greater utility. If the ϕ of V i in C 1 is found to be greater than that in C 2 , it suggests that C 1 provides more substantial benefits for V i . Consequently, it is beneficial for V i to join C 1 ; otherwise, it is more advantageous for V i to join C 2 . In case of our experiments, the results show that V i obtains a higher payoff of 0.25 from C 1 . The proposed algorithm is presented in Algorithm 2 and the flowchart in Figure A2 in Appendix A, respectively.
Algorithm 2 Optimal Coalition Selection Decision Making
Smartcities 06 00111 i002

5.3. Coalition Merging Decision Making

There is a possibility that many small coalitions may reduce the efficiency of the road. Therefore, to overcome this issue, we design and model the merging coalition maneuver. When two or multiple coalitions encounter each other on the road, a merging maneuver is executed by merging the following coalition into the preceding one if it leads to greater profit. For the merging process to take place, all the vehicles of the following coalition need to change the speed to approach the preceding coalition. Furthermore, we assume that the coalitions are present in the same lane. In what follows next, we discuss the modeling of this scenario.
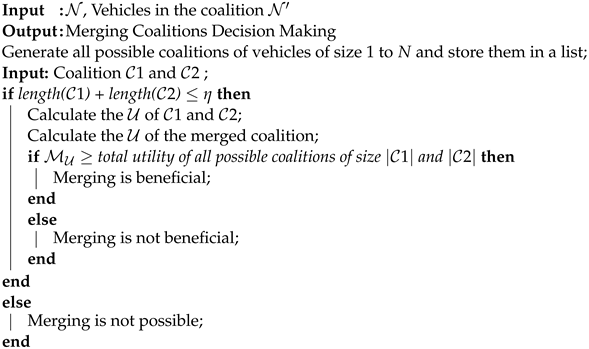
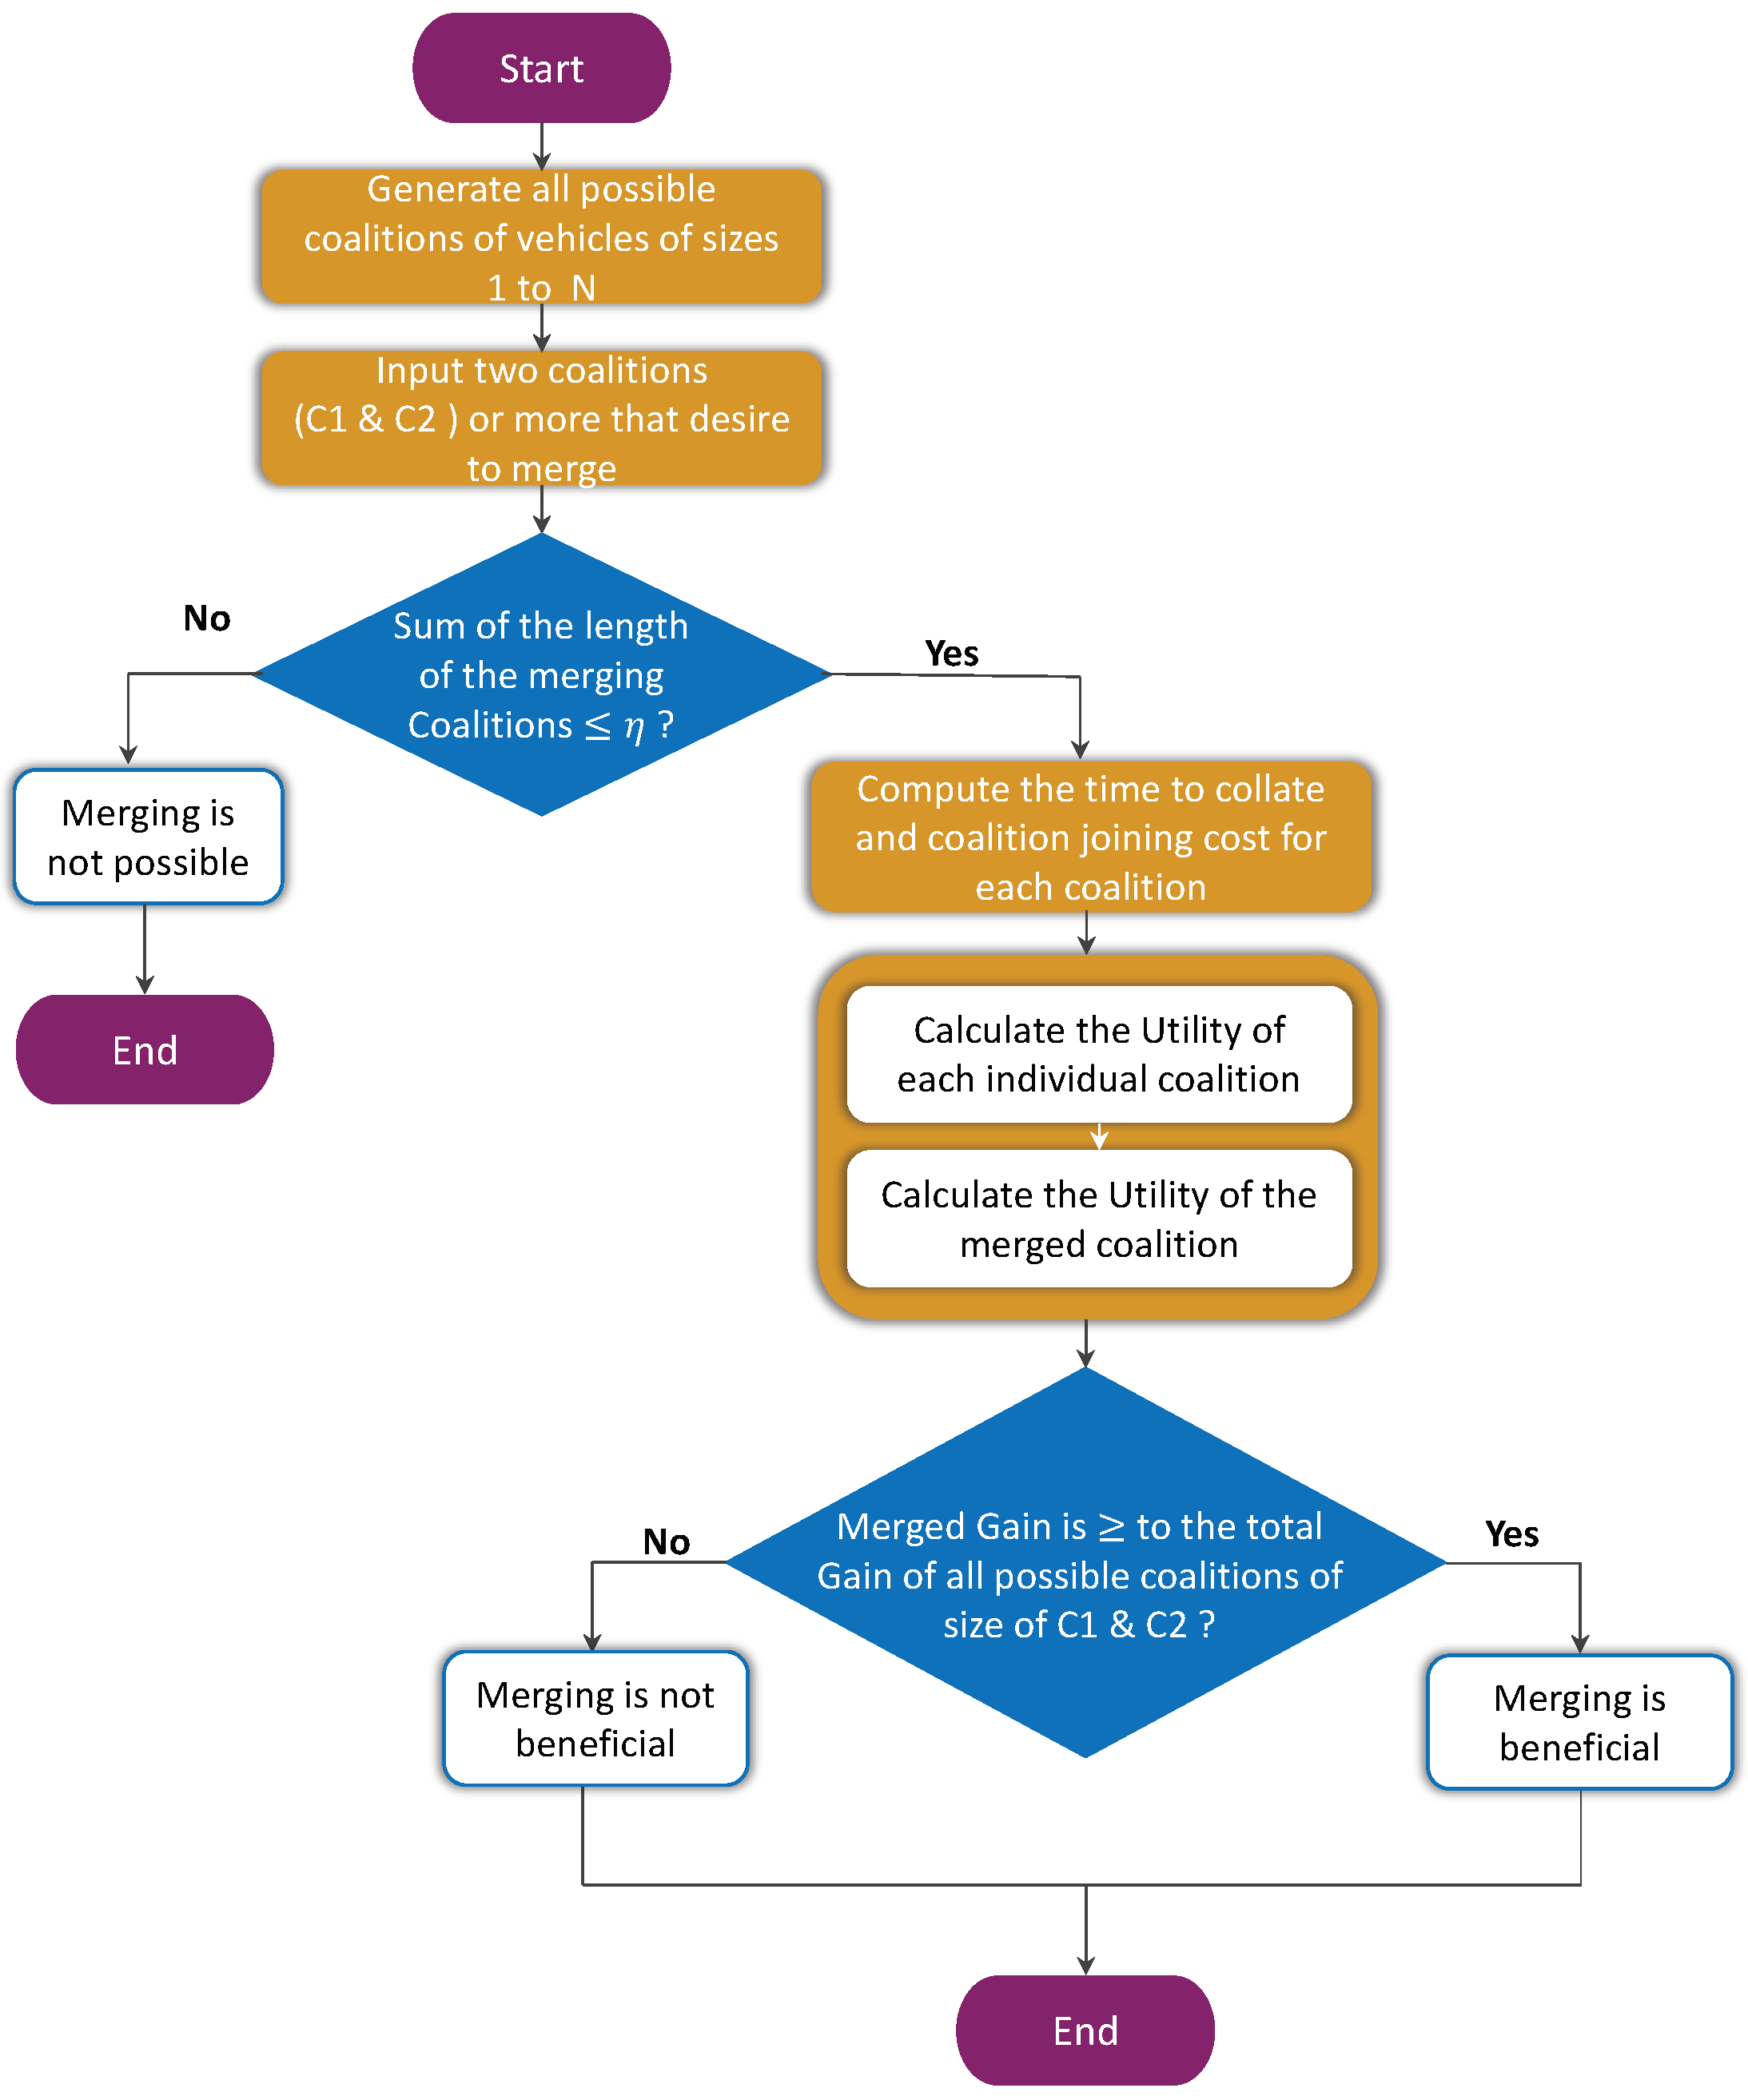
Firstly, all possible combinations of coalitions are generated C o a l i t i o n s = { C C N , C } . This involves considering coalitions of vehicles with sizes ranging from 1 to N . Next, any two coalitions, denoted as C 1 and C 2 , are randomly selected from the list of generated coalitions. The randomness in the selection ensures a fair and unbiased analysis of different coalition pairings. Before proceeding with the evaluation, a critical check is performed to determine the merging feasibility of C 1 and C 2 which involves comparing the combined length of both coalitions with the maximum coalition size ≤  η threshold value. The value of η is taken as 5, but if the total length exceeds η , it indicates that merging is not viable due to size limitations and the dynamics of the urban environment. In such cases, the algorithm promptly concludes that merging is not feasible.
Assuming the initial conditions are met, and merging is deemed feasible, in the next step, the utility U of each individual coalition C 1 and C 2 is computed leveraging the proposed utility function (Equation (3)). This quantitative evaluation facilitates a comprehensive understanding of the independent benefits that each coalition brings such as a reduction in travel time and fuel consumption. Furthermore, the algorithm calculates the U of the merged coalition, considering the collective resources and capabilities of both coalitions. Finally, to evaluate whether merging is beneficial, a comparison is made between the merged utility M U and the total utility of all possible coalitions with the same size as C 1 and C 2 . In this case, the coalition game is said to be Superadditive.
Definition 4
(Superadditive Game). If for any two coalitions C 1 and C 2 such that C 1 C 2 N , the condition Equation (40) holds which states that the merged utility M U of the coalition formed by merging C 1 and C 2 is at least as large as the sum of their individual utilities.
[ C 1 C 2 = ] M U ( C 1 C 2 ) U ( C 1 ) + U ( C 2 )
Therefore if the M U is greater than or equal to the total utility of all possible coalitions, the algorithm concludes that merging is beneficial. In the case of our experiment, the results showed that merging is beneficial. On the other hand, if the M U falls below the total utility, it is deemed that merging would not yield significant benefits. Once the merging is completed, the structure of the coalition is updated and it is shared with all the members of the C . The proposed algorithm for the merging coalition is presented in Algorithm 3 and the flowchart in Figure A3 in Appendix A, respectively.
Algorithm 3 Coalition Merging Algorithm
Smartcities 06 00111 i003

6. Numerical Experiments

This section presents the numerical results obtained from a comprehensive set of experiments conducted to evaluate and validate the performance of the proposed work and assess the benefits of forming a coalition. The experiments are carried out by simulating a scenario of a four-lane road segment in a complex urban environment, where the level of complexity of the environment is between 0.6 and 0.8, with each vehicle traveling individually at a speed of 40 km/h and desired speed of 40–45 km/h.
To investigate the benefits of coalition travel, we form a coalition, denoted as C , comprising five vehicles. These vehicles maintain an inter-vehicle distance of 2 m and travel at speeds ranging from 50 to 55 km/h. In what follows next, the analysis begins by examining the characteristics of the aggregated utility for the ego vehicle V i , which provides insights into the perceived benefits derived by the individual vehicle. Subsequently, we evaluate the individual objective outcomes resulting from traveling within the coalition.
Furthermore, to validate the proposed approach, we compare the benefits of the ego vehicle traveling alone with the benefits of traveling within the coalition. By conducting these comparative analyses, we effectively quantify the benefits of collaborative driving. The specific parameters used in the simulation, along with their respective values, are provided in Table 2, offering a comprehensive reference for the experimental setup.

6.1. Utility of Traveling in Coalition

A coalition of five vehicles is formed to investigate and validate the effectiveness of the proposed utility functions for autonomous vehicles introduced in Section 3.3. Figure 3 represents the aggregated impact of all the parameters on the utility of coalition formation in an urban scenario. The exponential utility graph depicts the relationship between the duration of collaboration of a vehicle in the coalition and the corresponding utility derived from being part of a coalition C .
The x-axis of the graph represents the time to collate τ c , which encompasses the cooperative period where the vehicle collaborates to achieve common goals, such as improved safety, reduced fuel consumption, and other objectives. However, the y-axis represents the utility value associated with τ c . The utility U is a quantitative measure of the benefits obtained by vehicles by traveling in a coalition. The utility is calculated based on the time to collate, gain function, and cost function (see Equation (3)). A higher utility value indicates a greater perceived benefit for the vehicle involved. Inspired by the globally recognized mean opinion score, we normalize the utility value and span its values between the interval [ 1 , 5 ] .
The graph shows that as the time to collate increases, the utility value also tends to increase. This demonstrates that vehicles experience increasing benefits as they spend more time in the coalition. The result also shows some variability in the utility values for different times to collate values. This indicates that there are other factors influencing the utility values, beyond just the time to collate. These factors are related to the specific coalition configuration, such as the speeds of the coalition, overlapping route, inter-vehicle distance, coalition size, or other parameters. Therefore, the result suggests that there is a positive correlation between the time to collate and the utility values, but other factors may also play a role in determining the overall desirability of a coalition configuration.
In what follows next, to understand how the different values of different parameters impact the utility function, some of the examples are presented.
Figure 4 represents that the utility value tends to increase as the overlapping route increases. This suggests that as the overlapping route, which represents the length of the route the V i and the coalition C can travel along towards the same direction by following the same path at the same time, becomes larger, the utility of the coalition increases.
Figure 5 depicts the impact of different coalition speeds on the utility. The graph shows a decreasing trend in utility as the coalition speed increases. This relationship suggests that there is an optimal speed of 40–45 km/h in the urban environment at which the coalition operates with the highest utility.

6.2. Travel Time

To investigate the impact of traveling alone versus traveling in a coalition on travel time, we conducted a comprehensive analysis using a simulated distance of 50 km. The speeds of the vehicles varied from 40 km/h to 80 km/h, with increments of 5 km/h to capture a wide range of scenarios and evaluate the performance across different speed levels.
The results presented in Figure 6 and Figure 7 provide valuable insights into the travel times of vehicles in different scenarios: traveling alone and traveling in a coalition. The analysis aims to evaluate the benefits of forming coalitions and examine the impact of coalition size and inter-vehicle spacing on travel times.
Figure 6 illustrates the comparison between travel times for solo travel and coalition travel with varying coalition sizes. It can be observed that as the average speed increases, the travel time decreases for both solo travel and coalition travel. However, traveling in a coalition demonstrates a noticeable advantage over traveling alone, especially when the average speed is relatively high. This suggests that forming coalitions can significantly reduce travel times and improve overall efficiency. Furthermore, the results demonstrate the influence of coalition size on travel times. As the number of vehicles in the coalition increases, the travel time decreases due to reduced inter-vehicle spacing. This reduction in spacing allows vehicles to maintain higher average speeds and, consequently, complete the given distance in a shorter time. Notably, the benefits of traveling in a coalition diminish beyond a certain coalition size, indicating a potential trade-off between coalition size and travel time reduction. This finding suggests that carefully considering the optimal coalition size is crucial to maximizing the benefits of traveling in a coalition. Therefore, we conclude that traveling in a coalition is more time-efficient for coalition sizes of two to four considering the limitations of an urban environment.
Figure 7 depicts the impact of inter-vehicle spacing δ on coalition travel times. It is evident that as the spacing between vehicles increases, the travel time also increases. This relationship is attributed to the increased separation between vehicles, resulting in reduced aerodynamic benefits and decreased efficiency. Therefore, maintaining an appropriate inter-vehicle spacing of less than 4 s is optimal to achieve the maximum benefits of coalition travel.
Overall, the travel time results showcase the advantages of traveling in a coalition compared to traveling alone, emphasizing the potential for significant reductions in travel times. It highlights the importance of considering factors such as average speed, coalition size, and inter-vehicle spacing when assessing the benefits of coalition travel. These findings contribute to the understanding of collaborative autonomous driving and provide valuable insights for optimizing travel efficiency in complex urban environments.

6.3. Fuel Consumption

This set of experiments is carried out to investigate the relationship between speed and fuel consumption in two scenarios: traveling alone and traveling in a coalition.
In Figure 8, in the case of traveling alone, it is observed that fuel consumption increases steadily as speed increases. This observation is also aligned with the literature that higher speeds result in increased air resistance, requiring more engine power to overcome it. Consequently, the fuel consumption rate rises, indicating that vehicles traveling alone consume more fuel at higher speeds. On the other hand, the coalition scenario presents an interesting finding. The results demonstrate that at lower vehicle speeds, the average fuel consumption per vehicle (L/h) decreases as the inter-vehicle distance and speed differences are optimized. This reduction in fuel consumption is attributed to the concept of drafting or slip-streaming which leads to improved fuel efficiency and lower fuel consumption rates for the vehicles in the coalition. However, it is also noticed that as the vehicle speed increases, the average fuel consumption per vehicle in the coalition starts to deviate from the initial decreasing trend. This change is attributed to the diminishing benefits of drafting at higher speeds. At higher velocities, the increased aerodynamic drag faced by both the lead and trailing vehicles offset the potential gains from drafting. Consequently, the average fuel consumption per vehicle begins to increase, although still at a significantly lower rate compared to the traveling alone scenario. The comparison between the two scenarios clearly highlights the benefits of convoy driving in terms of fuel efficiency. When vehicles travel in a coalition with optimized inter-vehicle distances and speed differences, fuel consumption can be significantly reduced compared to the case when vehicles travel alone.
In another set of experiments (Figure 9), we analyze the relationship between vehicle speed and the average fuel consumption per vehicle in a coalition under different inter-vehicle distances (2, 4, 6, 8, 10 m) and coalition sizes (2, 4, 6, 8, 10 vehicles). The first finding of this experiment is that as the vehicle speed increases, the average fuel consumption per vehicle generally increases. This relationship is observed consistently across all inter-vehicle distances and coalition sizes leading to higher fuel consumption. Secondly, it reveals a notable trend where the average fuel consumption per vehicle increases with increasing inter-vehicle distances to 6, 8, and 10 m. This finding is attributed to the increased air resistance as vehicles are spaced farther apart. When the inter-vehicle distance is larger, the airflow between the vehicles becomes less streamlined, resulting in higher resistance and subsequently higher fuel consumption. Furthermore, this finding is also aligned with the recent work by Kaluva et al. [5]. Additionally, the result demonstrates that the number of vehicles in the coalition has an impact on fuel consumption. As the number of vehicles increases, the average fuel consumption per vehicle tends to decrease. This effect is attributed to the reduced air resistance experienced by the trailing vehicles due to the drafting effect. Therefore, we conclude that traveling in a coalition is more beneficial for coalition sizes greater than two vehicles and at inter-vehicle distances less than 4 m. The results of this research suggest that finding the right balance between inter-vehicle distance and vehicle count is crucial for achieving an energy-efficient coalition.

6.4. Safety

As modeled in Section 3.3.2 we translate the safety of a vehicle into a well-known evaluation measure, time to collision (TTC). Figure 10 depicts the TTC values for two scenarios: a vehicle traveling alone and a vehicle traveling in a coalition. The simulation is performed over several iterations, and the TTC values are generated for each scenario using different input parameters for each scenario. As per the literature, there is no definite value for the TTC threshold to enable discrimination between safe and unsafe car-following situations [21]. According to a recent study, the threshold TTC varies from 1 to 3 s [22]. Therefore, in this research, we conducted different experiments and provide the categorization of the TTC values into different ranges.
The result in Figure 10 incorporates color-filled regions to indicate different ranges of TTC. The critical range, highlighted in red, represents TTC values below a threshold, indicating potential danger and a need for immediate action to avoid the collision. The warning range between 1 and 2 s, indicated by the blue, signifies TTC values within a cautionary zone, warranting increased awareness and vigilance. The safe range from 2 to 4 s, denoted by the yellow color, encompasses TTC values considered safe for regular travel. Finally, the highly safe range from 4 to 7 s, depicted in green, indicates TTC values that exceed the safety threshold, indicating a highly safe condition.
It can be clearly observed from the results that the TTC values for the vehicle traveling alone are mostly between 2 and 3 s; however, in a few iterations, they are in the warning zone, which shows that traveling alone may result in reduced TTC due to the complexity of the urban environment. When traveling alone, there is a lack of coordination with other vehicles, which may also lead to variations in speed and increased uncertainty, resulting in shorter TTC values. In contrast, it can be seen that traveling in a coalition enhanced safety due to small inter-vehicle spacings. The majority of the TTC values fall in the highly safe range from 4 to 6 s, and at some of the points, the value falls to 7 s. In conclusion, the comparison between the two scenarios clearly demonstrates the potential benefits of traveling in a coalition, as it leads to higher TTC values and a reduced risk of collisions. This shows that collaborative driving help maintains a safe and consistent speed among vehicles.

6.5. Comfort

As discussed in Section 3.3.2, we translate the comfort of a vehicle into a jerk to evaluate the smoothness of the driving. In this experiment, we investigate the jerk profiles over time for both scenarios. Figure 11 illustrates the rate of change in acceleration and provides insights into how the acceleration of a vehicle is changing. A positive jerk value means the vehicle accelerates, whereas a negative jerk value represents deceleration.
In the case of traveling alone, represented by the gray line, the vehicle experiences high jerk values from time 0 s to 200 s, which is modeled as a congested segment of the road. The fluctuations in jerk for the vehicle traveling alone indicate irregular driving conditions and external factors, such as traffic jams in the urban environment affecting the vehicle’s acceleration. However, it is also observed that at certain points, the jerk has a value of zero. These periods of zero jerk indicate times when the traffic is regular and the vehicle maintains a steady velocity without abrupt changes in acceleration. In contrast, the purple line represents the jerk profile of a vehicle traveling in a coalition. Initially, it follows a similar pattern to the vehicle traveling alone but with some differences. The coalition vehicle also experiences high jerk values from time 0 to 200 s, indicating instances where the vehicle in the coalition undergoes rapid changes in acceleration, potentially due to the dynamics of congested road segments and maintaining a specific formation. However, it is worth noting that the magnitude of the jerk in this coalition scenario is significantly lower compared to the first scenario. Furthermore, from time 200 s to 370 s, a period of smooth driving can be observed. These results highlight the potential benefits of traveling in a coalition, such as achieving smoother accelerations and reducing discomfort.

7. Conclusions

The coalitional game framework is a promising approach to model convoy driving in an urban environment. In this research, we investigated how vehicles can decide when it is beneficial for them to travel alone or in a coalition of vehicles. In connection with this, we studied how collaboration among vehicles can be realized to achieve the benefits of autonomous driving such as reduced fuel consumption, travel time, enhanced safety, and ride comfort. We modeled convoy driving as a coalition game and designed novel utility functions comprised of different components. Multiple solution concepts, such as Shapley allocation, the Nucleolus, and the Core, were implemented which allocated the payoff fairly to all members and identified the stable coalitions. In addition to this, we modeled and implemented several coalition formation strategies such as traveling mode selection, selecting optimal coalitions, and making decisions about coalition merging to analyze the behavior of the vehicles. Subsequently, we carried out extensive numerical experiments to validate the proposed approach. Experiments of different settings were conducted such as comparing travel time, fuel consumption, safety, and ride comfort of a vehicle traveling alone and in a coalition. The results showed that traveling in a coalition was way more beneficial than traveling alone and that autonomous vehicles should collaborate in an urban environment. We also drew a conclusion that convoy driving in coalitions of two to four vehicles with an inter-vehicle distance of 4 m can achieve the maximum benefits considering the dynamics of an urban environment. The results show that at lower vehicle speeds, the average fuel consumption per vehicle (L/h) in the coalition decreases as the inter-vehicle spacing and speed differences are optimized. Furthermore, in terms of the safety of the coalition, it is clearly seen from the results that the majority of the TTC values fall in the highly safe range from 4 to 6 s, and in some iterations, the value falls to 7 s. Although the proposed work is modeled and implemented specifically for an urban environment, it is applicable to any environment and road segment with slight modifications. The limitation of this research is that we could not study the complexity analysis of the proposed work which we plan to carry out in the extended version of this research. To conclude, some of the future directions of this research are as follows: (i) investigate the dynamic coalitional game to study the rapidly evolving dynamics of the coalitions and the environment such as the number of vehicles, traffic congestion, presence of sudden pedestrians, vulnerable road users, etc.; (ii) investigate the impact of vehicle-to-infrastructure communication technologies in realizing the convoy driving; (iii) study the impact of convoy driving on environmental benefits such as emission reduction (CO2, NO2) and enhanced road capacity.

Author Contributions

Conceptualization, S.M., M.A.K. and H.E.-S.; Investigation, S.M., M.A.K. and H.E.-S.; Methodology, S.M., M.A.K. and H.E.-S.; Project administration, S.M., M.A.K. and H.E.-S.; Supervision, M.A.K. and H.E.-S.; Writing—original draft, S.M.; Writing—review and editing, S.M., M.A.K., H.E.-S. and M.J.K. All authors have read and agreed to the published version of the manuscript.

Funding

This research is partially supported by the ASPIRE Award for Research Excellence (grant number: AARE20-368), Sandooq Al Watan, and the UAEU-ZU research project.

Data Availability Statement

Not applicable.

Conflicts of Interest

The authors declare no conflict of interest.

Notations

List of notations and their definitions:
V i Autonomous ego vehicle capable of sensing, communicating and coordinating
T m Traveling mode of V i
τ c Time to collate
C ε Complexity of the environment
C ζ Complexity of the static elements
C D Complexity of the dynamic elements
Ω 1 Weighting coefficient of static element
Ω 2 Weighting coefficient of dynamic element
T d A Estimated time for V i to reach destination alone
L i ( x , y ) Current location of the vehicle V i or C
dDestination of V i or C
D Distance that V i or C needs to cover
N s v i Number of stops that the V i may make on the way to its destination
S t v i Amount of time the V i spends at each stop
C Coalition of vehicles
T d C Estimated time for C to reach destination
N Total number of vehicles
N Number of vehicles in C
δ Inter-vehicle spacing between the vehicles in the C
V a Average speed of the vehicles in the C
N s C Number of stops that the C may make on the way to its destination
S t C Amount of time the C spends at each stop
Δ V d i f Speed difference between the speed of V i and the speed offered by C
V d Desired speed of V i
V C Speed offered by the coalition C
V m i n Minimum speed limit of V i
V m a x Maximum speed limit of V i
θ r Overlapping route between V i and C
L r Length of road
P i Traveling path of V i
N V Neighboring vehicles
P c Traveling path of C
ω 1 , ω 2 , ω 3 , ω 4 Weighting coefficients of τ c
ψ c o s t Lane switching cost
L If V i switches from current lane to other lane
χ Distance V i needs to travel to switch lane(s)
N l s Number of lane switches required for the V i
a, bCoefficients for the linear component of the lane switch cost function
KCoefficient for the quadratic component of the lane switch cost function
φ c o s t Coordination cost
V c u r i Current speed of V i
V c u r C Current speed of the C
T T C n A ( t ) Calculates the TTC of a vehicle n traveling alone at time t
T T C n C ( t ) Calculates the TTC of a vehicle n traveling a coalition C at time t
L v Length of the vehicle
C D A Drag coefficient of V i traveling alone
A Vehicle front area
ρ A Air density of V i traveling alone
F A r A Air resistance force of V i traveling alone
F R o l l A Rolling resistance force of V i traveling alone
C r A Rolling resistance coefficient of V i traveling alone
mMass of the vehicle
gAcceleration due to gravity
P o A Power output engine of V i traveling alone
EEfficiency of the engine
F C r A Fuel consumption rate of V i traveling alone
F C t o t a l A Total fuel consumption of V i traveling alone
C D C Drag coefficient of a vehicle traveling in C
ρ C Air density of a vehicle traveling in C
F A r C Air resistance force of a vehicle traveling in C
F R o l l C Rolling resistance force of a vehicle traveling in C
C r C Rolling resistance coefficient of a vehicle traveling in C
P o , L C Power output engine of the leading vehicle traveling in C
P o , F C Power output engine of the following vehicle traveling in C
F C r C Fuel consumption rate of each vehicle traveling in C
F C t o t a l C Total fuel consumption of all the vehicle traveling in C
a ( t ) Acceleration of the vehicle
j A ( t ) Jerk of a vehicle traveling alone
j e r k T o t a l , i C ( t ) Jerk of a vehicle traveling in a a coalition
θ 1 , θ 2 Weighting coefficients of cost function
C New Coalition
U Utility
U i , A Utility of vehicle i traveling alone
U i , C Utility of vehicle i traveling in coalition C
ϕ Shapley value
C r Core of the game G
N u Nucleolus
M U Merged utility of the coalitions

Appendix A

Table A1. Explanation of categories of Complexity of Environment with their characteristics and examples.
Category of C ε CharacteristicsExample
Extremely ComplexHighly unpredictable and dynamic environment that requires a high level of perception, interpretation, and decision-making capabilities.A busy downtown area with heavy traffic, pedestrians, bicycles, and unpredictable weather conditions.
More ComplexThe dynamic environment with occasional unpredictable events.Highway, or a suburban area with moderate traffic, multiple intersections, roundabouts, and different road surface conditions.
AverageA relatively stable environment that requires basic perception and decision-making capabilities.A rural area with low traffic volume, straight roads, and predictable weather conditions.
SimpleA highly predictable and stable environment that requires minimal perception and decision-making capabilities. A parking lot with few obstacles and minimal traffic.
Figure A1. Flowchart of traveling mode selection decision making.
Smartcities 06 00111 g0a1
Figure A2. Flowchart of optimal coalition selection decision making.
Smartcities 06 00111 g0a2
Figure A3. Flowchart of coalition merging decision.
Smartcities 06 00111 g0a3

References

  1. SAE Levels of Driving Automation™ Refined for Clarity and International Audience. Available online: https://www.sae.org/blog/sae-j3016-update (accessed on 20 December 2022).
  2. Malik, S.; Khan, M.A.; Aadam.; El-Sayed, H.; Iqbal, F.; Khan, J.; Ullah, O. CARLA+: An Evolution of the CARLA Simulator for Complex Environment Using a Probabilistic Graphical Model. Drones 2023, 7, 111. [Google Scholar] [CrossRef]
  3. Malik, S.; Khan, M.A.; El-Sayed, H. Collaborative autonomous driving—A survey of solution approaches and future challenges. Sensors 2021, 21, 3783. [Google Scholar]
  4. Jeong, S.; Baek, Y.; Son, S.H. Distributed urban platooning towards high flexibility, adaptability, and stability. Sensors 2021, 21, 2684. [Google Scholar] [CrossRef] [PubMed]
  5. Kaluva, S.T.; Pathak, A.; Ongel, A. Aerodynamic drag analysis of autonomous electric vehicle platoons. Energies 2020, 13, 4028. [Google Scholar] [CrossRef]
  6. Hang, P.; Lv, C.; Huang, C.; Xing, Y.; Hu, Z. Cooperative decision making of connected automated vehicles at multi-lane merging zone: A coalitional game approach. IEEE Trans. Intell. Transp. Syst. 2021, 23, 3829–3841. [Google Scholar]
  7. Hang, P.; Lv, C.; Huang, C.; Hu, Z. Cooperative decision making of lane-change for automated vehicles considering human-like driving characteristics. In Proceedings of the 2021 40th Chinese Control Conference (CCC), Shanghai, China, 26–28 July 2021; pp. 6106–6111. [Google Scholar]
  8. Hang, P.; Huang, C.; Hu, Z.; Lv, C. Decision making for connected automated vehicles at urban intersections considering social and individual benefits. IEEE Trans. Intell. Transp. Syst. 2022, 23, 22549–22562. [Google Scholar] [CrossRef]
  9. Bui, K.H.N.; Jung, J.J. Cooperative game-theoretic approach to traffic flow optimization for multiple intersections. Comput. Electr. Eng. 2018, 71, 1012–1024. [Google Scholar]
  10. Wei, H.; Mashayekhy, L.; Papineau, J. Intersection management for connected autonomous vehicles: A game theoretic framework. In Proceedings of the 2018 21st International Conference on Intelligent Transportation Systems (ITSC), Maui, HI, USA, 4–7 November 2018; pp. 583–588. [Google Scholar]
  11. Calvo, J.A.L.; Mathar, R. Connected vehicles coordination: A coalitional game-theory approach. In Proceedings of the 2018 European Conference on Networks and Communications (EuCNC), Ljubljana, Slovenia, 18–21 June 2018; pp. 1–6. [Google Scholar]
  12. Zhang, Y.; Zhang, J. Design and optimization of cluster-based DSRC and C-V2X hybrid routing. Appl. Sci. 2022, 12, 6782. [Google Scholar] [CrossRef]
  13. Khan, M.A.; Boloni, L. Convoy driving through ad hoc coalition formation. In Proceedings of the 11th IEEE Real Time and Embedded Technology and Applications Symposium, San Francisco, CA, USA, 7–10 March 2005; pp. 98–105. [Google Scholar]
  14. Bouchery, Y.; Hezarkhani, B.; Stauffer, G. Coalition formation and cost sharing for truck platooning. Transp. Res. Part B Methodol. 2022, 165, 15–34. [Google Scholar] [CrossRef]
  15. Hadded, M.; Minet, P.; Lasgouttes, J.M. A game theory-based route planning approach for automated vehicle collection. Concurr. Comput. Pract. Exp. 2021, 33, e6246. [Google Scholar] [CrossRef]
  16. Cheng, Y.; Liu, Z.; Gao, L.; Zhao, Y.; Gao, T. Traffic risk environment impact analysis and complexity assessment of autonomous vehicles based on the potential field method. Int. J. Environ. Res. Public Health 2022, 19, 10337. [Google Scholar] [CrossRef] [PubMed]
  17. Rakha, H.; Ahn, K.; Trani, A. Development of VT-Micro model for estimating hot stabilized light duty vehicle and truck emissions. Transp. Res. Part D Transp. Environ. 2004, 9, 49–74. [Google Scholar] [CrossRef]
  18. Guang, H.; Jin, H. Fuel consumption model optimization based on transient correction. Energy 2019, 169, 508–514. [Google Scholar] [CrossRef]
  19. Zhu, M.; Wang, Y.; Pu, Z.; Hu, J.; Wang, X.; Ke, R. Safe, efficient, and comfortable velocity control based on reinforcement learning for autonomous driving. Transp. Res. Part C Emerg. Technol. 2020, 117, 102662. [Google Scholar] [CrossRef]
  20. numpy.gradient—NumPy v1.24 Manual. Available online: https://numpy.org/doc/stable/reference/generated/numpy.gradient.html (accessed on 2 May 2023).
  21. Ramezani-Khansari, E.; Nejad, F.M.; Moogeh, S. Comparing time to collision and time headway as safety criteria. Pamukkale Üniversitesi Mühendislik Bilim. Derg. 2020, 27, 669–675. [Google Scholar] [CrossRef]
  22. Jiang, Y.; Ren, T.; Ma, Y.; Wu, Y.; Yao, Z. Traffic safety evaluation of mixed traffic flow considering the maximum platoon size of connected automated vehicles. Phys. A Stat. Mech. Its Appl. 2023, 612, 128452. [Google Scholar] [CrossRef]
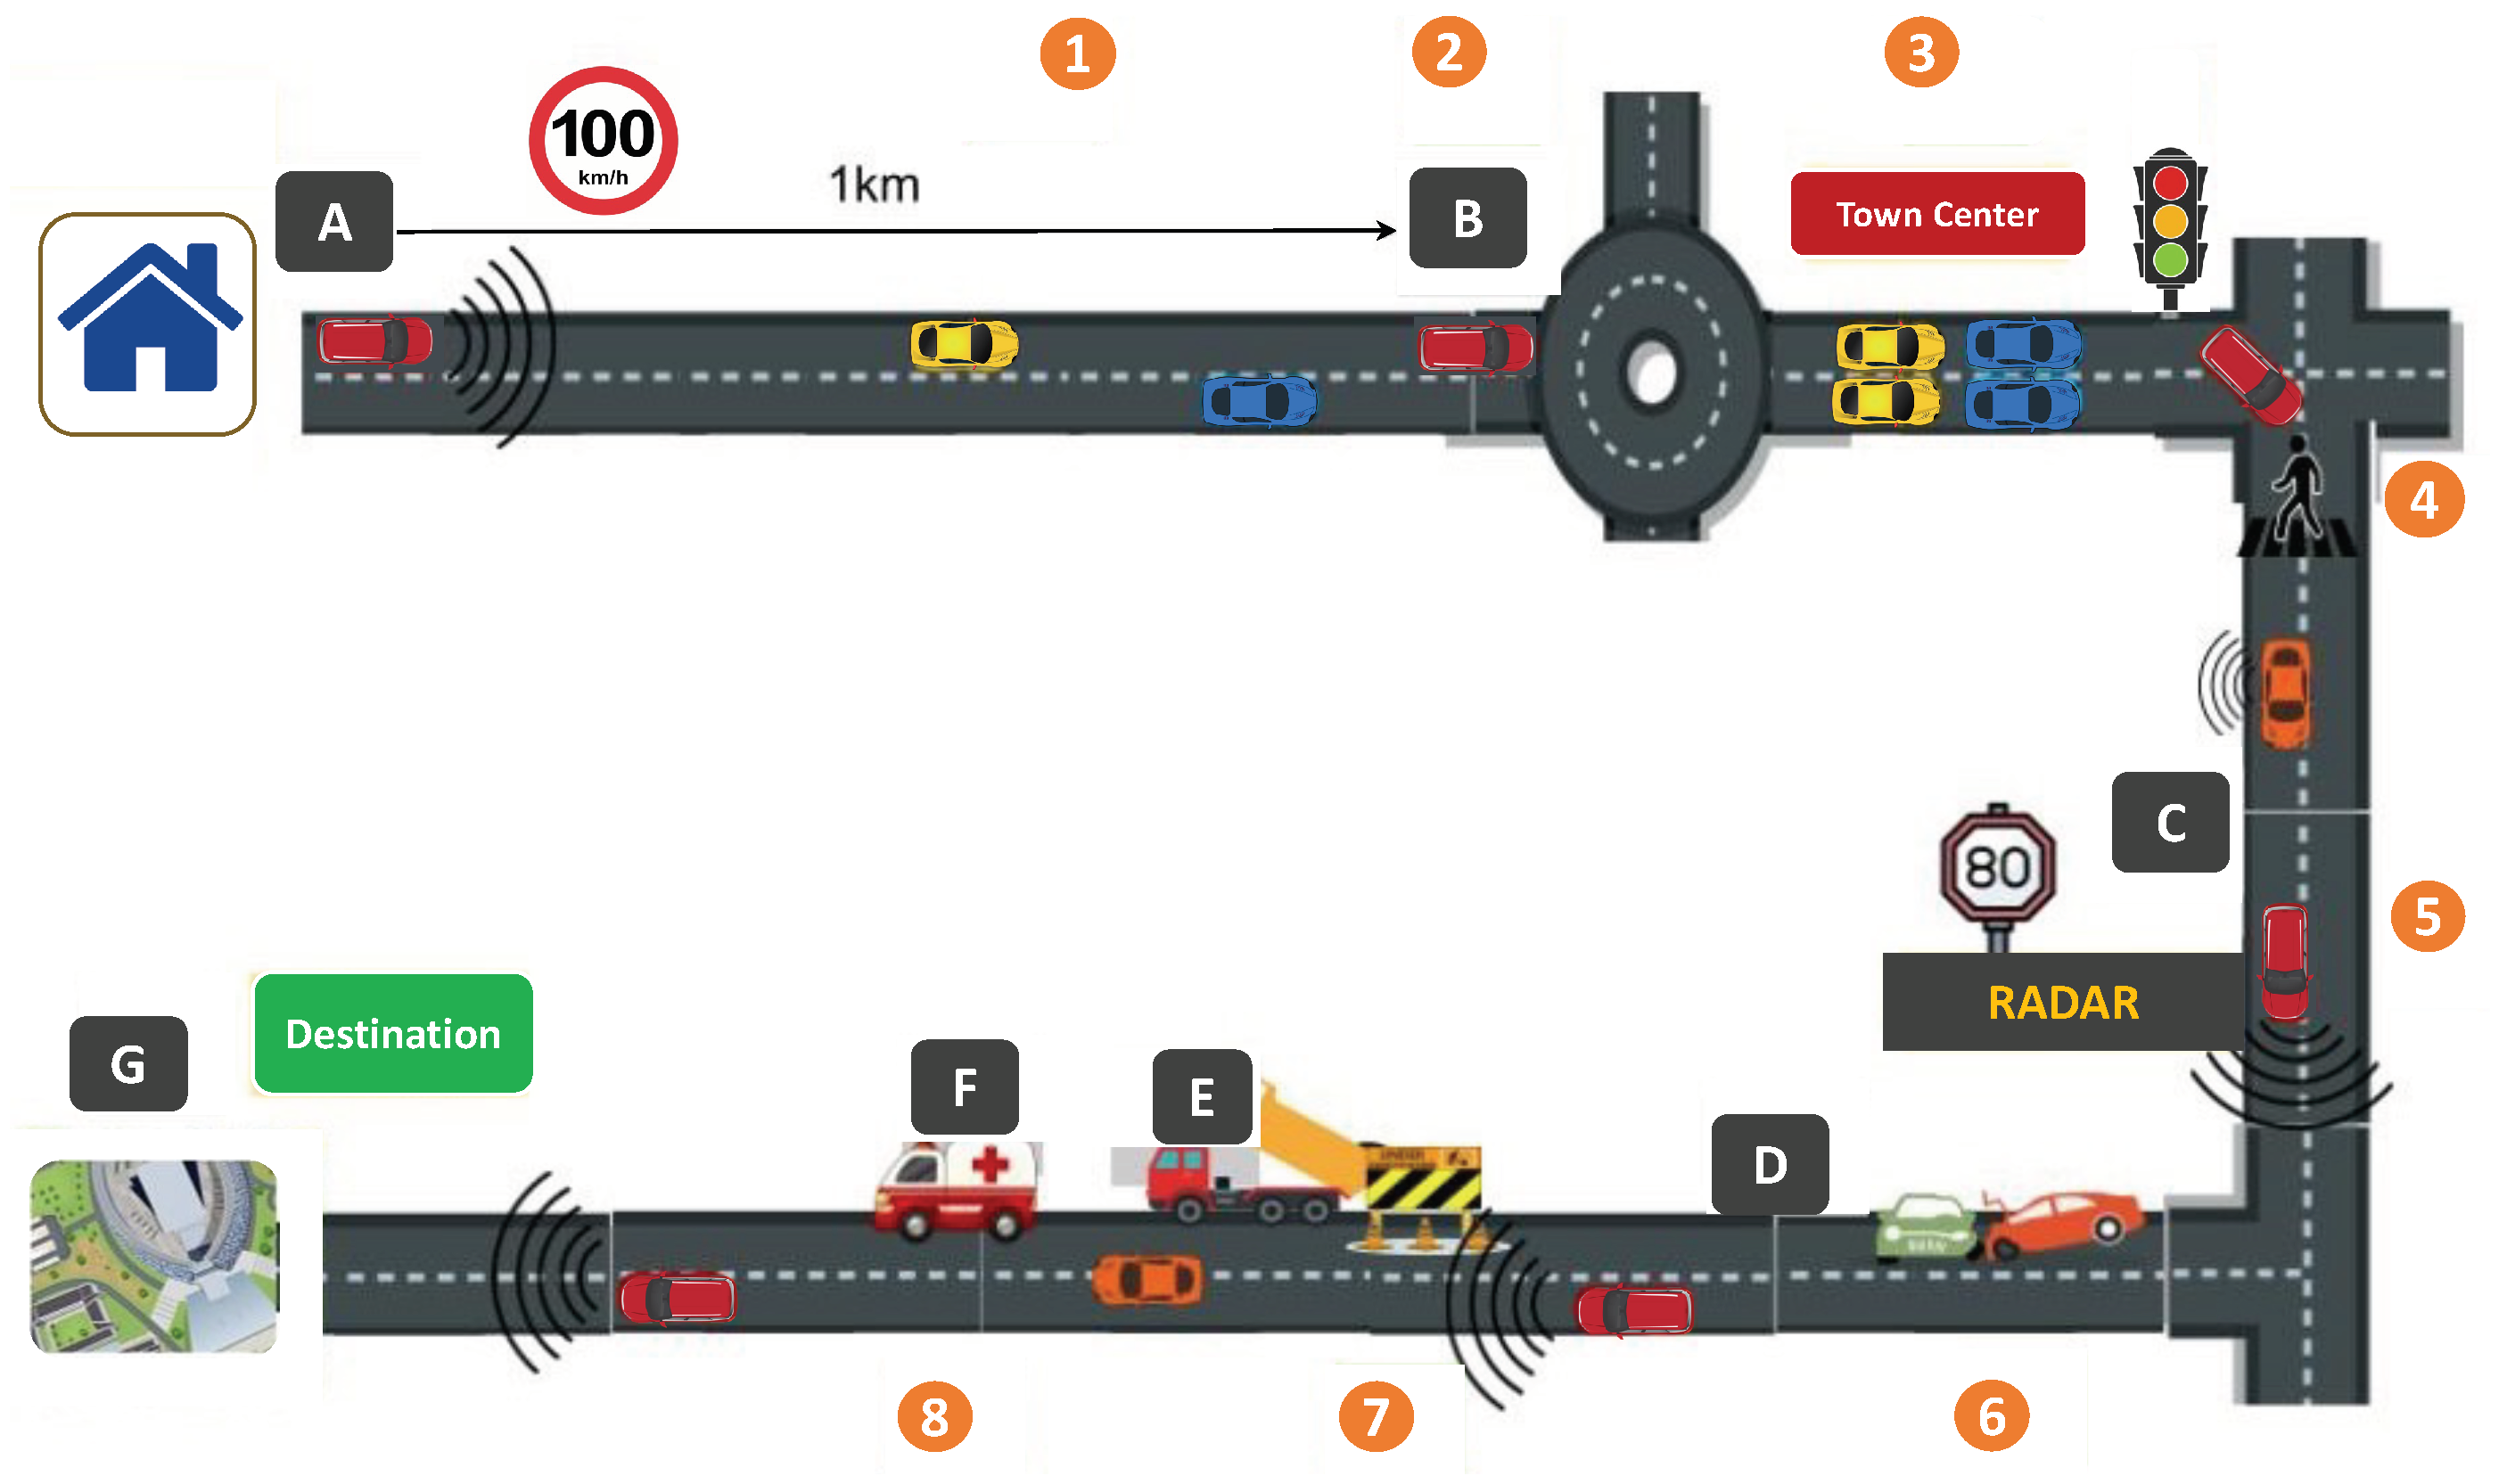
Figure 1. Representation of the complex urban environment.
Smartcities 06 00111 g001
Figure 2. Illustration of a coalition of autonomous vehicles.
Smartcities 06 00111 g002
Figure 3. Relationship between time to collate and utility of forming a coalition.
Smartcities 06 00111 g003
Figure 4. Impact of the overlapping route on the utility.
Smartcities 06 00111 g004
Figure 5. Impact of coalition speed on the utility.
Smartcities 06 00111 g005
Figure 6. Comparison of travel time of a vehicle traveling alone and traveling in a coalition of different sizes.
Smartcities 06 00111 g006
Figure 7. Impact of different inter-vehicle spacing on coalition travel time.
Smartcities 06 00111 g007
Figure 8. Comparison of fuel consumption of a vehicle traveling alone and traveling in a coalition.
Smartcities 06 00111 g008
Figure 9. Relationship between speed and the average fuel consumption per vehicle in a coalition under different inter-vehicle distances coalition sizes.
Smartcities 06 00111 g009
Figure 10. Comparison of TTC of a vehicle traveling alone and traveling in a coalition.
Smartcities 06 00111 g010
Figure 11. Comparison of the jerk of a vehicle traveling alone and traveling in a coalition.
Smartcities 06 00111 g011
Table 1. Comparative summary of the previous papers.
Ref.Coalition
Game Type
Use Case/ObjectiveCoalition
Composition
Coalition Implementation
Strategies
Utility/Cost
Function Parameters
Utility/Cost FunctionConstraintsAssumptionsSolution ConceptSimulator/
Language
Travel: Alone
or Coalition
Merge/SplitCoalition Selection
Decision
ShapleyCoreNucleolusOther
[6]Coalition
Formation
Multi-lane merging scenario
for CAV
CAVsSafety, comfort, and
efficiency
J v i = ω s v i J s v i + ω c v i J c v i + ω e v i J e v i Ride comfort,
travel efficiency,
and acceleration
--MATLAB/
Simulink
[7]Coalition
Formation
Study of cooperative lane change
decision-making issue of AVs.
AVsSafety, comfort, and
efficiency
P A V i = K s A V i P s A V i + K c A V i P c A V i + K e A V i P e A V i Safety,
efficiency
--MATLAB/
Simulink
[14]Coalition
Formation
Study of Coalition formation and
cost-sharing for truck platooning
from system-wide optimization
perspective
Autonomous
Trucks
Traveling cost min i = 1 n j = 1 n c i j y i j + j = 1 n k = 1 n l = 1 n f l d k d k + 1 Z l k j -Concavity-Julia
[8]Fuzzy
Coalition
Conflict management at
unsignaled intersection
CAVsDriving safety, passing
efficiency
V i = k s i V s i + k e i V e i Safety, efficiency,
comfort, stability,
and control
All vehicles are CAVs,
motion states and
position information can
be shared with each other
-MATLAB/
Simulink
[9]Coalition
Formation
Optimizing traffic flow at different
intersections
AVsWaiting time of vehicles,
number of Vehicles,
passing in a certain time
i t i , t j = Q i + t j α i t j β i -Traffic light consists
of two phases (Green & Red),
each intersection has four
directions and three lanes
Nash
equilibrium
   Netlogo
[10]Coalitional
Graph
Platooning of CAVs at the
intersection aiming to enhance
safety and intersection throughput
LanesLikelihood of accidents,
change in travel time,
and cost of speed
change
U i ( v i + ) = H t p + ε v i v j v i = v j Throughput
threshold
Traffic stream rate is > 0
for all lanes
Nash
equilibrium
-
[11]Coalition
Formation
Platoon formation to optimize the
traffic flow and safety in dense
scenarios
AVsDistance, travel time,
congestion tax
v n i x , m T = d n i x , m T + τ n i [ x , m T ] + ζ n i [ x , m T ] CommunicationNo sensor failure,
AV has predefined initial
position and final destination
--
[15]Hedonic
Coalition
Formation
Platoon allocation and route
planning for picking up and
returning automated vehicles in
shared transportation systems
Parked
Vehicles
Maximum time spent in
the platoon, maximum
distance between
two parked vehicles,
history of the player
f i ( C ) = m a x k C d k , c e n t r o i d ( c ) N / | C | Energy, and each
vehicle should be
picked up
Vehicles must return to same
station, leader and followers
consume equal energy for the
same distance, players
are rational
Nash
Stable
     Java
[13]Coalition
Formation
Convoy driving on the highwayVehiclesCurrent speed,
desired speed,
speed offered by
coalition, minimum
acceptable utility
U ( i , C j ) = 1 | D i S i j | D i λ ( j ) P i S i j P i i f L i S i j U i 0 o t h e r w i s e -20-meter wireless transmitter
range, 5 vehicles with
varied speeds
-  Motes Devices
YAES simulator
This paperCoalition
Formation
Convoy driving
in the urban environment
AVsDiscussed in the paper
(Section 3.3)
U i , j : = [ ( α × τ c ) × e G ] J c Speed, safety
ride comfort, and
coalition size
(Section 3.4)
Discussed in the paper
(Section 3.2)
-   Python
Table 2. Table of parameters and their values.
InputUnitValueDescription
α 0.1
V c u r i Km/h40–45Current speed
V d Km/h45–50Desired speed
V C Km/h50–55Coalition speed
C ε 0.6–0.8Environment complexity
Ω 1 0.35
Ω 2 0.65
C D A 0.27Drag coefficient
A (m 2 )2Frontal area
ρ A (kg/m 3 )1.18Air Density
m(Kg)1200Mass of the vehicle
E 0.35Efficiency
L H V (MJ/Kg)45Lower heating value
C r A 0.015Rolling resistance coefficient
C D C 0.23Drag coefficient in coalition
ρ C (kg/m 3 )1.2Air density of vehicle in coalition
C r C 0.01Rolling resistance coefficient in coalition
g(m/s 2 )9.8Gravity
δ Km[2,4,6,8,10]Inter-vehicle spacing
a 0.5
b 1.0
K 0.2
λ 0.05–0.1
L v m5Vehicle Length
N l s 0–4Number of lane switches
N [2,4,6,8,10]Number of vehicles in the coalition
Table 3. Comparison of the utility of the vehicles traveling alone and the Shapley allocation of vehicles traveling in a coalition.
Utility of vehicles traveling alone
V 1 V 2 V 3 V 4 V 5
U ( V 1 ) U ( V 2 ) U ( V 3 ) U ( V 4 ) U ( V 5 )
3.03.24.03.343.9
Shapley allocation of vehicles traveling in a coalition
ϕ ( V 1 ) ϕ ( V 2 ) ϕ ( V 3 ) ϕ ( V 4 ) ϕ ( V 5 )
4.364.595.04.444.91
Table 4. Comparison of the utility of the vehicles traveling alone and the Nucleolus allocation of vehicles traveling in the coalition.
Utility value of vehicles traveling alone
V 1 V 2 V 3 V 4 V 5
U ( V 1 ) U ( V 2 ) U ( V 3 ) U ( V 4 ) U ( V 5 )
3.03.24.03.343.9
Nucleolus allocation of vehicles traveling in a coalition
N u ( V 1 ) N u ( V 2 ) N u ( V 3 ) N u ( V 4 ) N u ( V 5 )
4.365.04.333.894.71
Table 5. Stable coalitions in the Core.
Stable Coalitions
Coalition 1( V 1 , V 3 , V 4 )
Coalition 2 (Grand)( V 1 , V 2 , V 3 , V 4 , V 5 )
Disclaimer/Publisher’s Note: The statements, opinions and data contained in all publications are solely those of the individual author(s) and contributor(s) and not of MDPI and/or the editor(s). MDPI and/or the editor(s) disclaim responsibility for any injury to people or property resulting from any ideas, methods, instructions or products referred to in the content.