Article

Factors Affecting Stakeholder Acceptance of a Malaysian Smart City

by
Qasim Hamakhurshid Hamamurad
1,*,
Normal Mat Jusoh
2 and
Uznir Ujang
3
1
Information System, AHIBS, Universiti Teknologi Malaysia, Johor Bahru 81310, Malaysia
2
Information System, AHIBS, Universiti Teknologi Malaysia, Kuala Lumpur 54100, Malaysia
3
Geo-information, Faculty of Built Environment and Surveying, Universiti Teknologi Malaysia, Johor Bahru 81310, Malaysia
*
Author to whom correspondence should be addressed.
Smart Cities 2022, 5(4), 1508-1535; https://doi.org/10.3390/smartcities5040077
Submission received: 10 September 2022 / Revised: 9 October 2022 / Accepted: 10 October 2022 / Published: 27 October 2022

Abstract

:
Smart city technology is only considered in some cities depending on the resident requirements, whereas smart initiatives are adopted easily in others. One of the first critical steps toward understanding these aspects of Malaysian smart cities is to empirically study the citizens’ and government agencies’ aspirations to use smart city services. A Malaysia Smart Cities Stakeholders Adoption Model (MSCSA) as a case study based on the unified theory of acceptance and use of technology (UTAUT2) is being developed and evaluated in Kuala Lumpur, Malaysia. An in-depth interview with expert staff from the Plan Malaysia smart city department and Telekom Malaysia Berhad (TM one) was conducted using a mixed-methods approach. To determine the influence of seven parameters on behavioural intentions, specifically the choice to build a smart city, quantitative data were collected as questionnaires. These parameters were self-efficacy, expected effort, perceived security, perceived privacy, price value, trust in government, and trust in technology. Citizens’ intentions to use smart city services were significantly influenced by each of these characteristics. There is a definite association between perceived privacy and perceived security as a core aspect of trust in technology, as well as price value, a core aspect of trust in government. When the trust in both these is strong, stakeholders are more willing to adopt and pursue smart city services. These studies provide city officials with a technique for measuring citizen desire for smart city services, as well as outlining the components necessary for establishing a good smart city strategy that is successful.

1. Introduction

Many smart city ventures have been developed by the Malaysian government, such as Cyberjaya, Sdn Bhd, Iskandar Malaysia, and Kuala Lumpur City Hall. They can serve as examples for small and medium-sized cities looking to improve the quality and efficiency of their services. As an example, Cyberjaya, as a smart city district, was charged with becoming a test bed to nurture technological innovations and the desired tech investment destination. Cyberjaya’s smart city and even-handed initiatives included high-speed broadband networks for low-income regions [1]. Melaka has smart meters for electricity metering, and the local government has developed a smart city advisory board to advise on smart city initiatives in the state. The Smart Selangor plan, which aims to make it the most liveable state in the area by 2025, the Iskandar Malaysia smart city; and several smart programmes under the Kuala Lumpur Smart City Blueprint 2021–2025 and DBKL (Kuala Lumpur City Hall) are ongoing important smart city developments [2].
Malaysia plans to roll out 5G to five major cities and regions in Selangor, Penang, Johor, Sabah, and Sarawak by 2022. Malaysia’s first cities to receive 5G technology are Putrajaya and Cyberjaya. Putrajaya, Cyberjaya, and Kuala Lumpur now have 5G service. Cities of tomorrow require more efficient infrastructure and environmental protection. The development of smart cities in Malaysia enhances the quality of life and reduces emissions. Energy companies are establishing electric vehicle (EV) charging stations across Malaysia, Singapore, and Thailand, and they have set up electric vehicle charging stations and free public Wi-Fi. The majority of the EV connection’s charging station network will be installed along Malaysia’s North–South Expressway. GreenTech Malaysia’s Charge EV network currently has over 300 charging stations countrywide [3]. TM One, Telekom Malaysia Berhad’s (TM), has developed a system that can control traffic signals to respond to real-time data collected by linked cameras and sensors [4]. A sensor network for temperature, pollution, sound levels, and foot traffic has been established.
Many individuals are sceptical that the growing reliance on technology would have a substantial influence on public participation, particularly when not using the technology would be a waste of resources [5]. There are also the financial considerations to determine the residents’ interest before making any big investment, the significance of detecting and comprehending user acceptance behaviour towards information and communications technologies [6]. Our research follows these considerations by raising a reasonable question: Which factors have a significant impact on smart city user adoption?
This research used an extension of the (UTAUT2) unified theory of acceptance and use of technology to solve this question for the City of Kuala Lumpur (KL). According to UTAUT theory, behavioural intentions determine how technology is used. Four fundamental constructs have a direct impact on the perceived possibility of technology adoption; these are performance expectations, effort expectations, social influence, and facilitating conditions. Afonso et al., (2012), found that age, gender, experience, and voluntariness of use moderate the effect of predictors [7]. UTAUT was developed originally to explain and predict technology acceptance in an organisational context; however, it has since been tested in non-organisational settings as well. Since its inception, UTAUT has been widely applied, enhancing its generalisability. UTAUT has been extended several times to adapt to context or improve its predictive power, given the variability of information communication technologies. Venkatesh et al. (2012) presented UTAUT2 as an extension of UTAUT [6].
UTAUT2 tried to acquire greater generalisability by focusing on the private user segment and expanding the literature on technology acceptance. The behavioural motivation to use technology is described as “the happiness or pleasure derived from using technology,” and it has been implicated in having an important influence on determining technological acceptability and use. Prior research in the information system (IS) and marketing domains has indicated that the perceived hedonic character of the outcome was a major predictor of consumer technology use, which justified the inclusion of this concept [8]. UTAUT2 postulates that the use of technology by individuals is underpinned by the effect of three additional constructs, namely, hedonic motive, cost/perceived value, and habit, which are moderated by age, gender, and experience.
The UTAUT2 can now be used to identify the factors that affect the acceptance and adoption of a specific system and assess the likelihood of an individual using it. Smart cities can be accepted according to the UTAUT2 theory because, firstly, UTAUT2 was developed using previous adoption models that relied on extensive psychological, sociological, and behavioural research [9]. Secondly, it has been used successfully to study the adoption of e-government services and the acceptance of information systems [10]. Thirdly, smart-city technologies are becoming increasingly integrated with residents and the community, thus extending e-government services. In addition, UTAUT2 has allowed the inclusion of additional constructs to those identified in our interviews. Thus, UTAUT2 is well positioned to identify the factors most influencing the adoption of and the intention to use smart-city services, which in turn will inform city officials and vendors about how to improve implementation and evaluation. Smart cities are then anticipated to expand existing services through greater integration with the citizens. UTAUT2 is a well-known theory which can be used for the adoption of e-government services, and it has been broadly applied to research information system acceptance and use [10].
Greater Kuala Lumpur (KL) is a city-state in Malaysia that has cooperated with the capital city of Kuala Lumpur, as well as municipalities around the capital, covering approximately 2793.27 sq. km. There are 8,419,566 inhabitants in this area. The Malaysian government has recognised and supported this area by including it in the National Key Economic Areas (NKEAs) of the Economic Transformation Program (ETP) [11] becoming one of the world’s top 20 most liveable cities and raising the country’s GNP per capita to more than RM48,000 to become a high-income nation [12]. Greater KL naturally serves as one of the smart city models for most cities in the country, as well as its sister cities throughout the world, due to its important contribution to the national economy.
Twenty government universities and 23 private universities are located in Kuala Lumpur. Kuala Lumpur was Malaysia’s first fastest-growing metropolis, and the rapid expansion of the universities has had a tremendous impact on the city’s economy and culture. Similarly, Malaysia is also focusing on smart cities and smart communities, a trend that reflects the broader global trend. In addition to the Smart Selangor initiative, which aims to make it the most liveable state in the region by 2025, several digital programs are being developed by DBKL (Kuala Lumpur City Hall) under its Kuala Lumpur Smart City Blueprint 2021–2025 [13].
The structure of our study is as follows: a study background on the significance of smart cities and technology adoption is presented in the second section; while the third section covers Malaysia’s Smart City Stakeholders’ Adoption (MSCSA) theoretical framework and (MSCSA) model development; Section four covers the method of the creation and management of a companion survey; and an examination of our findings. Section five covers data analysis and results. This paper finishes with an assessment of its contributions to the area, implications and limitations, and future research opportunities.

2. Study Background

The hypothesised MSCSA (Malaysian Smart City Stakeholders Adoption) model employed in this research is derived from a 12-year review of academic research in the fields of adoption of e-government technologies and smart city development and information from the government, corporate sectors, an academic group from the University Technology Malaysia (UTM), and the Malaysia-Kuala Lumpur city stakeholders.

2.1. Smart City

Within many cultural contexts, city infrastructure draws an increasing number of people preferring the benefits of urbanisation over traditional rural lives. According to the United Nations (UN), 6.5 billion people will live in cities by 2050 [14]. As a consequence, cities face significant issues as their resources and infrastructure are put under growing demands. The use of Information and Communication Technology (ICT) within an accessible integrated infrastructure is an emerging trend for managing and mitigating the impact of these demands. This leads to the idea of a smart city. These smart cities utilise information and communication technologies to improve their citizens’ quality of life, local economy, infrastructure, traffic management, climate, and government engagement [15]. Smart cities incorporate terminologies such as Intelligent City, DataCity, Knowledge City, Wired City, and Ubiquitous City [16]. Since the concept of smart cities was first proposed in the early 2000s, a significant amount of study has been undertaken on evaluating smart city structures in nations that had earlier development of IoT technology [17]. Several organisations, including the (WSO) World Smart Cities Organization, the International Development Center from Harvard University, multinational corporations such as IBM and International Data Corporation (IDC) in the United States, and universities such as the Vienna University of Technology, have conducted research about smart cities [18].
Expressed in everyday language, it could be said that smart cities use digital technologies to make life easier for residents. For a city to be smart, it must include elements [19], such as a smart economy, smart citizens, smart health, smart surroundings, and smart management. Smart cities, according to Giffinger and Gudrun (2010), have six factors for success: smart economics, governance, people, transportation, environment, and living [20]. Chourabi et al. (2012), recognised management and organisation, governance, technology, policy, economy, communities and people, built infrastructure, and the natural environment as success criteria for smart city initiatives [21].
Furthermore, several technologies and automobile manufacturers, such as Google, Uber, Volvo, Tesla, Audi, BMW, Mercedes-Benz, and Nissan, to mention a few, have now joined the smart cities trend with their smart mobility solutions of driverless cars or autonomous cars. After two decades of modern thinking and execution of the smart cities concept, it is nevertheless, still in its infancy [22]. The governments of the USA, Japan, Italy, and China have all conducted studies to assess the development of smart cities [23].
Every city has its own unique set of economic, political, social, geographical, and environmental qualities [24]. The smart city is defined as infrastructural; and has integration and innovation services, the application of social learning to the improvement of human infrastructure, and governing for organisational enhancement and citizen participation [6,25]. Smart cities, like every city, include environmental, social, and economic components, with the distinction that technology now has a far larger impact. Smart cities are much more than digitalised cities. Although electricity and bandwidth formerly defined modern cities, information and communication technology (ICT) and the internet of things(IoT) are now their technological foundations [26]. The term “smart” has become the standard beginning for phones, buildings, residences, transportation systems, and other electronic gadgets. Smart suggests the opportunity to solve issues and adapt to new circumstances, which associates with being ‘user-friendly’ [27]. To become a smart city, it is necessary to combine technology with stakeholder engagement. ICT catalyses the city towards becoming more reactive, efficient, robust, and innovative [25,28,29]. The focus is to improve services, resolve the concerns about migration to cities, increase urban capacity, encourage more efficient resource management, and most importantly, improve the quality of life. Cities are actual systems, and a smart city consists of multiple smart systems, that will have a social–institutional, smart–physical, and economic infrastructure in a sustainable environment, with its residents being central to these systems See (Figure 1).
Malaysia’s shift to a digital society began in the 1990s with the National Information Technology Agenda (NITA). The emphasis was on developing talent, infrastructure, and applications to serve society and communities. After the Multimedia Super Corridor was established in 1996, which was directed to entice the multimedia sector to agglomerate local and international skill sets, the implementation of e-government was launched [30]. To complement these initiatives, Cyberjaya’s positioning as a Global Technology Hub was built. The Malaysia Information Communication and Multimedia Service 886 Blueprint, established in 2005, improved the foundation for ICT development [31] the National Strategic ICT Roadmap, published in 2008, established a national framework for the growth of new ICT-based and knowledge-intensive sectors, thereby catalysing Malaysia’s smart city journey.
Iskandar Malaysia (Economic Corridor) was designated as Malaysia’s first smart city model in 2014, based on six indicators, according to Giffinger’s six smart city components [32],: five Smart indicators (Governance; Economy; Environment; People; Mobility) and Smart Living in a Smart City. The government has noted that the demand for the development of the smart city has expanded dramatically over the years, with several public and private groups advocating for a planned development approach. The Housing and Local Government Ministry 2018 held a series of engagements with local governments at three levels (city councils, municipal, and district) to improve their awareness of “Smart Cities.” The collaboration resulted in the development and launch of the state-wide Malaysia Smart City Framework (MSCF) in 2019, which was intended to streamline and coordinate the implementation of intelligent cities in Malaysia. The 2019 MSCF will be incorporated into the 12th Malaysia Plan, which will run from 2021 to 2025 [33] see (Figure 2).

2.2. Smart City Technology Challenges

Recently, there has been significant development in the field of technology. The year 2020 is shaping up to be one in which developing technologies have a greater impact on the lives of enterprises, individuals, and the digital economy. In recent years, subjects such as Artificial Intelligence (AI), Cloud, Cybersecurity, and Big Data have stayed consistent while contemplating a more connected future. The correlation between technologies and smart cities is not always clear. A smart city has sophisticated ICTs connectivity such as fibre optic cables, 5G wireless networks, IoT-connected devices, or uses Artificial Intelligence (AI). According to Townsend (2013), whenever Cisco and IBM pitch their technology as the solution to all complications, they are assuming that a diverse variety of sectors and technologies are doing the same [34].
It is common to believe that public data is vulnerable. The primary challenges of using public data were observed to be proprietary formats, a lack of metadata, and messy data [25]. Certainly, ICTs infrastructures equip cities outfitted with a variety of sensors that allow them to respond to problems considerably more quickly than in the past. Smart Cities use different types of sensors to collect and analyse data to improve the quality of life for people. Sensors capture information ranging from rush-hour statistics to crime rates to overall air quality. Installing and maintaining these sensors necessitates a complex and costly infrastructure.
Major urban regions are already grappling with the task of replacing decades-old infrastructures, such as underground wiring, steam pipes, and transit tunnels, as well as installing high-speed internet. As the use of IoT and sensor technology grows, so too does the level of threat to security. Smart cities are spending more funds and resources on security, while technology companies are developing solutions with new built-in processes to combat hacking and cybercrime [25,34].
In Malaysia, cybercrime cases have increased by 82.5 per cent between 18 March and 7 April 2020 (838 cases) when compared to the same period in 2019, with only 459 cases [35]. These incidents include cyberbullying; fraud or unauthorised system access, such as phishing and email scam artists; data breaches and distributed denial of service (DDoS) attack vectors on business owners; and hacking into personal video conferencing chats and harassing attendees during the COVID-19 movement control period [36]. ICT firms have concentrated not just on sensory-based systems, but also on their usefulness to the communities in which they operate, perceiving them as a method to allow connection with inhabitants through cycles of sense, align, seize, and change [37]. Chong et al., (2018) expand the definition of a smart city to one that detects its residents’ needs as well as the ecological factors and the general populace’s concerns about safety; that controls this input and converts it into information using analytics and other databases systems; that matches the data with the goals of the city, such as improving quality of life, growing resident contentment, or adjusting to changes in the environment; and, lastly, that transforms the city itself [37].

2.3. Adoption Model

Currently, smart city services are required and are a vital function of municipalities, and they have become an integral component of social lives. Smart cities are then anticipated to expand these capabilities through greater integration with residents and the community [38,39].
The adoption of, and the behaviours associated with, the introduction of ICT have been assessed and explained by several theoretical models over the past three decades. To assess the effectiveness of a technology, reliable task-technology fit instruments have been developed and validated. TAM was introduced in 1989 [40] and has since been used and empirically tested in a wide range of ICT application areas [41]. Moreover, the TAM is an effective tool for predicting what people are likely to use daily, what behaviour they are likely to engage in, and whether they will accept information systems and technology, based on reasonable action theory (TRA) and planned behaviour theory (TPB). The TAM was originally derived from social psychology. These three models TRA, TPB, and TAM focus on a person’s intention to perform the behaviour [42], but the constructs of these three models are different.
Researchers have increasingly turned to the TAM model to investigate user acceptance of new technologies [43,44]. It is assumed in the basic model that perceived ease of use and usefulness play a mediating role in the association between the external characteristics of a system (external variables) and the usage of that system. It has been established that several reviews have been issued on the use of TAMs encompassing the ICT field as a whole. In 2003, Lee et al. [45] and Legris et al. [44] provided accounts of the first decade of research on TAM and suggestions for the future. Human and social change processes were emphasised, as well as boundaries to be explored. A modification had already been made to the original TAM in the TAM2 version [46] at the time by removing the Attitudes concept and separating the “External variables concept into social influence (subjective norms, voluntariness, and image), cognitive instrumental processes (job relevance, output quality, and demonstrating result demonstrability), and experience.
The TAM has been widely used as a valid and robust model through a statistical meta-analysis conducted in the same year by King and Jun [47]. The TAM2 was expanded in 2008 to include the factors in Perceived Ease of Use (PEOU) (TAM3) [48]. TAM3 is made up of four constructs: PEOU (Perceived Ease of Use), PU (Perceived Usefulness), behaviour intention, and to-use behaviour. TAMs (Technology Acceptance Models) have previously proved to be a reliable tool for identifying the factors that impact technology’s perceived usefulness and ease of use [40].
Jason, H. Sharp also pointed out the difference between volitional and mandatory use environments as well as the relative strengths of perceived usefulness (PU) and perceived ease [49]. Based on eight prominent models (particularly the TAM), Venkatesh et al. developed the unified theory of acceptance and use of technology (UTAUT) [49]. As part of the UTAUT, four core determinants of intentions and usage are identified: performance expectancy, effort expectancy, social influence, and facilitating conditions, as well as four moderators of key relationships: age, gender, experience, and voluntariness [50].
Smart city technologies and infrastructures will be useless if the stakeholder and citizens that are supposed to benefit from them do not make use of them [51]. An individual’s adoption of new technologies has been a major study focus, and numerous theories from sociology and psychology have been applied [6]. Scholars, in particular, use the Technology Acceptance Model (TAM) to better understand how people perceive and embrace new technology [40]. The majority of the research has concentrated on specific technologies and technology-enhanced services for individual users in the context of smart cities. Individual technologies that have been investigated include blockchain technology [52], Cloud IoT [53], IoT-based smart wearable healthcare devices [54], smart home technologies [54], smart energy technology [55], e-governments [56], smartphone applications [57], e-payments [58], intelligent transportation systems [59], driverless vehicles [60], contact tracing apps [61], and IT for public safety.
UTAUT, a theory developed by Venkatesh et al. in (2003), is a well-known theory that may be used in the adoption of e-government services. It has been extensively used to explore information system acceptability and then its use [50]. It is made up of four major adoption determinants: Social Influence (SI), Performance Expectancy (PE), Facilitating Conditions (FC), and Effort Expectancy (EE). Venkatesh later introduced three more determinants; Price Value (PV), Hedonic Motivation (HM), and Habit (HB) to consider consumer behaviour. UTAUT2, the new theory, may now be used to analyse individuals who intend to use a certain system and determine the major criteria determining its adoption and acceptance. UTAUT is based on earlier adoption models, has high reliability and validity, and accounts for up to 70% of the variability in behaviours relating to the acceptance of technology [62,63,64].
As a result, UTAUT2 is a viable theory for investigating the adoption of smart city technology for the following reasons:
  • UTAUT is used successfully to investigate both the uptake of e-government services and the acceptance of information systems [10];
  • UTAUT2 was developed using the earlier adoption models and significant input of knowledge from psychology, sociology, and human behaviour [50];
  • Smart cities are becoming seen as an extension of e-government services due to improved collaboration with citizens and the community [38];
  • UTAUT2 includes some of the constructs mentioned in our interviews while also allowing for the addition of new structures.
Considering all of these reasons, UTAUT2 is highly suited for finding the elements that most influence smart city service acceptance and intention, which will aid municipal authorities and vendors in better planning for deployment and assessment.
The researchers of the present study also asked local officials, staff, and residents about other obstacles that they anticipated in the uptake and development of smart city services. Of the seven determining elements found by UTAUT2, one of which represents the behavioural desire to make use of smart city technology, four additional points of interest were discovered: privacy, security, trust in government, and trust in technology. As a result of these difficulties and the adoption of UTAUT2, the research focused on eight key structures built according to municipal requirements. (Table 1) shows the results of a recent review of government planning for smart cities.

3. Theoretical Framework

The suggested MSCSA model for Kuala Lumpur is made up of eight constructs: Effort Expectancy (EE), Self-Efficacy (SE), Perceived Security (PS), Perceived Privacy (PP), Price Value (PV), Trust in Government (TG), Trust in Technology (TT), and Behavioural Intention (BI). Three of these constructs are drawn from UTAUT2: EE, PV and BI. The other five important constructs were created after a thorough examination of the requirements of the city, consultations with city officials, citizens, and an examination of related works.
To test nine hypotheses, represented in the model by a straight line, all of which led to the anticipated use of smart city services (BI), a model structure was built with partial least squares-Smart-PLS 3 software, see (Figure 3). In Malaysia’s smart city stakeholders’ acceptance model (MSCSA) Conceptual framework, Hypothesis 3* and Hypothesis 8* represent the mediation role of these constructs in the hypotheses that follow.

3.1. Perceived Privacy and Security

While cities begin to be further advanced technologically, residents and strategy makers may perceive their expectations of security and privacy as severely challenged [91,92,93]. In smart cities, app vulnerabilities may pose security and privacy risks to residents. Mobile applications for smart cities may not be used by the public if security and privacy are not perceived. In smart cities, privacy is a key concern. There is a direct connection between privacy and the way local governments and businesses collect and process personal information. Often, community consent is not given and there is no mechanism to exercise it.
Residents of smart cities perceive security, privacy, and trust in technology conceptually, while they will face increasing problems with IoT sensors and analytics [94,95].

3.1.1. Perceived Security

The level to which consumers feel services in smart cities is the secure platform for saving, holding, and exchanging sensitive data is referred to as perceived security (PS). PS and the impact of private information on user acceptance have been studied in the domains of cloud-based storage computing, e-Government, and e-banking and services [96,97,98,99,100]. The use and adoption of smart services are significantly influenced by citizens’ perceptions of security and privacy. Among others, Belanche-Gracia et al. (2015) [73] investigated attitudes towards the continuation of smart cards, user identification, access to local facilities, and basic service payments. Partial Least Square analysis was performed on data collected from 398 individuals living in Spain to assess the effect of security on continuance intentions of the use of smart cards. Privacy did not affect intentions, which is surprising. The limited amount of personal information on the card could be explained by its limited content. Due to this, cardholders did not seem to be concerned about privacy issues associated with smart cards. For smart card services to be useful and worthy of citizens’ use, it is recommended that public managers and smart card developers guarantee card security by taking security into account.
Users of smart city services have been found to favour security and safety [97], information quality and quality of service [98], as well as increasing government intervention [99]. It is unknown if customers of smart city services would suffer any level of a perceived security breach if the advantages of utilising those services were sufficiently high.
Hypothesis 1.
In the implementation of smart city services, PS is related to TT.

3.1.2. Perceived Privacy

As defined by Arpaci et al. (2015), perceived privacy is the degree to which consumers believe that a specific technology is wise and will protect their sensitive data [74]. Privacy is a basic human right in comparison to any other infractions being judged [100]. As a consequence, companies and governments gathering personal data and potentially tracking their behaviour may conjure up images of big brother [101]. According to Cilliers and Flowerday (2015) [102], crowdsourcing systems are perceived as trustworthy when they meet privacy, information security, and confidentially. The study found that the perceived trustworthiness of crowdsourcing systems is positively related to information security, using a survey of 361 participants from South Africa. The perceived trustworthiness and information security of the crowdsourcing process can, therefore, be improved to address the privacy concerns of citizens.
Yeh, (2017) discovered in her study on the acceptance of smart city technology that individuals were prepared to accept and utilise smart city services as long as the services were innovative, the privacy of their information was protected, and high-quality services were provided [103]. The question arises, therefore, whether consumers of smart city services would accept less privacy if the benefits outweighed the disadvantages.
Hypothesis 2.
In the use of smart city services, PP is related to TT.

3.2. Trust in Technology

Both PP and PS heavily influence residents’ confidence in smart city technologies, which indicates how likely they are to use them. Braun et al., (2018) argue that smart city services must address security and privacy concerns during infrastructure modifications to succeed [104]. Any city that seeks to incorporate more technology into its operations, on the other hand, is bound to sound like horror to its citizens, at least to some of them. City leaders may have nightmares as well, given how quickly cyber-attacks can bring a city’s entire information technology operation to a standstill [91].
Based on a user’s evaluation of smart technologies and risks, and a user’s willingness to adopt these technologies for achieving specific goals, then trust can be established in smart cities. Considering that trust may influence the users’ willingness to accept risks and expose themselves to vulnerabilities [105], technology adoption is considered an important factor [106]. It is important to differentiate trustworthy products and services from malicious ones when using smart city services because smart devices involve the use of smart devices [103].
TT has been found to influence customer purchase intent as well as purchase behaviour [69], [86], as well as their inclination to use e-government services [87]. Our pilot study survey and conversations with local officials yielded similar findings, with local politicians, city employees, and residents expressing concerns about how user data will be gathered and then used. At the same time, we discovered that city officials believed that only the newer generation and technology hobbyists were interested in smart cities, which is consistent with Ferraris, Bresciani, and Scotto [99]. There is a severe lack of technical knowledge among many city planners and decision-makers. These findings prompted us to investigate the link between, PP; PS, and, BI; as well as the involvement of the role of TT as a moderator (Figure 3).
Hypothesis 3*.
In the implementation of smart city services, PP and PS interact with BI through TT.
Hypothesis 4.
TT and BI are linked to the deployment of a smart city.

3.3. Self-Efficacy

The interaction between human behaviour and the environment explains human behaviour, as well as the psychological and cognitive variables, each of which acts as a predictor of the others [107]. Bandura’s theory of self-efficacy is one of his contributions to social cognitive theory, based on the notion that “psychological treatments, wherever their form, affect beliefs of personal efficacy” [108], [109]. Rhee et al. [110] suggest that self-efficacy in the ability to protect information and information systems against unauthorised disclosure, modification, loss, and destruction can be referred to as self-efficacy in information security. There are, however, different types of self-efficacy, such as the general self-efficacy of computers and the specific self-efficacy related to the safe and appropriate use of internet transactions [111]. According to Rhee et al., self-efficacy in information security significantly influences the users’ willingness to apply security efforts. E-government adoption is influenced by self-efficacy, according to Sarabdeen et al., [112]. Smart city technologies can be adopted by stakeholders when their self-efficacy is high. In applying this notion to information technology, Venkatesh developed a SE and the user’s relationship conviction in their ability to perform a specific activity [113], a conclusion that has been verified [114]. Furthermore, SE has also been found to influence the users’ adoption of online e-commerce, trust in technology, as well as mobile banking adoption [6,50].
As a result, in smart cities, the inhabitants must believe that these additional services are available to them, even if they are not. Persons with lower socioeconomic levels may have difficulty accessing them [115].
Hypothesis 5.
Smart city services are adopted through SE and BI.

3.4. Effort Expectancy

Performance expectancy is “the degree of easiness associated with the usage of the system”. In other words, effort expectancy is a measure of what users expect from an application. According to Venkatesh et al. (2003), effort expectation is defined as “the degree of easiness associated with the use of the system”. This construct is based on service users’ perceptions of ease of use, which they regarded as more important during the early phases of adoption [50].
Based on the early adoption stage perceptions of ease of use, the construct is built upon the perceptions of service users. Additionally, Alawadhi&Morris, (2008) found that EE played a significant role in the government’s acceptance because city officials frequently expressed concern that further technology (e.g., the application of mobile parking) might overburden residents and prevent them from completing previously straightforward tasks [116].
Hypothesis 6.
EE and BI are associated with smart city services adoption.

3.5. Government Trust and Price Value

As a result of investments in technology, such as IoT devices and artificial intelligence, governments can gather enormous amounts of data about their citizens. The government might be concerned that the ability to track residents would lead to a surveillance state that will outweigh any commitment to the public interest besides privacy and security concerns. Is it conceivable for the government to issue automated citations for situations in which no one was present? What if the vendors turned out to be immoral, exploiting part of or all the data they acquired? These problems highlight the importance of local faith in its administration, notwithstanding differences in priority between the two sides. Furthermore, cities must make the most use of their limited resources. Investment in smart city technologies may impede investment in other operational areas [117].

3.5.1. Trust in Government

Trust in government is described as the public’s appraisal of the government based on their perceptions of the authenticity and ability of government leaders, agencies, and organizations to provide services that meet people’s expectations. Citizens’ trust in the government is their belief in the government’s competency and honesty. Employee trust in an organisation enables people to have positive attitudes and execute positive activities, according to organizational behaviour research. Numerous studies have shown that people’s faith in the government has a favourable influence on their intention to utilise e-government, which is an important predictor of citizens’ e-government adoption [118,119,120]. Citizens who have a higher level of trust in the government are more likely to be involved in public affairs, acquire government information, and care about national concerns.
Together, T.G.; TT is an important consideration in a user’s decision to use an e-government portal website or service [121], [122]. Residents may be wary of IoT devices in government hands, but the government itself often benefits from the efficiencies IoT brings to public security and emergency response. In addition to the costs associated with implementing and maintaining these technologies, IT education and skills development are key issues [123].
Hypothesis 7.
TG is associated with PV in the uptake of services for smart cities.

3.5.2. Price Value

The price value has been added to UTAUT, which Venkatesh et al. (2012) define as a trade-off between a technology’s perceived advantages and its monetary cost [6]. As a result, the UTAUT2 has been applied in a wide range of technology confirmation studies.
People will not adopt and use PV services if their advantages do not equal or exceed their economic costs. In a smart city environment, where residents support the services as taxpayers, residents’ PV of smart city services is undoubtedly an important aspect of their adoption, the challenge is putting a value on it. Various studies have found that customers who have to use a service balance the benefits vs. the expenditures [79], [87], [124], [125]. According to Almuraqab & Jasimuddin, in 2017, perceived cost is one of the factors driving mobile or smart-government adoption [126].
Hypothesis 8*.
In the implementation services of a smart city, PV moderates the interaction between TG and BI.

3.5.3. Behavioural Intention
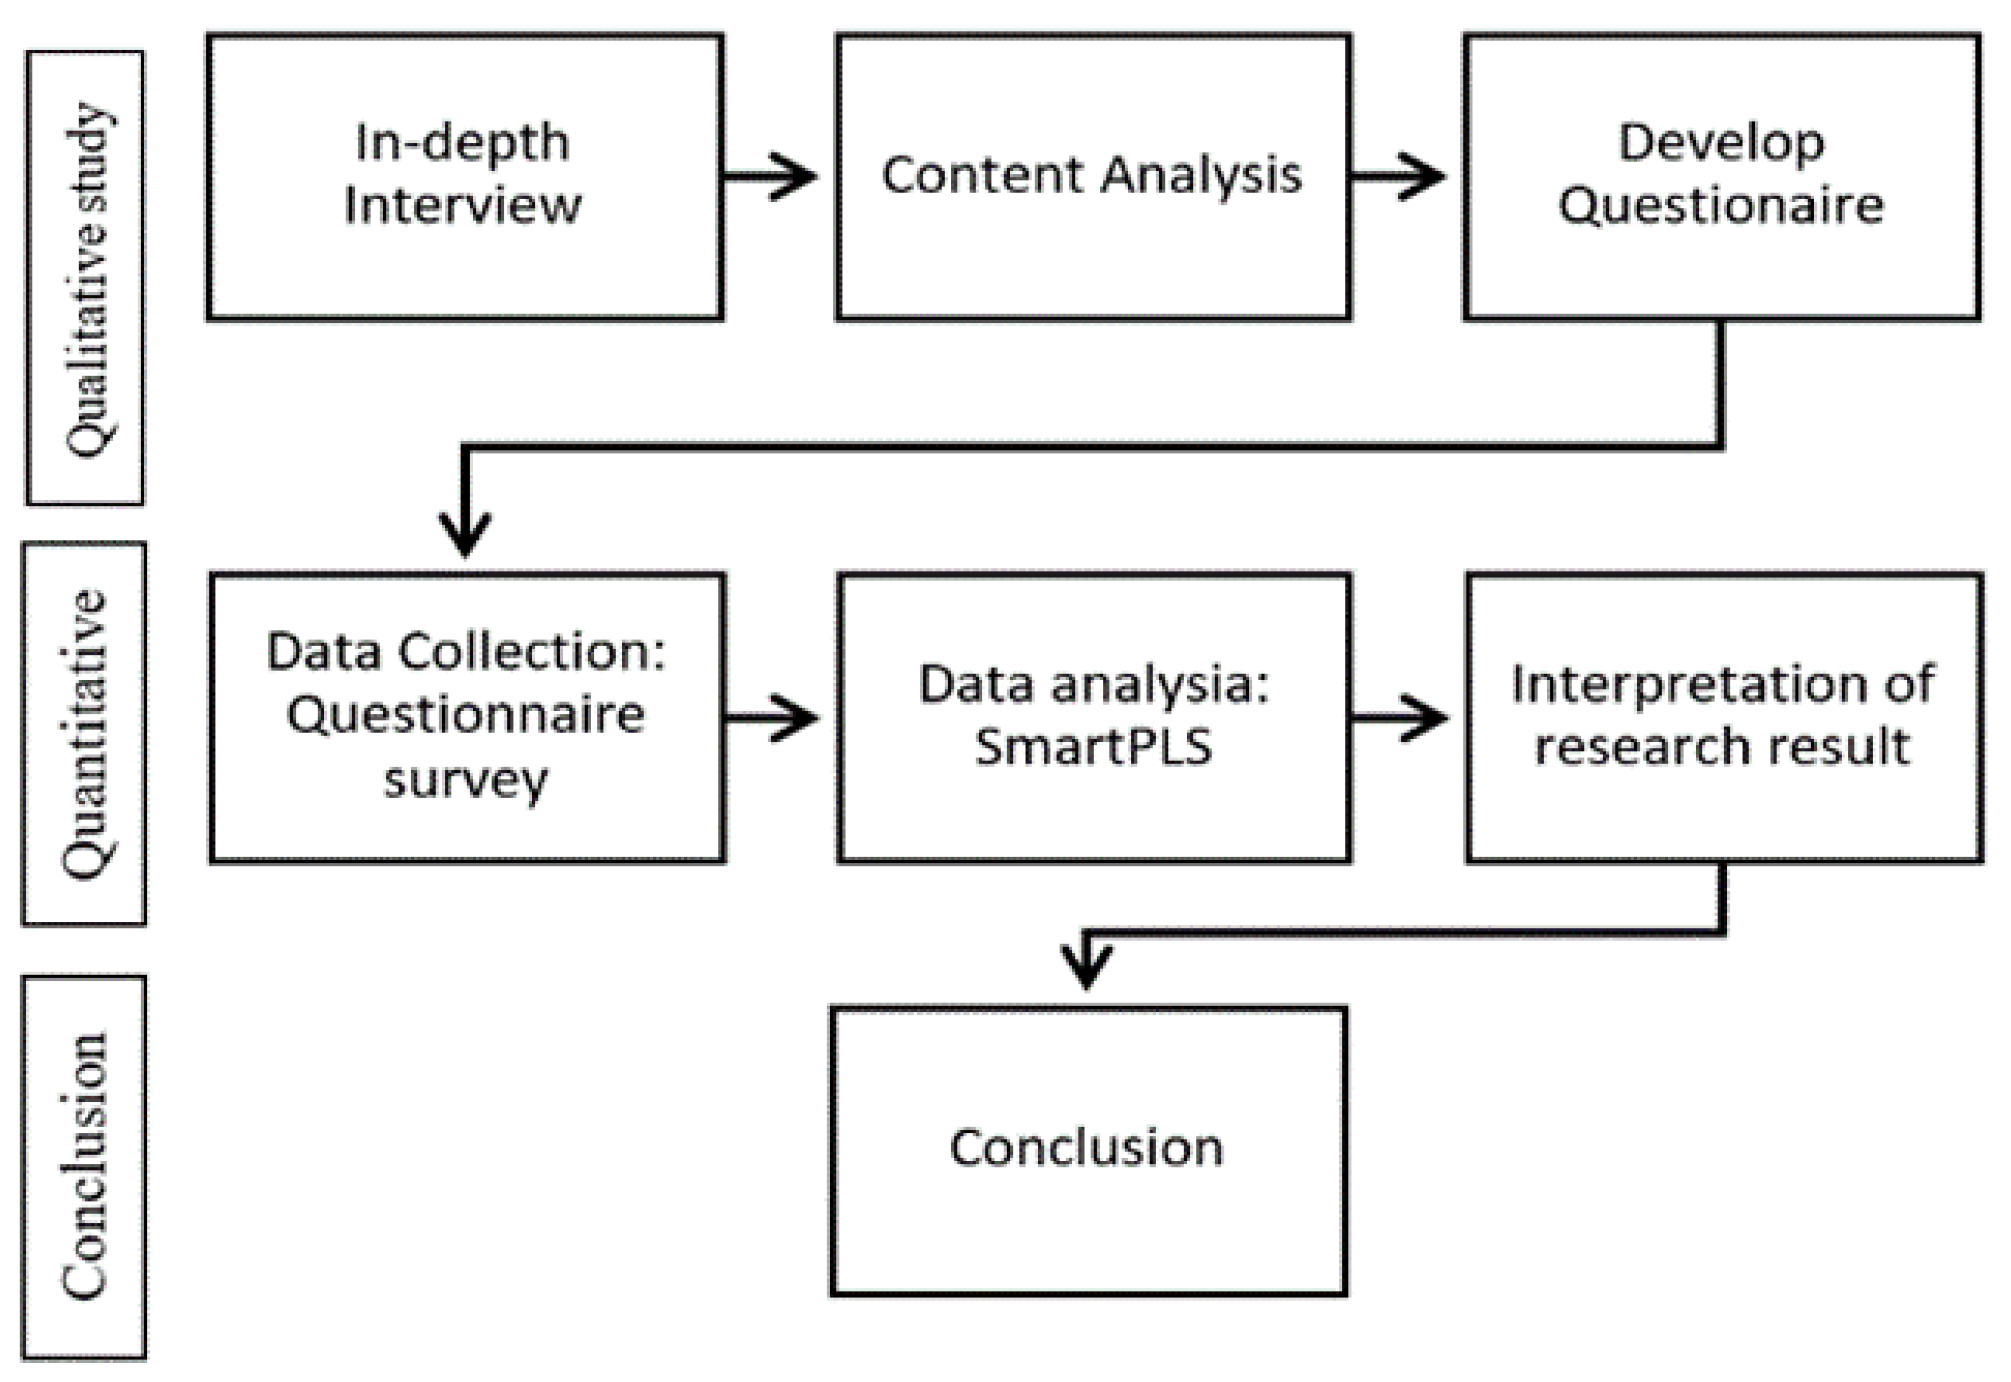
Behavioural intentions evaluate the strength of someone’s intention to undertake a given behaviour. According to Venkatesh, it is the most important determinant of technology adoption and has been regularly used in earlier research on personal acceptance. BI can identify how a user uses technology [6,50,117]. A resident, for example, who declares that they’ll use a smart city application for parking to find a parking space is expressing their purpose for using that technology.
Hypothesis 9.
PV and BI are linked to the implementation of smart city services.

4. Methodology

While a concept of a Smart City is primarily linked to technology, the solutions it accomplishes have the potential to alleviate urban difficulties and contribute to more sustainable and liveable cities. There are various Smart City concepts, actors, and technology, and each city tailors them to their specific needs.

4.1. The Survey, Sampling, and the Participants

We employed the mixed method research approach in double steps: the first step is qualitative research and the second step is quantitative research [127], see Figure 4 for qualitative data collection. As a result of the COVID-19 situation, individual meetings and group meetings all occurred online. Our team had interviews with expert staff in the government sectors: “SMART CITIES UNIT (URPJ), PLANMalaysia, Ministry of Housing and Local Government, and PUTRAJAYA”, and for the private sector, our team had interviews with TMone (“TM One, the business-to-business arm of Telekom Malaysia Berhad (TM), TM concerning the use of Internet of Things for implementation of Smart Services”). An in-depth online interview with 29 expert respondents was conducted for qualitative analysis, while a questionnaire survey of 378 respondents was conducted for quantitative analysis [106]. The interviews involved government officials who serve as department or staff leaders. Purposive sampling was used to select responders who satisfied the given criteria. This study was organised using a sequential exploratory approach.
The approach began with a series of structured open-ended interviews with local officials and staff, from Smart Cities Unit URP3, PLANMalaysia Ministry of Housing & Local Government, Federal Government Administrative Centre, and Putrajaya Malaysia. In the second deep interview with the TM One Company, TM One, the business-to-business arm of Telekom Malaysia Berhad (TM). Under the government’s MyDIGITAL programme, TM One is the sole local Cloud Service Provider (CSP) panel, in the private sector, they also help citizens understand what factors influence smart city services and their underlying issues. Following that, a panel of information professionals from the University of Technology Malaysia, plus several information system professionals, assessed the questionnaire and its theoretical foundations.
The city of Kuala Lumpur was interested in investigating residents’ concerns about potential smart city initiatives. Because of the COVID-19 pandemic, the researchers interviewed city staff online through google meetings to discover common themes that would aid in the development of the survey. Four major themes emerged from the interviews on the use of future city services. The first barrier is the inhabitants’ trust in their capacity to use smart city services or technologies. For example, trust in using services like the implementation of a smart parking solution or a “smart health” mobile service for Covid-19. The second element is residents’ trust in what proportion of work it will take for them to get access to smart city services. The third issue is to trust technology while also being concerned about privacy and security. The fourth issue is increased technology spending, which comes at a time when many local government acts are being scrutinised by residents. A few of these concerns were investigated as part of the UTAUT2 model and its numerous extensions into fields such as e-government. Also, there was concern about survey weariness, and the researchers were instructed to concentrate on the most important themes. The need to address these themes, as well as their importance, meant that it was determined that all UTAUT2 structures were reasonable, but that components that were less relevant to the setting of the current study could be excluded.
The MSCSA “Malaysian Smart City Stakeholders Adoption” model was developed from the UTAUT2 theory, the above-mentioned interviews, and an exhaustive literature search of cognate research. Each of these ideas was then reduced to three or four-item statements to determine the level of agreement among survey participants. In addition, two dichotomies (yes/no) questions of interest to municipal officials were included to measure local knowledge of the concept of smart cities and familiarity (or lack thereof) with Kuala Lumpur’s smart city services. Demographic data (age, gender, and degree of education) were also acquired.

4.2. Data Collection

The research procedure is divided into two stages: qualitative research in the first and quantitative inquiry in the second. Qualitative research depended on focus groups and individual interviews to get answers to unstructured questions (qualitative data). Data analysis in our qualitative approaches is done through summarising, reduction, scoring, and in-depth study of group and individual meetings. Our qualitative data collection methods included group meetings and individual interviews with heads of (GIS, Smart city, Land use, I-plan, and IT) departments, whereas due to COVID-19, all meetings and interviews were conducted online, with video capturing, and side-by-side with individual interviews; this technique is common in the field of qualitative research [128] and is used for analysing interviews in greater detail.
The interview was conducted with 29 expert staff and we used NVivo 12 for qualitative data analysis. The participants replied to semi-structured qualitative questions through online interviews that lasted 45–150 min. The interview’s goal was to determine the meaning and values that were connected with the terms “smart city challenges” “city development” “citizen acceptance for smart technology” “smart city stakeholder acceptance” “smart governance” “smart people” “smart city services” and other smart city dimensions, to investigate how the highlighted attributes may be incorporated into key asset smart city acceptability from stakeholders and citizens, to establish a smart city on the ground.
In the quantitative methods, data collecting used closed-ended questions in surveys, measurements, and collection with distributed questionaries forming hard copies and some online through google forms. Quantitative data analysis involved numerical answers, such as number one for strongly disagree and number five for strongly agree, with 378 participants using the Smart-PLS for quantitative data analysis.
The first phase’s output was used to design some of the questionnaires for the second stage of the study, while the other questionnaire was adapted from UTAUT2 and the reviewed literature, and the finding of the quantitative investigation was utilised to quantify the correlation between the variables and verify the study’s hypothesis. The survey was created on a 5-point scale: “5” means “strongly agree”, agree “4”, “3” means neither agreement nor disagreement, disagree “2”, and strongly disagree “1” [106]. It was utilised to ascertain respondents’ opinions and points of view. Qualitative data was investigated using content analysis, in-depth interviews, online meetings, and questions (see Table 2). All kinds of aspects were decided for each item so that it could be categorised to be a correlation benchmark between structures, to prove the hypothesis.
This method was used to extract all items, indicators, and themes from qualitative data [129]. The data acquired were studied using the SmartPLS structural model analysis, which effectively combines factor analysis and regression analysis to evaluate the variables’ components and amount of correlation. To assess the degree of association, the correlation coefficient was used [130]. The ‘r’ coefficient correlation value is given in Table 3.
A group of random UTM students and UTM staff completed a pre-test. Following this, three academics in UTM with two panels of three city officials evaluated the item statements. Subsequently, a pilot test was randomly distributed to 15 residents of downtown Kuala Lumpur. The questionnaire was distributed through some distinct channels: the city of Kuala Lumpur, Facebook, which targets city employees; the university platform and social media pages; social media accounts belonging to one of our researchers; canvassing the university of UTM, and by placing the survey form in public spaces around the city to facilitate an extra data collection point. To comply with the city policy, the WhatsApp message with the google form link sent to city employees had no incentives. On the other hand, an extra hard-copy form was placed in the UTM-KL Library. Using hard-copy forms in public spaces helped recruit random residents who were not ready to direct reply or do not follow the google form or social media.

4.3. Analysis Methods

SMART PLS 3 has been used to assess the uniqueness of each component (Discriminate and Convergent Validity), the conformity of every construct’s measurement (Through Composite Reliability Evaluation), and to confirm the statistically significant difference in each of the hypotheses’ associations depicted see (Figure 5).

5. Results and Discussion

5.1. Demographics

The second stage of this project started with quantitative research through distributed questionaries that related to the topic. After that, responses were gathered from, university academic staff and students, using questionnaires through Google Forms and hard copy. On the other hand, distributed hard-copy questionnaire forms were in some strategic places for local citizens. Of the 685 responses turned in to the research team, 378 were retained after the removal of those surveys that were only partially completed, and the 378 submitted to the study team were kept. The sample was found to be reflective of the demographics of the residents
A total of 18 per cent of those who responded were under the age of 24 years, 32% were between the ages of 25 and 35, 30.3% were between the ages of 36 and 45, and 16.7% were between the age of 46 and 55, while only 3 per cent were over 56. Furthermore, 56.4 per cent were females, 41.3 per cent were males, and 2.3 per cent did not indicate gender.
The educational levels of the interviewees varied. A high school diploma or less was held by 27.6%, an undergraduate degree by 29.4%, a graduate degree by 38.8%, and a professional certificate by 4.2%. In (Table 4) demonstrates the respondents’ demographic traits.

5.2. Reliability and Validity Measures

SmartPLS 3 was used to assess the reliability with the validity of all eight MSCSA components and associated item explanations. The majority of constructions outperformed the minimal permissible composite reliability value of 0.5, according to Child 2006 [131], indicating a well-defined model [130].

5.2.1. Convergent Validity Assessment

This test was carried out to guarantee that every item statement supplied to the respondents was relevant to the concept under consideration. Respondents (378) tested the model and validated it. Factor loadings were higher for a response (Table 5) than the recognised 0.7 (or 70%) criterion, confirming convergent validity.

5.2.2. Evaluation of Discriminatory Validity

This test was carried out to ensure each concept has a stronger link than any other construct with its related independent variables. It examines the correlations between the constructs to the square root of the extracted average variance (AVE) value for each assertion. In this data, the Fornell–Larcker criterion is met since the AVE’s square root is greater than any of the relationships (Table 6).
All constructs had AVE values of more than 0.5 (or 50%) and were determined to be coherent with the Fornell–Larker criterion, indicating strong cross-factor loading., For more information about AVE and R see (Table 7).

5.3. Testing of Structural Models and Hypotheses

The coefficients of model paths were studied using SMART PLS 3. To obtain the t-test values, a conventional bootstrap error with was used, 500 bootstrap samples were advised. All hypotheses proposed were verified and found to be true in both subsamples, as shown in Table 8. The PLS table excludes hypotheses 3 and 8 about mediation.
MSCSA was subsequently subjected to structural equation modelling (SEM), as seen in Figure 6. R2 denotes the variance percentage of the, BI; TT, and PV construction. The standardised regression coefficient beta (β) indicates the strength of each construct’s link. These findings indicate that the MSCSA model provides statistically significant overall approaches and accounts for more than 40% of the diversity in terms of behavioural desire for using smart city services.

5.4. Discussion

Security Privacy and Trust in Technology: Users of smart city services have been found to value safety and security and to support stronger government security control [97], [99]. According to another survey, citizens were interested in using innovative and privacy-protected smart city services [103]. Hypothesis 1, Hypothesis 2, and Hypothesis 3 are upheld by the directing impact of security and security issues on the relationship between respondents’ belief in smart city technologies and they’re intentions to utilise them. Hypothesis 4 is supported by a related association with strong privacy and security and higher trust.
Such discoveries recommend that people were willing to utilise shrewd city innovation on the off chance that they are guaranteed that their data is secure and their right to security is secured.
Self-efficacy: Hypothesis 5 is supported by a substantial link between behavioural and self-intention. Respondents feel that sensor-based technological solutions and IoT devices that adapt to traffic situations are simple to use and do not differ significantly from what people are used to. Residents’ trust in smart city services and technologies is comparable to earlier research in e-government and online cloud services [132]. According to the findings in these scenarios, locals believe that they are capable of implementing technology akin to smart city services acceptance. Many people are already accustomed to using the internet or internet surveillance cameras, as well as door locks that send signals to their phones to prevent crime. Participants also believe that successful smart services will boost their productivity and quality of life. These findings back up recent research on mobile app uptake, cloud and big data technology use, and e-government approval [133,134].
Effort expectancy: Hypothesis 6 is backed by a significant interface between effort expectancy and behavioural intention. In earlier e-government research, ease of use was a crucial component [116,135]. Similar research cited convenience as a driving factor in the adoption of cloud technologies [74]. Respondents want smart city services to be simple to comprehend and utilise. They are largely concerned with conveniences, such as the ease of finding parking and the advantages of using ‘push’ notifications such as MySejahtera services. They do, however, recognise that these services can save money on infrastructure while also potentially improving quality of life.
These findings demonstrate that residents place a high value on ease of use, and the statistical significance of ease of use underlines the need of developing new services to be simple, intuitive, and convenient. Simultaneously, it highlights how usability can be a deciding factor in whether or not a smart city service is employed.
Price Value and Trust in Government: Hypothesis 7 and Hypothesis 8* are upheld by estimating value having a direct impact on respondents’ trust in government and affinity to use smart city administrations. A substantial link between pricing value and behavioural intention supports Hypothesis 9.
Citizens’ trust in the government is their belief in the government’s competency and honesty. Employee trust in an organisation enables people to have positive attitudes and execute positive activities, according to organisational behaviour research. People’s faith in the government has a favourable influence on their intention to utilise e-government, which is an important predictor of citizens’ e-government adoption. Citizens who have a higher level of trust in government are more likely to be involved in public affairs, acquire government information, and care about national concerns.
Important findings indicated that citizens and city stakeholders believed that the advantages of smart city services will outweigh the costs, which affects their faith in government. They were comparable to previous findings in mobile usage, SMS, and internet use and they have been linked to government trust implications [6,66,125] Citizens wanted to ensure that investments in smart cities did not impede investments in other areas of operation [117]. Trust in the government has been identified as a significant aspect of user adoption of e-government [66,125,126].

6. Conclusions and Recommendations

The purpose of this research is to investigate the factors that influence smart city user adoption. Even though plenty of cities have begun or intend to begin a smart city strategy or project, city leaders desire to ensure that residents are inclined to endorse such an effort and that such an expenditure is feasible to boost their position. The site we chose in Malaysia, as an example, is Kuala Lumpur, with data having been collected based on a representative sample of inhabitants, that is, the people, city official staff, and academic staff.
MSCSA model: Significant connections among the eight characteristics validated the model’s utility in predicting the intention of residents to make use of smart city services.
MSCSA considered many of the factors that a resident would consider important. These findings show that these characteristics should be considered at the very least when designing smart city services such as smart grids, mobile services, smart lights, IoT, and other ICT. We may conclude that all seven factors have a high statistical significance and are good indicators of the desire to utilise smart city services (see Table 9). The results supporting the hypothesis and interpretation are shown as follows:
Hypothesis 1.
Perceived security PS is related to trust in technology TT;
Hypothesis 2.
Perceived privacy PP is correlative with trust in technology TT;
Hypothesis 3*.
The link between perceived (privacy PP and security PS) is moderated by trust in technology, T.T.; respectively, on behavioural intent in the adoption of smart city services;
Hypothesis 4.
Trust in technology TT is associated with behavioural intent BI to use smart city services;
Hypothesis 5.
Self-efficacy SE is associated with behavioural intention BI in the implementation of smart city services;
Hypothesis 6.
Effort Expectancy EE is correlated with Behavioural Intention BI in the smart city services adoption;
Hypothesis 7.
Trust in government TG is correlated with the Price Value PV of smart city services;
Hypothesis 8*.
Price value PV moderates the relationship between trust in government TG and behavioural intention BI;
Hypothesis 9.
Price value PV and behavioural intention BI are correlated.

7. Consequences and Constraints

Theory Implications: Concurring with the MSCSA findings, individuals are most likely to receive shrewd city administrations when other components are taken into consideration. Three factors were found to be particularly significant: faith in technology (which was strongly related to their views on security and privacy), price value, and trust in government. These three were found to play the most important role in the development of a smart city and apply in Malaysia as trust in technology, trust in government, and price value.
Practice Implications: MSCSA contributes moderately to scholarly model research design. More importantly, it extends UTAUT2 by including trust (in technology and government), respectively, and broadening perceived worth to include economic ratios.
The local authority’s arranging and assessment targets are deliberately served by MSCSA. To construct enactment and investment openings around all these advances, starting by distinguishing the advances that are trusted by inhabitants.
Future research recommendations: The MSCSA demonstration ought to be utilised to make smart city administrations, and it may be improved to incorporate more UTAUT2 characteristics. The survey may be tweaked to gauge inhabitants’ cravings for certain savvy city administrations if attempted on a more extensive scale. While there is a covid-19 pandemic in Malaysia cause of data collection. Finally, the reuse of MSCSA will grant the authenticity of its conclusions, both through the case-by-case consideration of persons and cities or more broadly over a variety of urban circumstances.

Author Contributions

Conceptualisation, methodology, interviews and data curation, Q.H.H. and, N.M.J.; software, validation, formal analysis, investigation, resources, and writing original draft preparation, Q.H.H.; visualization, project administration, Q.H.H., U.U. and, N.M.J. All authors have read and agreed to the published version of the manuscript.

Funding

This research received no external funding.

Institutional Review Board Statement

Not applicable.

Informed Consent Statement

Not applicable.

Data Availability Statement

Not applicable.

Acknowledgments

I wish to express my sincere gratitude to PLAN-Malaysia, the Ministry of Housing and Local Government, Smart Cities department in Urban Planner at PLANMalaysia, Federal Territory of Kuala Lumpur. Secondly; the TMone company; the Head of the Product & Innovation department, Assistant General Manager and head of the smart department. Thirdly, all University Technology Malaysia (UTM) staff (UTM-KL and UTM-JB); and fourth and Last my sincere gratitude to all who support our research and they have replayed and answered all the questions very trustingly.

Conflicts of Interest

The authors declare no conflict of interest.

References

  1. Commu, C. 5 Reasons Why Cyberjaya is Malaysia’ s Real Smart City. 2018. Available online: https://www.cyberjayacity.com/5-reasons-cyberjaya-malaysia-smart-city/ (accessed on 31 August 2022).
  2. DBKL. Kuala Lumpur Smart City Blue Print 2021–2025—Portal Rasmi Dewan Bandaraya Kuala Lumpur. 2022. Available online: https://www.dbkl.gov.my/kuala-lumpur-smart-city-blue-print-2021-2025-2/ (accessed on 31 August 2022).
  3. Veza, I.; Abas, M.A.; Djamari, D.W.; Tamaldin, N.; Endrasari, F.; Budiman, B.A.; Idris, M.; Opia, A.C.; Juangsa, F.B.; Aziz, M. Electric Vehicles in Malaysia and Indonesia: Opportunities and Challenges. Energies 2022, 15, 2564. [Google Scholar] [CrossRef]
  4. TMOne. Experience Centre—TM ONE Digital Transformation Solutions. TM One. 2019. Available online: https://www.tmone.com.my/experience-centre (accessed on 31 August 2022).
  5. Thomas, V.; Wang, D.; Mullagh, L.; Dunn, N. Where’s wally? In search of citizen perspectives on the smart city. Sustainability 2016, 8, 207. [Google Scholar] [CrossRef] [Green Version]
  6. Venkatesh, V.; James, Y.L.; Thong, X.X.; Venkatesh, V.; Thong, J.Y.L.; Xu, X. Consumer acceptance and use of information technology: Extending the unified theory of acceptance and use of technology. MIS Q. Manag. Inf. Syst. 2012, 36, 157–178. [Google Scholar] [CrossRef] [Green Version]
  7. Afonso, C.M.; Roldán Salgueiro, J.L.; Sánchez Franco, M.J.; González, M.d.l.O. The Moderator Role of Gender in the Unified Theory of Acceptance and Use of Technology (UTAUT): A Study on Users of Electronic Document Management Systems. In Proceedings of the International Conference on Partial Least Squares and Related Methods, Houston, TX, USA, 19–22 May 2012. [Google Scholar]
  8. Brown, S.A.; Venkatesh, V. Model of adoption of technology in households: A baseline model test and extension incorporating household life cycle. MIS Q. Manag. Inf. Syst. 2005, 29, 399–426. [Google Scholar] [CrossRef]
  9. Carter, L. E-government diffusion: A comparison of adoption constructs. Transform. Gov. People Process Policy 2008, 2, 147–161. [Google Scholar] [CrossRef] [Green Version]
  10. Dwivedi, Y.K.; Rana, N.P.; Jeyaraj, A.; Clement, M.; Williams, M.D. Re-examining the Unified Theory of Acceptance and Use of Technology (UTAUT): Towards a Revised Theoretical Model. Inf. Syst. Front. 2019, 21, 719–734. [Google Scholar] [CrossRef] [Green Version]
  11. Baker, J.L.; Lee, M. Achieving a System of Competitive Cities in Malaysia: Main Report. 2015. Available online: http://documents.worldbank.org/curated/en/709061475743434007/Main-report (accessed on 21 July 2022).
  12. Yau, K.L.A.; Lau, S.L.; Chua, H.N.; Ling, M.H.; Iranmanesh, V.; Kwan, S.C.C. Greater Kuala Lumpur as a Smart City: A Case Study on Technology Opportunities. In Proceedings of the 2016 8th International Conference on Knowledge and Smart Technology (KST), Chiang Mai, Thailand, 3–6 February 2016. [Google Scholar] [CrossRef]
  13. KPKT. Smart City Handbook; Ministry of Housing and Local Government:2020; Published June 2021 by Department for International Trade; p. 196. Available online: https://www.kpkt.gov.my/kpkt/resources/user_1/GALERI/PDF_PENERBITAN/FRAMEWORK/Malaysia_Smart_City_Handbook_21062021_Final.pdf (accessed on 17 July 2022).
  14. Streitz, N. Citizen-Centered Design for Human and Sociable Hybrid Cities. Available online: https://www.academia.edu/23934922/Citizen_Centred_Design_for_Humane_and_Sociable_Hybrid_Cities?from=cover_page (accessed on 17 July 2022).
  15. Lim, Y.; Edelenbos, J.; Gianoli, A. Identifying the results of smart city development: Findings from systematic literature review. Cities 2019, 95, 102397. [Google Scholar] [CrossRef]
  16. Ismagilova, E.; Hughes, L.; Dwivedi, Y.K.; Raman, K.R. Smart cities: Advances in research—An information systems perspective. Int. J. Inf. Manag. 2019, 47, 88–100. [Google Scholar] [CrossRef]
  17. Li, C.; Dai, Z.; Liu, X.; Sun, W. Evaluation system: Evaluation of smart city shareable framework and its applications in China. Sustainability 2020, 12, 2957. [Google Scholar] [CrossRef]
  18. Mora, L.; Bolici, R.; Deakin, M. The First Two Decades of Smart-City Research: A Bibliometric Analysis. J. Urban Technol. 2017, 24, 3–27. [Google Scholar] [CrossRef]
  19. Angelidou, M. Strategic Planning for the Development of Smart Cities. 2015. Available online: https://ikee.lib.auth.gr/record/268771/files/GRI-2015-14562.pdf (accessed on 17 July 2022).
  20. Giffinger, R.; Haindlmaier, G.; Kramar, H. The role of rankings in growing city competition. Urban Res. Pract. 2010, 3, 299–312. [Google Scholar] [CrossRef]
  21. Chourabi, H.; Nam, T.; Walker, S.; Gil-Garcia, J.R.; Mellouli, S.; Nahon, K.; Pardo, T.A.; Scholl, H.J. Understanding smart cities: An integrative framework. In Proceedings of the 2012 45th Hawaii International Conference on System Sciences, Maui, HI, USA, 4–7 January 2014; pp. 2289–2297. [Google Scholar] [CrossRef]
  22. Shladover, S.E. Connected and automated vehicle systems: Introduction and overview. J. Intell. Transp. Syst. Technol. Plan. Oper. 2018, 22, 190–200. [Google Scholar] [CrossRef]
  23. Komninos, N. Intelligent cities: Towards interactive and global innovation environments. Int. J. Innov. Reg. Dev. 2009, 1, 337. [Google Scholar] [CrossRef]
  24. HamaMurad, Q.H.; Mat Jusoh, N.; Ujang, U. Smart City Framework Reconcile. Open Int. J. Inform. 2021, 9, 60–67. [Google Scholar]
  25. Young, M.; Yan, A. Civic Hackers’ user experiences and expectations of Seattle’s open municipal data program. In Proceedings of the Hawaii International Conference on System Sciences 2017, Waikoloa Village, HI, USA, 4–7 January 2017; pp. 2681–2690. [Google Scholar] [CrossRef] [Green Version]
  26. Belli, L.; Cilfone, A.; Davoli, L.; Ferrari, G.; Adorni, P.; di Nocera, F.; Dall’Olio, A.; Pellegrini, C.; Mordacci, M.; Bertolotti, E. IoT-enabled smart sustainable cities: Challenges and approaches. Smart Cities 2020, 3, 1039–1071. [Google Scholar] [CrossRef]
  27. Mohanty, S.P.; Choppali, U.; Kougianos, E. Everything you wanted to know about smart cities. IEEE Consum. Electron. Mag. 2016, 5, 60–70. [Google Scholar] [CrossRef]
  28. Salin, A.S.A.P.; Abidin, Z.Z. ICT Initiatives of the Local Authority of a Smart City in Malaysia. Soc. Econ. Dev. 2011, 10, 358–362. Available online: https://www.researchgate.net/publication/272831519 (accessed on 28 July 2021).
  29. Cavada, M.; Rogers, C.; Hunt, D. Smart Cities: Contradicting Definitions and Unclear Measures. In Proceedings of the 4th World Sustainability Forum, Basel, Switzerland, 1–30 November 2014. [Google Scholar] [CrossRef]
  30. The Malaysia Plan. Available online: https://www.pmo.gov.my/the-malaysia-plan/ (accessed on 31 August 2022).
  31. MyICMS 886: Digital Opportunities for Development. Available online: https://www.mcmc.gov.my/skmmgovmy/files/72/72925ea5-18d4-4b75-899e-266e8a19edd2/files/assets/basic-html/page-1.html (accessed on 31 August 2022).
  32. About | Iskandar Malaysia Smart City. Available online: https://iskandarmalaysia.com.my/SCIM/about.html (accessed on 31 August 2022).
  33. MyGOV. Malaysia Smart City Framework (MSCF). Available online: https://www.malaysia.gov.my/portal/content/30947 (accessed on 25 July 2022).
  34. Portmann, E. Rezension “Smart Cities: Big Data, Civic Hackers, and the Quest for a New Utopia”. HMD Prax Wirtschaftsinformatik. 2015, 52, 636–637. [Google Scholar] [CrossRef]
  35. Cybersecurity is Top Concern, as Online Threats Mount in Malaysia by 82.5%. Available online: https://techwireasia.com/2020/04/cybersecurity-is-top-concern-as-online-threats-mount-in-malaysia-by-82-5/ (accessed on 28 August 2022).
  36. Lim, S.B.; Malek, J.A.; Yussoff, M.F.Y.M.; Yigitcanlar, T. Understanding and acceptance of smart city policies: Practitioners’ perspectives on the malaysian smart city framework. Sustainability 2021, 13, 9559. [Google Scholar] [CrossRef]
  37. Chong, M.; Habib, A.; Evangelopoulos, N.; Park, H.W. Dynamic capabilities of a smart city: An innovative approach to discovering urban problems and solutions. Gov. Inf. Q. 2018, 35, 682–692. [Google Scholar] [CrossRef]
  38. Hollands, R.G. Will the real smart city please stand up? Intelligent, progressive or entrepreneurial? City 2008, 12, 303–320. [Google Scholar] [CrossRef]
  39. AlAwadhi, S.; Scholl, H.J. Aspirations and Realizations: The Smart City of Seattle. In Proceedings of the 2013 46th Hawaii International Conference on System Sciences, Wailea, HI, USA, 7–10 January 2013; pp. 1695–1703. [Google Scholar] [CrossRef]
  40. Davis, F.D. Perceived usefulness, perceived ease of use, and user acceptance of information technology. MIS Q. Manag. Inf. Syst. 1989, 13, 319–339. [Google Scholar] [CrossRef] [Green Version]
  41. Scherer, R.; Siddiq, F.; Tondeur, J. The technology acceptance model (TAM): A meta-analytic structural equation modeling approach to explaining teachers’ adoption of digital technology in education. Comput. Educ. 2019, 128, 13–35. [Google Scholar] [CrossRef]
  42. Hale, J.L.; Householder, B.J.; Greene, K.L. The Theory of Reasoned Action. Persuas. Handb. Dev. Theory Pract. 2012, 14, 259–286. [Google Scholar] [CrossRef]
  43. Fayad, R.; Paper, D. The Technology Acceptance Model E-Commerce Extension: A Conceptual Framework. Procedia Econ. Financ. 2015, 26, 1000–1006. [Google Scholar] [CrossRef] [Green Version]
  44. Legris, P.; Ingham, J.; Collerette, P. Why do people use information technology? A critical review of the technology acceptance model. Inf. Manag. 2003, 40, 191–204. [Google Scholar] [CrossRef]
  45. Lee, Y.; Kozar, K.A.; Larsen, K.R.T. The Technology Acceptance Model: Past, Present, and Future. Commun. Assoc. Inf. Syst. 2003, 12, 50. [Google Scholar] [CrossRef]
  46. Venkatesh, V.; Davis, F.D. Theoretical extension of the Technology Acceptance Model: Four longitudinal field studies. Manag. Sci. 2000, 46, 186–204. [Google Scholar] [CrossRef] [Green Version]
  47. King, W.R.; He, J. A meta-analysis of the technology acceptance model. Inf. Manag. 2006, 43, 740–755. [Google Scholar] [CrossRef]
  48. Venkatesh, V.; Bala, H. Technology acceptance model 3 and a research agenda on interventions. Decis. Sci. 2008, 39, 273–315. [Google Scholar] [CrossRef] [Green Version]
  49. Sharp, J.H. Development, Extension, and Application: A Review of the Technology Acceptance Model. Inf. Syst. Educ. J. 2007, 5, 1–11. [Google Scholar]
  50. Venkatesh, V.; Morris, M.G.; Davis, G.B.; Davis, F.D. User Acceptance of Information Technology: Toward a Unified View. MIS Q. Manag. Inf. Syst. 2003, 27, 425–478. [Google Scholar] [CrossRef] [Green Version]
  51. Capdevila, I.; Zarlenga, M. Smart city or smart citizens. J. Strateg. Manag. 2015, 8, 266–282. [Google Scholar] [CrossRef]
  52. Lou, T.F.; Li, E.Y. Integrating innovation diffusion theory and the technology acceptance model: The adoption of blockchain technology from business managers’ perspective. In Proceedings of the 17th International Conference on Electronic Business ICEB, Dubai, UAE, 4–8 December 2017; pp. 293–296. [Google Scholar]
  53. Narwane, V.S.; Narkhede, B.E.; Raut, R.D.; Gardas, B.B.; Priyadarshinee, P.; Kavre, M.S. To identify the determinants of the CloudIoT technologies adoption in the Indian MSMEs: Structural equation modelling approach. Int. J. Bus. Inf. Syst. 2019, 31, 322–353. [Google Scholar] [CrossRef]
  54. Mital, M.; Chang, V.; Choudhary, P.; Papa, A.; Pani, A.K. Adoption of Internet of Things in India: A test of competing models using a structured equation modeling approach. Technol. Forecast. Soc. Chang. 2018, 136, 339–346. [Google Scholar] [CrossRef]
  55. Gimpel, H.; Graf, V.; Graf-Drasch, V. A comprehensive model for individuals’ acceptance of smart energy technology—A meta-analysis. Energy Policy 2020, 138, 111196. [Google Scholar] [CrossRef]
  56. Chukwu, J.; Conrad, M.; Crosbie, T. Empirical investigation of factors that impact e-government adoption in Nigeria. In Multi Conference on Computer Science and Information Systems, MCCSIS 2019—Proceedings of the International Conferences on ICT, Society and Human Beings 2019, Connected Smart Cities 2019 and Web Based Communities and Social Media 2019; IADIS: Lisbon, Portugal, 2019; pp. 153–160. [Google Scholar] [CrossRef] [Green Version]
  57. Hou, J.; Arpan, L.; Wu, Y.; Feiock, R.; Ozguven, E.; Arghandeh, R. The road toward smart cities: A study of citizens’ acceptance of mobile applications for city services. Energies 2020, 13, 2496. [Google Scholar] [CrossRef]
  58. Gede Adi Surya Atmajaya, I.; Handayani, P.W.; Pinem, A.A.; Azzahro, F. The analysis of user’s intention in using mobile payment: A case of Yap! In Multi Conference on Computer Science and Information Systems, MCCSIS 2019—Proceedings of the International Conferences on ICT, Soc Hum Beings 2019, Connect Smart Cities 2019 Web Based Communities Soc Media 2019; IADIS: Lisbon, Portugal, 2019; pp. 127–134. [Google Scholar] [CrossRef] [Green Version]
  59. Ahmed, W.; Hizam, S.M.; Sentosa, I.; Akter, H.; Yafi, E.; Ali, J. Predicting IoT service adoption towards smart mobility in Malaysia: SEM-neural hybrid pilot study. Int. J. Adv. Comput. Sci. Appl. 2020, 11, 524–535. [Google Scholar] [CrossRef] [Green Version]
  60. Manfreda, A.; Ljubi, K.; Groznik, A. Autonomous vehicles in the smart city era: An empirical study of adoption factors important for millennials. Int. J. Inf. Manag. 2021, 58, 102050. [Google Scholar] [CrossRef]
  61. Cruz, M.M.; Oliveira, R.S.; Beltrão, A.P.; Lopes, P.H.; Viterbo, J.; Trevisan, D.G.; Bernardini, F. Assessing the level of acceptance of a crowdsourcing solution to monitor infectious diseases propagation. In Proceedings of the 2020 IEEE Int Smart Cities Conference ISC2 2020, Piscataway, NJ, USA, 28 September–1 October 2020. [Google Scholar] [CrossRef]
  62. Abu, F.; Jabar, J.; Yunus, A.R. Modified of UTAUT Theory in Adoption of Technology for Malaysia Small Medium Enterprises (SMEs) in Food Industry. Aust. J. Basic Appl. Sci. 2015, 9, 104–109. [Google Scholar]
  63. Kupfer, A.; Schöb, S.; Ableitner, L.; Tiefenbeck, V. Technology adoption vs. continuous usage intention: Do decision criteria change when using a technology? In Proceedings of the AMCIS 2016 Surfing IT Innovation Wave—22nd Americas Conference on Information Systems, San Diego, CA, USA, 11–14 August 2016; pp. 1–10. [Google Scholar]
  64. Onaolapo, S.; Oyewole, O. Performance Expectancy, Effort Expectancy, and Facilitating Conditions as Factors Influencing Smart Phones Use for Mobile Learning by Postgraduate Students of the University of Ibadan, Nigeria. Interdiscip. J. e-Skills Lifelong Learn. 2018, 14, 95–115. [Google Scholar] [CrossRef] [Green Version]
  65. Gangwar, H.; Date, H.; Ramaswamy, R. Developing a Cloud-Computing Adoption Framework. Glob. Bus. Rev. 2015, 16, 632–651. [Google Scholar] [CrossRef]
  66. Popova, Y.; Zagulova, D. Aspects of E-Scooter Sharing in the Smart City. Informatics 2022, 9, 36. [Google Scholar] [CrossRef]
  67. Tamilmani, K.; Rana, N.P.; Dwivedi, Y.K.; Sahu, G.P.; Roderick, S. Exploring the role of “price value” for understanding consumer adoption of technology: A review and meta-analysis of UTAUT2 based empirical studies. In Proceedings of the 22nd Pacific Asia Conference on Information Systems PACIS 2018, Yokohama, Japan, 26–30 June 2018. [Google Scholar]
  68. Hassan, I.B.; Murad, M.A.A.; El-Shekeil, I.; Liu, J. Extending the UTAUT2 Model with a Privacy Calculus Model to Enhance the Adoption of a Health Information Application in Malaysia. Informatics 2022, 9, 31. [Google Scholar] [CrossRef]
  69. Habib, A.; Alsmadi, D.; Prybutok, V.R. Factors that determine residents’ acceptance of smart city technologies. Behav. Inf. Technol. 2020, 39, 610–623. [Google Scholar] [CrossRef]
  70. Jahankhani, H.; Carlile, A.; Emm, D.; Hosseinian-Far, A.; Brown, G.; Sexton, G.; Jamal, A. Global Security, Safety and Sustainability—The Security Challenges of the Connected World. Commun. Comput. Inf. Sci. 2016, 2, 305–320. [Google Scholar] [CrossRef]
  71. Lee, I.; Choi, B.; Kim, J.; Hong, S.J. Culture-technology fit: Effects of cultural characteristics on the post-adoption beliefs of mobile internet users. Int. J. Electron. Commer. 2007, 11, 11–51. [Google Scholar] [CrossRef]
  72. Mohamad, S.A.; Kassim, S. Examining the Relationship between UTAUT Construct, Technology Awareness, Financial Cost and E-Payment Adoption among Microfinance Clients in Malaysia. Adv. Soc. Sci. Educ. Humanit. Res. 2019, 292, 351–357. [Google Scholar] [CrossRef]
  73. Belanche-Gracia, D.; Casaló-Ariño, L.V.; Pérez-Rueda, A. Determinants of multi-service smartcard success for smart cities development: A study based on citizens’ privacy and security perceptions. Gov. Inf. Q. 2015, 32, 154–163. [Google Scholar] [CrossRef]
  74. Arpaci, I.; Kilicer, K.; Bardakci, S. Effects of security and privacy concerns on educational use of cloud services. Comput. Hum. Behav. 2015, 45, 93–98. [Google Scholar] [CrossRef]
  75. Ahad, M.A.; Paiva, S.; Tripathi, G.; Feroz, N. Enabling technologies and sustainable smart cities. Sustain. Cities Soc. 2020, 61, 102301. [Google Scholar] [CrossRef]
  76. Okumus, B.; Bilgihan, A. Proposing a model to test smartphone users’ intention to use smart applications when ordering food in restaurants. J. Hosp. Tour. Technol. 2014, 5, 31–49. [Google Scholar] [CrossRef]
  77. Shiau, W.L.; Chau, P.Y.K. Understanding behavioral intention to use a cloud computing classroom: A multiple model comparison approach. Inf. Manag. 2016, 53, 355–365. [Google Scholar] [CrossRef]
  78. Alalwan, A.A.; Dwivedi, Y.K.; Rana, N.P.; Simintiras, A.C. Jordanian consumers’ adoption of telebanking: Influence of perceived usefulness, trust and self-efficacy. Int. J. Bank Mark. 2016, 34, 690–709. [Google Scholar] [CrossRef]
  79. Yarlikaş, S.; Arpaci, I.; Afacan, G. User acceptance of egovernment services: Analysis of users’ satisfaction level based on technology acceptance model. In Public Affairs and Administration: Concepts, Methodologies, Tools, and Applications; IGI Global: Hershey, PA, USA, 2015; pp. 1684–1697. [Google Scholar] [CrossRef] [Green Version]
  80. Alalwan, A.A.; Dwivedi, Y.K.; Rana, N.P.; Lal, B.; Williams, M.D. Consumer adoption of Internet banking in Jordan: Examining the role of hedonic motivation, habit, self-efficacy and trust. J. Financ. Serv. Mark. 2015, 20, 145–157. [Google Scholar] [CrossRef] [Green Version]
  81. Arpaci, I.; Yardimci Cetin, Y.; Turetken, O. Impact of Perceived Security on Organizational Adoption of Smartphones. Cyberpsychology Behav. Soc. Netw. 2015, 18, 602–608. [Google Scholar] [CrossRef]
  82. Williams, M.D.; Rana, N.P.; Dwivedi, Y.K. The unified theory of acceptance and use of technology (UTAUT): A literature review. J. Enterp. Inf. Manag. 2015, 28, 443–448. [Google Scholar] [CrossRef] [Green Version]
  83. Kozel, E.; Dečman, M. The Impact of Trust in Government—Young Voters’ Behavioral Intention to Use I-voting in Slovenia. NISPAcee J. Public Adm. Policy 2022, 15, 61–87. [Google Scholar] [CrossRef]
  84. Al nidawy, B.Q.; Sidek, S.; Al-shami, S.A.; Elzamly, A. I-TOE- The New Conceptual Framework that Deconstructing Concept of Trust in E-Government that Affects Usage of E-Government. Int. J. Adv. Sci. Tech. 2019, 128, 59–74. [Google Scholar] [CrossRef]
  85. Zeebaree, M.; Agoyi, M.; Aqel, M. Sustainable Adoption of E-Government from the UTAUT Perspective. Sustainability 2022, 14, 5370. [Google Scholar] [CrossRef]
  86. AlHadid, I.; Abu-Taieh, E.; Alkhawaldeh, R.S.; Khwaldeh, S.; Masa’deh, R.; Kaabneh, K.; Alrowwad, A. Predictors for E-Government Adoption of SANAD App Services Integrating UTAUT, TPB, TAM, Trust, and Perceived Risk. Int. J. Environ. Res. Public Health 2022, 19, 8281. [Google Scholar] [CrossRef] [PubMed]
  87. Ozkan, S.; Kanat, I.E. E-Government adoption model based on theory of planned behavior: Empirical validation. Gov. Inf. Q. 2011, 28, 503–513. [Google Scholar] [CrossRef]
  88. Elmaghraby, A.S.; Losavio, M.M. Cyber security challenges in smart cities: Safety, security and privacy. J. Adv. Res. 2014, 5, 491–497. [Google Scholar] [CrossRef] [PubMed] [Green Version]
  89. Chen, D.; Zhao, H. Data security and privacy protection issues in cloud computing. In Proceedings of the 2012 International Conference on Computer Science and Electronics Engineering ICCSEE 2012, Hangzhou, China, 23–25 March 2012; pp. 647–651. [Google Scholar] [CrossRef]
  90. Harmon, R.R.; Castro-Leon, E.G.; Bhide, S. Smart cities and the Internet of Things. In Proceedings of the Portland International Conference on Management of Engineering and Technology, Portland, OR, USA, 2–6 August 2015; pp. 485–494. [Google Scholar] [CrossRef]
  91. Ma, C. Smart city and cyber-security; technologies used, leading challenges and future recommendations. Energy Rep. 2021, 7, 7999–8012. [Google Scholar] [CrossRef]
  92. Suki, N.M.; Ramayah, T. User acceptance of the e-Government services in Malaysia: Structural Equation Modelling approach. Interdiscip. J. Inform. Knowl. Manag. 2010, 5, 395–413. [Google Scholar] [CrossRef] [Green Version]
  93. Amron, M.T.; Ibrahim, R.; Bakar, N.A.A.; Chuprat, S. Acceptance of cloud computing in the Malaysian public sector: A proposed model. Int. J. Eng. Bus. Manag. 2019, 11, 1–9. [Google Scholar] [CrossRef] [Green Version]
  94. Bhuasiri, W.; Zo, H.; Lee, H.; Ciganek, A.P. User Acceptance of e-government Services: Examining an e-tax Filing and Payment System in Thailand. Inf. Technol. Dev. 2016, 22, 672–695. [Google Scholar] [CrossRef]
  95. Salimon, M.G.; Yusoff, R.Z.; Sanuri, S.; Mokhtar, M. The Impact of Perceived Security on E-Trust, E-Satisfaction and Adoption of Electronic Banking in Nigeria: A Conceptual Review. IOSR J. Bus. Manag. 2015, 17, 2319–7668. [Google Scholar] [CrossRef]
  96. Mohammed, F.; Ibrahim, O.; Nilashi, M.; Alzurqa, E. Cloud computing adoption model for e-government implementation. Inf. Dev. 2017, 33, 303–323. [Google Scholar] [CrossRef]
  97. Schumann, L.; Stock, W.G. The Information Service Evaluation (ISE) model. Webology 2014, 11, 1–20. [Google Scholar]
  98. Chatterjee, S.; Kar, A.K.; Gupta, M.P. Success of IoT in Smart Cities of India: An empirical analysis. Gov. Inf. Q. 2018, 35, 349–361. [Google Scholar] [CrossRef]
  99. van Zoonen, L. Privacy concerns in smart cities. Gov. Inf. Q. 2016, 33, 472–480. [Google Scholar] [CrossRef] [Green Version]
  100. Pearson, S. Taking account of privacy when designing cloud computing services. In Proceedings of the 2009 ICSE Workshop on Software Engineering Challenges of Cloud Computing CLOUD 2009, Vancouver, BC, Canada, 23 May 2009; pp. 44–52. [Google Scholar] [CrossRef]
  101. Manyika, J.; Chui, M.; Brown, B.; Bughin, J.; Dobbs, R.; Roxburgh, C.; Hung Byers, A. Big data: The next frontier for innovation, competition and productivity. McKinsey Global Institute. 2011. Available online: https://bigdatawg.nist.gov/pdf/MGI_big_data_full_report.pdf (accessed on 30 July 2022).
  102. Cilliers, L.; Flowerday, S. The relationship between privacy, information security and the trustworthiness of a crowdsourcing system in a smart city. In Proceedings of the International Symposium on Human Aspects of Information Security & Assurance HAISA 2015, Lesvos, Greece, 1–3 July 2015; pp. 243–255. [Google Scholar]
  103. Yeh, H. The effects of successful ICT-based smart city services: From citizens’ perspectives. Gov. Inf. Q. 2017, 34, 556–565. [Google Scholar] [CrossRef]
  104. Braun, T.; Fung, B.C.M.M.; Iqbal, F.; Shah, B. Security and privacy challenges in smart cities. Sustain. Cities Soc. 2018, 39, 499–507. [Google Scholar] [CrossRef]
  105. Lin, Z.; Dong, L. Clarifying Trust in Social Internet of Things. IEEE Trans. Knowl. Data Eng. 2018, 30, 234–248. [Google Scholar] [CrossRef] [Green Version]
  106. Vinet, L.; Zhedanov, A. A “missing” family of classical orthogonal polynomials. J. Phys. A Math. Theor. 2011, 44, 1–5. [Google Scholar] [CrossRef]
  107. Yi, M.Y.; Jackson, J.D.; Park, J.S.; Probst, J.C. Understanding information technology acceptance by individual professionals: Toward an integrative view. Inf. Manag. 2006, 43, 350–363. [Google Scholar] [CrossRef]
  108. Bandura, A. Self-efficacy mechanism in human agency. Am. Psychol. 1982, 37, 122–147. [Google Scholar] [CrossRef]
  109. Bandura, A. Social cognitive theory of self-regulation. Organ. Behav. Hum. Decis. Processes 1991, 50, 248–287. [Google Scholar] [CrossRef]
  110. Rhee, H.S.; Kim, C.; Ryu, Y.U. Self-efficacy in information security: Its influence on end users’ information security practice behavior. Comput. Secur. 2009, 28, 816–826. [Google Scholar] [CrossRef]
  111. Zhu, B.; Habisch, A.; ThØgersen, J. The importance of cultural values and trust for innovation—A European study. Int. J. Innov. Manag. 2018, 22, 1850017. [Google Scholar] [CrossRef]
  112. Sarabdeen, J.; Rodrigues, G.; Balasubramanian, S. E-Government users’ privacy and security concerns and availability of laws in Dubai. Int. Rev. Law Comput. Technol. 2014, 28, 261–276. [Google Scholar] [CrossRef] [Green Version]
  113. Venkatesh, V. Determinants of perceived ease of use: Integrating perceived behavioral control, computer anxiety and enjoyment into the technology acceptance model. Inf. Syst. Res. 2000, 11, 3–11. [Google Scholar] [CrossRef]
  114. Yi, M.Y.; Hwang, Y. Predicting the use of web-based information systems: Self-efficacy, enjoyment, learning goal orientation, and the technology acceptance model. Int. J. Hum. Comput. Stud. 2003, 59, 431–449. [Google Scholar] [CrossRef]
  115. Agha, A. A Stakeholder Based Assessment of Developing Country Challenges and Solutions in Smart Mobility within the Smart City Framework. Available online: https://doi.org/10.13140/RG.2.1.3516.9689 (accessed on 30 July 2022).
  116. Alawadhi, S.; Morris, A. The use of the UTAUT model in the adoption of e-government services in Kuwait. In Proceedings of the Annual Hawaii International Conference on Systems Science, Big Island, HI, USA, 7–10 January 2008. [Google Scholar] [CrossRef]
  117. Hollands, R.G. Critical interventions into the corporate smart city. Camb. J. Reg. Econ. Soc. 2015, 8, 61–77. [Google Scholar] [CrossRef] [Green Version]
  118. Bélanger, F.; Carter, L. Trust and risk in e-government adoption. J. Strateg. Inf. Syst. 2008, 17, 165–176. [Google Scholar] [CrossRef] [Green Version]
  119. Lee, J.H.; Song, C.H. Effects of trust and perceived risk on user acceptance of a new technology service. Soc. Behav. Pers. 2013, 41, 587–597. [Google Scholar] [CrossRef]
  120. Ranaweera, H.M.B.P. Perspective of trust towards e-government initiatives in Sri Lanka. Springerplus 2016, 5, 1–11. [Google Scholar] [CrossRef] [Green Version]
  121. Roca, J.C.; García, J.J.; de la Vega, J.J. The importance of perceived trust, security and privacy in online trading systems. Inf. Manag. Comput. Secur. 2009, 17, 96–113. [Google Scholar] [CrossRef] [Green Version]
  122. Shin, D.H. The effects of trust, security and privacy in social networking: A security-based approach to understand the pattern of adoption. Interact. Comput. 2010, 22, 428–438. [Google Scholar] [CrossRef]
  123. Appio, F.P.; Lima, M.; Paroutis, S. Understanding Smart Cities: Innovation ecosystems, technological advancements, and societal challenges. Technol. Forecast. Soc. Chang. 2019, 142, 1–14. [Google Scholar] [CrossRef]
  124. Al-hujran, O. An assessment of Jordan’s e-government maturity: A user-centric perceptive. Int. J. Electron. Gov. 2012, 5, 134–150. [Google Scholar]
  125. Cengiz, E.; Kirkbir, F. Customer perceived value: The development of a multiple item scale in hospitals. Probl. Perspect. Manag. 2007, 5, 252–268. [Google Scholar]
  126. Almuraqab, N.A.S.; Jasimuddin, S.M. Factors that Influence End-Users’ Adoption of Smart Government Services in the UAE: A Conceptual Framework. Electron. J. Inf. Syst. Eval. 2017, 20, 11. [Google Scholar]
  127. Hair, J.F., Jr.; Black, W.C.; Babin, B.J.; Anderson, R.E.; Black, W.C.; Anderson, R.E. Multivariate Data Analysis; Pearson: London, UK, 2018; Chapter 4; pp. 95–120. [Google Scholar] [CrossRef]
  128. Rozario, S.D.; Venkatraman, S.; Marimuthu, M.; Khaksar, S.M.S.; Subramani, G. Creating smart cities: A review for holistic approach. Appl. Syst. Innov. 2021, 4, 70. [Google Scholar] [CrossRef]
  129. Zamawe, F.C. The implication of using NVivo software in qualitative data analysis: Evidence-based reflections. Malawi Med. J. 2015, 27, 13–15. [Google Scholar] [CrossRef] [PubMed] [Green Version]
  130. Hair, J.F.; Hult, G.T.M.; Ringle, C.M.; Sarstedt, M. A Primer on Partial Least Squares Structural Equation Modeling (PLS-SEM); Sage: Thousand Oaks, CA, USA, 2017; p. 165. [Google Scholar]
  131. Williams, J.S.; Child, D. The Essentials of Factor Analysis. Contemp. Sociol. 1974, 3, 411. [Google Scholar] [CrossRef]
  132. Hung, S.Y.; Chang, C.M.; Yu, T.J. Determinants of user acceptance of the e-Government services: The case of online tax filing and payment system. Gov. Inf. Q. 2006, 23, 97–122. [Google Scholar] [CrossRef]
  133. Bhattacherjee, A.; Park, S.C. Why end-users move to the cloud: A migration-theoretic analysis. Eur. J. Inf. Syst. 2014, 23, 357–372. [Google Scholar] [CrossRef]
  134. Verma, P.; Sharma, A.K. Assortment satisfaction: The tale of online footwear sales. Technol. Soc. 2018, 54, 57–65. [Google Scholar] [CrossRef]
  135. Gautier, P. Inter-organizational relationships and supply chain performance: Case study of the subsidiary company of a car parts manufacturer. In Proceedings of the International MultiConference of Engineers and Computer Scientists 2010, IMECS 2010, Hong Kong, 17–19 March 2010. [Google Scholar]
Figure 1. The resident’s interaction with the smart city dimensions.
Smartcities 05 00077 g001
Figure 2. Malaysia’s Journey Towards Smart Cities began in the 1990s.
Smartcities 05 00077 g002
Figure 3. Malaysia Smart City Stakeholders’ Acceptance Model (MSCSA) Conceptual framework. * Demonstrate the mediating role of these concepts in the hypotheses that follow.
Smartcities 05 00077 g003
Figure 4. Implemented mixed method.
Smartcities 05 00077 g004
Figure 5. Research Model.
Smartcities 05 00077 g005
Figure 6. The proposed research model’s results.
Smartcities 05 00077 g006
Table 1. Eight key structures adoption of UTAUT2, review and interview.
AspectExperts
Interviews
Self-DevelopedLiterature Review
Trust in Technology (TT)Expert interview-[65,66,67]
Price Value (PV)Expert interview-[6,63,68,69,70,71,72,73]
Perceived Security (PS)-Self-developed[74,75,76,77]
Perceived Privacy (PP)--[5,78,79,80,81,82,83]
Self-Efficacy (SE)-Self-developed[78,79]
Effort Expectancy (EE)--[9,50,84,85]
Trust in Government (TG)Expert interview-[66,67,86,87,88]
Behavioural Intention (BI)--[51,66,89,90]
Table 2. Aspects, in-depth interview questions and correlation between Quantitative and Qualitative Questions, and the Hypothesis.
Aspects and Quantitative; Question StatementQualitative; Deep Interview QuestionHypothesis
Perceived privacy and securityWhile cities begin to be further advanced technologically, residents and strategy makers may perceive their expectations of security and privacy as severely challenged, what are most challenges? Can you explain Malaysia’s smart city challenges?Hypotheses 1 and 2
The level to which consumers feel the services of a smart city? are the secure platform for saving, holding and exchanging sensitive data is referred to as perceived security?
Trust in technologyAre smart city services as long as the services are innovative? Hypotheses 3* and 4
Are the privacy of stakeholders and citizen information protected and high-quality services provided?
Self-Efficacy and Effort ExpectancyIs further technology that might overburden residents and prevent them from completing previously straightforward tasks?Hypotheses 5 and 6
Are city stakeholders, adopting online e-commerce, trust in technology, as well as mobile banking adoption?
Trust in Government (TG), Price Valueand Behavioural intentionAre smart city services as long as the services are innovative? Hypotheses 7–9
Are the privacy of stakeholders and citizen information protected and high-quality services provided?
What are the current and future challenges facing Kuala Lumpur toward a smart city?
Is it conceivable for the government to issue automated citations for situations in which no one was present?
What if the vendors turned out to be immoral, exploiting part or all the data they acquired?
Table 3. The Value of correlation ‘r’ Coefficient.
Relationship DefinitionCorrelation Coefficient
A very strong positive connection+0.70–above
An important positive association0.50–0.69
moderately improved relationship0.30–0.49
A weak positive correlation0.10–0.29
There is no connection or relationship.0.0
A negative and insignificant relationship−0.01–−0.09
A weak negative correlation−0.10–−0.29
A relationship with a negative significance−0.30–−0.49
A significant inverse relationship−0.50–−0.59
A very negative relationship−0.70–−below
Table 4. Demographic Specification.
Demographics%
Gender
Male41.3
Female56.4
Prefer not to answer2.3
Age
Younger than 2418
25–3532
36–4530.3
46–5516.7
Older than 5603
Education
High school & under27.6
Undergrads29.4
Graduate38.8
Professional certificate4.2
Table 5. Factor Loadings Value.
FactorsBehavioural
Intention
Effort
Expectancy
Perceived
Privacy
Perceived
Security
Price ValueSelf-EfficacyTrust
Government
Trust in
Technology
BI10.8790000000
BI20.8660000000
BI30.9150000000
EE100.830000000
EE200.853000000
EE300.903000000
EE400.828000000
PP1000.81500000
PP2000.81600000
PP3000.76100000
PP4000.70700000
PS10000.7960000
PS20000.9150000
PS30000.9130000
PS40000.8720000
PV100000.754000
PV200000.861000
PV300000.787000
PV400000.866000
SE1000000.87300
SE2000000.79100
SE3000000.81100
SE4000000.71500
TG10000000.6590
TG20000000.6940
TG30000000.7720
TG40000000.8210
TT100000000.937
TT200000000.941
TT300000000.843
Table 6. Cross Loading Value.
AspectBehavioural
Intention
Effort
Expectancy
Perceived
Privacy
Perceived
Security
Price ValueSelf-
Efficacy
Trust
Government
Trust in
Technology
BI10.8790.7190.3260.3930.3730.6050.6560.484
BI20.8660.5990.3390.2470.4630.5420.5480.355
BI30.9150.7180.2330.310.3850.650.5730.384
EE10.6820.8300.2790.2320.3520.5930.4930.351
EE20.6560.8530.4270.3110.4820.7130.4730.48
EE30.5990.9030.3030.2660.3240.6390.4820.472
EE40.6760.8280.3040.2880.1770.5420.5150.451
PP10.2330.2340.8150.8370.2620.0380.5480.58
PP20.2690.2590.8160.5340.4970.1430.5630.541
PP30.2090.3640.7610.2280.3050.2530.2720.268
PP40.2930.3860.7070.3730.380.2740.3750.352
PS10.4520.4470.5170.7960.3240.2380.5510.566
PS20.2980.1970.6330.9150.3540.0520.5580.608
PS30.1690.1160.6310.9130.289-0.0510.4860.617
PS40.3480.3710.7780.8720.4160.1310.6490.663
PV10.2950.2490.1940.1290.7540.2290.1570.083
PV20.3690.4090.390.2350.8610.2570.2580.248
PV30.4190.2120.4570.4750.7870.1350.4780.402
PV40.3730.4180.4570.3340.8660.1580.3760.382
SE10.6940.7330.2000.1120.2280.8730.5120.331
SE20.5360.5310.0340.0140.1960.7910.3510.075
SE30.5080.5240.3730.2230.2550.8110.5220.365
SE40.3490.495-0.0190.0680.0320.7150.2660.118
TG10.4650.4140.2510.4210.1730.5170.6590.439
TG20.3410.2630.2720.5370.1070.3010.6940.497
TG30.5090.4420.4580.3540.3520.4870.7720.419
TG40.5780.4970.6520.6280.4150.3230.8210.707
TT10.5030.5470.5870.6530.390.2780.6940.937
TT20.4270.4480.5170.630.270.2090.6890.941
TT30.3160.3930.6090.6320.3580.3150.5470.843
Table 7. Measures Reliability of Composites, AVE, R and Total Item Correlation.
AspectItemMeasure ReliabilitySQ Root of the AVE *R
Reliability of CompositesTotal-Item Correlation
SESE10.850.5010.767 *
SE2 0.567
SE3 0.608
SE4 0.605
EEEE10.9170.7080.861 *
EE2 0.791
EE3 0.758
EE4 0.738
PSPS10.9410.7860.879 *
PS2 0.834
PS3 0.815
PS4 0.769
PPPP10.7830.4310.748 *
PP2 0.305
PP3 0.479
TTTT10.9580.8380.921 *0.521
TT2 0.846
TT3 0.823
TT4 0.857
TGTG10.8930.6570.829 *
TG2 0.727
TG3 0.629
TG4 0.705
BIBI10.9080.6890.873 *0.559
BI2 0.698
BI3 0.747
* The square root of the extracted average variance is less than the construct correlations, indicating that the Fornell-Laker criterion for discriminant validity is met.
Table 8. Hypotheses testing.
Hypothesis2.5%97.50%T Statisticsp-ValuesSupported
Effort Expectancy -> Behavioural Intention0.1620.7076.1480yes
Perceived Privacy -> Trust in Technology0.3520.52910.9520yes
Perceived Security -> Trust in Technology0.3190.81210.6710yes
Price Value -> Behavioural Intention0.1490.3595.9100yes
Self-Efficacy -> Behavioural Intention0.1430.5865.7680yes
Trust Government -> Price Value0.3780.51513.2300yes
Trust in Technology -> Behavioural Intention0.1410.2815.6480yes
Table 9. Hypothesis, aspect, and examples.
HypothesisAspectExample
Hypotheses 1–4Privacy, security, and trust in technologySmart-city service users have been found to value safety and security and support increased security government regulation, e-government services, e-banking, mobile applications, intelligent healthcare applications
Hypothesis 5Self-efficacyMany already use similar technologies in their daily life, such as Google maps and Waze to monitor traffic congestion and avoid road closures in near-real time; and are accustomed to online or cloud-based security cameras for crime prevention and door locks that send notifications to their phones.
Hypothesis 6Effort expectancyThey are primarily interested in convenience, e.g., the convenience of finding parking with the benefits of using ‘push’ notifications such as ParkMobile services, e-government services and e-banking, mobile applications, and big data analytics.
Hypothesis 7Trust in governmentThey are consistent with similar findings in the areas of SMS, internet, and mobile usage and related to trust in government effectiveness. Trust in the government was found to be a critical factor in users’ decision to adopt e-government. Another example would be smart traffic management to monitor traffic flows and optimise traffic lights to reduce congestion. For example, public trust leads to greater compliance with public health responses, regulations, and the tax system.
Hypothesis 8*Price ValuePerceived cost is one of the factors driving mobile or smart government adoption such as Electronic Procurement, Project Monitoring systems, Electronic Services Delivery, Human Resource Management Information systems, Generic Office Environment, E-Syariah, and Electronic Labour Exchange.
Hypothesis 9Behavioural intentionA resident, for example, who declares that they’ll use a smart city application for parking to find a parking space is expressing their purpose for using that technology
* Represent the hypothesis’ mediation role of these constructs.
Publisher’s Note: MDPI stays neutral with regard to jurisdictional claims in published maps and institutional affiliations.

