Article

Renewable Energy in Smart Cities: Challenges and Opportunities by the Case Study of Russia

by
Natalia Anatolievna Vukovic
* and
Daria Evgenievna Nekhorosheva
Department of World Economy, Faculty of World Economy and International Affairs, National Research University Higher School of Economics, Moscow 101000, Russia
*
Author to whom correspondence should be addressed.
Smart Cities 2022, 5(4), 1208-1228; https://doi.org/10.3390/smartcities5040061
Submission received: 19 August 2022 / Revised: 12 September 2022 / Accepted: 15 September 2022 / Published: 20 September 2022

Abstract

:
This study analyzes the development of renewable energy sources and factors affecting the choice of energy source. Also, we focus on the renewable energy programs implemented in the smart cities of the world and apply the prospects of its development to a Russian case study, using the method of cluster analysis. The results of the study showed that the share of renewable energy in Russian cities might reach 50% by 2050. However, the analysis demonstrates that currently, the average value is less than 26%. The results of the study show that the overall level of development of renewable sources in a particular country significantly affects the level of development of renewable energy in smart cities. Finally, the results reveal that Russian smart cities should aim at a much more intensive green energy policy to implement the fundamental principles of the global strategy of Net Zero (IEA).

1. Introduction

The issue of energy security in countries and, in particular, in cities, remains relevant today in connection with the developing global trends aimed at sustainable development and a clean environment.
In the modern world, the energy sector is of great importance: the share of the energy costs in the world’s gross domestic product are bound to reach 13% in 2022 [1]. The active use of traditional energy sources has led to negative consequences for the planet, including environmental pollution, emissions, depletion of resources, and the reduction of natural areas. The global need for energy is continuously increasing as the world population and its urban component are growing. The latter is estimated to reach 70% of the world’s population by 2050 [2].Energy consumption in cities will reach up to 75% by this time [2].
There are many programs and projects aimed at improving the technologies for the production of various types of energy. At the same time, manufacturers have not been able to provide a sustainable production option with minimal negative impacts.
The development of technology has allowed industries to extract energy from Renewable Energy Sources (RES). This approach minimizes environmental pollution, and also allows a diversification of energy sources, especially when it comes to regions with scarce natural resources, underdeveloped infrastructure, and which are located in remote areas where fuel transportation is difficult and/or too expensive.
Renewable energy sources are actively used all over the developed industrialized world. There is an active trend towards the formation of smart cities with a minimum amount of consumption, rational use of resources, and energy-efficient systems. In the West, we can observe both successful and failed projects when it comes to sustainable environmental development. However, it is important to point at the continuous search for new and better options.
In Russia, a limited number of cities have technologies that bring them closer to the title of a smart city. The urban population in Russia is 74% of the total population, which necessitates the creation of smart cities. The goals of a people-centric smart city are economic growth, sustainability, and quality of life supported by a range of reliable, affordable, and environmentally responsible energy sources [3,4,5]. The smart cities in the United States, Denmark, Canada, India, and Australia generate their energy needs RES, which provides between 40% and 100% of their energy supply [5].
RES is the most environmentally friendly way to generate energy. However, various factors both determine the active spread of renewable energy sources and impose certain restrictions on the use of renewable energy sources in cities [6]. It is vital to save the natural resources, replace them with RES, enlarge energy saving technologies, and reduce the emissions of CO2 [7,8,9].
The COVID-19 pandemic has caused adjustments to be made with regard to energy consumption. Demand for oil fell sharply due to a decrease in flights [10]. As Sassen and Kourtit [11] stated, corona crises will not introduce any crucial changes into the growth of cities.
In accordance with the net zero strategy published by the IEA, in 2040, global electricity production from RES will reach 84%, household heating 65%, and RES will occupy 38% in the industrial heating sector [12]. The total volume of global electricity generation from RES is projected at 61% in 2030 and 88% in 2050 [12]. In the case of Russia, it is unlikely that we will see the share of electricity generation from RES at the level of 80% in 2040. However, taking into account hydro energy and the global development of RES, we can count on Russia’s compliance with the lower limits established globally. The total energy demand in the world and in Russia will grow in the next 20 years according to forecasts [10,12,13,14,15]. However, the growth rate is projected to slow down due to the increasing energy efficiency trend. According to the forecasts of the Skolkovo Research Center, by 2040, the consumption of all renewable energy sources (including hydropower) will grow by 76–115% [15]. In percentage terms, the share of global energy consumption provided by RES, excluding nuclear energy, can reach between 19% to 25% by 2040. At the same time, the share of oil and coal in primary energy consumption is expected to gradually decline globally. Relatively similar trends are expected to unfold in Russia.
The main trends in the current world energy industry are: energy efficiency, electrification, development of RES, decentralization.

2. Materials and Methods

2.1. Literature Review

Previous research shows that certain factors affect the development of smart cities, including national and regional socioeconomic factors [16,17] and city or country initiatives [18]. The development of smart cities requires large capital expenditures and investments. In earlier studies, it was found that more financially developed cities with a significant amount of human capital attract the attention of investors to a greater extent, especially in the energy sector [19] as its capital expenditures will be returned faster due to the economic prosperity of the city. These financially affluent cities have more potential to become smart cities and reach this goal faster.
Studies aimed at determining the main factors in the creation of large cities show that cities on different continents and countries have their own characteristics of the development of renewable energy [20,21]. For example, there is a more natural system for the development of renewable energy based on community participation and economic feasibility in the United States, while in China it is hierarchical: the initiative comes from government bodies at various levels [20].
At the same time, South European cities, as the oldest on the continent with established traditions, need another approach for the smart city development strategies [21]. They differ from the leaders in the rankings of smart cities also in terms of population: South European cities are mostly either medium or small in terms of population [21].It is easier to create smart systems in large metropolitan areas. Also, in the conditions of southern Europe, an individually developed plan will work, which will allow these cities to be freer from organizational constraints [22,23].
However, there are opposing views on the necessary degree of involvement of the authorities and their relationship with the inhabitants of the cities. The urban community requires a rational and economical use of resources, societal stability, and security of the urban environment [24].
Research by Lytras et al. [25] shows that technological solutions are not the highest priority: city residents are more interested in active dialogue and joint work to improve the urban environment.
The assessment of smart cities has its own characteristics. First, existing rating scores are made up of different factors, making comparisons of scores from different sources inconclusive [26].
There is still no established opinion which of the factors should be included for a qualitative measurement. Keshavarzi, G. et al. [27] argue that the transport system and communication system are key in conducting a smart city evaluation, while the city’s population and services are not given enough attention. Ye et al. [28] believe that in the assessment of a smart city, such factors as digital infrastructure, the economy, and a smart lifestyle should be a priority.
Only Shami et al. [29] considers a smart city from a more human point of view and proposes to evaluate the city by rating the sustainable use of natural resources, health care, education, and culture. Also, only in this study, attention is paid to the housing infrastructure of the city, which provides more comfortable conditions for citizens. At the same time, the smart city can be evaluated using the mutual influence of various areas, considering them as a whole [30]. The comfort of the living conditions of the population is assessed by the smart living indicator, which includes such indicators as green areas in the city, places for sports, recreation and tourism, and healthcare costs [31].
In general, the existing needs and assessments of cities may indicate that the population of cities needs to improve the quality of life precisely in connection with the need to compensate for the conditions created by environmental problems, excessive use of natural resources, and a significant amount of waste. As a result, smart cities solve environmental problems more efficiently [32] and their use of renewable energy in conjunction with the circular economy has certain prospects [33].
One of the actively researched areas is IoT, the development of which requires a high level of energy capacity for the urban environment [34]. IoT actively involves various spheres of life of citizens and connects them into one common system. There is a problem with the supply, which may be difficult to implement through a conventional traction centralized power system. Thus, the analogues of conventional batteries, such as nanogenerators, appear [35]. In addition, for remote and hard-to-reach cities, the systems used may be insufficient in terms of the energy supplied because IoT technologies consume lots of power. That is why cities should include RES in their energy balances as often as they can.
At the same time, not only the development of IoT can be a generator of an increase in renewable energy installations. The use of renewable energy can become the basis for the development of IoT and Internet 5.0, as Levandovskaya et al. argue [36]. In addition, this study shows how other post-socialist cities, in many ways similar to modern Russian cities, can become real examples of a modern smart city. The existing infrastructure in the cities of Poland is being modernized to meet the current needs of cities, small-sized installations inside the cities are actively used, while the unused fund is converted into energy generation, which is environmentally friendly [36].
According to [11], the corona crisis has had little effect on urban development in terms of population growth. Nevertheless, smart cities might become a necessary precondition for a successful opposition to possible global cataclysms [37]. For instance, IoT is actively used for tracking and monitoring in cities during emergencies. According to estimates [38], the development of smart cities will continue at the same level as the financial burden is alleviated. Finally, there is a lack of data on RES cities and forecasts for the shares of renewable energy in the energy balances of cities. Energy agencies are mostly focused on measuring RES in countries, regions, or continents [10,12,13,14,15]. Unfortunately, smart cities ratings do not occur often [5].

2.2. Methods and Work Structure

The purpose of the work is to evaluate possible scenarios for the use of renewable energy in the projects of smart cities:
1.
Analyze forecast energy consumption globally and in Russia;
2.
Assess the factors that have a significant impact on the use of renewable energy;
3.
Highlight successful and failed renewable energy projects;
4.
Provide a forecast for the further development of efficient production and consumption of renewable energy in Russian cities.
The study is aimed at studying renewable energy sources, which is the object of the study. The subject of the study is the use of renewable energy in cities. The hypothesis of the research is that energy from RES can reach 50% by 2040 in the creation of smart cities in Russia.
The study consists of three main parts. The first part is devoted to the analysis of the active development of renewable energy sources and the factors influencing the choice of energy source. The second part consists of an analysis of the introduction of renewable energy in the cities of the world. The most ‘clean’ cities, both small and large, are considered. Some unsuccessful experiences in the introduction of renewable energy are also shown. The third part is practical and aims at assessing the prospects for RES in cities on the basis of the analysis of the general situation in the energy sector carried out in the study and, in particular, the analysis of the introduction of RES across the world.
The cluster analysis has been chosen for this study, because the number of cases is lower than 100, which makes the econometric analysis obsolete. Moreover, grouping cities in clusters by specific factors makes sense as cities in the world have certain similarities.

3. Results

3.1. Main Features to Observe

3.1.1. Urban Energy and Energy Affordability

Many cities have so far focused on energy efficiency. The next step towards a sustainable energy system will require a significant increase in the use of renewable energy sources.
The following RES are most popular in cities:
  • Solar photovoltaic (PV);
  • Solar thermal energy;
  • Solar air supply;
  • Bioenergy, waste energy;
  • Wind energy;
  • Geothermal energy.
The energy supply of cities can be determined by various factors. To begin with, it is worth paying attention to where energy is spent.
In cities, energy consumption mainly occurs in the following areas:
  • Water;
  • Air supply (heating, air conditioning);
  • Cooking food;
  • Light, electrical appliances;
  • Transport.
In this study, the transport sector is not considered since energy consumption depends on various reasons, which are significantly different from the needs of cities in other directions. The transport system of cities is a separate infrastructure in which urban transport depends on initiatives in the city, and hard-to-measure factors influence the car market, such as technological innovations in transport, financial opportunities of residents, environmental awareness of the population, etc.
Availability must be taken into account when choosing an energy source. Russia is rich in easily accessible and relatively cheap fossil energy sources, i.e., oil, gas, and coal. At the same time, a large area allows for a partial use of the area for the construction of installations of any type, regardless of the need for a source for energy production and processing. The presence of rivers and forests, an access to the sea, and regions with solar and wind potential naturally expand the possibilities. This situation makes it possible to have a wide range of opportunities both for the choice of traditional sources and for the use of renewable energy sources.
European countries, on the contrary, must import gas, oil, coal and even timber to meet the needs of the states. At the same time, states with access to the sea actively use tidal energy, and some cities are switching to biomass energy either partially or completely, not to mention the active introduction of renewable energy sources. Thus, the consumption structure of the city and the availability of resources affect the choice of energy sources.
Since most of the territory of the Russian Federation (RF) is dominated by a climate accompanied by cold winters, most of the energy resources are directed to heat households and water. Also, a feature of the Russian Federation’s cities is the long dark time of the day during winters, making lighting of houses and streets absolutely necessary.

3.1.2. Distinctive Features of Energy Supply Systems

A significant difference between the Russian city energy supply system and the European one is centralized heating systems, the so-called combined heat and power plants (CHP) approved for operation in the 1920s in the USSR. CHP plants are optimal for Russia due to the following features:
  • Cold climate in the country (northern and polar zone);
  • High tariffs when switching to a stand-alone system;
  • Major cities are located in the cold climate zone;
  • Large area of the country;
  • Uneven population density.
CHPPs in Russia are quite worn out, which necessitates renovation.
In most cities of Russia, due to the widespread distribution of central heating and CHPPs, the end consumer (household, production) receives the finished product, i.e., hot water, heating, and electricity. Apartment buildings designed and built in the 20th century in Russia, taking into account the central energy supply, do not provide for their own boilers. In this regard, the transition to autonomous power supply is a rather expensive and labor-intensive process. These factors linked to the availability of infrastructure providing the energy supply to cities impose restrictions on the use of renewable energy sources. Despite this, there is an opportunity to use renewable energy sources for Russia’s districts and/or cities under construction.
In most European cities, as well as in the US, the government sells the energy carrier directly to the consumer. Next, the consumer (household, production) transforms the carrier into a product, through the already installed systems (boilers, boilers, etc.). Also, states in the West actively support the transition to more environmentally friendly fuel through subsidies in the amount of more than 15% of the cost of equipment. These factors make switching to cleaner fuels less expensive and easier for most European cities. At the same time, in Europe, there are still countries with centralized heating systems. Some of them have already been converted to RES.
Renovating the entire heating system and switching to another energy source is an expensive process that requires a large amount of initial investment. In Europe, the process of transition to renewable energy has actively begun since the beginning of the 21st century, thanks to which many countries have a ready-made system for the production, transmission, and use of energy from renewable sources, that is, infrastructure. In the Russian Federation, on the contrary, not enough attention is paid to renewable sources. Only hydropower has been developed: in 2015, the installed capacity of hydro-electric power plants (HPPs) was 20.4% of the installed capacity of UES power plants in Russia, and generation was 15.57% of the total. However, if we evaluate the power in actual terms, then it has remained at the same level for the past five years. It can be concluded that the current volume of investments in infrastructure for the development of RES is insufficient. The type of energy supply system installed in the city, be it private or central, as well as the presence of a certain energy supply infrastructure in the city, have a key influence on the choice of energy source.

3.1.3. Technical Characteristics

Switching to other energy sources always raises issues of the costs, performance, coefficient of performance (COP) and energy losses during transmission. The technologies used in the conversion and transmission of traditional energy sources began their development about 50 years ago, which allows them to be more advanced. The calculated efficiency of gas-fired CHPP reaches from 35% to 43% on average, and it is limited by the distance of heat transfer to 20–30 km. Due to innovative developments in the field of solar energy, the efficiency of solar installations can reach up to 20%, which at the moment can be competitive efficiency for the implementation of the transition. Also, wind turbines can have an efficiency of up to 40%. Combined-cycle plants are the owners of the highest efficiency, their efficiency reaches 60% [39].
The important factor in choosing an energy carrier is the cost of the energy received. For several decades, the endowment of natural resources in Russia has allowed the use of gas as the cheapest source of energy. However, current changes in the world can have significant consequences for the energy system of the world and Russia.
Thus, the cost of a megawatt-hour of solar and wind energy has reached grid price parity. Onshore wind has become the cheapest source of electricity generation in the world, with a non-subsidized cost range of $30–60 per MWh; while natural gas, being the cheapest fossil fuel, costs between $42 and $78 per MWh [16]. The performance of solar and wind installations is also approaching performance parity, which clearly indicates the competitiveness of renewable energy sources.
One of the obvious disadvantages of solar and wind energy is instability, inconstancy. One of the innovative solutions included cycle turbines, which offer more flexibility to follow the load curve and more affordable batteries. There are other innovations related to combined cycle turbines that can affect the instability of the supply of solar and wind energy and provide an additional opportunity to compete with traditional energy sources, providing solar and wind energy with additional reliability.
An important factor affecting the efficiency of the power system is energy losses. During the transmission of electrical energy, losses in electrical wires are observed. Losses for 2018 in the Russian Federation amounted to 10.6% [40]. Accordingly, transmission over long distances reduces the potential efficiency, as well as the cost per unit of energy from one or another energy source. Accordingly, the trend towards decentralization is also relevant for the Russian Federation in the conditions of a large area of the country and the presence of remote regions.
So, in this paragraph, various technical characteristics of the energy industry that affect the choice of an energy source considered. In particular, these are efficiency, transmission losses, the cost of a unit of energy, as well as the stability of energy transmission. Modern technologies allow energy from renewable sources to have indicators that can compete with those of traditional energy sources. Energy losses in power grids and losses of thermal energy during transmission make the trend towards decentralization and diversification relevant.

3.2. Use of RES in Cities

3.2.1. City Goals, the Most ‘Clean’ Cities, Successful and Unsuccessful Cases of RES in Cities

According to IRENA studies [13], the number of cities have set renewable energy targets, but over 80% of these cities are in Europe and North America. At the same time, we projected that Asia and Africa will experience the fastest growth in both urban population and energy demand.
Cities with renewable energy targets most often fall within the population range of 100,000 to 500,000 inhabitants. Most of the large cities and metropolitan areas that have set targets for the use of renewable energy sources currently have less RES shares and targets are also less than in small cities.
Most of the cities with targets to increase the share of energy from renewable energy (551 out of 671 cities, or 82% of the total) located in countries with a high GDP per capita, which indicates a clear correlation at present between cities with targets for the use of renewable energy sources and their economic status.
The world experience of using RES in cities is quite diverse. European cities, cities in the USA, Canada, India, and other countries on different continents are actively investing in the development of renewable energy and setting goals to achieve the maximum of possible share of renewable energy sources in the total share of energy sources. We consider several examples of the transition to renewable energy in the world.
For a clearer picture, we use the example of cities from different groups in terms of the urban population NS geographical locations. We consider the two most “clean” cities, where the use of renewable energy sources reaches 100%. These are the cities of Diu in India and Georgetown, Texas (Georgetown, TX, USA) in the USA. Below is a comparison in Table 1 of these two cities.
Diu became the first city in India to run entirely on solar energy during the day. Electricity comes from two solar parks with an area of 0.2 square meters km and from panels on the roofs of 112 public institutions.
Together two parks have a capacity of 10.27 MW and operate about 12 h a day. Demand in this 42 sq. km with a population of 52,074 people ranges from 5 to 7 MW. This means that during the day, the sun illuminates all homes, centrally air-conditioned resorts, Diu’s 60-bed hospital, government buildings, air-conditioned office buildings, and ice factories and fish stores, which are its main source of energy consuming industries.
Attempts to turn Diu towards the sun began in 2013 when the first of its two solar parks were authorized by India’s Central Electricity Authority. Commissioned by 2015; the second stage-by 2016. The union territory also means that Diu is under the control of the central government, which has made it easier to plan, finance, find land, and implement the solar parks project.
Georgetown didn’t switch to wind and solar because that was the first goal. Wind and solar power contracts were the best deals in 2013 and 2014 to ensure long-term price stability and reduce regulatory risk. By switching to 100% renewable energy, Georgetown reduces pollution and conserves water at a competitive cost. Georgetown Utility Systems is committed to competitively priced electricity with low regulatory and price risk for its customers. The long-term, fixed cost and zero carbon risk associated with solar and wind power contracts make renewables the right choice.
Clearway Energy and EDF Renewable Energy are the largest contracted energy providers. The solar farm is located in West Texas near Fort Stockton, and the wind farm is located in the Texas area, about 50 miles west of Amarillo. Georgetown’s RES produces more energy than customers need. Projected energy production for 2019 was almost twice higher than consumption.
However, at first glance, the absolutely successful case of 100% provision of the city with RES has its drawbacks. Contracts concluded for fixed prices for the supply of electricity have become uncompetitive over time. In addition, due to inaccurate calculations, the city purchases more energy than it needs, forcing it to sell excess energy at unprofitable prices. The city is losing taxpayer money, resulting in dissatisfaction among the city’s residents.
Based on the analysis of these cities, it can be argued that the date of the city’s foundation does not have a special influence on the formation of the energy balance structure. Both cities are small in terms of population, have solar potential and have approximately the same number of hours of sunshine. At the same time, if Diu is completely provided with solar energy during the daytime, then in Georgetown, energy is produced by both solar power plants and wind turbines.
An important difference is that Georgetown, at the initiative of the authorities, became a city that consumes renewable energy, and the result of the energy transition in Diu is the initiative and support of the central government of India. From this we can conclude that projects can be initiated by both the city and the state. Further, we will consider cities with medium and large populations.
Cities around the world are actively using renewable energy to meet the needs of urban residents. This paragraph considers cities on different continents (Australia, Europe, North America, and Asia) to get the most complete picture. The population of each of the cities under consideration is more than 1.8 million people and up to 10.3 million people. Table 2 presents data on the population, the share of solar and wind energy, as well as the total share of RES of the following cities for 2019: Adelaide (Australia), Hamburg (Germany), Toronto (Canada), Seoul (South Korea), London (England), Madrid (Spain).
All cities presented in the table have different levels of population and different share of RES. At the same time, all countries in which cities are located have a high level of GDP PPP. There is no visible relationship between the share of solar and wind energy in the total share of renewable energy used in the considered cities.
Adelaide for 2019 had a share of RES of 42.2%, provided only by solar and wind energy. However, in the 2019 plans, contracts have been awarded that will allow for a transition to 100 percent renewable energy that will power the City of Adelaide, including the Adelaide Aquatic Center, parks, warehouses and buildings, and Adelaide’s historic City Hall. With the new systems that were installed in 2019, the city of Adelaide’s total solar capacity exceeded 1.1 megawatts.
Collectively, installed solar power provides approximately 12 percent of the electricity consumed by all municipal buildings combined. It is equivalent to the power used by 333 average houses. This project saves about $300,000 on electricity and avoids about 760 tons of carbon dioxide emissions per year. This is the equivalent of using 302 gasoline-powered vehicles throughout the year.
Wind power, under a contract awarded in 2019, will supply from the Clements Gap wind farm in northern South Australia and two new solar farms in Eyre Peninsula (Streaky Bay) and South East (Coonalpyn) that are under development. Between 2007 and 2018, Adelaide’s resident population grew by 33 percent, student enrollment increased by 37 percent, gross regional product increased by 33 percent, and urban population increased by 43 percent. Despite these facts, and the significant increase, the City of Adelaide’s total carbon emissions have fallen by 15 percent.
Adelaide responsibly pursues plans to reduce harmful emissions into the atmosphere, even as the city grows. It mainly uses solar energy and wind energy to achieve the desired result. And the transition to 100% supply of VI energy is already in the plans. Hamburg is a well-known port city in Germany, which actively uses different types of renewable energy. It reconstructs unused objects into generation ones. For example, in the Hamburg district of Wilhelmsburg, a 42-m-high anti-aircraft bunker was turned into an energy center. It now generates power and heat with a biomass power plant, a solar thermal system, and a water tank. When completed in 2015, the bunker could provide heat for up to 3000 homes and electricity for about 1000 households.
In the same area, the Algenhaus (lit. “house of algae”) has large bio-reaction water tanks along its facades, in which algae power the building through biomass production. And the former landfill has been converted into another energy hub, supplying wind and solar energy to around 4000 homes. This unique experience in the reconstruction of unused capacities can be successfully applied both in other European cities and around the world.
Toronto has a different experience: In 2013, the City Council passed a requirement that all new city-owned buildings generate at least five percent of their energy used from renewable energy sources. The use of solar photovoltaic, solar thermal energy, geothermal energy and biomass contributes to the achievement of urban environmental, energy and economic goals.
The City has mandated that renewable energy systems be installed in all city buildings where possible by 2020. Over the past 20 years, more than 50 renewable energy systems have been installed on buildings and facilities in the city. Two programs were organized to implement the plan and they started their work in 2012 and 2013. Solar panels of standard and micro sizes are installed on city buildings.
Based on the study of unsuccessful projects in RES, it is possible to work out in advance those aspects of the implementation of projects for the introduction of RES, that may turn out to be weak. Solar energy generation projects have been launched in West African countries. The potential of the projects was huge. However, most of the implemented projects have fallen into disrepair due to lack of proper maintenance, cleaning (solar panels must be cleaned of dirt falling on them) and repairs. But the method of managing the above processes was not developed. So, some projects were closed without being built, while others were closed during work. In addition to the loss of resources: time and money, this situation has led to distrust of renewable energy among the governments of developing countries in West Africa, and now the prospects for renewable energy in Africa are limited to this.
There is a city in Abu Dhabi that was originally designed and built in such a way that it consumed energy only from renewable energy sources. This is the city of Masdar, built for less than 50 thousand inhabitants and intended as a center for innovative technologies. It originally had its own branch of the University of Massachusetts. About 1.5 billion dollars was invested in the construction of the city. The city remains deserted; it has not become a center of attraction for people. This situation allows us to think about not building new cities but making changes in existing cities: using combined energy, or completely converting to renewable energy.
So, the considered unsuccessful projects show that it is very important to treat calculations and planning, building roadmaps, and organizing related processes responsibly. In this part of the research we examined various cases: small towns with fully renewable energy, large cities and megacities using renewable energy from 8% to 46% in the total share of the energy balance, as well as projects in which the use of renewable energy did not bring the expected results. Next, we will consider what prospects renewable energy has in Russian cities.

3.2.2. Peculiarities of Russian Cities Energy Supply

A significant difference between the Russian city energy supply system and the European one heating systems, the so-called combined heat and power plants (CHP) approved for operation in the 1920s in the USSR. CHP plants are optimal for Russia due to the following features:
  • Cold climate in the country (northern and polar zone);
  • High tariffs when switching to a stand-alone system;
  • Major cities are located in the cold climate zone;
  • Large area of the country;
  • Uneven population density.
CHPPs in Russia are quite worn out, which necessitates renovation.
In the most cities of Russia, due to the widespread distribution of central heating and CHPPs in general, main gas, the end consumer (household, production) receives the finished product: hot water, heating, electricity. Apartment buildings designed and built in the 20th century in Russia, taking into account the central energy supply, do not provide for their own boiler houses. In this regard, the transition to autonomous power supply is a rather expensive and labor-intensive process.
The above factors for the availability of infrastructure for the energy supply of cities impose restrictions on the use of renewable energy sources in these areas. Despite this, there is an opportunity to use renewable energy sources for districts and cities under construction.
In most European cities, as well as in the US, the government sells the energy carrier directly to the consumer. And already the consumer (household, production) transforms the carrier into a product, through established systems (boilers, etc.). States actively support the transition to more environmentally friendly fuel through subsidies in the amount of more than 15% of the cost of equipment. These factors make switching to cleaner fuels less expensive and easier for most European cities.
At the same time, in Europe there are countries with centralized heating. Some of these systems have been converted to RES. Renovating the entire heating system and switching to another energy source is an expensive process that requires a large amount of initial investment. In Europe, the process of transition to renewable energy has actively begun since the beginning of the 21st century, thanks to which many countries have a ready-made system for the production, transmission, and use of energy from renewable sources, that is, infrastructure. In the Russian Federation, on the contrary, not enough attention was paid to the direction of renewable sources. Only hydro power has been developed: in 2015, the installed capacity of hydro-electric power plants (HPPs) was 20.4% of the installed capacity of UES power plants in Russia, and generation was 15.57% of the total. However, if we evaluate the power in actual terms, then it remained at the same level for five years. It can be concluded that the volume of investments in infrastructure for the development of RES is insufficient [19]. The type of energy supply system in the city: private or central, as well as the presence of a certain energy supply infrastructure in the city, have a key influence on the choice of energy source.
3.3. Analysis

3.3.1. Factors

To predict the potential of RES in the cities of the Russian Federation, it is necessary to collect data for analysis by city. Hypothesis under study: Russian cities have the potential to introduce RES in the amount of up to 50% of all energy in the city. Some factors that could be expected to have an impact on the share of RES in the energy balance of the city, such as: the year the city was founded, the average temperature in the year, the number of sunny days in the city, the type of energy supply (central, diversified) were not considered in the further study, since in the previous analysis there was no direct effect on the result.
Moreover, Russia has the potential to use solar energy and wind energy. And other sources of renewable energy, such as hydropower, geothermal energy, wood, biofuels, and biomass energy can be successfully applied in any Russian city. The main task is to choose the most suitable one, taking into account the characteristics of each city.
Obtaining city data is not an easy task as there is no unified city database. Therefore, to assess some aspects of the development of the city, indicators for the country will be used. The factor under study is the share of renewable energy sources The share of renewable energy sources (X1). Data is taken from Deloitte report (2019). For Russian cities, the average level for the country is taken −1%. The factors that may have an impact on the final share of RES in cities are the following indicators:
  • City population (X2);
  • GDP per capita (X3);
  • Country investment in RES (X4);
  • Position of the city in the ranking of smart cities (X5);
  • Level of income in the country (Income group) (X6).
City population (X2) - measured in million people. Data based on Deloitte report (2019). Population affects the size of the city, its energy needs.
GDP per capita (X3) - measured in Data is taken from the World Bank database. Since not all the studied cities have official statistics on the gross domestic product, this indicator can be used to assess the economic performance of the city as part of the country’s system.
Investments of the country in RES (X4) - measured in million US dollars. Data from the energy agency IRENA was used. Since a country’s investment may depend on the development of the country, both in the general sense of the term, and on economic development, this indicator may correlate with GDP per capita, which may distort the results of the study.
The position of the city in the ranking of smart cities (X5) is another indicator of the development of the city in the direction of smart. This indicator includes other areas of the city’s development and may indicate the desire of the city to follow the trend towards development and, in particular, the transition to renewable energy sources as a safer source of energy, which also reduces emissions. A city that does not appear in the published ranking of 109 countries will be assessed as ranked between 150 and 200.
The level of income in the country (Income group) (X6) may have an indirect impact on decentralization. It means that a more progressive transition to renewable energy at the expense of households is possible in the city. There are three groups: 1—high income, 2—high average income, 3—low average income. The table with the data on which the study was conducted is in Appendix A. So, for the analysis, the factors that can influence the required share of RES in the city are selected. Now let’s move on to the analysis.

3.3.2. Cluster Analysis

Let’s check that the source data is suitable for cluster analysis (Table 3):
The indicators should not correlate with each other. By Excel Data Analysis package was found, that there is generally a weak correlation between the data. As expected, X3 and X4, as well as X3 and X6, have a higher correlation than the rest (0.797 and −0.764, respectively). Since there is nothing to replace this factor, this information will be taking into account in the further analysis of the results. The sample should not contain “outliers”. In order to ascertain outliers in the data, we use a box-and-whisker chart that represents groups of numerical data through quartiles. In Figure 1 you can see that observations numbered 23, 24 are outliers, therefore, they need to be excluded from the sample.
It is also important to check whether there is a need for a factor analysis that can be used to classify similar variables. For this purpose, we used the Kaiser–Meyer–Olkin sample adequacy criterion, a value that characterizes the degree of applicability of factor analysis to this sample. The rule for interpreting this criterion is as follows:
  • more than 0.9—unconditional adequacy;
  • more than 0.8—high adequacy;
  • more than 0.7—acceptable adequacy;
  • more than 0.6—satisfactory adequacy;
  • more than 0.5—low adequacy;
  • less than 0.5—factor analysis is not applicable to the sample.
Thus, in the SPSS data analysis package, it was found that factor analysis for this sample would have low adequacy, since the Kaiser–Meier–Olkin sample adequacy measure is less than 0.6 (Table 4).
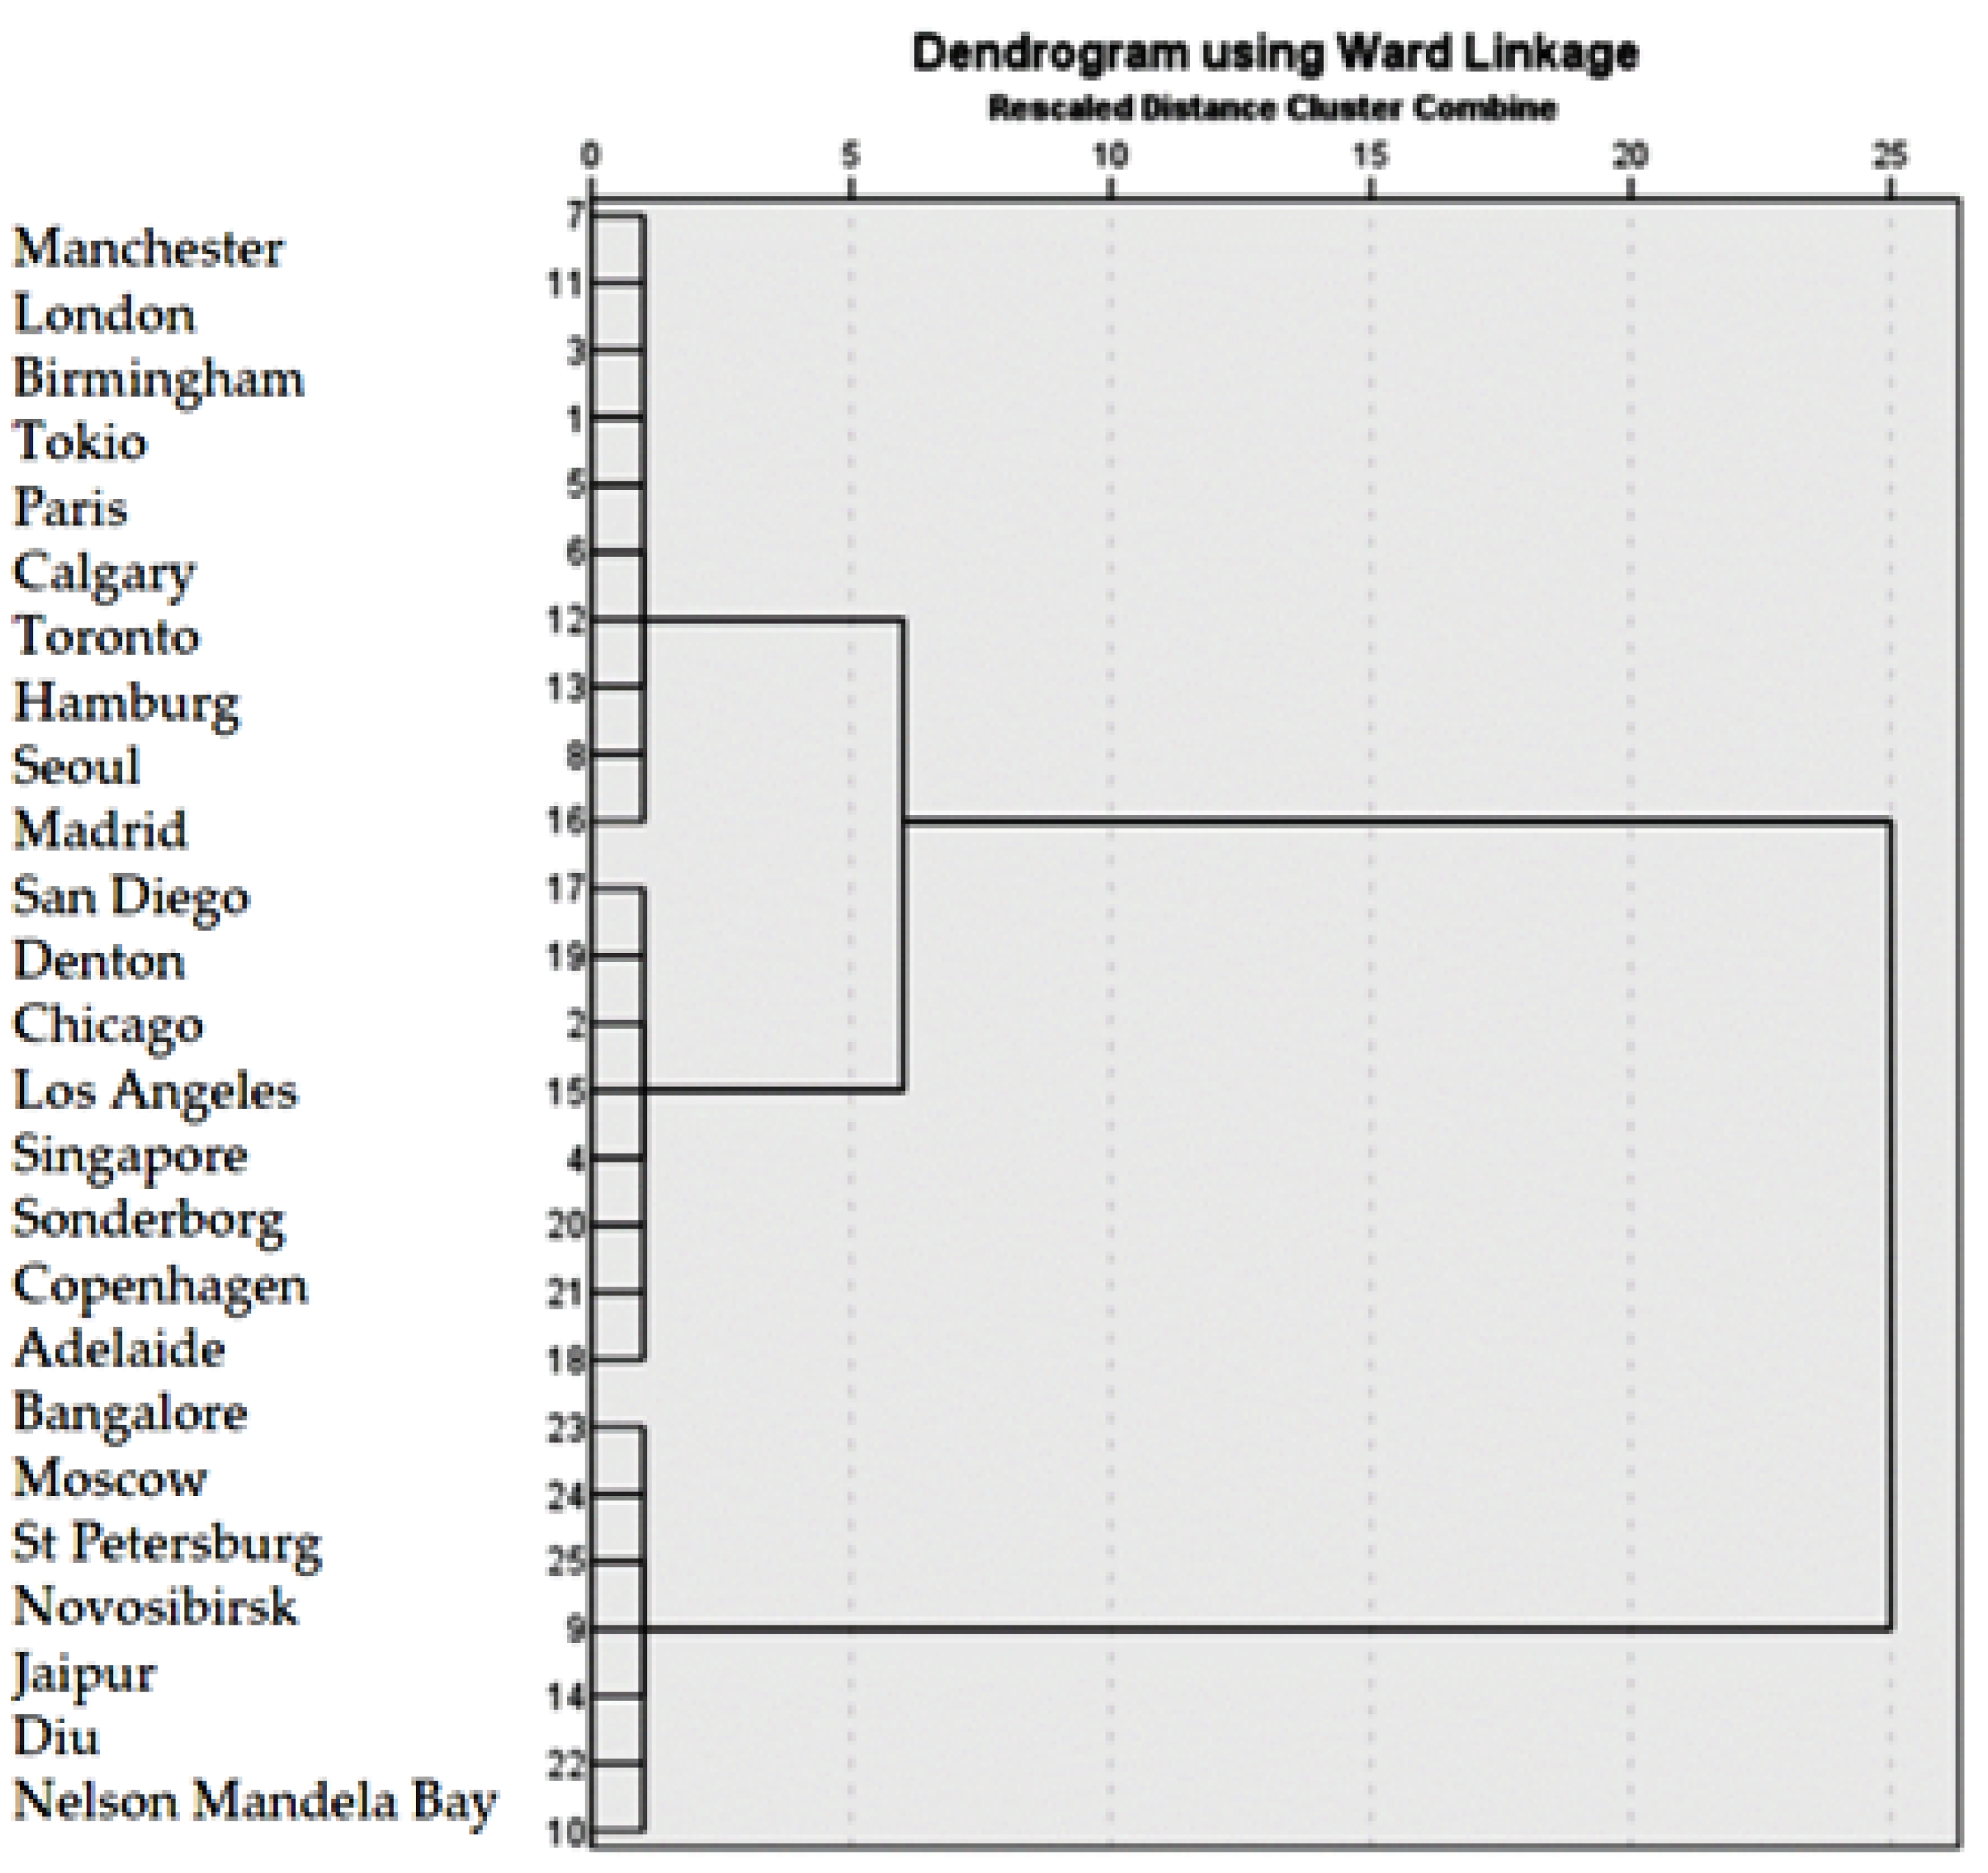
Secondly, we will choose a clustering method. For this study, the Ward method was chosen because it is suitable for data with a small number of observations and allows you to build clusters of small sizes. Thus, the results of cluster analysis using the Ward method are shown in Figure 2. Thus, the data is prepared for the study, and the cluster analysis can be accessed directly in the SPSS package.
First, let’s define a way to measure distance. In this case, it seems reasonable to use the Squared Euclidean distance, since this measure should always be used when building clusters using the Ward (Ward) method, which will be used for clustering in the future. Three clusters are formed. The partitioning takes place in three stages. The first cluster includes cities with low GDP per capita, low investment in renewable energy, average population, low Smart City Index. Russian cities are included in this cluster.
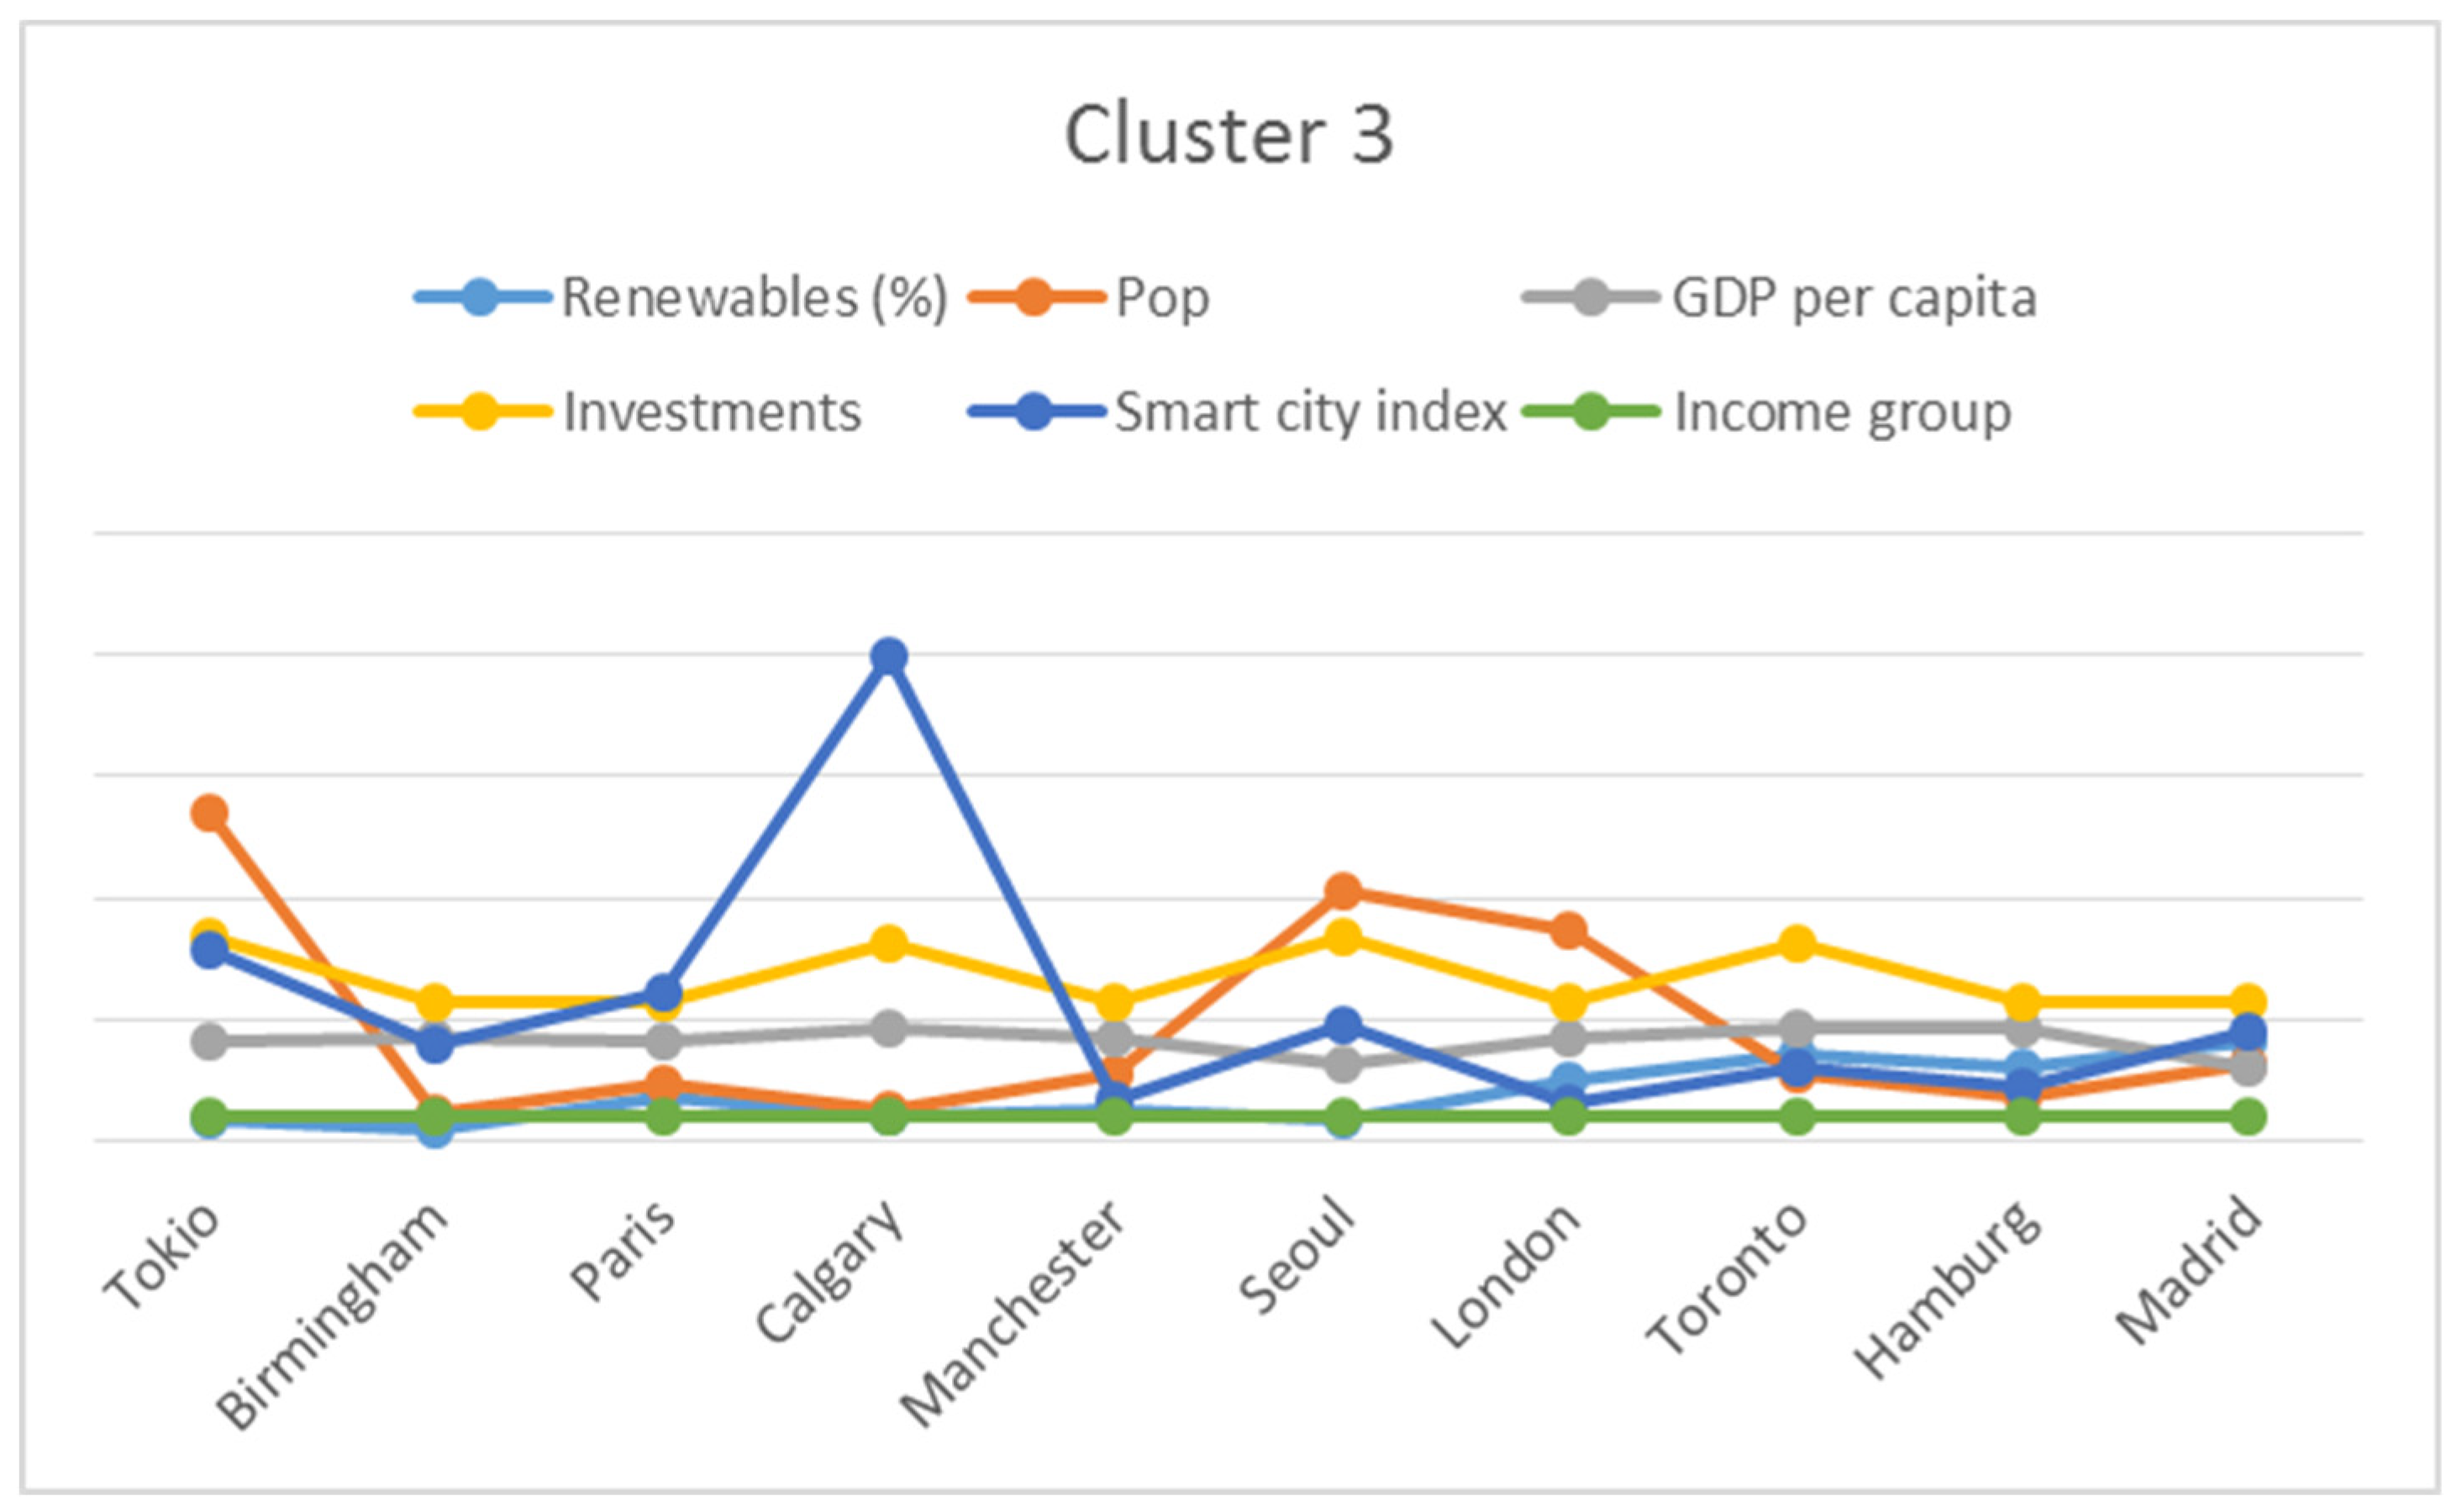
The second cluster is characterized by low population, high GDP per capita, average investment in renewable energy, average position in the smart cities ranking, high income and high share of renewable energy. The third cluster is cities with a large population, average GDP per capita, a significant amount of investment in renewable energy in the country, good positions in the ranking of smart cities, a high income of the population in the country and an average level of renewable energy of 19.4%, which is a low indicator compared to other clusters. All data concerning clusters are presented in Table 5.
It can be seen that each of the clusters (Table 6) included at least 10% of the sample, which corresponds to the criterion of fullness. Moreover, the relationship between the countries included in the third cluster can be interpreted.
Russian cities (Moscow, St. Petersburg, Novosibirsk) fall into the same cluster with such cities as Bangalore, Jaipur, and Nelson Mandela Bay. This is primarily due to the level of income in countries and their placement in the second and third groups. At the same time, the key factor in the distribution and integration of these cities into one cluster is investments in renewable energy, which are relatively lower than in other cities, and in actual terms amount to less than 15 million US dollars. In the rest of the cities included in the analysis, investments in RES in countries amount to more than 56 million US dollars, except Adelaide with 9.54 million US dollars investments in Australia.
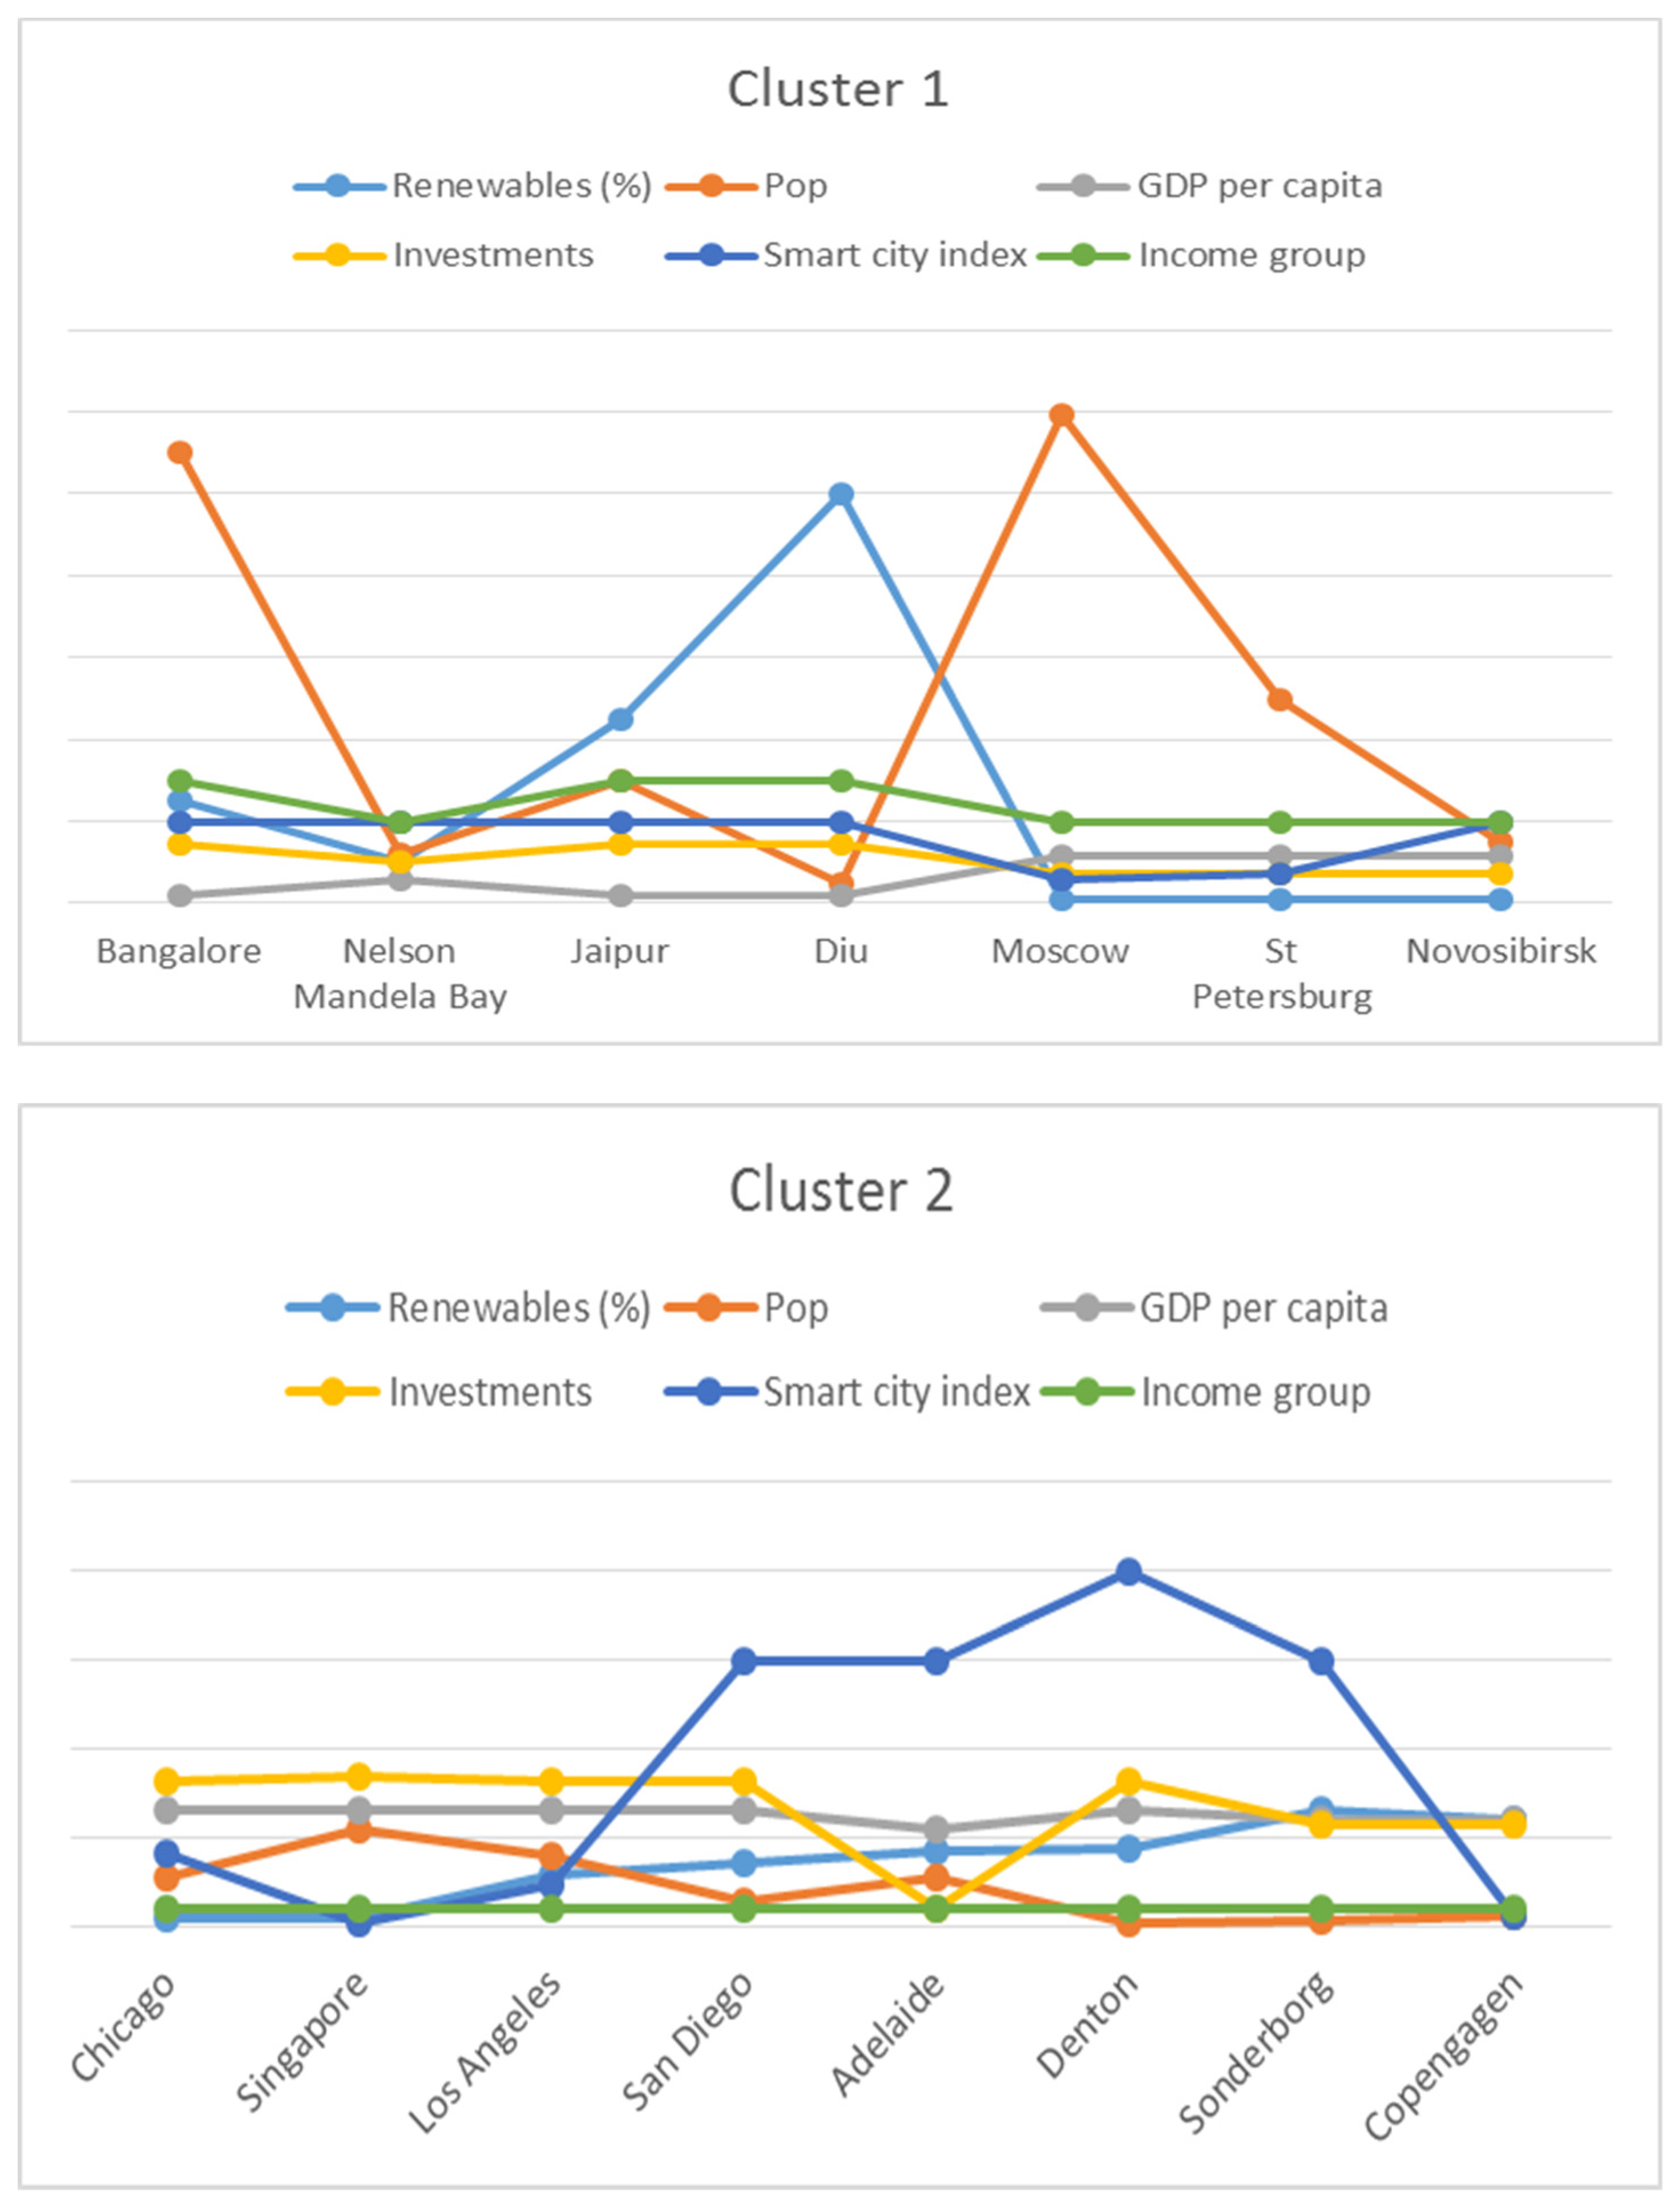
For a better perception of the results of the conducted cluster analysis (Appendix A Table A1. Data for cluster analysis), let’s consider a graphical representation of indicators for cities within each cluster. As can be seen in Figure 3, investments in the cities of the 1st cluster are significantly lower than in cities from other clusters. In the 1st cluster, there are three cities with a large population: Bangalore, Moscow and St. Petersburg. GDP for capital is the lowest in the countries where cities from cluster 1 are located. The Smart City Index is low for Cluster 1 cities compared to Cluster 2 cities and does not have any outliers as Cluster 3 has.
It is surprising that in the country where the city of Diu is located, investments in renewable energy are no more than in cities from other clusters, but at the same time, the city of Diu uses 100% of renewable energy. Also, other cities from cluster 1, similarly located in India, in which investments in RES amounted to 14.6 million US dollars in 2019, have higher rates of the share of RES in the energy balances of cities than in some other cities from the entire sample. It could be assumed that this situation is related to the overall high standard of living in this country. However, India’s total GDP per capita is the lowest in the entire sample.
On the graphical illustration (Figure 3) of the indicators within the clusters, it can be seen that there is some correlation between the indicators of investment in RES in the country and the income group. Thus, the higher the income group of the city, the higher the investment in renewable energy in this country.
It also shows that cities with smaller populations, such as Calgary, San Diego, Denton, Sonderborg, and Diu, rank higher in the Smart City Index. Accordingly, it can be concluded that it is easier for small cities to make changes to achieve the title of a smart city than for a large one. This is due both to the required amount of investment in the existing energy system of the city, and to the amount of technical work to transfer existing systems to RES.
In general, when Russian cities fall into the first cluster, it can be noted that the share of RES can reach 26.1% in cities, which is even more than the share of renewable energy in cluster 3 that consisted of 19.4%.
Initially, the stated hypothesis was not justified; based on cluster analysis, the average possible level of RES is below 50%. For the cities of the Russian Federation, this is a significant potential for implementation. Moreover, the cluster model is a static analysis, and if we consider the perspective of 20 years until 2040, then there is a possibility of reaching the RES level in some Russian cities at the level of 50%, especially taking into account the global experience.
The results of the study were influenced by the fact that there is a lack of data on cities and data on the countries in which the cities are located were used. Moreover, three indicators, such as GDP per capita, investment in renewable energy and the level of income in the country, have some correlation.
Also, in the study, there is a quite small number of observations and not all cities using renewable energy sources were included in the sample.

3.3.3. Dynamic Analysis

The performed cluster analysis includes data for 2020. However, to prove the relevance of the data, let us consider the dynamics of changes in the share of renewable energy sources in the energy balance. Based on the data [38], the shares of RES in consumption by region and the world as a whole were calculated.
As it is seen in Table 7, the share of RES in energy consumption in 2020 and 2021 do not differ much. Despite the growth in the share of renewable energy in 2020, the growth rate of the share of renewable energy in 2021 has slowed down due to global circumstances that are forcing countries to reduce funding for renewable energy projects.
Energy consumption from RES in 2021 is slowing down in almost all regions, except Asia Pacific. Even in developed Europe the annual growth rate was −3.4%. Other regions show the same trend in 2021: energy consumption from RES fell to 6.2% in South and central America, 5.3% in CIS, and 4.5% in Asia Pacific.
The leader of slowing energy consumption from RES in 2021 was the Middle East, where the annual growth rate consisted of −16.1%. Moreover, in 2020 the growth rate for the share of RES in energy consumption in the Middle East region was −14.9%, which shows the long-term trend in this region. It is necessary to focus on the real share of RES in the Middle East, which consists of not more than 1.3% in total energy consumption since 2017.That is why small changes of the share of RES in total energy consumption in this region result in huge annual growth rates.
Smallest negative annual growth rates in 2021 are seen in North America and in Africa, which are −0.1% and −0.7%, respectively. At the same time the share of RES in total energy consumption in these regions are less than 13% and 9.6%. We can conclude that on the one hand RES in these regions appear as an important energy source but does not constitute the largest share of the energy source in the energy balance.
The annual growth rate of RES in energy consumption in Asia Pacific in 2021 was positive, but smaller than in 2020, which consisted of 4.5% and 8.7% respectively. This may be the result of China’s previous actions to increase the country’s hydropower capacity.
Figure 4 shows that on a global level there were no significant changes in the RES sector of energy and the world’s annual growth rate of share of RES in energy balance slowed down to 0.1% in 2021.
Given the above, we can conclude that the cluster analysis carried out with the data of previous years is relevant. In the future, there won’t be any global changes in a significant decrease or increase in the share of renewable energy sources in the world energy balance.

4. Discussion

The study is based on the current need of the world to switch to renewable sources. Real world-class data is used. The object of this study is considered from different angles. The cluster analysis and dynamic analyses were conducted. The cluster analysis is the most suitable method for conducting urban analysis as the number of observations is insufficient for the regression analysis. The figures portray the real situation accurately, but they cannot take into account unmeasurable factors. Perhaps these observations will suffice to build an econometric regression. Also, to obtain more accurate results, it makes sense to increase the set of factors, and expand with social indicators.
According to the cluster analysis, Russia’s cities have a chance to evolve into smart cities according to their mode of energy usage and its level of consumption. Median level of RES in the three biggest cities of Russia could reach 26%. Nevertheless, other new or smaller cities can also become smart cities. The cluster analysis does not include a wide range of factors and is limited by the number of cities due to the low number of RES in cities’ data.
The dynamic analysis shows that the cluster analysis is relevant in connection with the preservation of the shares of renewable energy sources in the energy balance at the world level. Suggestions for future studies could include changing influencing factors and a different set of cities: more observations can be added to the data used, or a different city sampling principle can be used. Additional factors that may have a significant impact on the analysis of cities include information about the state of the housing stock of cities stated in [29].
Moreover, it is important to clarify that the transition to renewable energy in cities is for the most part the result of the initiative of a city or a country, because it requires not only a large amount of investment, but also changes in the infrastructure of the city. Thus, measuring the governments’ activity and the development of RES, i.e., hierarchical, natural or in communication as mentioned in [20,21] should provide new evidence for the various scenarios in cities in different regions and countries.
As noted earlier, it is necessary to assess the impact of the structure of energy supply to cities. Thus, it is likely that cities with central energy supply will differ from cities with predominantly autonomous installations. It will have a significant scientific importance to gather a global large dataset on smart cities development and factors to conduct dynamic econometric analysis to measure the impact of each factor and to forecast the share of RES in smart cities.
In this research we did not measure the influence of the modern trend “Internet of energy” and harvesting on the development of RES in smart cities. However, it is a possible solution that could enable IoT nodes to scavenge self-sustaining energy from environmental ambient sources such as various IoT devices or wireless sensor networks (WSNs) for smart city automation [41].
Also, in this research, we did not evaluate waste-to-energy potential because this sector is not still developed in Russia, but it is significant in Sweden, Germany and other countries. So, waste-to-energy projects should be evaluated in the analysis of other cases because “…the utilization of renewable energy sources has been demonstrated as a significant contribution to reducing pollutant emissions and enhancing the quality of the living environment. Therefore, designing the energy systems based on clean and renewable criteria is considered a sustainable solution for smart cities” [42].

5. Conclusions

The global practice of smart cities demonstrates broad opportunities for using renewable energy sources and reducing CO2 emissions. The results of this study showed that the share of renewable energy sources in Russia’s smart cities can reach an average of less than 26%, which is almost two times lower than the global sustainable development plans (Net Zero etc.). The results of the study demonstrated that the overall level of development of renewable sources significantly affects the level of development of renewable energy in smart cities. For example, in Russia, where the share of renewable sources in the total energy balance of the country is less than 1%, the plan is to reach 26% by 2050 in the most developed and green smart cities, which is a high indicator for Russia. However, globally, the share of renewable sources has exceeded 19% on average, and there are quite a few examples of cities with an expected share of renewable sources of more than 50% by 2050.
In connection with the results obtained, it is obvious that the overall level of development of renewable sources in the country determines the level of their development in large metropolitan areas. In the case of studying the example of Russia, the results of the study show that Russian smart cities should pursue a more intensive policy in the field of green energy in order to implement the fundamental principles of the global sustainable development (Net Zero Strategy etc.). Although this study has a practical purpose, it is necessary to promote a new energy policy focused on an approach to smart sustainable cities and increasing the share.

Author Contributions

Conceptualization, N.A.V.; methodology, D.E.N.; software, D.E.N.; validation, D.E.N. and N.A.V.; formal analysis, D.E.N.; investigation, D.E.N.; resources, N.A.V.; data curation, D.E.N.; writing—original draft preparation, D.E.N.; writing—review and editing, N.A.V.; visualization, D.E.N.; supervision, N.A.V.; project administration, N.A.V.; funding acquisition, N.A.V. All authors have read and agreed to the published version of the manuscript.

Funding

This research was funded in 2021–2022 by the research project “The Impact of the COVID-19 Pandemic on the Development of Global Renewable Resources Market”, Faculty of World Economy and International Affairs, HSE University.

Conflicts of Interest

The authors declare no conflict of interest.

Appendix A

Table A1. Data for cluster analysis.
CityRenewables (%)PopGDP Per CapitaInvestmentsSmart City IndexIncome Group
Tokio913.540,246.8801384.24791
Chicago52.765,297.5175181.61411
Birmingham4.41.142,330.1175456.78401
Singapore3.95.565,233.2824484.2411
Paris182.340,493.9285756.78611
Calgary9.41.246,194.7252381.612001
Manchester13.12.842,330.1175456.78171
Seoul8.310.331,846.2182384.24471
Bangalore25112099.59904814.622003
Nelson Mandela Bay101.26001.4008149.92002
London24.68.642,330.1175456.78151
Toronto362.846,194.7252381.61301
Hamburg29.91.846,445.249156.78221
Jaipur4532099.59904814.622003
Los Angeles293.965,297.5175181.61231
Madrid41.23.229,600.3782556.78451
San Diego351.465,297.5175181.611501
Adelaide42.22.755,060.32619.541501
Denton43.70.165,297.5175181.612001
Sonderborg650.2760,170.3426456.781501
Copengagen600.660,170.3426456.7861
Diu1000.052099.59904814.622003
Georgetown1000.0765,297.5175181.612001
Pena Station Next1000.0565,297.5175181.612001
Moscow111.9211,584.995387.23562
St Petersburg14.9911,584.995387.23732
Novosibirsk11.5111,584.995387.232002
Source: data.worldbank.org, Deloitte. Smart Renewable cities, 2019, Irena Investment, Smart city Index 2019.

References

  1. Available online: https://www.bloomberg.com/news/articles/2022-03-16/energy-costs-set-to-reach-record-13-of-global-gdp-this-year#:~:text=Energy%20Costs%20Set%20to%20Reach%20Record%2013%25%20of%20Global%20GDP%20This%20Year&text=Primary%20energy%20expenditure%20as%20a,by%20consultancy%20Thunder%20Said%20Energy (accessed on 15 August 2022).
  2. Liu, J.; Li, X.; Yang, H.; Han, G.; Liu, J.; Zheng, C.; Zheng, Y. The water-energy nexus of megacities extends beyond geographic boundaries: A case of Beijing. Environ. Eng. Sci. 2019, 36, 778–788. Available online: https://www.liebertpub.com/doi/pdf/10.1089/ees.2018.0553 (accessed on 5 August 2022). [CrossRef]
  3. Thite, M. Smart Cities: Implications of Urban Planning for Human Resource Development. Hum. Resour. Dev. Int. 2011, 14, 623–631. Available online: https://www.tandfonline.com/doi/abs/10.1080/13678868.2011.618349?journalCode=rhrd20 (accessed on 2 August 2022). [CrossRef]
  4. Faria, P.A.; Ferreira, F.A.; Jalali, M.S.; Bento, P.; António, N.J. Combining cognitive mapping and MCDA for improving quality of life in urban areas. Cities 2018, 78, 116–127. Available online: https://www.sciencedirect.com/science/article/abs/pii/S0264275117312234 (accessed on 3 August 2022). [CrossRef]
  5. Available online: https://www2.deloitte.com/content/dam/insights/us/articles/4971_Smart-renewable-cities/DI_Smart-renewable-cities.pdf (accessed on 7 May 2021).
  6. Heo, T.; Kim, K.; Kim, H.; Lee, C.; Ryu, J.H.; Leem, Y.T.; Jun, J.A.; Pyo, C.; Yoo, S.-M.; Ko, J. Escaping from ancient Rome! Applications and challenges for designing smart cities. Trans. Emerg. Telecommun. Technol. 2014, 25, 109–119. Available online: https://onlinelibrary.wiley.com/doi/abs/10.1002/ett.2787 (accessed on 10 August 2022). [CrossRef]
  7. Klemeš, J.J.; Varbanov, P.S.; Walmsley, T.G.; Foley, A. Process integration and circular economy for renewable and sustainable energy systems. Renew. Sustain. Energy Rev. 2019, 116, 109435. Available online: https://www.sciencedirect.com/science/article/abs/pii/S1364032119306434 (accessed on 7 August 2022). [CrossRef]
  8. Klemeš, J.J.; Varbanov, P.S.; Ocłoń, P.; Chin, H.H. Towards efficient and clean process integration: Utilisation of renewable resources and energy-saving technologies. Energies 2019, 12, 4092. Available online: https://www.mdpi.com/1996-1073/12/21/4092 (accessed on 8 August 2022). [CrossRef]
  9. Sadeghian, O.; Moradzadeh, A.; Mohammadi-Ivatloo, B.; Abapour, M.; Anvari-Moghaddam, A.; Lim, J.S.; Marquez, F.P.G. A comprehensive review on energy saving options and saving potential in low voltage electricity distribution networks: Building and public lighting. Sustain. Cities Soc. 2021, 72, 103064. Available online: https://www.sciencedirect.com/science/article/abs/pii/S2210670721003486 (accessed on 9 August 2022). [CrossRef]
  10. Available online: https://www.bp.com/content/dam/bp/business-sites/en/global/corporate/pdfs/energy-economics/statistical-review/bp-stats-review-2020-full-report.pdf (accessed on 2 May 2021).
  11. Sassen, S.; Kourtit, K. A post-corona perspective for smart cities: ‘Should I stay or should I go?’. Sustainability 2021, 13, 9988. Available online: https://www.mdpi.com/2071-1050/13/17/9988 (accessed on 11 August 2022). [CrossRef]
  12. NET ZERO IEA. Available online: https://iea.blob.core.windows.net/assets/deebef5d-0c34-4539-9d0c-10b13d840027/NetZeroby2050-ARoadmapfortheGlobalEnergySector_CORR.pdf (accessed on 10 August 2022).
  13. Available online: https://www.irena.org/-/media/Files/IRENA/Agency/Publication/2020/Oct/IRENA_Renewables_in_cities_2020.pdf (accessed on 1 May 2021).
  14. Available online: https://iea.blob.core.windows.net/assets/ef8ffa01-9958-49f5-9b3b-7842e30f6177/WEI2020.pdf (accessed on 7 May 2021).
  15. Available online: https://energy.skolkovo.ru/downloads/documents/SEneC/Research/SKOLKOVO_EneC_Forecast_2019_Rus.pdf (accessed on 4 May 2021).
  16. Ruhlandt, R.W.S. The governance of smart cities: A systematic literature review. Cities 2018, 81, 1–23. [Google Scholar] [CrossRef]
  17. Meijer, A.; Gil-Garcia, J.R.; Bolívar, M.P.R. Smart city research: Contextual conditions, governance models and public value assessment. Soc. Sci. Comput. Rev. 2016, 34, 647–656. [Google Scholar] [CrossRef]
  18. Razmjoo, A.; Østergaard, P.A.; Denaï, M.; Nezhad, M.M.; Mirjalili, S. Effective policies to overcome barriers in the development of smart cities. Energy Res. Soc. Sci. 2021, 79, 102175. Available online: https://www.sciencedirect.com/science/article/abs/pii/S2214629621002681 (accessed on 7 August 2022). [CrossRef]
  19. De Marco, A.; Mangano, G. Evolutionary trends in smart city initiatives. Sustain. Futur. 2021, 3, 100052. Available online: https://www.sciencedirect.com/science/article/pii/S2666188821000113 (accessed on 9 August 2022). [CrossRef]
  20. Hu, Q.; Zheng, Y. Smart city initiatives: A comparative study of American and Chinese cities. J. Urban Aff. 2020, 43, 504–525. [Google Scholar] [CrossRef]
  21. Bruno, A.; Fontana, F. Testing the smart city paradigm in Italian mid-sized cities: An empirical analysis. Hous. Policy Debate 2021, 31, 151–170. [Google Scholar] [CrossRef]
  22. Battarra, R.; Gargiulo, C.; Pappalardo, G.; Boiano, D.A.; SmeraldaOliva, J. Planning in the era of information and communication technologies. Discussing the “label: Smart” in South-European cities with environmental and socioeconomic challenges. Cities 2016, 59, 1–7. Available online: https://www.sciencedirect.com/science/article/abs/pii/S026427511630107X (accessed on 9 August 2022). [CrossRef]
  23. Leontidou, L. «Smart Cities» of the Debt Crisis: Grassroots Creativity in Mediterranean Europe. Greek Rev. Soc. Res. 2015, 144, 69–101. Available online: https://ejournals.epublishing.ekt.gr/index.php/ekke/article/view/8626 (accessed on 11 August 2022). [CrossRef]
  24. Ji, T.; Chen, J.-H.; Wei, H.-H.; Su, Y.-C. Towards people-centric smart city development: Investigating the citizens’ preferences and perceptions about smart-city services in Taiwan. Sustain. Cities Soc. 2021, 67, 102691. [Google Scholar] [CrossRef]
  25. Lytras, M.D.; Visvizi, A.; Sarirete, A. Clustering smart city services: Perceptions, expectations, responses. Sustainability 2019, 11, 1669. [Google Scholar] [CrossRef]
  26. Reis, I.; Ferreira, F.; Meidute-Kavaliauskiene, I.; Govindan, K.; Fang, W.; Falcao, P. An evaluation thermometer for assessing city sustainability and livability. Sustain. Cities Soc. 2019, 47, 101449. Available online: https://repositorio.iscte-iul.pt/bitstream/10071/22018/1/CITY_SUSTAINABILITY_AND_LIVABILITY-3-33.pdf (accessed on 9 August 2022). [CrossRef]
  27. Keshavarzi, G.; Yildirim, Y.; Arefi, M. Does Scale Matter? An Overview of the “Smart Cities” literature. Sustain. Cities Soc. 2021, 74, 103151. Available online: https://www.sciencedirect.com/science/article/abs/pii/S2210670721004339 (accessed on 11 August 2022). [CrossRef]
  28. Ye, F.; Chen, Y.; Li, L.; Li, Y.; Yin, Y. Multi-criteria decision-making models for smart city ranking: Evidence from the Pearl RiverDelta region. China Cities 2022, 128, 103793. Available online: https://www.researchgate.net/profile/Fei-Ye-3/publication/361108481_Multi-criteria_decision-making_models_for_smart_city_ranking_Evidence_from_the_Pearl_River_Delta_region_China/links/62a420586886635d5ccf8e95/Multi-criteria-decision-making-models-for-smart-city-ranking-Evidence-from-the-Pearl-River-Delta-region-China.pdf (accessed on 9 August 2022). [CrossRef]
  29. Shami, M.R.; Rad, V.B.; Moinifar, M. The structural model of indicators for evaluating the quality of urban smart living. Technol. Forecast. Soc. Chang. 2022, 176, 121427. Available online: https://www.sciencedirect.com/science/article/abs/pii/S0040162521008581 (accessed on 11 August 2022). [CrossRef]
  30. Hajek, P.; Youssef, A.; Hajkova, V. Recent developments in smart city assessment: A bibliometric and content analysis-based literature review. Cities 2022, 126, 103709. Available online: https://www.sciencedirect.com/science/article/abs/pii/S0264275122001482 (accessed on 9 August 2022). [CrossRef]
  31. Lombardi, P.; Giordano, S.; Farouh, H.; Yousef, W. Modelling the smart city performance. Innov. Eur. J. Soc. Sci. Res. 2012, 25, 137–149. [Google Scholar] [CrossRef]
  32. Gao, K.; Yuan, Y. Is the sky of smart city bluer? Evidence from satellite monitoring data. J. Environ. Manag. 2022, 317, 115483. Available online: https://www.sciencedirect.com/science/article/pii/S0301479722010568 (accessed on 8 August 2022). [CrossRef]
  33. Li, B. Effective energy utilization through economic development for sustainable management in smart cities. Energy Rep. 2022, 8, 4975–4987. Available online: https://www.mdpi.com/2624-6511/5/3/46 (accessed on 8 August 2022). [CrossRef]
  34. Javed, A.R.; Shahzad, F.; Rehman, S.U.; Bin Zikria, Y.; Razzak, I.; Jalil, Z.; Xu, G. Future smart cities requirements, emerging technologies, applications, challenges, and future aspects. Cities 2022, 129, 103794. [Google Scholar] [CrossRef]
  35. Zhao, X.; Askari, H.; Chen, J. Nanogenerators for smart cities in the era of 5G and Internet of Things. Joule 2021, 5, 1391–1431. [Google Scholar] [CrossRef]
  36. Lewandowska, A.; Chodkowska-Miszczuk, J.; Rogatka, K.; Starczewski, T. Smart energy in a smart city: Utopia or reality? Evidence from Poland. Energies 2020, 13, 5795. [Google Scholar] [CrossRef]
  37. Umair, M.; Cheema, M.; Cheema, O.; Li, H.; Lu, H. Impact of COVID-19 on IoT adoption in healthcare, smart homes, smart buildings, smart cities, transportation and industrial IoT. Sensors 2021, 21, 3838. [Google Scholar] [CrossRef]
  38. Available online: https://www.bp.com/en/global/corporate/energy-economics/statistical-review-of-world-energy.html (accessed on 15 August 2022).
  39. Available online: http://static.government.ru/media/files/41d457592e04b76338b7.pdf (accessed on 2 May 2021).
  40. Available online: https://minenergo.gov.ru/node/1026 (accessed on 3 May 2021).
  41. Akin-Ponnle, A.; Carvalho, N. Energy harvesting mechanisms in a smart city—A review. Smart Cities 2021, 4, 476–498. Available online: https://www.mdpi.com/2624-6511/4/2/25 (accessed on 20 August 2022). [CrossRef]
  42. Hoang, A.T.; Nguyen, X.P. Integrating renewable sources into energy system for smart city as a sagacious strategy towards clean and sustainable process. J. Clean. Prod. 2021, 305, 127161. Available online: https://www.sciencedirect.com/science/article/abs/pii/S0959652621013809 (accessed on 20 August 2022). [CrossRef]
Figure 1. Span chart, compiled by the authors of the study.
Smartcities 05 00061 g001
Figure 2. Dendrogram using Ward’s method, compiled by the authors.
Smartcities 05 00061 g002
Figure 3. Comparison of results of cluster analysis.
Smartcities 05 00061 g003aSmartcities 05 00061 g003b
Figure 4. Energy consumption, world data, %.
Smartcities 05 00061 g004
Table 1. Comparison table for Diu and Georgetown.
City, CountryDiu, IndiaGeorgetown, USA
Year of foundation19471781
ContinentEuroasiaNorth America
Population (thousands)5270
Average temperature per year2820
Sun hoursFrom 5 to 10 DCFrom 5,4 to 10,6 DC
Source: Deloitte. Smart renewable cities, 2019; climate data URL: https://www.weather-atlas.com (accessed on 5 April 2021).
Table 2. Analytical data: population (million people), share of solar and wind energy (%), share of renewable energy (%), by city.
Adelaide, AustraliaHamburg, GermanyToronto, CanadaSeoul, South KoreaLondon, EnglandMadrid, Spain
Population, mln.2.71.82.810.38.63.2
Share of solar and wind energy, %42.214.8126. 610.923.7
Share of RES, %42.229.9368.324.641.2
Source: Deloitte. Smart renewable cities, 2019.
Table 3. Correlation matrix, compiled by the authors of the study.
x1x2x3x4x5x6
x11
x2−0.485851
x30.227669−0.326111
x40.104038−0.083180.7974641
x50.422393−0.31114−0.2678−0.310021
x60.0627570.159378−0.85096−0.76490.4852811
Table 4. KMO and Bartlett’s criterion, compiled by the authors KMO and Bartlett’s Test.
Kaiser-Meyer-Olkin Measure of Sampling Adequacy0.556
Bartlett’s Test of SphericityApprox. Chi-Square37.633
df10
Sig.0.000
Table 5. Cluster averages, compiled by the authors.
Final Cluster Centers
Cluster
123
Pop4.812.154.76
GDP per capita6722.16915801510562,728.04548073014040,801.245734884730
Investments10.7866.7267.24
Smart city index1619056
Income group211
Renewables (%)26.135.519.4
Table 6. Number of observations in each cluster, compiled by the authors.
Number of Cases in Each Cluster
Cluster17.000
28.000
310.000
Valid25.000
Missing98.000
Table 7. Energy consumption, %.
Share of RES Including HydroAnnual Growth
Year201720182019202020212018201920202021
Total North America11.511.311.613.013.0−1.82.512.5−0.1
Total S. & Cent. America31.132.633.235.833.64.91.87.9−6.2
Total Europe15.816.817.820.419.76.85.615.0−3.4
Total CIS6.26.06.26.86.5−3.22.211.0−5.3
Total Middle East0.70.51.31.11.0−22.3157.3−14.9−16.1
Total Africa7.88.28.69.69.65.64.712.5−0.7
Total Asia Pacific10.010.611.212.212.75.95.28.74.5
Total World11.411.712.213.513.53.44.29.90.1
Publisher’s Note: MDPI stays neutral with regard to jurisdictional claims in published maps and institutional affiliations.