
Exploring Lifestyles and Sensory Processing Patterns of Toddlers in Relation to Sleep Patterns Using Body Movement Analysis

 ,
,
Abstract
1. Introduction
2. Results
3. Discussion
4. Materials and Methods
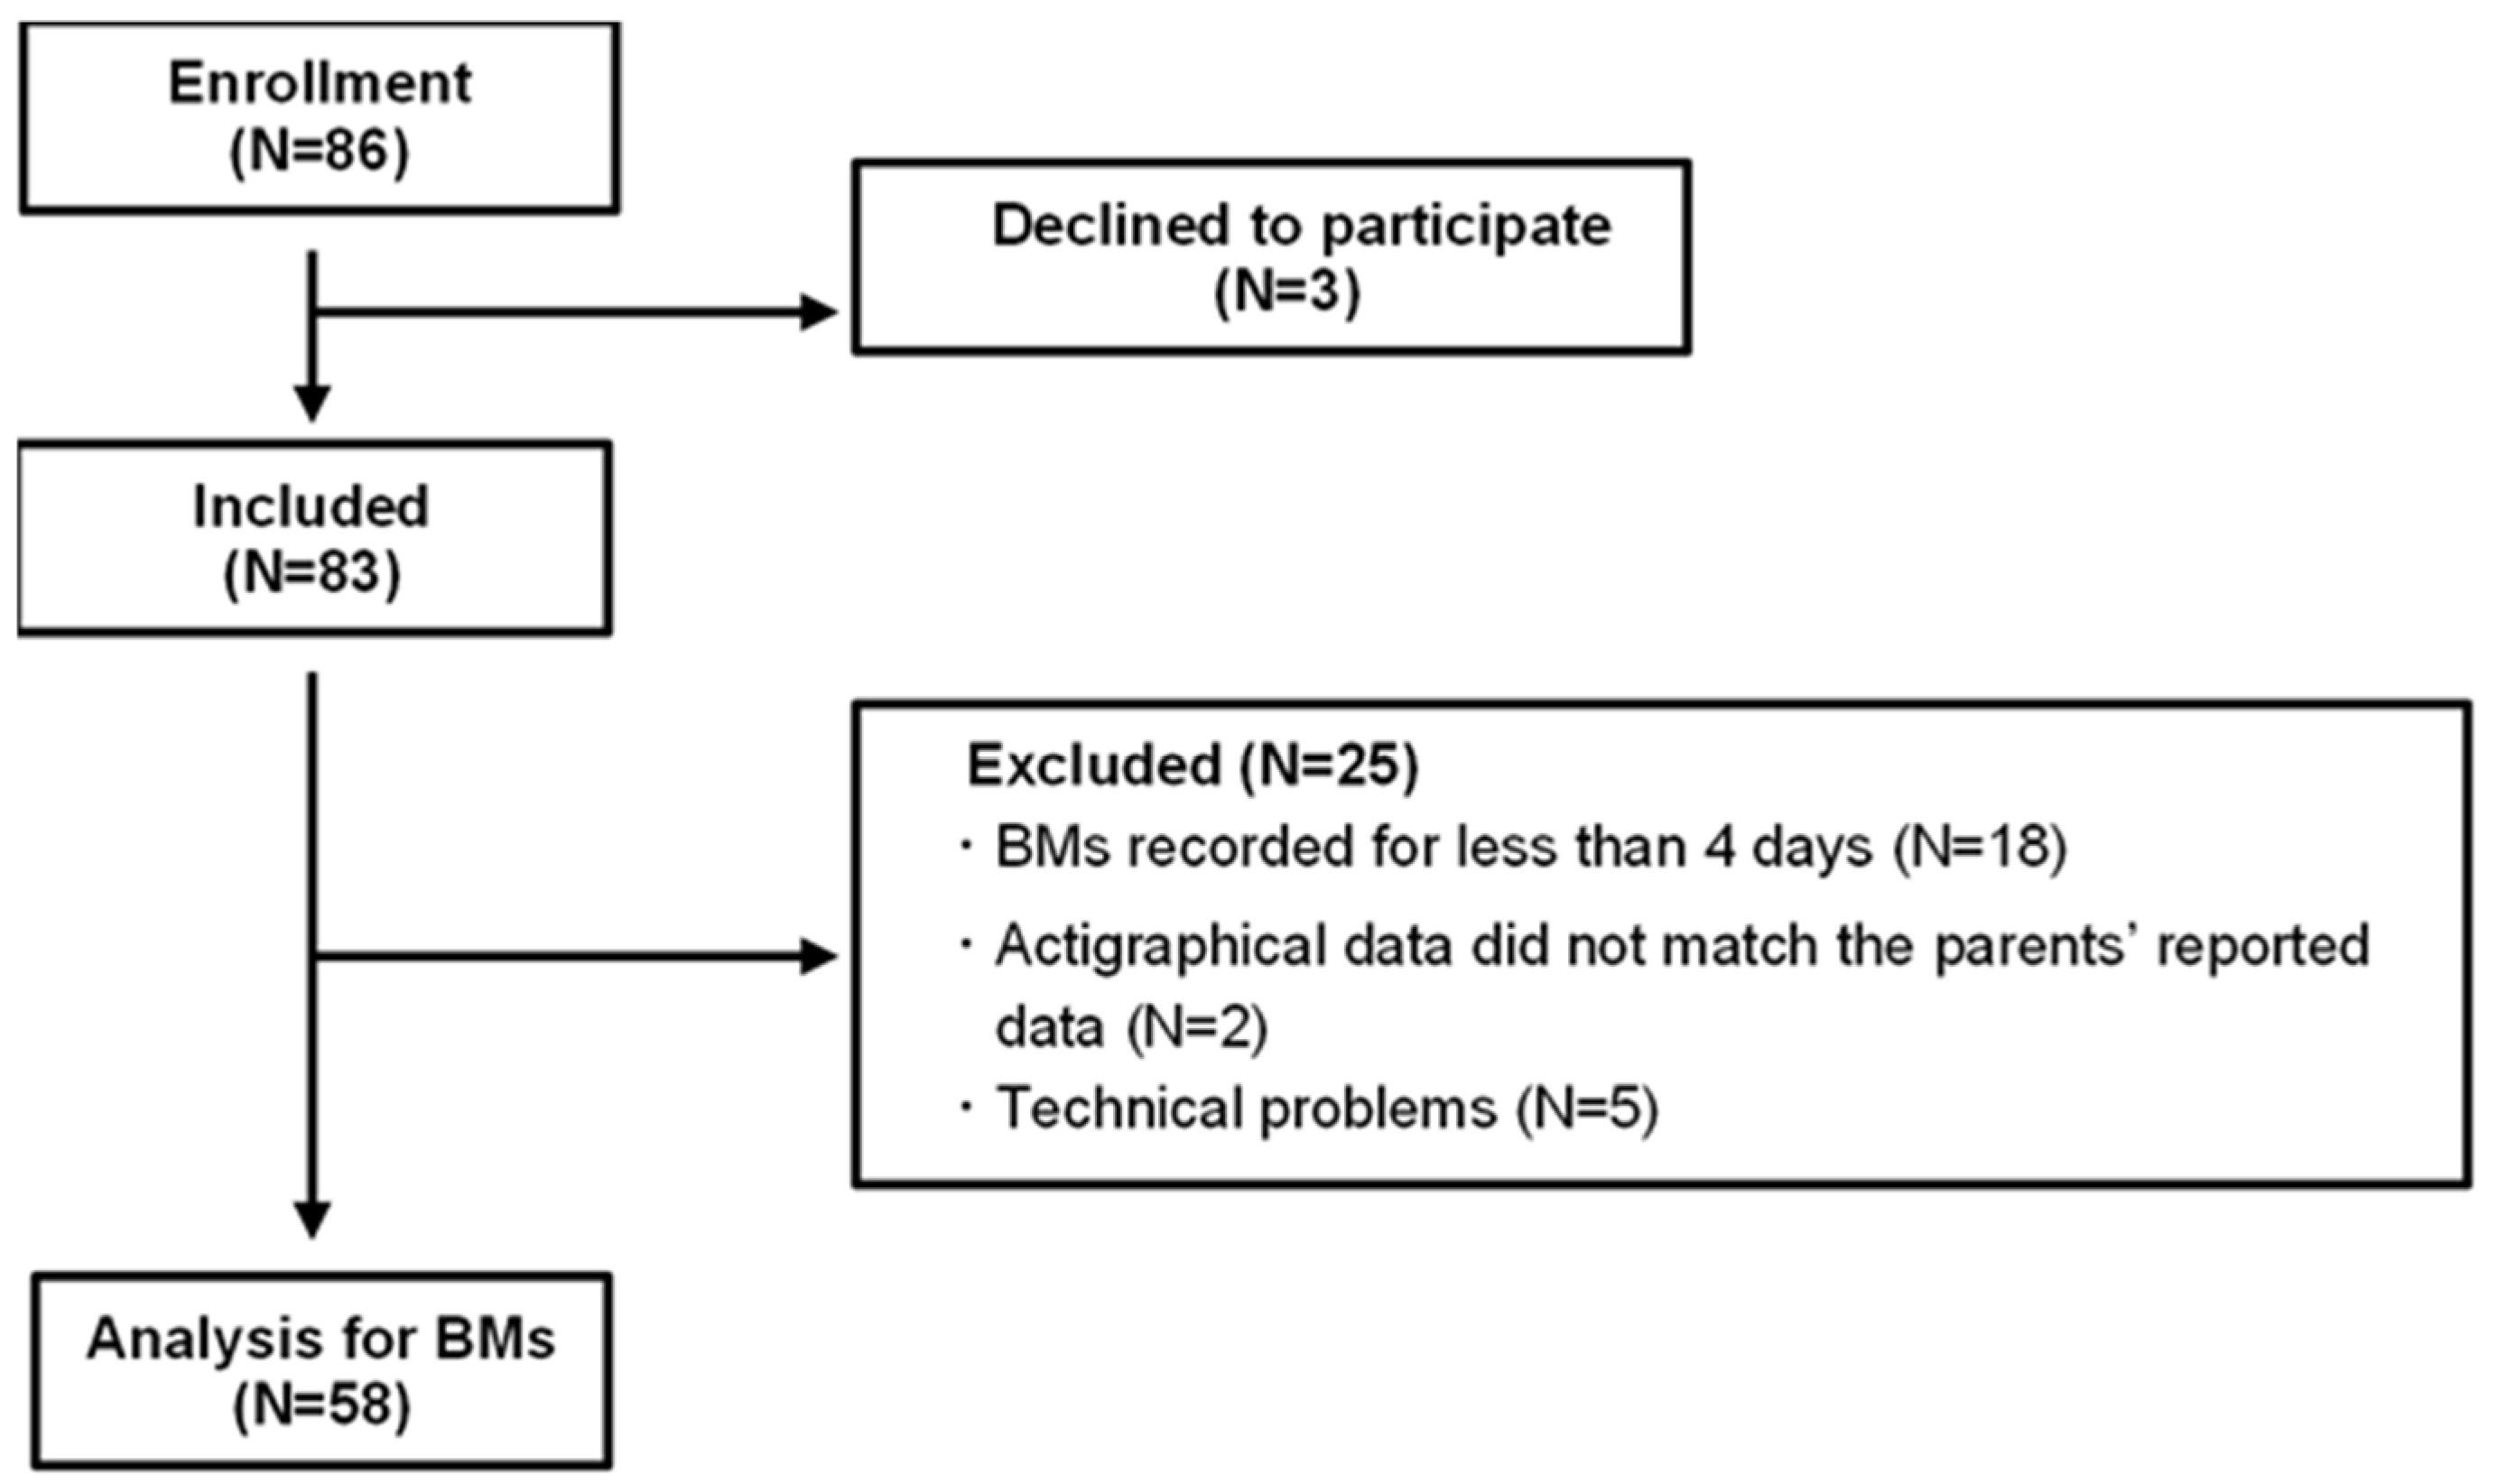
4.1. Participants
4.2. Actigraphy
4.3. Acquisition of Sleep-Related Habits and Sensory Processing Patterns
4.4. Statistics
5. Conclusions
Author Contributions
Funding
Institutional Review Board Statement
Informed Consent Statement
Data Availability Statement
Acknowledgments
Conflicts of Interest
Abbreviations
| SD | standard deviation |
| BMs | body movements |
| Total sleep BMs | BMs during overnight sleep |
| First 3 h BMs | BMs during the first 3 h of sleep from sleep onset |
| Last 3 h BMs | BMs during the last 3 h of sleep until the end of sleep |
References
- Walker, M.P.; van der Helm, E. Overnight therapy? The role of sleep in emotional brain processing. Psychol. Bull. 2009, 135, 731–748. [Google Scholar] [CrossRef] [PubMed]
- Walker, M.P.; Stickgold, R. Sleep, memory, and plasticity. Annu. Rev. Psychol. 2006, 57, 139–166. [Google Scholar] [CrossRef] [PubMed]
- Girardeau, G.; Lopes-Dos-Santos, V. Brain neural patterns and the memory function of sleep. Science 2021, 374, 560–564. [Google Scholar] [CrossRef] [PubMed]
- Besedovsky, L.; Lange, T.; Born, J. Sleep and immune function. Pflügers Arch.-Eur. J. Physiol. 2012, 463, 121–137. [Google Scholar] [CrossRef]
- Armstrong, J.M.; Ruttle, P.L.; Klein, M.H.; Essex, M.J.; Benca, R.M. Associations of child insomnia, sleep movement, and their persistence with mental health symptoms in childhood and adolescence. Sleep 2014, 37, 901–909. [Google Scholar] [CrossRef]
- Sadeh, A.; Mindell, J.A.; Luedtke, K.; Wiegand, B. Sleep and sleep ecology in the first 3 years: A web-based study. J. Sleep Res. 2009, 18, 60–73. [Google Scholar] [CrossRef]
- Berger, R.H.; Miller, A.L.; Seifer, R.; Cares, S.R.; Lebourgeois, M.K. Acute sleep restriction effects on emotion responses in 30- to 36-month-old children. J. Sleep Res. 2012, 21, 235–246. [Google Scholar] [CrossRef]
- Huhdanpää, H.; Morales-Muñoz, I.; Aronen, E.T.; Pölkki, P.; Saarenpää-Heikkilä, O.; Paunio, T.; Kylliäinen, A.; Paavonen, E.J. Sleep difficulties in infancy are associated with symptoms of inattention and hyperactivity at the age of 5 years: A longitudinal study. J. Dev. Behav. Pediatr. 2019, 40, 432–440. [Google Scholar] [CrossRef]
- Morales-Muñoz, I.; Broome, M.R.; Marwaha, S. Association of parent-reported sleep problems in early childhood with psychotic and borderline personality disorder symptoms in adolescence. JAMA Psychiatry 2020, 77, 1256–1265. [Google Scholar] [CrossRef]
- Reynaud, E.; Forhan, A.; Heude, B.; Charles, M.-A.; Plancoulaine, S.; EDEN Mother−Child Cohort Study Group. Night-waking and behavior in preschoolers: A developmental trajectory approach. Sleep Med. 2018, 43, 90–95. [Google Scholar] [CrossRef]
- Sadeh, A.; Tikotzky, L.; Kahn, M. Sleep in infancy and childhood: Implications for emotional and behavioral difficulties in adolescence and beyond. Curr. Opin. Psychiatry 2014, 27, 453–459. [Google Scholar] [CrossRef] [PubMed]
- Sivertsen, B.; Harvey, A.G.; Reichborn-Kjennerud, T.; Ystrom, E.; Hysing, M. Sleep problems and depressive symptoms in toddlers and 8-year-old children: A longitudinal study. J. Sleep Res. 2021, 30, e13150. [Google Scholar] [CrossRef] [PubMed]
- Lokhandwala, S.; Spencer, R.M.C. Relations between sleep patterns early in life and brain development: A review. Dev. Cogn. Neurosci. 2022, 56, 101130. [Google Scholar] [CrossRef] [PubMed]
- Byars, K.C.; Yeomans-Maldonado, G.; Noll, J.G. Parental functioning and pediatric sleep disturbance: An examination of factors associated with parenting stress in children clinically referred for evaluation of insomnia. Sleep Med. 2011, 12, 898–905. [Google Scholar] [CrossRef]
- De Stasio, S.; Boldrini, F.; Ragni, B.; Gentile, S. Predictive factors of toddlers’ sleep and parental stress. Int. J. Environ. Res. Public Health 2020, 17, 2494. [Google Scholar] [CrossRef]
- Oyetunji, A.; Chandra, P. Postpartum stress and infant outcome: A review of current literature. Psychiatry Res. 2020, 284, 112769. [Google Scholar] [CrossRef]
- Moorman, J.D.; Harrison, K. Beyond access and exposure: Implications of sneaky media use for preschoolers’ sleep behavior. Health Commun. 2019, 34, 529–536. [Google Scholar] [CrossRef]
- Henderson, J.A.; Jordan, S.S. Development and preliminary evaluation of the bedtime routines questionnaire. J. Psychopathol. Behav. Assess. 2010, 32, 271–280. [Google Scholar] [CrossRef]
- Janssen, X.; Martin, A.; Hughes, A.R.; Hill, C.M.; Kotronoulas, G.; Hesketh, K.R. Associations of screen time, sedentary time and physical activity with sleep in under 5s: A systematic review and meta-analysis. Sleep Med. Rev. 2020, 49, 101226. [Google Scholar] [CrossRef]
- Murata, E.; Yoshizaki, A.; Fujisawa, T.X.; Tachibana, M.; Taniike, M.; Mohri, I. What daily factors affect the sleep habits of Japanese toddlers? J. Clin. Sleep Med. 2023, 19, 1089–1101. [Google Scholar] [CrossRef]
- Ahn, R.R.; Miller, L.J.; Milberger, S.; McIntosh, D.N. Prevalence of parents’ perceptions of sensory processing disorders among kindergarten children. Am. J. Occup. Ther. 2004, 58, 287–293. [Google Scholar] [CrossRef] [PubMed]
- Galiana-Simal, A.; Vela-Romero, M.; Romero-Vela, V.M.; Oliver-Tercero, N.; García-Olmo, V.; Benito-Castellanos, P.J.; Muñoz-Martinez, V.; Beato-Fernandez, L. Sensory processing disorder: Key points of a frequent alteration in neurodevelopmental disorders. Cogent. Med. 2020, 7, 1736829. [Google Scholar] [CrossRef]
- Shochat, T.; Tzischinsky, O.; Engel-Yeger, B. Sensory hypersensitivity as a contributing factor in the relation between sleep and behavioral disorders in normal schoolchildren. Behav. Sleep. Med. 2009, 7, 53–62. [Google Scholar] [CrossRef] [PubMed]
- Kılıç, B.K.; Kayıhan, H.; Çifci, A. Sensory processing in typically developing toddlers with and without sleep problems. Infant Behav. Dev. 2024, 76, 101981. [Google Scholar] [CrossRef]
- Velluti, R.A. Interactions between sleep and sensory physiology. J. Sleep Res. 1997, 6, 61–77. [Google Scholar] [CrossRef]
- Fernández-Pires, P.; Valera-Gran, D.; Hurtado-Pomares, M.; Espinosa-Sempere, C.; Sánchez-Pérez, A.; Juárez-Leal, I.; Ruiz-Carbonell, M.P.; Peral-Gómez, P.; Campos-Sánchez, I.; Pérez-Vázquez, M.T.; et al. Sleep duration and quality and sensory reactivity in schoolaged children: The Spanish cross-sectional. Front. Pediatr. 2021, 9, 646011. [Google Scholar] [CrossRef]
- Allen, S.L.; Howlett, M.D.; Coulombe, J.A.; Corkum, P.V. ABCs of SLEEPING: A review of the evidence behind pediatric sleep practice recommendations. Sleep Med. Rev. 2016, 29, 1–14. [Google Scholar] [CrossRef]
- Okada, S.; Ohno, Y.; Shimizu, S.; Kato-Nishimura, K.; Mohri, I.; Taniike, M.; Makikawa, M. Development and preliminary evaluation of video analysis for detecting Gross movement during sleep in children. Biomed. Eng. Lett. 2011, 1, 220–225. [Google Scholar] [CrossRef]
- Wilde-Frenz, J.; Schulz, H. Rate and distribution of body movements during sleep in humans. Percept. Mot. Ski. 1983, 56, 275–283. [Google Scholar] [CrossRef]
- Krystal, A.D.; Edinger, J.D. Measuring sleep quality. Sleep Med. 2008, 9, S10–S17. [Google Scholar] [CrossRef]
- Sadeh, A. The role and validity of actigraphy in sleep medicine: An update. Sleep Med. Rev. 2011, 15, 259–267. [Google Scholar] [CrossRef] [PubMed]
- Smith, M.T.; McCrae, C.S.; Cheung, J.; Martin, J.L.; Harrod, C.G.; Heald, J.L.; Carden, K.A. Use of actigraphy for the evaluation of sleep disorders and circadian rhythm sleep-wake disorders: An American Academy of Sleep Medicine Clinical Practice Guideline. J. Clin. Sleep Med. 2018, 14, 1231–1237. [Google Scholar] [CrossRef] [PubMed]
- Yoshizaki, A.; Mohri, I.; Yamamoto, T.; Shirota, A.; Okada, S.; Murata, E.; Hoshino, K.; Kato-Nishimura, K.; Matsuzawa, S.; Kato, T.; et al. An interactive smartphone app, Nenne Navi, for improving children’s sleep: Pilot usability study. JMIR Pediatr. Parent. 2020, 3, e22102. [Google Scholar] [CrossRef] [PubMed]
- Meltzer, L.J.; Montgomery-Downs, H.E.; Insana, S.P.; Walsh, C.M. Use of actigraphy for assessment in pediatric sleep research. Sleep Med. Rev. 2012, 16, 463–475. [Google Scholar] [CrossRef]
- Ito, H.; Hirashima, T.; Hagiwara, T.; Iwanaga, R.; Tani, I.; Yikihiro, R. Standardization of the Japanese version of the sensory profile: Reliability and norms based on a community sample. Seishin Igaku 2013, 55, 537–548. [Google Scholar]
- Shimohira, M.; Shiiki, T.; Sugimoto, J.; Ohsawa, Y.; Fukumizu, M.; Hasegawa, T.; Iwakawa, Y.; Nomura, Y.; Segawa, M. Video analysis of gross body movements during sleep. Psychiatry Clin. Neurosci. 1998, 52, 176–177. [Google Scholar] [CrossRef]
- Tononi, G.; Cirelli, C. Sleep function and synaptic homeostasis. Sleep Med. Rev. 2006, 10, 49–62. [Google Scholar] [CrossRef]
- Walker, M.P.; Stickgold, R. Sleep-dependent learning and memory consolidation. Neuron 2004, 44, 121–133. [Google Scholar] [CrossRef]
- Borbély, A.A. A two process model of sleep regulation. Hum Neurobiol 1982, 1, 195–204. [Google Scholar]
- Borbély, A. The two-process model of sleep regulation: Beginnings and outlook. J. Sleep Res. 2022, 31, e13598. [Google Scholar] [CrossRef]
- Liu, A.; Fan, J.; Ding, C.; Yuan, F.; Gong, W.; Zhang, Y.; Song, C.; Zhou, Y.; Ding, G. The association of sleep duration with breakfast patterns and snack behaviors among Chinese children aged 6 to 17 years: Chinese National Nutrition and Health Surveillance 2010–2012. Nutrients 2022, 14, 2247. [Google Scholar] [CrossRef] [PubMed]
- Tambalis, K.D.; Panagiotakos, D.B.; Psarra, G.; Sidossis, L.S. Insufficient sleep duration is associated with dietary habits, screen time, and obesity in children. J. Clin. Sleep Med. 2018, 14, 1689–1696. [Google Scholar] [CrossRef] [PubMed]
- Fukuda, K.; Hasegawa, T.; Kawahashi, I.; Imada, S. Preschool children’s eating and sleeping habits: Late rising and brunch on weekends is related to several physical and mental symptoms. Sleep Med. 2019, 61, 73–81. [Google Scholar] [CrossRef] [PubMed]
- Tauman, R.; Levine, A.; Avni, H.; Nehama, H.; Greenfeld, M.; Sivan, Y. Coexistence of sleep and feeding disturbances in young children. Pediatrics 2011, 127, e615–e621. [Google Scholar] [CrossRef]
- BaHammam, A.S.; Pirzada, A. Timing matters: The interplay between early mealtime, circadian rhythms, gene expression, circadian hormones, and metabolism-A narrative review. Clocks Sleep 2023, 5, 507–535. [Google Scholar] [CrossRef]
- Jakubowicz, D.; Wainstein, J.; Landau, Z.; Raz, I.; Ahren, B.; Chapnik, N.; Ganz, T.; Menaged, M.; Barnea, M.; Bar-Dayan, Y.; et al. Influences of breakfast on clock gene expression and postprandial glycemia in healthy individuals and individuals with diabetes: A randomized clinical trial. Diabetes Care 2017, 40, 1573–1579. [Google Scholar] [CrossRef]
- Wehrens, S.M.T.; Christou, S.; Isherwood, C.; Middleton, B.; Gibbs, M.A.; Archer, S.N.; Skene, D.J.; Johnston, J.D. Meal timing regulates the human circadian system. Curr. Biol. 2017, 27, 1768–1775.e3. [Google Scholar] [CrossRef]
- Ogata, H.; Horie, M.; Kayaba, M.; Tanaka, Y.; Ando, A.; Park, I.; Zhang, S.; Yajima, K.; Shoda, J.I.; Omi, N.; et al. Skipping breakfast for 6 days delayed the circadian rhythm of the body temperature without altering clock gene expression in human leukocytes. Nutrients 2020, 12, 2797. [Google Scholar] [CrossRef]
- Lane, S.J.; Reynolds, S.; Thacker, L. Sensory over-responsivity and ADHD: Differentiating using electrodermal responses, cortisol, and anxiety. Front. Integr. Neurosci. 2010, 4, 603. [Google Scholar] [CrossRef]
- Yang, C.M.; Lo, H.S. ERP evidence of enhanced excitatory and reduced inhibitory processes of auditory stimuli during sleep in patients with primary insomnia. Sleep 2007, 30, 585–592. [Google Scholar] [CrossRef]
- Movahed, E.; Moradi, S.; Mortezagholi, B.; Shafiee, A.; Moltazemi, H.; Hajishah, H.; Siahvoshi, S.; Monfared, A.B.; Amini, M.J.; Safari, F.; et al. Investigating oral health among US adults with sleep disorder: A cross-sectional study. BMC Oral. Health 2023, 23, 996. [Google Scholar] [CrossRef] [PubMed]
- Mindell, J.A.; Meltzer, L.J.; Carskadon, M.A.; Chervin, R.D. Developmental aspects of sleep hygiene: Findings from the 2004 National Sleep Foundation Sleep in America Poll. Sleep Med. 2009, 10, 771–779. [Google Scholar] [CrossRef] [PubMed]
- de Souza, L.; Benedito-Silva, A.A.; Pires, M.L.N.; Poyares, D.; Tufik, S.; Calil, H.M. Further validation of actigraphy for sleep studies. Sleep 2003, 26, 81–85. [Google Scholar] [CrossRef] [PubMed]
- Blackwell, T.; Redline, S.; Ancoli-Israel, S.; Schneider, J.L.; Surovec, S.; Johnson, N.L.; Cauley, J.A.; Stone, K.L.; Study of Osteoporotic Fractures Research Group. Comparison of sleep parameters from actigraphy and polysomnography in older women: The SOF study. Sleep 2008, 31, 283–291. [Google Scholar] [CrossRef]
- Martin, J.L.; Hakim, A.D. Wrist actigraphy. Chest 2011, 139, 1514–1527. [Google Scholar] [CrossRef]
- Rowe, M.; McCrae, C.; Campbell, J.; Horne, C.; Tiegs, T.; Lehman, B.; Cheng, J. Actigraphy in older adults: Comparison of means and variability of three different aggregates of measurement. Behav. Sleep Med. 2008, 6, 127–145. [Google Scholar] [CrossRef]
- Nakazaki, K.; Kitamura, S.; Motomura, Y.; Hida, A.; Kamei, Y.; Miura, N.; Mishima, K. Validity of an algorithm for determining sleep/wake states using a new actigraph. J. Physiol. Anthr. 2014, 33, 31. [Google Scholar] [CrossRef]
- Matsuo, M.; Masuda, F.; Sumi, Y.; Takahashi, M.; Yamada, N.; Ohira, M.H.; Fujiwara, K.; Kanemura, T.; Kadotani, H. Comparisons of portable sleep monitors of different modalities: Potential as naturalistic sleep recorders. Front. Neurol. 2016, 7, 110. [Google Scholar] [CrossRef]
- Dunn, W.; Daniels, D.B. Initial development of the infant/toddler sensory profile. J. Early Interv. 2002, 25, 27–41. [Google Scholar] [CrossRef]


| Toddler Demographics (n = 58) | |
|---|---|
| Age in months, mean ± SD | 22.0 ± 2.0 |
| Sex, male, n (%) | 30 (51.7%) |
| Sleep onset, mean ± SD | 9:24 PM ± 0:48 |
| Sleep end, mean ± SD | 6:49 AM ± 0:40 |
| Total sleep time (min), mean ± SD | 564.8 ± 43.9 |
| Sleep latency (min), mean ± SD | 33.3 ± 16.3 |
| Net sleep time (min), mean ± SD | 397.6 ± 65.1 |
| Sleep efficiency (%), mean ± SD | 64.5 ± 8.5 |
| Consuming a substantial breakfast, n (%) | 42 (72.4%) |
| Play outside in the morning, n (%) | 30 (51.7%) |
| Nap end time, mean ± SD | 3:17 PM ± 1:08 |
| Daily screen time (min), mean ± SD | 92.0 ± 69.0 |
| Screen time of 1 h before bedtime, n (%) | 10 (17.2%) |
| Amounts of BMs | mean ± SD |
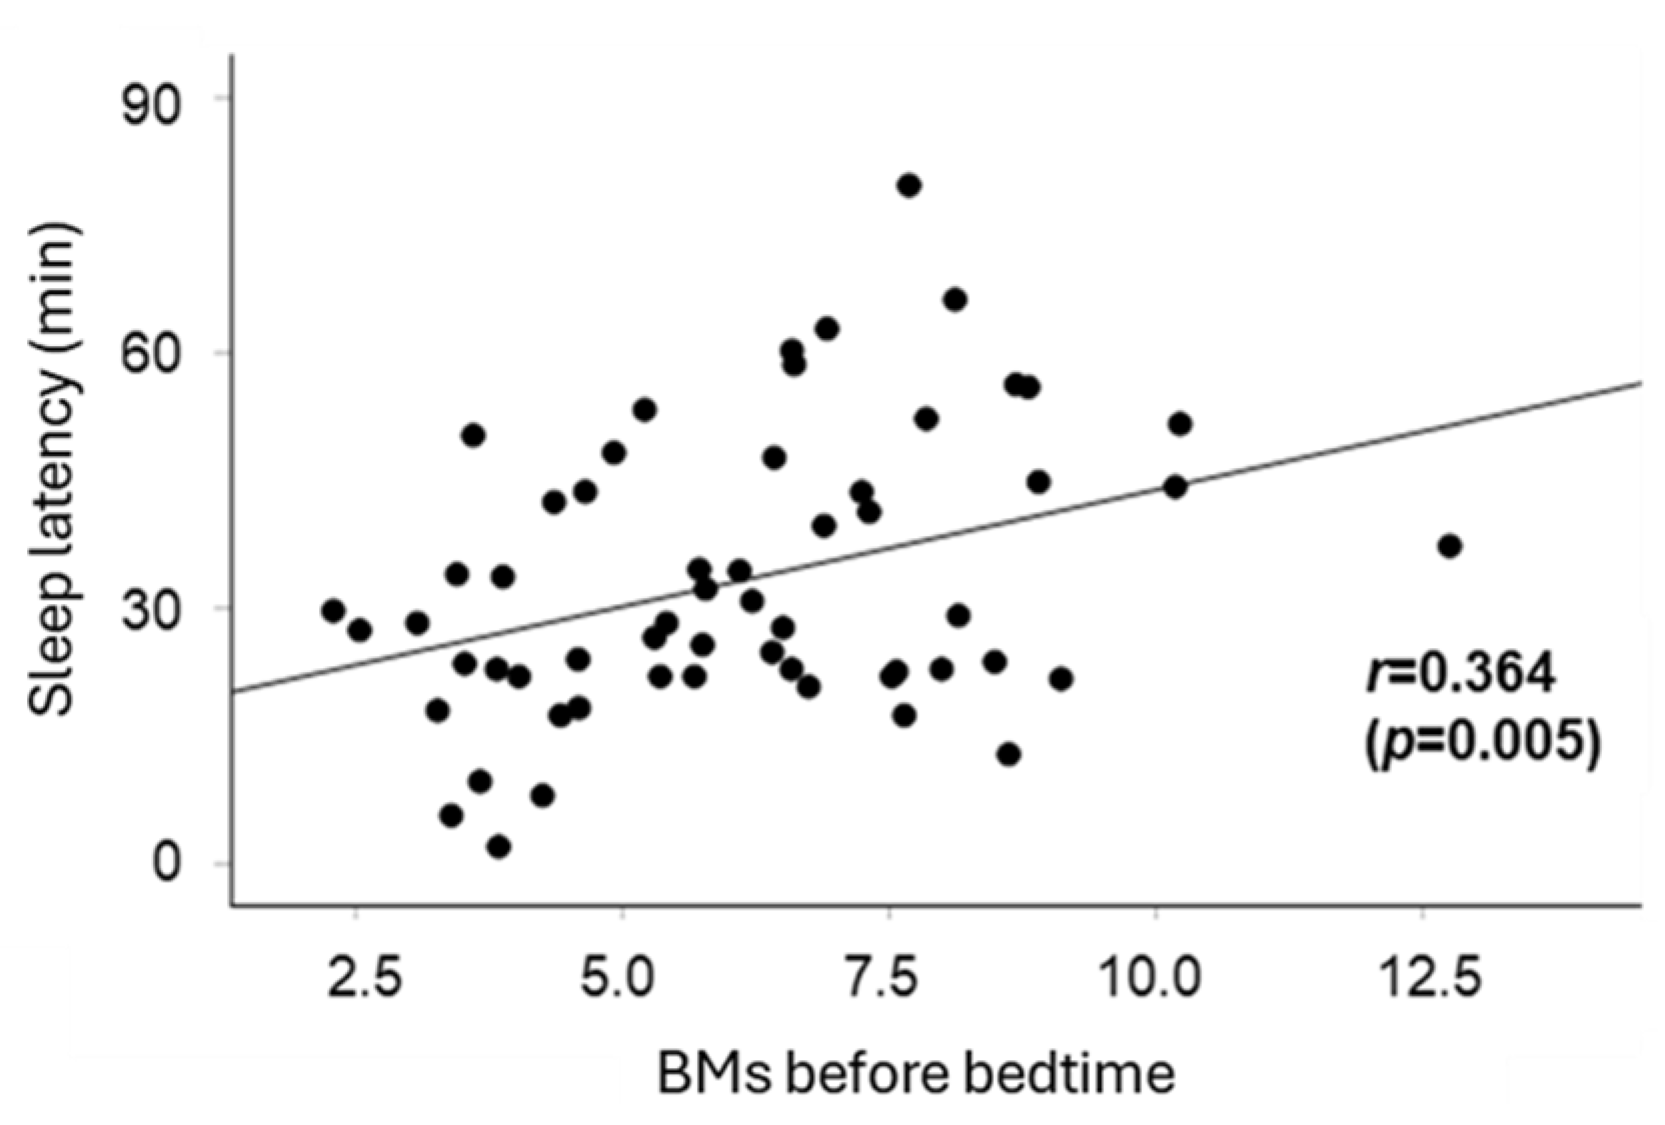
| BMs 1 h before bedtime | 6.12 ± 2.17 |
| Total sleep BMs | 0.43 ± 0.15 |
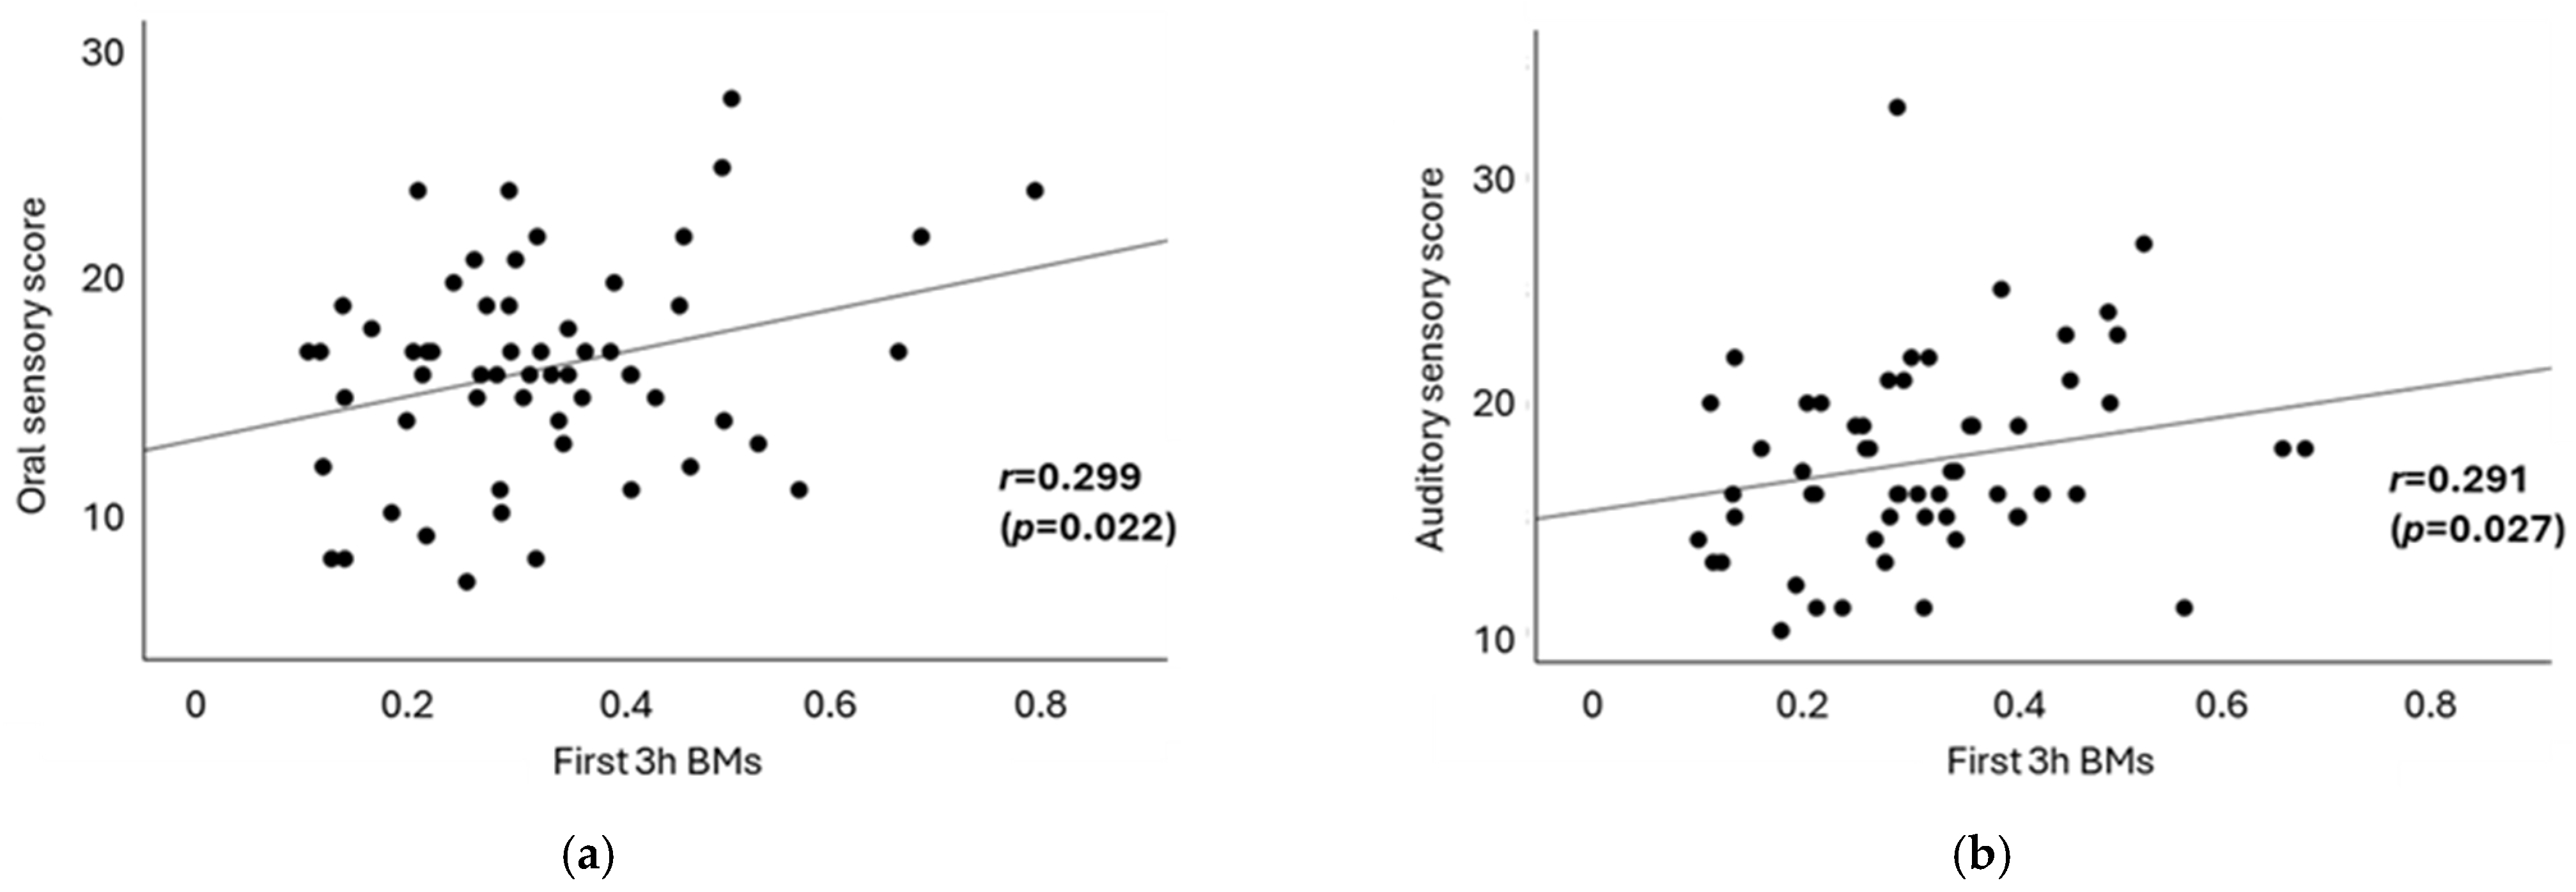
| First 3 h BMs | 0.29 ± 0.13 |
| Last 3 h BMs | 0.48 ± 0.16 |
| Sensory processing scores | mean ± SD (normal range) |
| Auditory sensory | 17.0 ± 4.0 (13–21) |
| Visual sensory | 18.0 ± 3.0 (13–20) |
| Tactile sensory | 29.0 ± 8.0 (21–36) |
| Vestibular sensory | 15.0 ± 3.0 (12–17) |
| Oral sensory | 16.0 ± 5.0 (10–18) |
| Sleep Latency (Time) (Adjusted R² = 0.22) | |||||
|---|---|---|---|---|---|
| Coefficient | p | 95% CI | |||
| (n = 58) | Lower | Upper | |||
| Consuming a substantial breakfast | −7.43 | 0.089 | −16.0 | 1.18 | |
| Playing outside in the morning | −4.50 | 0.245 | −12.2 | 3.19 | |
| Nap end time | 2.43 | 0.537 | −5.42 | 10.3 | |
| Daily screen time | −0.66 | 0.875 | −8.94 | 7.63 | |
| before bedtime | Screen time | 12.7 | 0.016 * | −2.49 | 22.8 |
| BMs | 2.86 | 0.003 * | 1.05 | 4.67 | |
| First 3 h BMs (Adjusted R² = 0.16) | Last 3 h BMs (Adjusted R² = −0.005) | ||||||||
|---|---|---|---|---|---|---|---|---|---|
| Coefficient | p | 95% CI | Coefficient | p | 95% CI | ||||
| (n = 58) | Lower | Upper | Lower | Upper | |||||
| Consuming a substantial breakfast | −0.096 | 0.009 ** | −0.17 | −0.03 | −0.097 | 0.317 | −1.50 | 0.05 | |
| Playing outside in the morning | 0.048 | 0.129 | −0.01 | 0.11 | 0.021 | 0.634 | −0.68 | 0.11 | |
| Nap end time | −0.066 | 0.046 * | −0.13 | −0.00 | −0.014 | −0.760 | −0.10 | 0.54 | |
| Daily screen time | −0.008 | 0.808 | −0.08 | −0.06 | 0.087 | 0.075 | −0.01 | 0.18 | |
| before bedtime | Screen time | 0.065 | 0.126 | −0.02 | 0.15 | 0.012 | 0.831 | −0.11 | 0.13 |
| BMs | 0.004 | 0.564 | −0.01 | −0.03 | 0.010 | 0.326 | −0.01 | 0.03 | |
| Sleep Latency | First 3 h BMs | Last 3 h BMs | |
|---|---|---|---|
| Auditory sensory | 0.167 | 0.291 * | 0.039 |
| Visual sensory | −0.276 * | −0.062 | −0.008 |
| Tactile sensory | 0.040 | 0.031 | 0.074 |
| Vestibular sensory | 0.064 | 0.131 | 0.147 |
| Oral sensory | 0.204 | 0.299 * | 0.137 |
Disclaimer/Publisher’s Note: The statements, opinions and data contained in all publications are solely those of the individual author(s) and contributor(s) and not of MDPI and/or the editor(s). MDPI and/or the editor(s) disclaim responsibility for any injury to people or property resulting from any ideas, methods, instructions or products referred to in the content. |
© 2025 by the authors. Licensee MDPI, Basel, Switzerland. This article is an open access article distributed under the terms and conditions of the Creative Commons Attribution (CC BY) license (https://creativecommons.org/licenses/by/4.0/).
Share and Cite
Ono, A.; Iwatani, Y.; Yoshizaki, A.; Nishimura, T.; Mohri, I.; Kagitani-Shimono, K.; Taniike, M. Exploring Lifestyles and Sensory Processing Patterns of Toddlers in Relation to Sleep Patterns Using Body Movement Analysis. Clocks & Sleep 2025, 7, 25. https://doi.org/10.3390/clockssleep7020025
Ono A, Iwatani Y, Yoshizaki A, Nishimura T, Mohri I, Kagitani-Shimono K, Taniike M. Exploring Lifestyles and Sensory Processing Patterns of Toddlers in Relation to Sleep Patterns Using Body Movement Analysis. Clocks & Sleep. 2025; 7(2):25. https://doi.org/10.3390/clockssleep7020025
Chicago/Turabian StyleOno, Azusa, Yoshiko Iwatani, Arika Yoshizaki, Tomoko Nishimura, Ikuko Mohri, Kuriko Kagitani-Shimono, and Masako Taniike. 2025. "Exploring Lifestyles and Sensory Processing Patterns of Toddlers in Relation to Sleep Patterns Using Body Movement Analysis" Clocks & Sleep 7, no. 2: 25. https://doi.org/10.3390/clockssleep7020025
APA StyleOno, A., Iwatani, Y., Yoshizaki, A., Nishimura, T., Mohri, I., Kagitani-Shimono, K., & Taniike, M. (2025). Exploring Lifestyles and Sensory Processing Patterns of Toddlers in Relation to Sleep Patterns Using Body Movement Analysis. Clocks & Sleep, 7(2), 25. https://doi.org/10.3390/clockssleep7020025