Article

Study of Aircraft Icing Forecasting Methods and Their Application Scenarios over Eastern China

1
College of General Aviation and Flight, Nanjing University of Aeronautics and Astronautics, Nanjing 210016, China
2
School of Science, Jiangnan University, Wuxi 214000, China
*
Author to whom correspondence should be addressed.
Forecasting 2025, 7(3), 53; https://doi.org/10.3390/forecast7030053
Submission received: 4 July 2025 / Revised: 9 September 2025 / Accepted: 16 September 2025 / Published: 22 September 2025

Abstract

In this study, an aircraft icing diagnosis and forecasting method is constructed and hindcast for 25 collected spring icing cases over Eastern China based on two commonly used aircraft icing diagnostic methods (hereinafter referred to as the IC index method and the TF empirical method, respectively) and ERA5 reanalysis data as the atmospheric environmental field for icing occurrence. The spatial and temporal distribution characteristics of aircraft icing accumulation occurrence over typical cities at different latitudes in China are calculated separately, and the spatial and temporal distribution of icing accumulation areas over Xinchang, Zhejiang Province in China during one case of cold air activity is simulated. Accordingly, several application scenarios for the application of methods to forecast aircraft icing accumulation are proposed. The results indicate that among the selected icing cases, the diagnosis accuracy of the IC index method and the TF empirical method is 80% and 92%, respectively. The TF empirical method takes into account the effects of aircraft flight speed and dynamic warming, and shows better correlation with ice water particle concentration and cloud cover in medium and low clouds. However, the predicted icing accumulation intensity predicted by the TF empirical method is not accurate enough without the real flight speed of the aircraft, and there are more empty forecasts above 400 hPa. In practical applications, both the IC index method and the TF empirical method can effectively identify the icing-prone pressure levels and time periods and forecast the distribution of icing accumulation intensity at high pressure levels for a given station.

1. Introduction

According to Federal Aviation Administration statistics, there were about 380 flight incidents related to aircraft icing from 2015 to 2020 [1,2]. At present, China’s aviation industry has developed rapidly, and civil aviation activities have become increasingly frequent, including daytime cross-regional flights, night flights, and flights under complex meteorological conditions. Consequently, the possibility of aircraft encountering icing has greatly increased. The busy airspace over Eastern China is one of the regions where aircraft are most threatened by icing. Aircraft icing occurs when ice forms on certain parts of the aircraft surface, typically caused by supercooled water droplets in clouds or precipitation colliding with the fuselage or direct condensation of water vapor on the fuselage surface [3,4]. Aircraft icing affects aerodynamic performance by reducing lift, increasing drag, and compromising the stability and operability of the aircraft, which in severe cases, can lead to major accidents [5]. Therefore, accurately predicting aircraft icing remains a critical technical challenges to be solved in aviation meteorology.
The formation of the aircraft icing requires meeting three meteorological conditions, which are, respectively, sufficient supercooled water droplets, an ambient temperature below 0 °C, and an aircraft surface temperature below 0 °C [6]. To date, many studies have proposed different aircraft icing prediction methods based on various meteorological conditions, such as the widely used icing (IC) index method [7], false frost points temperature (TF) empirical method [8], RAP (Research Applications Program icing scheme) [9] index method, RAOB (Radiosonde Observation icing scheme by the US Air Force Global Weather Center) [10] method, I icing index method [11,12], and the Wiliam algorithm [13], etc. Some studies have compared the above-mentioned aircraft icing prediction methods [12,14]. Liu et al. [15] statistically verified the diagnostic effects of three methods, namely the RAP index method, IC index method, and RAOB method, on icing intensity, and the results showed that the IC index method and RAOB method better predicted aircraft icing accumulation. Zhang et al. [10] conducted a cloud microphysical process analysis of a cold front weather system in the Jianghuai region, and employed the IC index method and the Wiliam algorithm for aircraft icing prediction and diagnosis by using the National Centers for the Environmental Prediction (NCEP) reanalysis data and the icing accumulation report data. In addition, many studies have proposed various aircraft icing prediction models according to these new methods. Zhao et al. [16] constructed a model for diagnosing aircraft icing potential and conducted a statistical analysis of the frequency of aircraft icing on a global scale based on the cloud detection satellite CloudSat products. Qi et al. [17] defined a new icing index based on fuzzy logic membership functions, which takes into account temperature, relative humidity, vertical velocity, and cloud cover as discrimination factors, and the results indicated that the accuracy of aircraft icing prediction using the new method is higher than the commonly used RAOB method. Bian et al. [11] used seven common icing prediction methods to simulate the occurrence of icing, and a comprehensive prediction model for icing intensity based on scoring weight integration method was established by using the icing accumulation case data obtained from artificial rainfall operations; the results demonstrated that the IC index method and TF empirical method have the highest prediction accuracy among the seven icing prediction methods when they are used for comprehensive icing forecasting. In addition, some studies have pointed out that numerical simulation using different reanalysis data can improve the accuracy and rationality of aircraft icing prediction methods [18,19,20,21,22]. Sergio et al. [23] compared the accuracy of different data in ice accumulation prediction based on the National Centers for the Environmental Prediction (NCEP) reanalysis data, European Reanalysis-Interim (ERA-Interim) data, and Japanese 55-year Reanalysis (JRA-55) data. Merinso et al. [24] used numerical simulation to analyze the meteorological conditions of aircraft icing based on the NCEP reanalysis data, and found that cloud microphysical structures were consistent with the actual measurements. Current studies mainly focuses on icing accumulation prediction algorithms or parameterization schemes.
With the improvement of numerical forecasting models and the advancement of atmospheric remote sensing detection technology, there are more ways to analyze and predict aircraft icing. Of course, it is inevitable that each method has its own advantages and disadvantages, which makes icing accumulation forecasting still not accurate enough. Therefore, it is particularly important to quantitatively evaluate different methods and improve the prediction accuracy of icing. Moreover, few studies have paid attention to the application scenarios of icing prediction algorithms in China, mainly due to a lack of the icing accumulation data.
Given that, this study investigated the aircraft icing forecasting methods and their application scenarios in East China based on the PIREP (Pilot Report) data. This study is organized as follows. In Section 2, we introduce the icing accumulation data, and then describe two aircraft icing diagnostic algorithms used in this study. In Section 3, we test the icing accumulation diagnosis algorithm based on the 25 cases of icing accumulation reported over Eastern China in 2023. In Section 4, we calculate the spatio-temporal distribution characteristics of aircraft icing occurrence over typical cities at different latitudes in China, and simulate the spatio-temporal distribution of icing areas over Xinchang, Zhejiang Province, China, during one case of cold air activity. In Section 5, we analyze the spatiotemporal distribution of icing accumulation in East China in March, and propose several application scenarios of aircraft icing forecasting methods. In Section 6, we present the discussion and conclusions.

2. Data and Methods

2.1. Icing Accumulation Data

The best information available on aircraft icing comes from pilots reports, known as PIREP data. All pilots should be requested to promptly report the location(s), time (Universal Time Coordinated, UTC), altitude, aircraft type, temperature, and icing intensity and type (clear ice, rime ice, mixed ice, or frost) of the icing to the facility with which they are maintaining radio contact. The 25 aircraft icing cases used in this study are derived from the PIREP data over Eastern China in 2023 from the Civil Aviation Meteorological Center. The European Reanalysis-5 (ERA5) data derived from the European Centre for Medium Range Weather Forecasts (ECMWF) are used for simulation, with a horizontal resolution of 0.25° × 0.25° and a time resolution of 1 h (24 times in a day). The ERA5 data has 37 layers ranging in height from 1000 hPa to 1 hPa. In this study, temperature, relative humidity, and liquid water content in clouds are the main atmospheric variables used to diagnose icing accumulation.

2.2. Icing Accumulation Diagnosis Algorithms

At present, there are five commonly used icing accumulation diagnosis methods: the I index method, RAOB method, RAP method, IC index method, and TF empirical method. In general, the I index method and RAOB method have high false report probability, and the RAP method can only estimate the presence or absence of the icing accumulation but cannot determine the intensity and potential of icing accumulation [1,11]. Consequently, this study primarily analyzes the IC index method and the TF empirical method and tests their prediction performance.
(1)
IC index method
An aircraft is most prone to icing when encountering supercooled water droplets at ambient temperatures of −14~0 °C, with the strongest icing accumulation occurring at −9~−5 °C [9]. The IC index method is an icing accumulation diagnostic method recommended by the International Civil Aviation Organization (ICAO) that determines whether there is icing accumulation based on the temperature and relative humidity conditions in the area where the aircraft is located. The IC index method is expressed as follows [7]:
I C = 2 R H 50 % T T + 14 / 0.3 / 49 ,
where IC is the icing accumulation index (unit: %), RH is the relative humidity (unit: %), and T is the ambient temperature (unit: °C). Table 1 shows the icing accumulation intensity criteria of the IC index method.
(2)
TF empirical method
Compared to the frost point method, the TF empirical method determines icing accumulation by assessing the degree of water vapor saturation in clouds, considering the dynamic warming of the aircraft and the temperature and humidity conditions at flight altitude [8]. This method most closely reflects the actual conditions of icing accumulation. The TF empirical method is described in Equation (2):
T f i = 0.15 × V 100 2 × T T d
where Tfi is the false frost point temperature (unit: °C), V is the flight speed relative to the air (unit: 100 km·h−1), T is the temperature (unit: °C), and Td is the dew point temperature (unit: °C). Table 2 displays the icing accumulation intensity criteria of the TF empirical method.
Since ERA5 reanalysis data do not provide the dew point temperature at each pressure level, we use the Magnus-Tetens model [25] to estimate the dew point temperatures at each pressure level using the temperature and relative humidity; thus, the icing criterion can be simplified as follows:
T F i = T f i T + 0.15 V 100 2
where TFi > 0 indicates there is icing accumulation, and TFi ≤ 0 indicates there is no icing accumulation. The larger TFi is, the stronger the icing accumulation intensity.

3. Testing of Icing Accumulation Diagnosis Algorithms

The IC index method and the empirical TF method are tested based on the 25 reported cases of icing accumulation and ERA5 data over Eastern China (24°~35° N, 103°~125° E); the verification results of the icing accumulation are shown in Table 3. It is worth noting that there is no flight speed in these true cases. Thus, in the simulations, the hypothetical airspeed is adopted, assuming that the aircraft is in a cruise state. The flight speed is considered the cruising speed of four types of aircraft, Yun 8, B737, A320, and Yi 76, which have flight speeds of 550, 828, 955, and 800 km·h−1, respectively (Table 3). To evaluate the icing accumulation prediction methods, the possible scenarios are divided into four types: icing accumulation predicted and observed, recorded as event A; no icing accumulation predicted and observed, recorded as event B; icing accumulation predicted but not observed, recorded as event C; and no icing accumulation predicted but observed, recorded as event D. According to Brown et al. [26], the statistical indicators for testing can be expressed as follows:
Accuracy rate = (A + D)/(A + B + C + D)
Empty reporting rate = C/(A + C)
Misreporting rate = B/(B + D)
Combined Table 3 and Equation (4), the IC index method correctly predicted 14 times out of 19 cases with icing accumulation, missed 5 times, and correctly predicted 6 times out of 6 cases without icing accumulation. The accuracy of the IC method’s diagnosis and prediction is 80%. The TF empirical method correctly predicted 19 times out of 19 cases with icing accumulation, predicted 4 times out of 6 cases without icing accumulation well, and reported no data 2 times. The accuracy of the TF empirical method’s diagnosis and prediction is 92%, but it tends to overestimate the intensity of icing accumulation. In 19 cases below 5000 m, the IC index method successfully predicted 17 times (4 times with severe icing) and missed 2 times, with an accuracy rate of 89.5%. The TF empirical method successfully predicted 19 times (4 times with severe icing), with an accuracy rate of 100%. Among the 6 cases above 5000 m, the IC index method successfully predicted 3 times and missed 3 times, with a prediction accuracy of 50%. The TF empirical method successfully predicted 4 times (2 times with severe icing) and missed 2 times, with a prediction accuracy of 66.7%. In the test, both methods can effectively predict the occurrence of icing accumulation. The TF empirical method has a higher accuracy, but the two methods have significant differences in accuracy in mid-low altitudes (below 5000 m) and high altitudes (above 5000 m) predictions. The accuracy of mid-low altitude predictions is much higher than that of high altitude predictions, while the TF empirical method has a higher accuracy than the IC index method. The IC index method is prone to misreporting, while the TF empirical method is prone to empty reporting. Next, we introduce an example of icing accumulation for analysis.
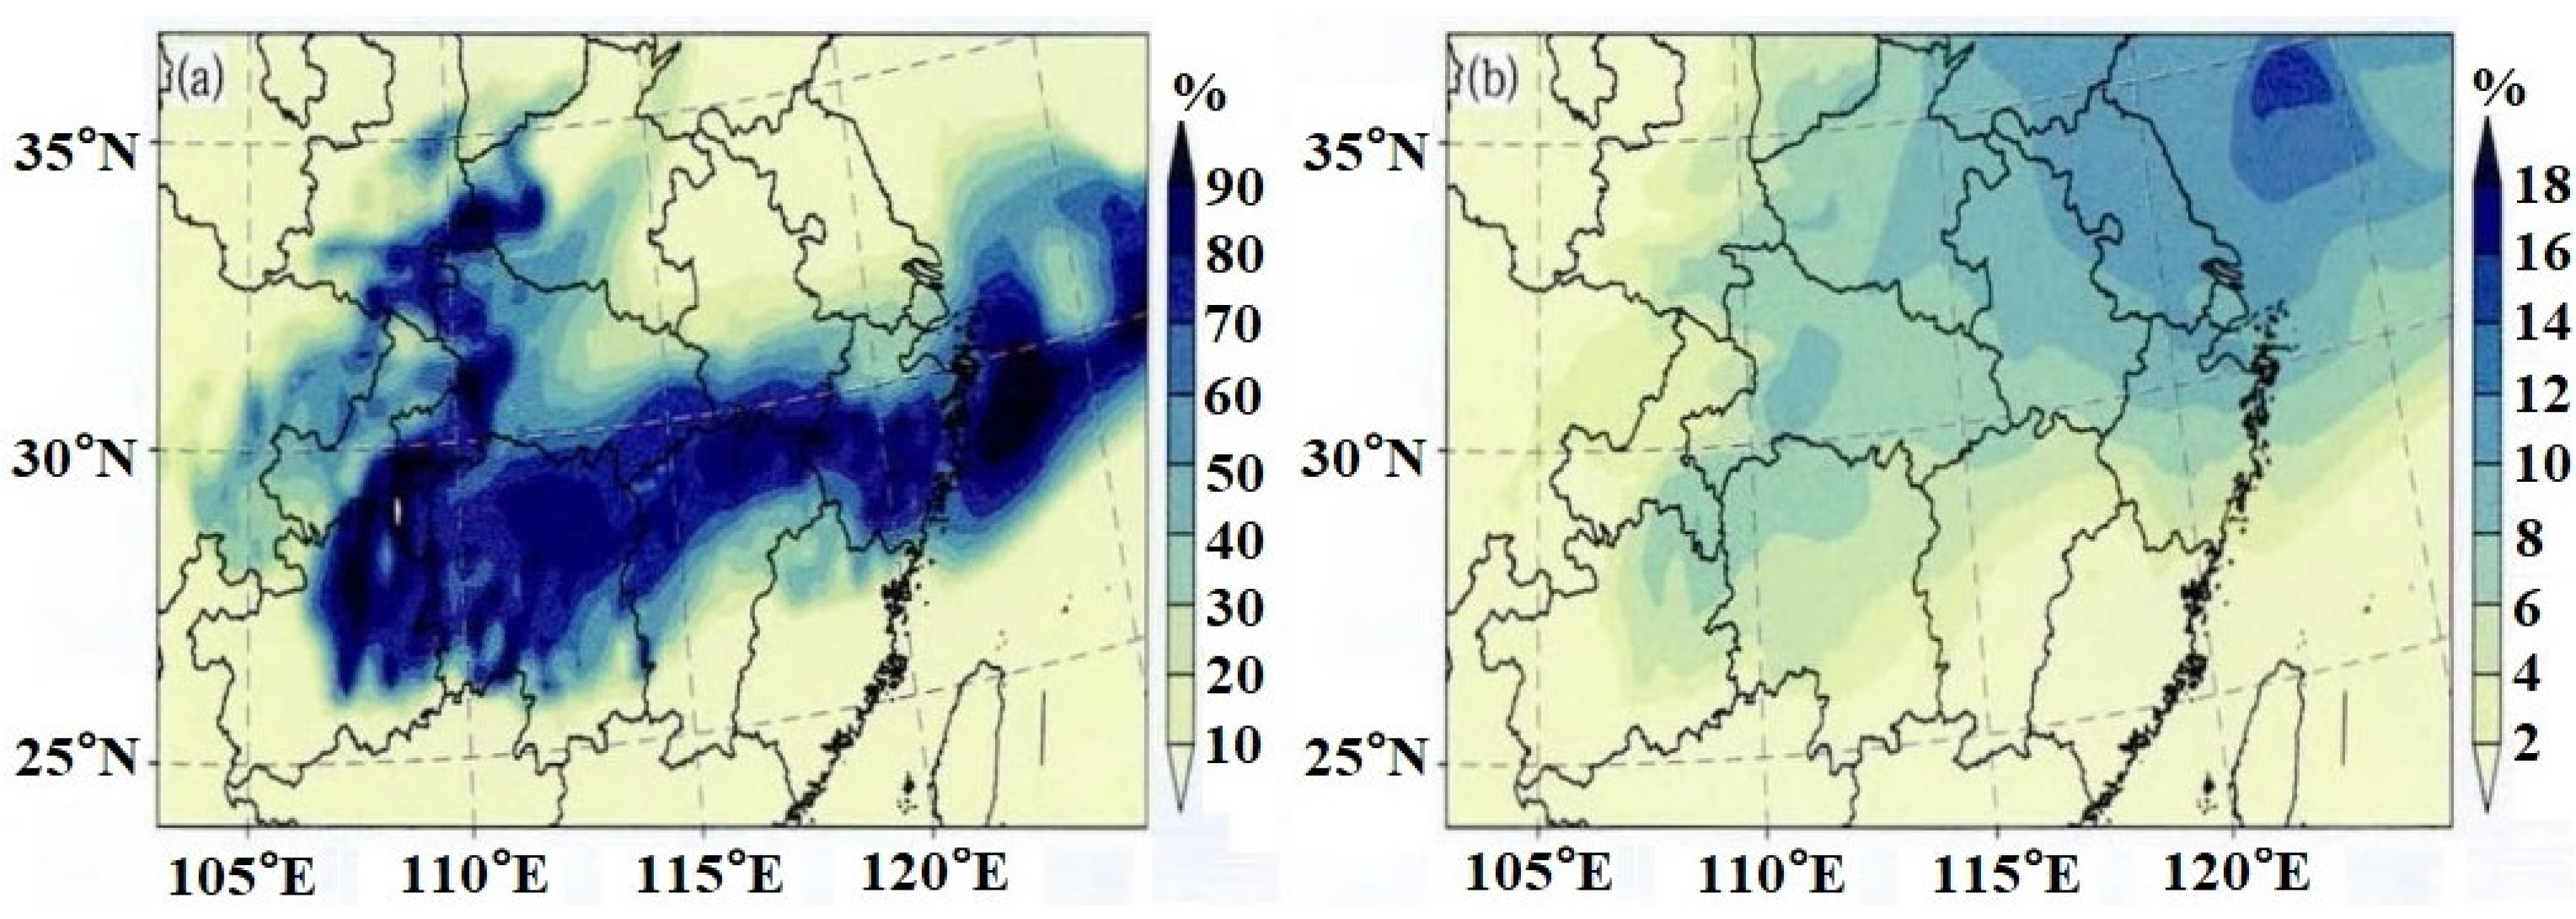
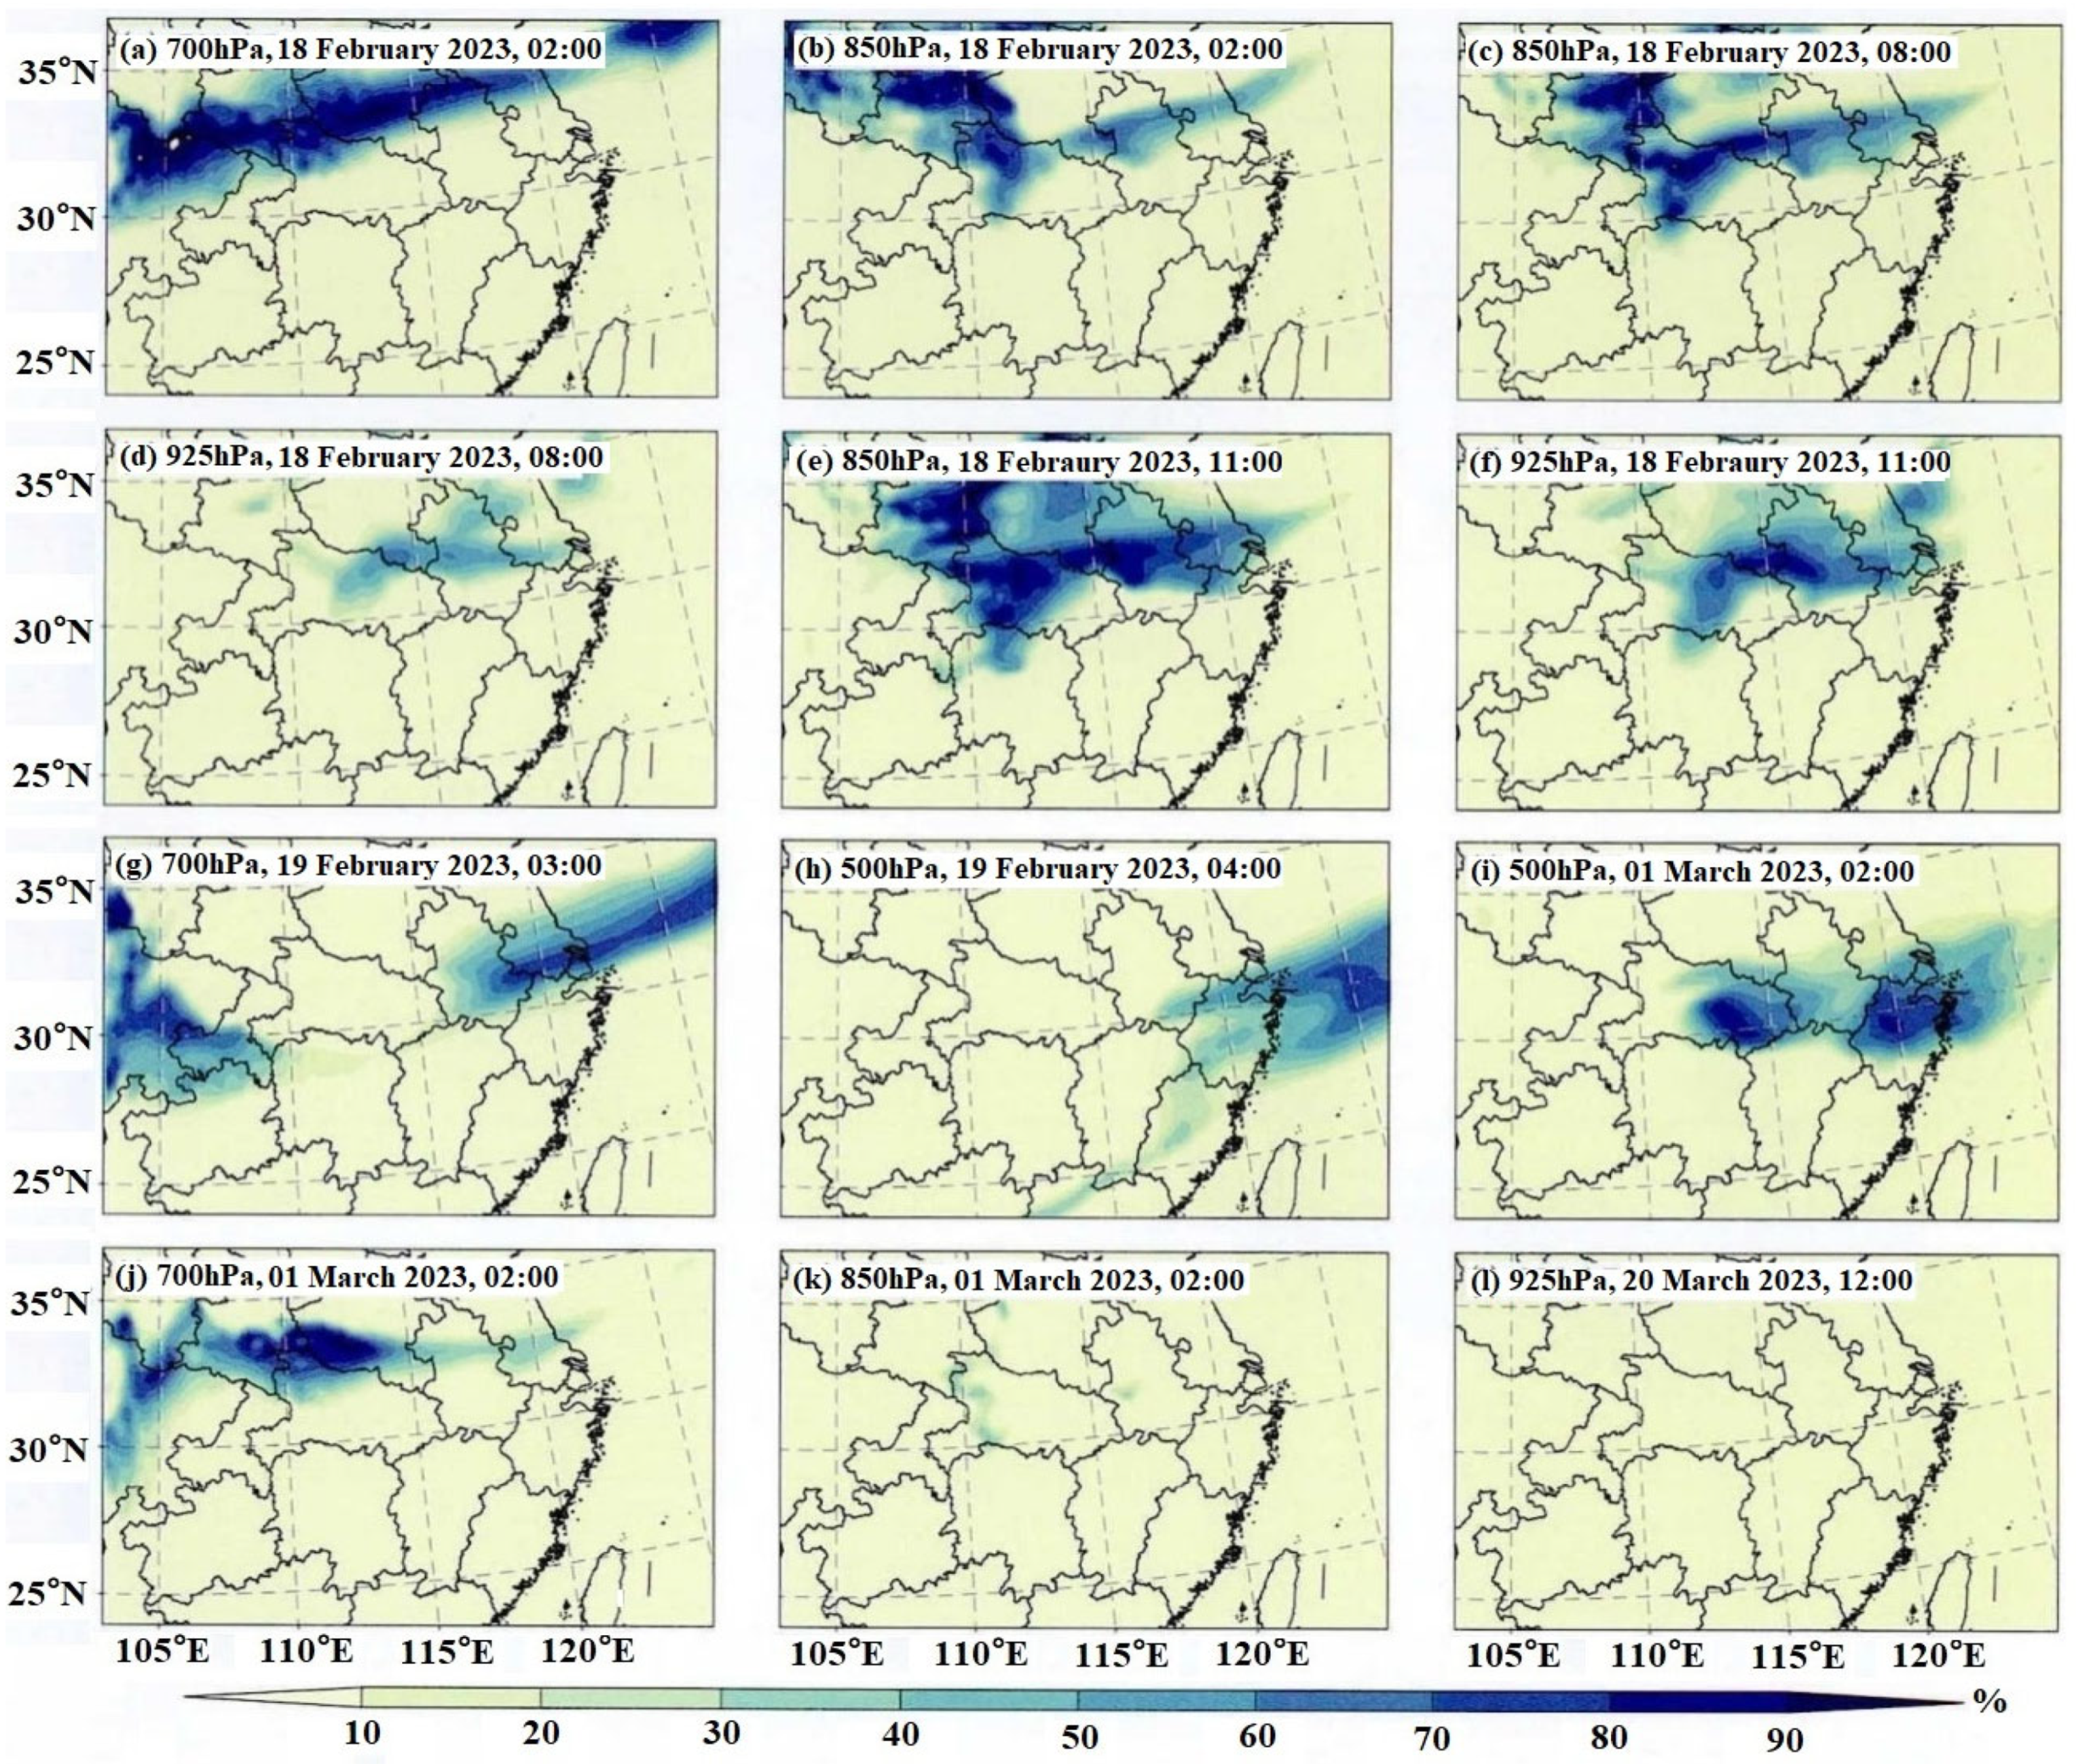
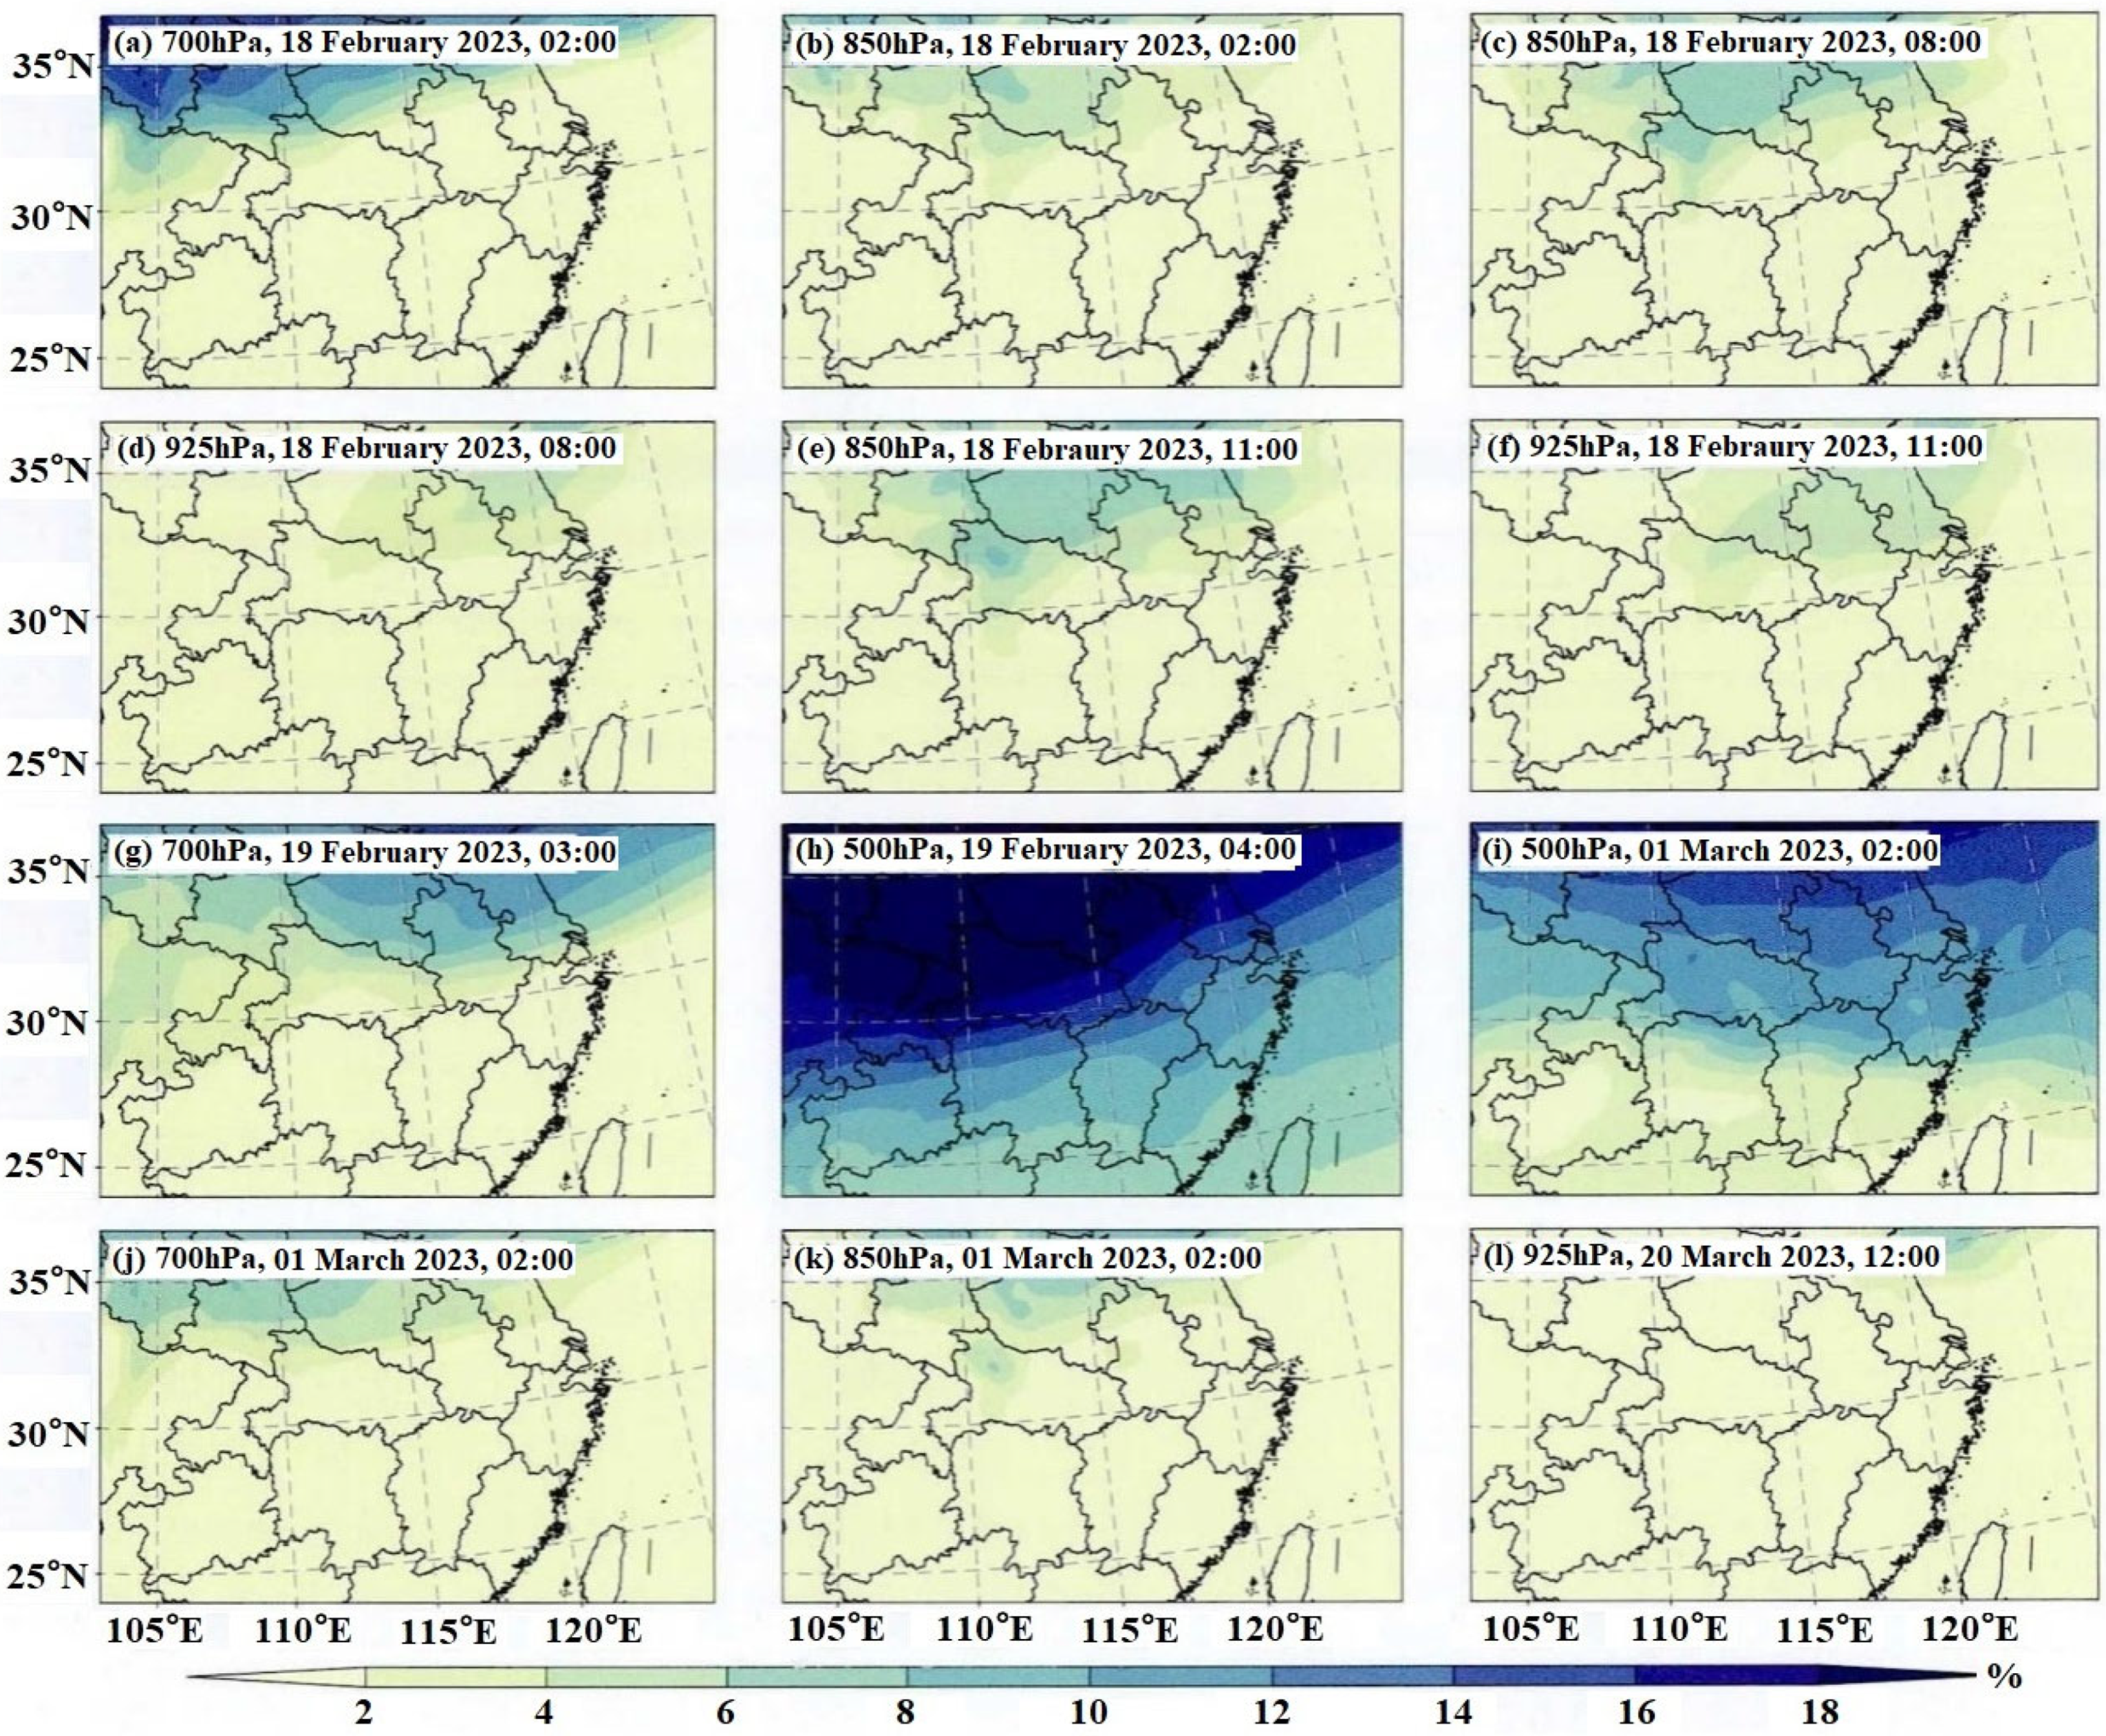
At 09:00 on 8 February 2023 (UTC, the same below), a B737 aircraft encountered icing accumulation over Wuxi, Jiangsu Province and sent flight reports at 3000 m and 1500 m (serial numbers 7 and 8 in Table 3), which approximately corresponded to pressure levels of 700 hPa and 850 hPa. Figure 1 and Figure 2 present the distribution of the icing accumulation intensity at the height where the seventh and eighth icing accumulation cases occurred, respectively. According to ERA5 data, the liquid water content in clouds over the Jiangsu region is greater than 0 g·m−3, indicating the presence of liquid water in the icing area. The simulation results are consistent with the situation of aircraft icing occurring at 3000 m and 1500 m above the central and southern parts of Jiangsu Province in the aircraft report. However, the icing accumulation range calculated by the IC index method is relatively low, and it has limited diagnostic ability for high-altitude icing accumulation. The TF empirical method has better predictive ability, but the calculated icing accumulation intensity is slightly higher, which may result in empty reports. The icing accumulation intensity at each pressure level for cases 12 to 23 are displayed in Figure 3 and Figure 4. It is clear that the IC index method performs well between 700 hPa and 500 hPa, where light or above-average icing accumulation occurred, while the TF empirical method can properly simulate icing accumulation between 850 hPa and 500 hPa. In general, strong icing accumulation is prone to occur at 500 hPa, with a wider coverage range. These results are consistent with the flight report.
In conclusion, the TF empirical method takes into account the effects of aircraft flight speed and dynamic warming, and has a higher accuracy in predicting icing accumulation over the East China region in spring. It can effectively predict icing accumulation at different pressures or heights, with a significantly lower misreporting rate than the IC index method. However, in the simulation, the aircraft cruising speed is the same as the flight speed, without considering the influence of wind, which may be different from actual situations. The IC index method calculates the potential of icing accumulation based on the atmospheric temperature and relative humidity, and the results actually reflect the possibility of icing accumulation under these environmental background. The IC index method results in fewer missing reports compared to the IF empirical method at high altitudes. Therefore, in cases where wind field conditions and flight speed are uncertain, the IC index method may be more reliable and can be combined with two algorithms in practical applications.

4. Analysis of an Icing Accumulation Process

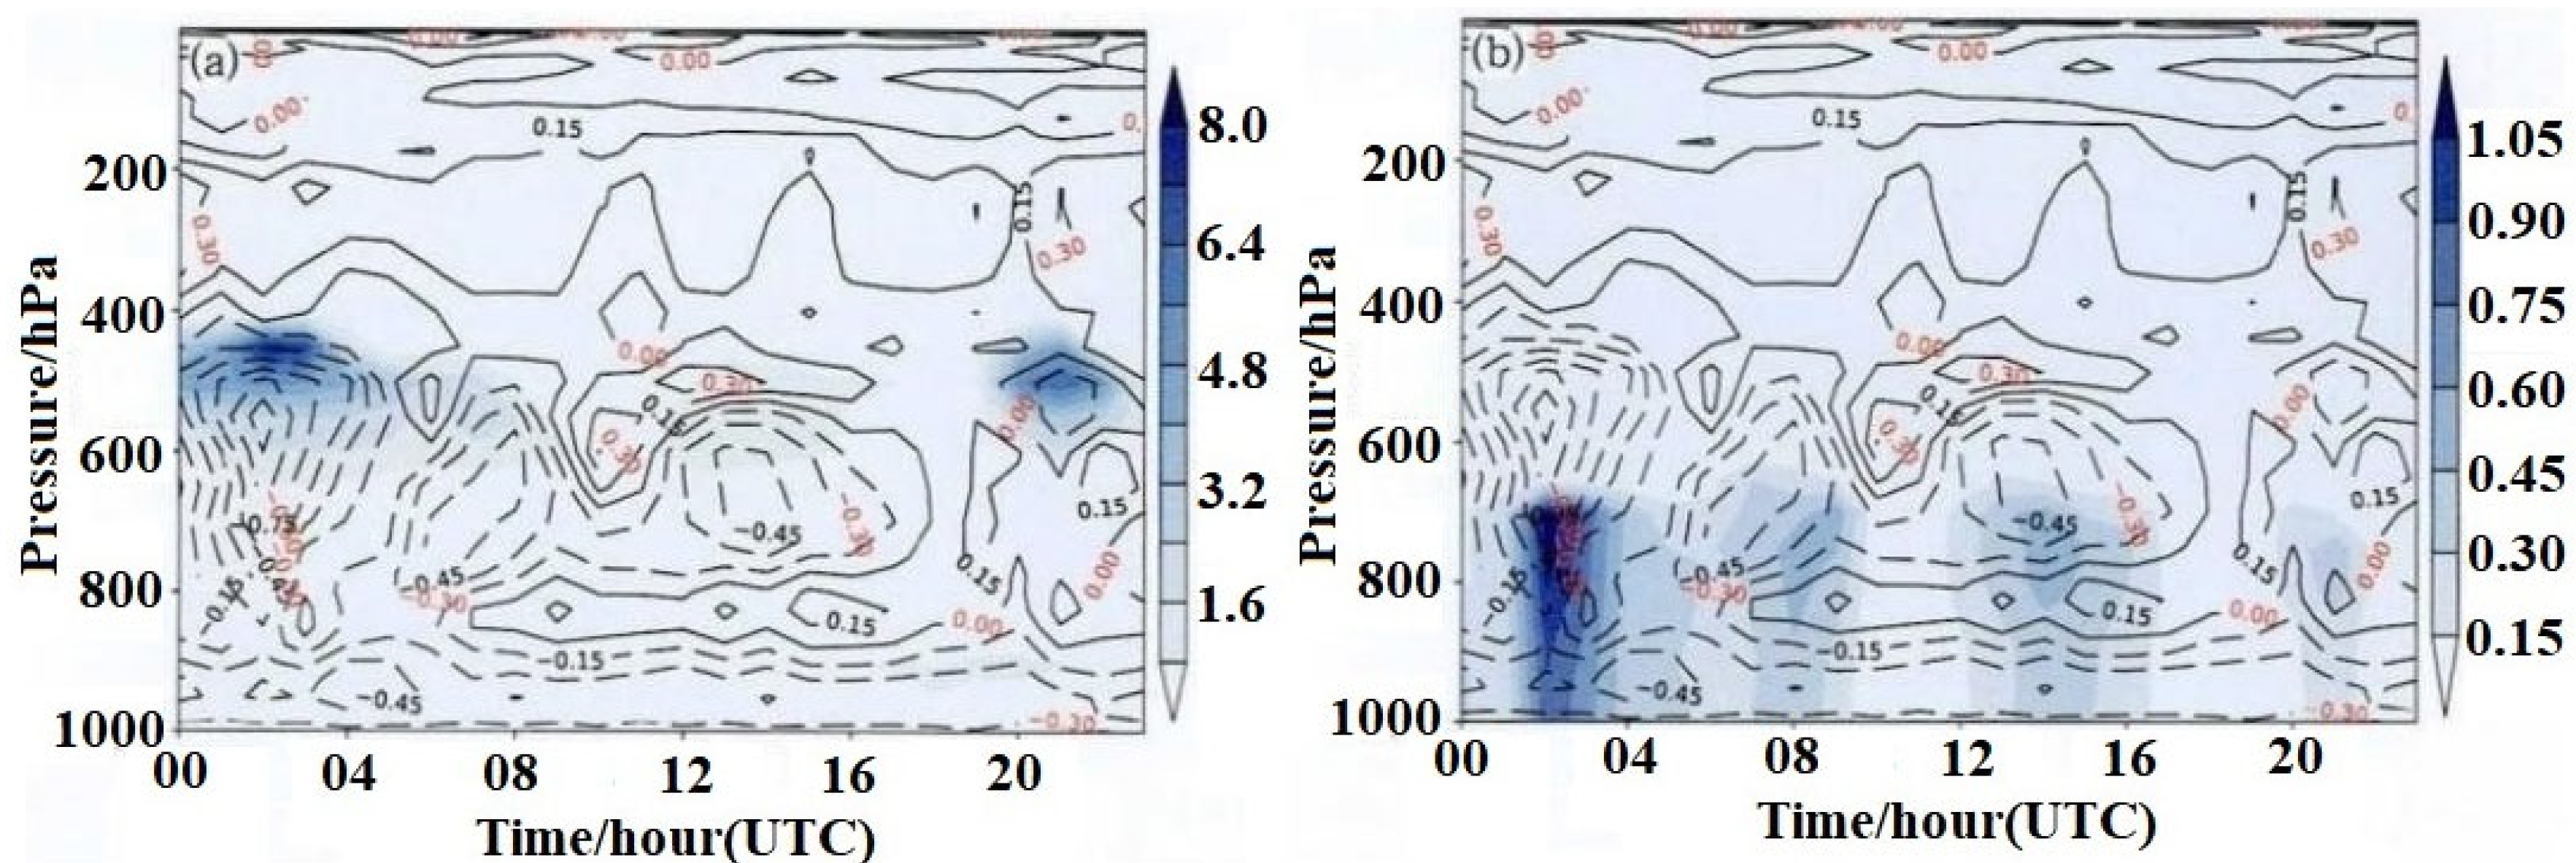
On 12 March 2023, Zhejiang Province encountered the coldest air since the onset of winter, with cities such as Xinchang being affected by severe cold conditions. The daily average temperature dropped by more than 9 °C within 48 h, and cases 20 to 22 were recorded during this period. Taking Xinchang on 1 March 2023 as an example, the IC index method and TF empirical algorithm were used to analyze the meteorological conditions for icing accumulation, and the height of icing accumulation in Xinchang over the next 24 h on 1 March 2023 (Yun 8, airspeed of 550 km·h−1) was calculated, as shown in Figure 5. The results obtained via the IC index method are presented in Figure 5a, which demonstrates that there is a possibility of icing accumulation at 850~900 hPa from 04:00 to 23:00, and moderate icing accumulation at 500~650 hPa throughout the day. The result of the TF empirical method is displayed in Figure 5b, which indicates that there is light icing accumulation at 900 hPa and moderate icing accumulation at 700~450 hPa from 03:00 to 07:00 and from 14:00 to 21:00, and there is light to moderate icing accumulation at 250 hPa from 12:00 to 23:00. The spatio-temporal distribution of icing accumulation calculated using the two methods are basically consistent, but the IC index method indicated no icing accumulation above 400 hPa, while the duration of icing accumulation at 900 hPa obtained via the TF empirical method was shorter compared to the IC index method. The isotherm at 800~1000 hPa from 04:00 to 23:00 clearly corresponds to the movement of low-level cold air in Xinchang City, which is consistent with the spatiotemporal range of icing accumulation predicted by using the IC index and TF empirical method. In general, most icing accumulation occurs in the environments where the temperature is higher than −20° C, when the content of supercooled water is high; very little icing accumulation occurs when the temperature is lower than −20° C, as the content of supercooled water decreases with a decrease in temperature [27]. As shown in Figure 5b, there is icing accumulation at 250 hPa from 12:00 to 23:00 based on the TF empirical method, but the temperature is much lower than −20 °C, which does not conform to the law of icing accumulation.
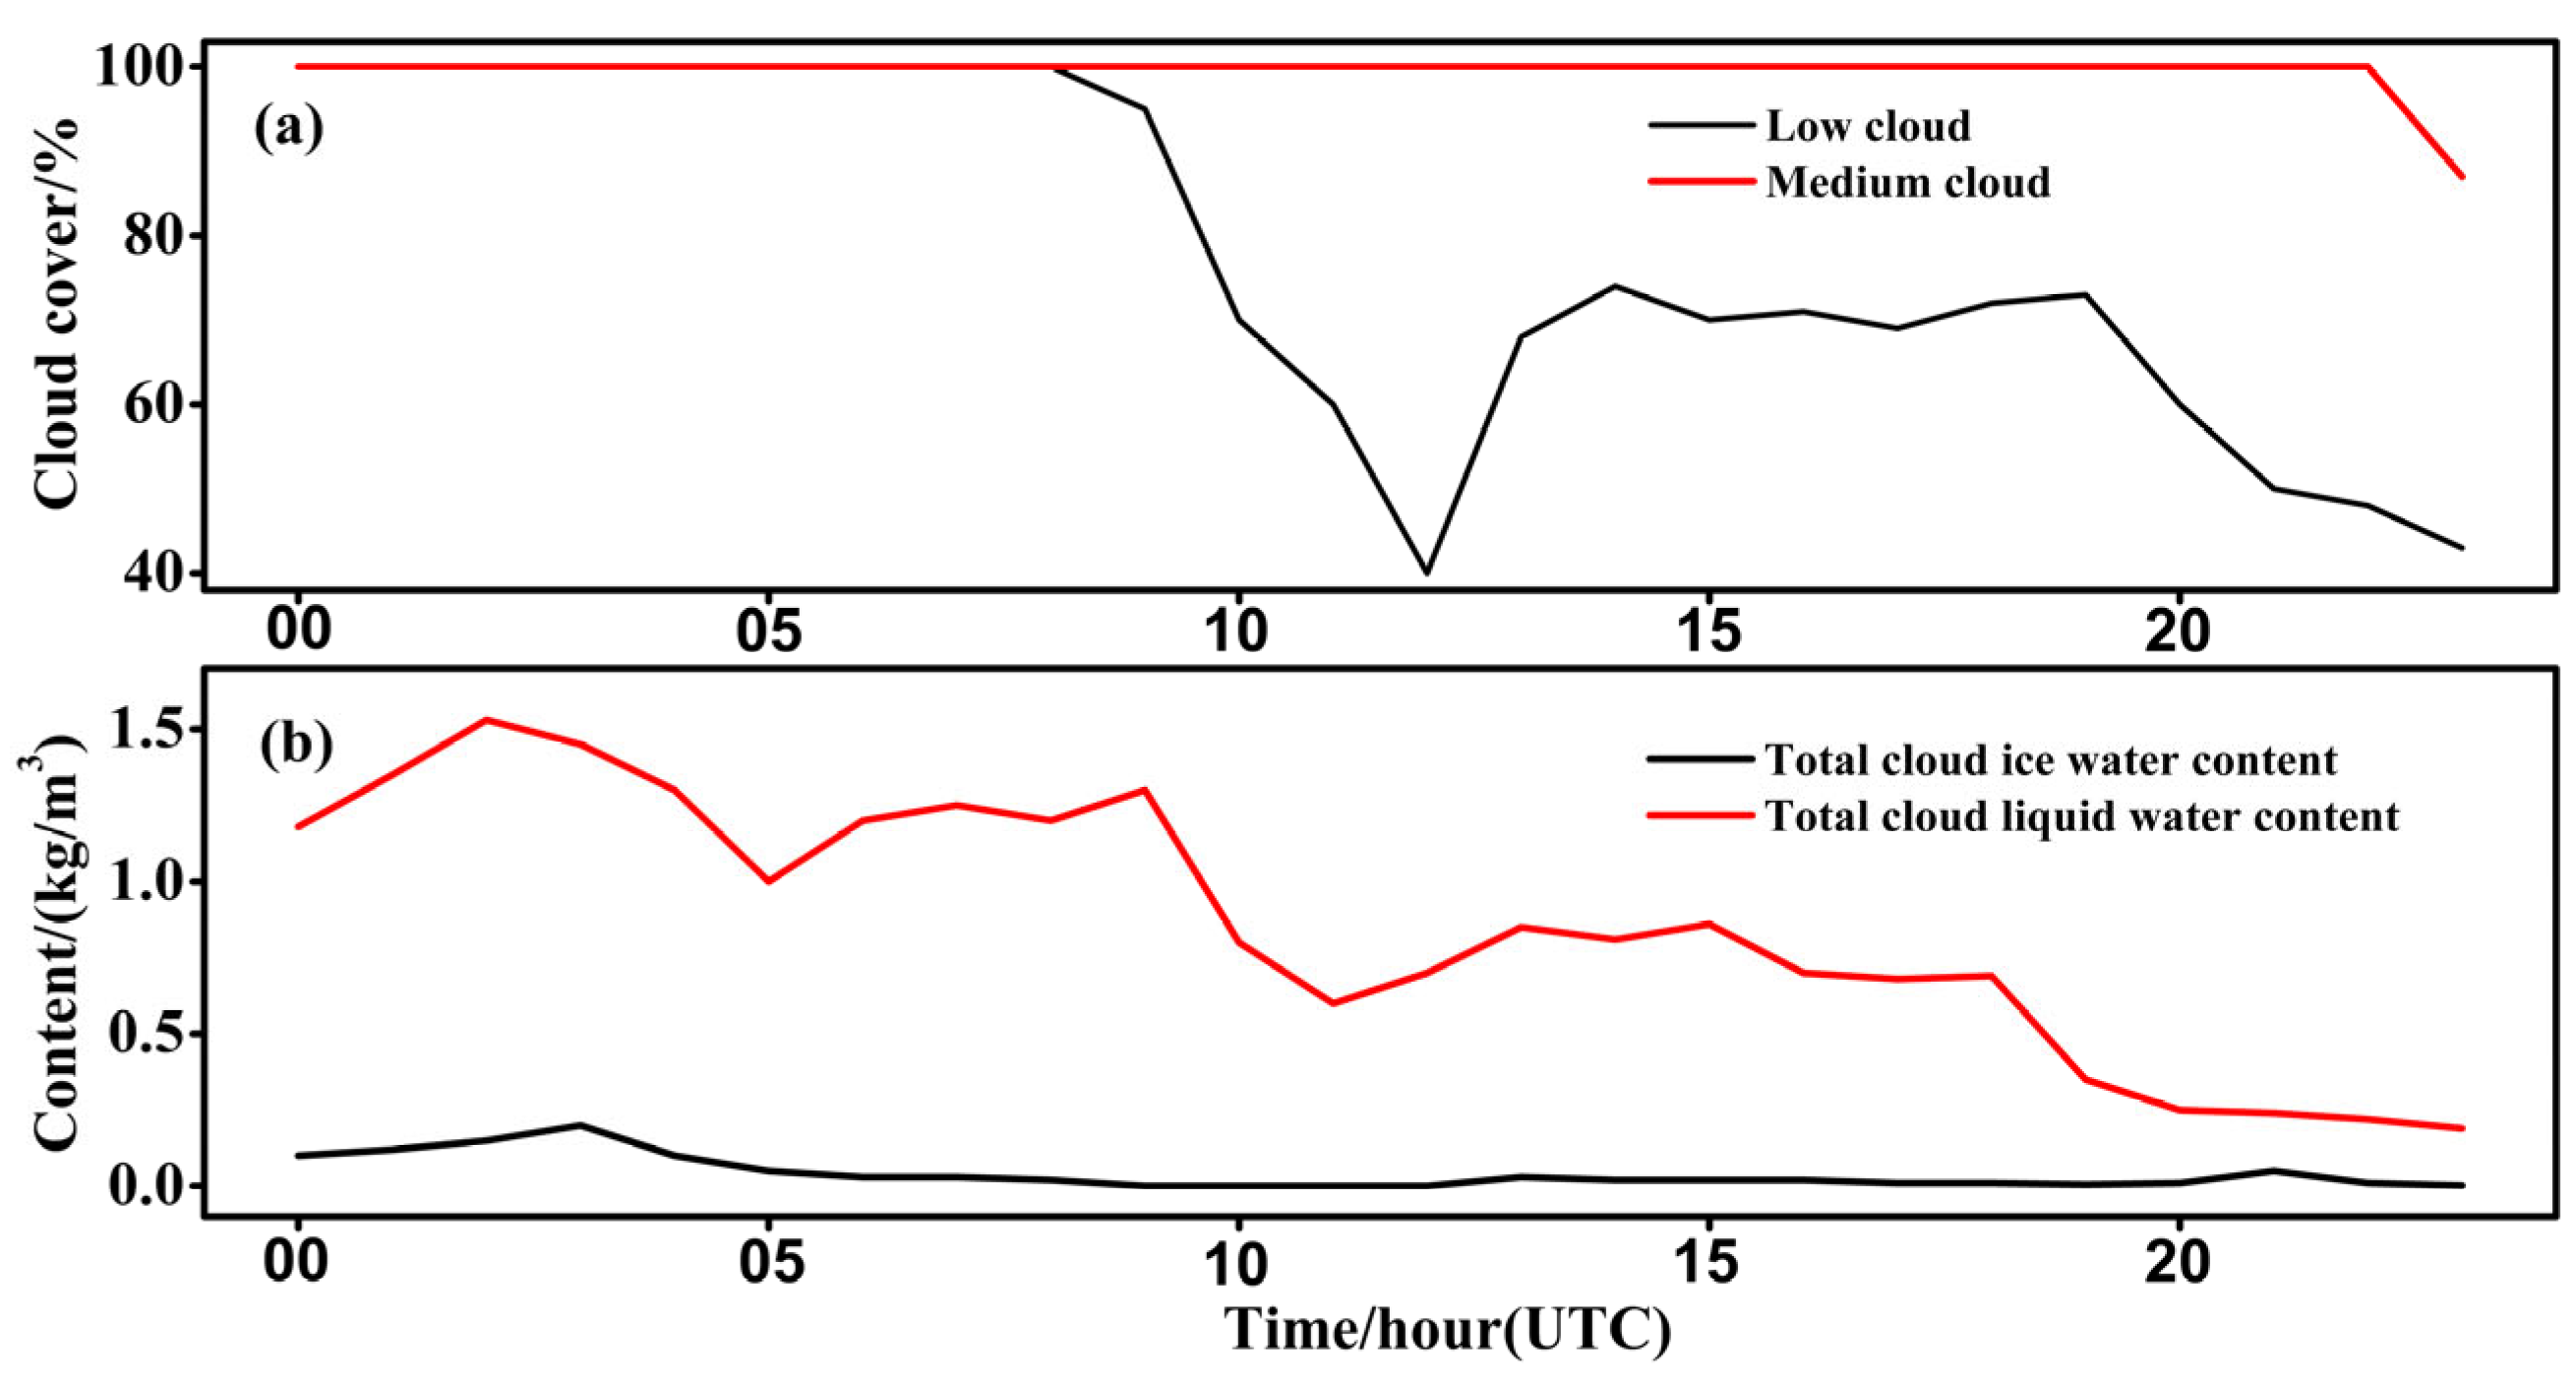
Figure 6 and Figure 7 display the upper meteorological elements in Xinchang on 1 March 2023. The lower-level cloud clusters in the atmosphere are mainly composed of ice clouds, and the growth of ice crystals in the cloud clusters may lead to aircraft icing [28]. It is clear that there are high concentrations of ice water particles at 500 hPa from 00:00 to 04:00 and 20:00 to 23:00, which are consistent with the main spatiotemporal distribution of icing accumulation at 500 hPa diagnosed by the IC index and TF empirical method, meeting the environmental conditions for moderate icing accumulation (Figure 6). As can be seen from Figure 7, liquid water mainly disappears with the movement of low-level cold air and the influence of vertical airflow below 700 hPa, as it partially transforms into ice water particles and stays at 700 hPa from 16:00 to 20:00; this region is consistent with the diagnosed area of low-level icing accumulation in the IC index method and TF empirical method, demonstrating that these two methods can diagnose icing accumulation well. In addition, the TF empirical method reveals a good correlation between low cloud cover and total cloud water content, while the IC index shows an insignificant correlation between low cloud cover and total cloud water content (Figure 7). Figure 6 shows that there are no ice water particles at 250 hPa, and the temperature in this area is much lower than −20 °C, which does not meet the conditions for ice accumulation. However, the TF empirical method indicates that there is slight icing accumulation in this area, which is obviously a misreporting, verifying the conclusion that the TF empirical method leads to more false reports in the upper level.
The diagnostic results of the IC index method and the TF empirical method should be compared and combined. In actual icing accumulation forecasting, relevant physical attributes, such as air temperature and relative humidity, provided by numerical prediction products, should be used with diagnostic equations to obtain icing accumulation prediction results. Both the IC index method and the TF empirical method have good diagnostic capabilities for icing accumulation in the middle and low levels. The TF empirical method takes into account the dynamic warming of the aircraft, and has a better correlation with ice water particle concentration and cloud cover in medium and low clouds, but there are more false reports above 400 hPa. Careful forecasting should also be carried out for different types of aircraft in practical applications. For example, large or transport aircraft have slow airspeeds, low acceleration, poor acceleration and warming effects, and are prone to encountering strong icing. Therefore, more caution should be exercised in icing accumulation forecasting. Under this condition, choosing the TF empirical method is more appropriate, as it can accurately predict the icing area. Although it may overestimate icing intensity, it can effectively ensure the flight safety of large aircraft. For fighter jets or aircraft with advanced acceleration performance, these types of aircraft have fast airspeeds and high acceleration. If they encounter aircraft icing at an upper level, they can also melt the icing by increasing the surface temperature. Moreover, these types of aircraft are often used for more difficult training tasks or large-scale activities, and can ignore light icing with minimal impact, but it is not desirable to have too many false reports [29,30,31]. Under these circumstances, the IC index method is more suitable for prediction.

5. Research on Application Scenarios of Icing Accumulation Prediction Algorithms

As for the seasonal distribution differences in aircraft, there are significant differences in the distribution of icing regions in different seasons, with a lower frequency of icing accumulation in summer and a higher frequency in winter and spring [16]. The eastern region of China has suitable temperature and humidity conditions for the formation of aircraft icing in spring [2]. Therefore, this study mainly focuses on analyzing and investigating the application scenarios of icing accumulation prediction algorithms in the eastern region of China in March.

5.1. Analysis of Pressure Levels Prone to Icing Accumulation

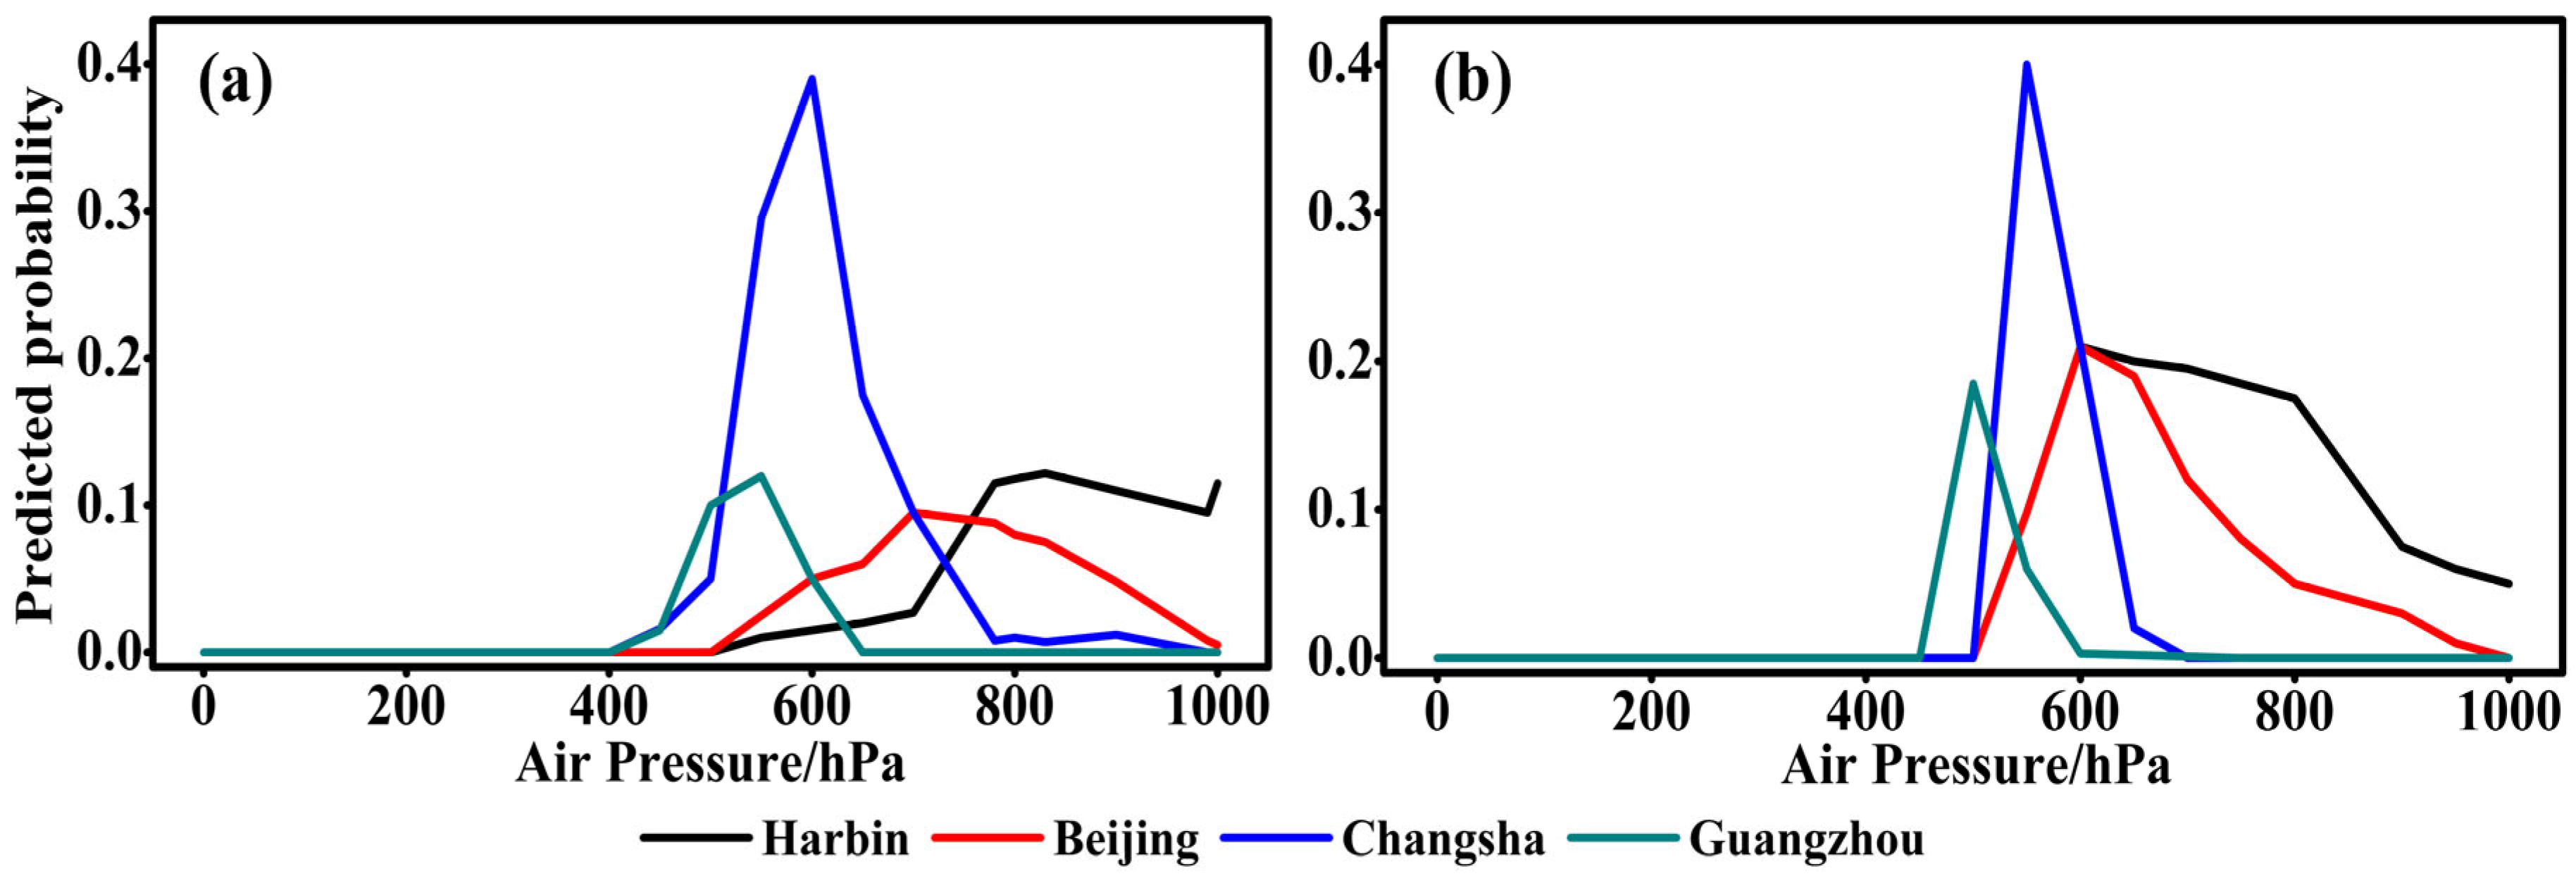
In order to analyze the distribution of aircraft icing probability at different levels and consider the differences in climate backgrounds at different latitudes, we select hourly ERA5 reanalysis data for 10 consecutive years from 2014 to 2023 to investigate the icing potential in March. The probability of icing accumulation at different levels at four stations in Harbin, Beijing, Changsha, and Guangzhou are calculated using the IC index and TF empirical method, the results of which are shown in Figure 8. It is important to note that the cruising speed of the Yun 8 is taken as the airspeed in the TF empirical method (the same below). Figure 8a presents the main pressure levels of icing accumulation predicted via the IC index method in Harbin, Beijing, Changsha, and Guangzhou, which are 600~1000 hPa, 500~950 hPa, 450~700 hPa, and 400~650 hPa, respectively. The pressure levels most prone to icing accumulation are 800 hPa, 700 hPa, 600 hPa, and 550 hPa, with probabilities of 0.13, 0.11, 0.37, and 0.13, respectively. In addition, the primary pressure levels of icing accumulation predicted by the TF empirical method at Harbin, Beijing, Changsha, and Guangzhou in March are 500~1000 hPa, 500~900 hPa, 500~650 hPa, and 600~450 hPa, respectively. The pressure levels most prone to icing accumulation are 600 hPa, 600 hPa, 550 hPa, and 500 hPa, with probabilities of 0.21, 0.21, 0.41, and 0.19, respectively (Figure 8b). It is obvious that the probabilities of icing accumulation predicted via the IC index and TF empirical method are different. The IC index method yields slightly lower probabilities of icing accumulation compared to the TF empirical method, but the pressure levels prone to icing accumulation in Harbin, Beijing, Changsha, and Guangzhou in March are approximately the same for both methods.
In actual weather forecasting, the higher the latitude, the lower the pressure level of icing accumulation in the eastern part of China, which is also consistent with the results obtained by the IC method and TF method in this study. Among the four cities, Changsha has the highest probability of icing accumulation in March. As is known, the most icing accumulation occurs when the temperature is higher than −20 °C since the content of supercooled water decreases with a decrease in temperature, resulting in a low probability of icing accumulation in Harbin and Beijing. In general, there is a warm tongue of the Bay of Bengal and the Indo-China Peninsula, which can extend to the southwest region of the middle and lower reaches of the Yangtze River in China. Consequently, high relative humidity and low air temperatures at 500~700 hPa easily lead to icing accumulation occurrence in the low-latitude regions of China. However, Guangzhou is located south of 25° N, and has air temperatures above 0 °C, hindering icing accumulation.

5.2. Analysis of Time Period Prone to Icing Accumulation

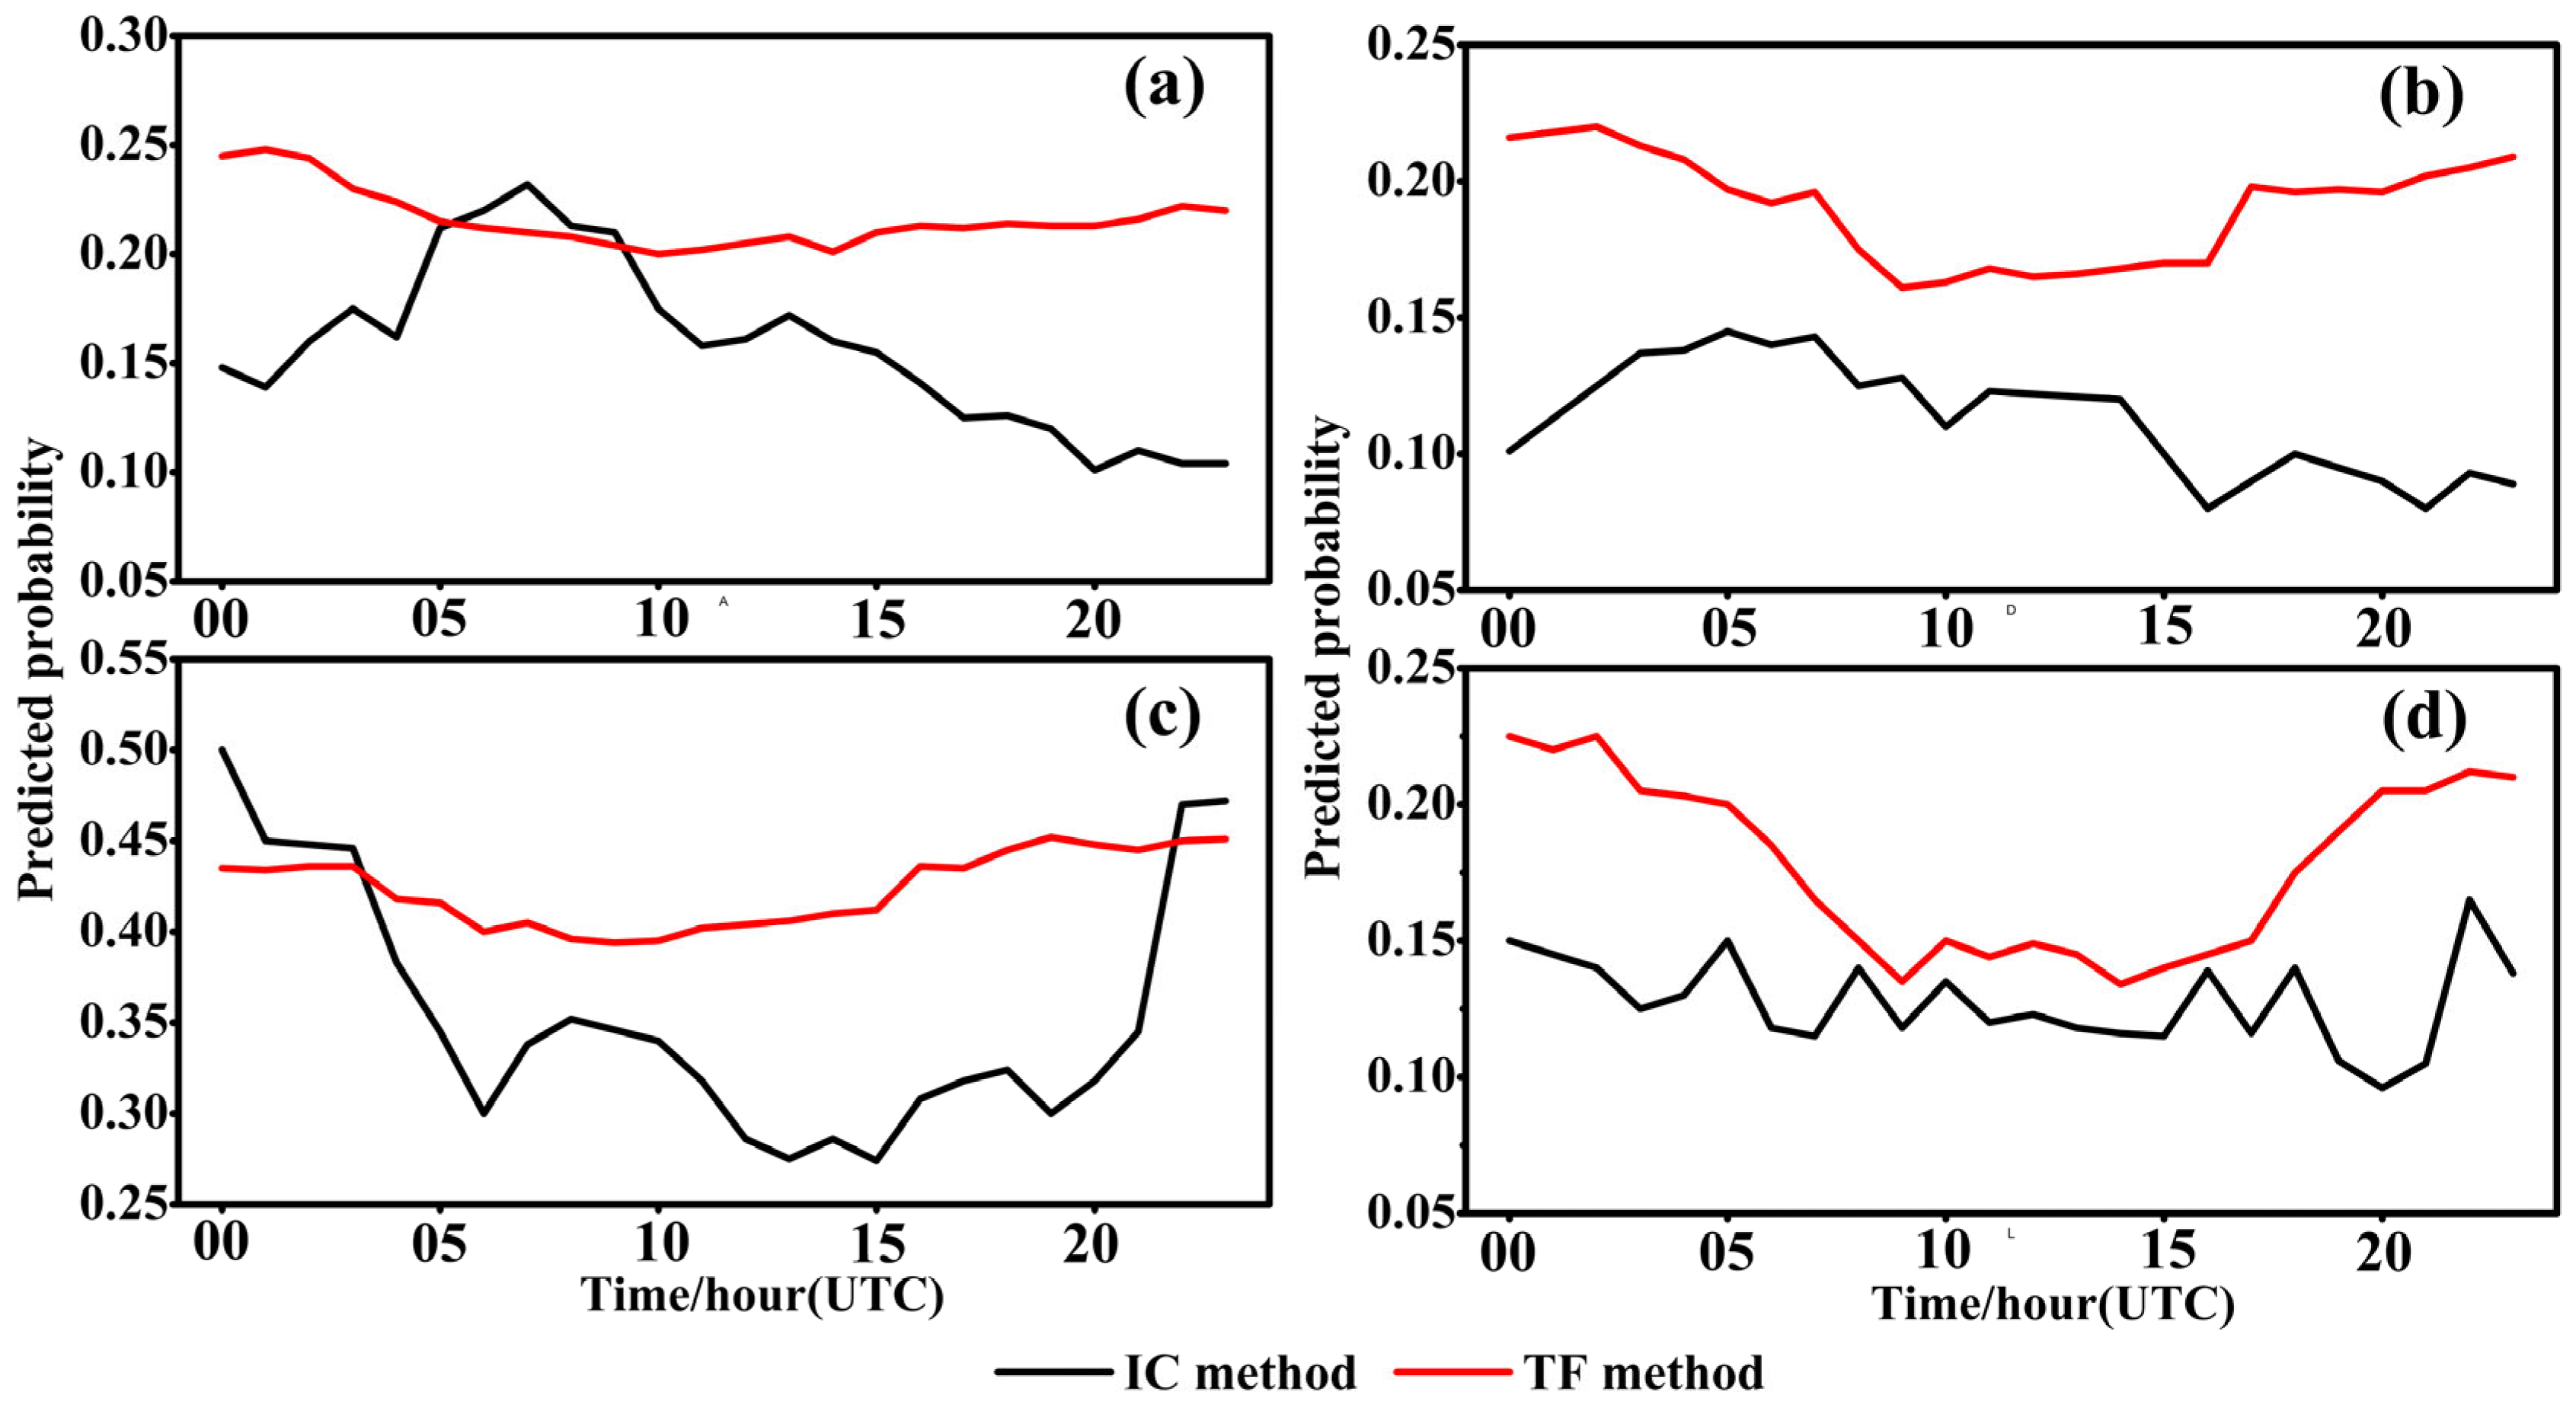
Figure 9 presents the predicted probabilities of hourly icing accumulation at icing-prone levels in March from 2014 to 2023 for the four cities, obtained using the IC index and the TF empirical method. It can be seen that the time of aircraft icing accumulation in the four cities varies. According to the IC index method, the times that are most prone to icing accumulation in Harbin, Beijing, Changsha, and Guangzhou are 07:00, 05:00, 00:00, and 23:00, with icing probabilities of 0.23, 0.14, 0.50, and 0.16, respectively. The results obtained via the TF empirical method indicate that the most likely times of icing accumulation in Harbin, Beijing, Changsha, and Guangzhou are 01:00, 01:00, 19:00, and 20:00, and the icing accumulation probabilities are 0.23, 0.23, 0.44, and 0.22, respectively. Overall, the probability of icing accumulation predicted via the TF empirical method is greater than that of the IC index method; the occurrence time of icing accumulation in four different cities is significantly different. This is mainly because the IC index method only diagnoses icing accumulation in the atmospheric physical field. The TF empirical method takes the dynamic warming effect into account, but the airspeed is assumed, which is different from the real airspeed.

6. Conclusions and Discussion

This study evaluates the effects of the IC index method and the TF empirical method using ERA5 reanalysis data as the atmospheric environment for icing occurrence, along with 25 cases of aircraft icing accumulation in spring over Eastern China, mainly focusing on the specific application scenarios of current icing accumulation diagnosis and prediction models and the spatial and temporal distribution characteristics of icing accumulation. The major conclusions are drawn as follows.
(1)
The IC index method and the TF empirical method are evaluated using 25 cases of icing accumulation reported by aircraft. The results shows that the diagnostic prediction accuracy of the IC index method is 80%, and the accuracy of the TF empirical method for diagnosis and prediction is 92%. Both the IC index method and the TF empirical method can effectively diagnose the icing accumulation area and the intensity of icing accumulation. The prediction accuracy of the two methods is higher for icing accumulation at low levels (below 5000 m) but lower when predicting icing accumulation at high levels (above 5000 m). For the icing accumulation intensity, the accuracy predicted by the TF empirical method is higher than that of the IC index method mainly because the TF empirical method takes the ice water particles concentration and cloud cover in medium and low clouds into account, while the IC index method depends only on the air temperature and relative humidity. However, the TF empirical method is prone to false reports at high pressure levels, which is possibly due to the fact that the calculated airspeed is not the actual airspeed.
(2)
In practical application scenarios, both the IC index method and the TF empirical method not only better capture the pressure levels where icing accumulation is prone to occur, but also accurately predict the distribution of icing accumulation intensity at high pressure levels in the stations. However, there is a significant difference between the IC index method and the TF empirical method in analyzing icing accumulation-prone time periods, which may be related to the assumed airspeed conditions.
Due to the limited number of reports on aircraft icing accumulation, the test accuracy of icing accumulation may be affected. Collecting more icing accumulation samples will help compare the icing accumulation probabilities of different types of aircraft. In addition, the variables such as air temperature and humidity provided by the numerical forecasting products can be combined with icing accumulation diagnosis algorithms to predict icing accumulation intensity, providing more effective meteorological forecasting products for aviation activities.

Author Contributions

S.L.: Writing-review and editing, writing-original draft, visualization, validation, software, methodology, investigation, funding acquisition, formal analysis. C.Y.: Writing-original draft, visualization, validation, software. W.S.: Writing-review and editing, writing-original draft, validation, supervision, resources, investigation, funding acquisition, formal analysis. All authors have read and agreed to the published version of the manuscript.

Funding

This study is jointly supported by the National Natural Science Foundation of China (42505079) and the China Postdoctoral Science Foundation (2023M731341), and the Fundamental Research Funds for the Central Universities (1027-YAT22021).

Data Availability Statement

The data that support the findings of this study are available from the European Centre for Medium Range Weather Forecasts (ECMWF) at https://cds.climate.copernicus.eu/datasets. These data were derived from the following resources available in the public domain: European Reanalysis-5 (ERA5), https://cds.climate.copernicus.eu/datasets/reanalysis-era5-pressure-levels?tab=download accessed on 15 July 2024.

Acknowledgments

We are grateful for the excellent PIREP data from the Civil Aviation Meteorological Center (including the data from 25 aircraft icing reports over Eastern China in 2023 and the meteorological elements in Xinchang on March 2023) and support provided by the people at the Civil Aviation Administration of China (CAAC) and the Zhejiang Province Meteorological Bureau of China.

Conflicts of Interest

The authors declare no conflicts of interest. A preprint has previously been published [Lu and Yang 2024] on Research Square with doi: 10.21203/rs.3.rs-5452030/v1, which is available from https://www.researchsquare.com/article/rs-5452030/v1 accessed on 13 December 2024. However, no conflicts of interest exist in the submission of this manuscript, and all authors have seen the manuscript and have approved its submission to this journal.

References

  1. Li, H.R.; Zhang, Y.F.; Chen, H.X. Optimization design of airfoils under atmospheric icing conditions for UAV. Chin. J. Aeronaut. 2022, 35, 118–133. [Google Scholar] [CrossRef]
  2. Wu, Q.; Xu, H.J.; Pei, B.B.; Wei, Y. Conceptual design and preliminary experiment of icing risk management and protection system. Chin. J. Aeronaut. 2022, 35, 101–115. [Google Scholar] [CrossRef]
  3. Cao, Y.H.; Tan, W.Y.; Wu, Z.L. Aircraft icing: An ongoing threat to aviation safety. Aerosp. Sci. Technol. 2018, 75, 353–385. [Google Scholar] [CrossRef]
  4. Wang, Q.; Wu, J.J. Analysis of weather conditions for aircraft icing in low-level flight in Sichuan Basin. Meteor. Sci. Technol. 2018, 46, 799–808. (In Chinese) [Google Scholar] [CrossRef]
  5. He, X.D.; Liu, Y.S.; Gou, W.X.; Zhang, F. An aircraft icing forecasting method based on cloud microphysical parameters. Aeronaut. Comput. Tech. 2012, 24, 72–75+79. (In Chinese) [Google Scholar] [CrossRef]
  6. Xu, W.S. Analysis of Meteorological Conditions of Aircraft Icing Events at the Diwopu Airport in Urumqi and Their Case Simulations. Master’s Thesis, Nanjing University of Information Science and Technology, Nanjing, China, 2020. (In Chinese). [Google Scholar]
  7. Schultz, P.; Politovich, M.K. Toward the improvement of aircraft-icing forecasts for the Continental United States. Weather Forecast. 1992, 7, 491–500. [Google Scholar] [CrossRef]
  8. Carrière, J.M.; Alquier, S.; Le Bot, C.; Moulin, E. Statistical verification of forecast icing risk indices. Meteor. Appl. 1997, 4, 115–130. [Google Scholar] [CrossRef]
  9. Thompson, G.; Bruintjes, R.T.; Brown, B.G.; Hage, F. Intercomparison of in-flight icing algorithms. Part I: WISP94 real-time icing prediction and evaluation program. Weather Forecast. 1997, 12, 878–889. [Google Scholar] [CrossRef]
  10. Zhang, F.; Huang, Z.; Yao, H.J.; Zhai, W.H.; Gao, T.F. Icing severity forecast algorithm under both subjective and objective parameters uncertainties. Atmos. Environ. 2016, 128, 263–267. [Google Scholar] [CrossRef]
  11. Bian, S.S.; He, H.R.; An, H.; Pan, X.B.; Zhang, Y. Comparison of Aircraft Ice Accumulation Prediction Algorithms and Research on Integrated Prediction Model. Meteor. Mon. 2019, 45, 1352–1362. (In Chinese) [Google Scholar] [CrossRef]
  12. Bernstein, B.C.; Mcdonough, F.; Poliovich, M.K.; Brown, B.G.; Ratvasky, T.P.; Miller, D.R.; Wolff, C.A.; Cunning, G. Current icing potential: Algorithm description and comparison with aircraft observations. J. Appl. Meteor. Climatol. 2005, 44, 969–986. [Google Scholar] [CrossRef]
  13. Smith, W.L.; Minnis, P.; Fleeger, C.; Spangenberg, D.; Palikonda, R.; Nguyen, L. Determining the flight icing threat to aircraft with single-layer cloud parameters derived from operational satellite data. J. Appl. Meteor. Climatol. 2012, 51, 1794–1810. [Google Scholar] [CrossRef]
  14. Bernstein, B.C.; Wolff, C.A.; Mcdonough, F. An inferred climatology of icing conditions aloft, including supercooled large drops. Part I: Canada and the continental United States. J. Appl. Meteor. Climatol. 2007, 46, 1857–1878. [Google Scholar] [CrossRef]
  15. Liu, F.L.; Sun, L.T.; Li, S.J. Study on methods of aircraft icing diagnosis and forecast. Meteor. Environ. Sci. 2011, 34, 26–30. (In Chinese) [Google Scholar] [CrossRef]
  16. Zhao, Y.; Fu, Y.; Zhao, Z.L.; Sun, X.J.; Han, Z.G.; Yao, Z.G. Satellite data based statistical study of the characteristics of potential distribution of global aircraft icing. J. Trop. Meteor. 2018, 34, 102–114. (In Chinese) [Google Scholar] [CrossRef]
  17. Qi, C.; Jin, C.X.; Guo, W.L.; Gan, L.; Zhao, D.L.; Lu, J.; Wu, S.; Li, H.P. Icing potential index of aircraft icing based on fuzzy logic. J. Appl. Meteor. Sci. 2019, 30, 619–628. (In Chinese) [Google Scholar] [CrossRef]
  18. Stith, J.L.; Dye, J.E.; Bansemer, A.; Heymsfield, A.J.; Grainger, C.A.; Petersen, W.A.; Cifelli, R. Micro-physical observations of tropical clouds. J. Appl. Meteor. Climatol. 2002, 41, 97–117. [Google Scholar] [CrossRef]
  19. Fairall, C.W.; Bradley, E.F.; Hare, J.E.; Grachev, A.A.; Edson, J.B. Bulk parameterization of air-sea fluxes: Updates and verification for the COARE algorithm. J. Clim. 2003, 16, 571–591. [Google Scholar] [CrossRef]
  20. Morrison, H.; Thompson, G.; Tatarskii, V. Impact of cloud microphysics on the development of trailing stratiform precipitation in a simulated squall line: Comparison of one and two-moment schemes. Mon. Weather Rev. 2009, 137, 991–1007. [Google Scholar] [CrossRef]
  21. Jones, S.L. Simulation of Meteorological Fields for Icing Applications at the Summit of Mount Washington. Master’s Thesis, University of Nebraska Lincoln, Lincoln, NE, USA, 2014. [Google Scholar]
  22. Lawson, P.; Gurganus, C.; Woods, S. Aircraft Observations of Cumulus Microphysics Ranging from the Tropics to Mid-latitudes: Implications for a “New” Secondary Ice Process. J. Atmos. Sci. 2017, 74, 2899–2920. [Google Scholar] [CrossRef]
  23. Sergio, F.G.; Jose, L.S.; Estibaliz, G.; López, L.; García-Ortega, E.; Merino, A. Weather Features Associated with Aircraft Icing Conditions: A Case Study. Sci. World J. 2014, 2014, 279063. [Google Scholar] [CrossRef]
  24. Merino, A.; Garcia, O.E.; Sergio, F.G.; Díaz-Fernández, J.; Quitián-Hernández, L.; Martín, M.L.; López, L.; Marcos, J.L.; Valero, F.; Sánchez, J.L. Aircraft Icing: In-Cloud Measurements and Sensitivity to Physical Parameterizations. Geophys. Res. Lett. 2019, 46, 11559–11567. [Google Scholar] [CrossRef]
  25. Tetens, O. Uber einige meteorologische Begriffe. Z. Geophys. 1930, 6, 297–309. [Google Scholar]
  26. Brown, B.G.; Thompson, G.; Bruintjes, R.T.; Bullock, R.; Kane, T. Intercomparison of in-flight icing algorithms. Part II: Statistical verification results. Weather Forecast. 1997, 12, 890–914. [Google Scholar] [CrossRef]
  27. Yuan, M.; Duan, L.; Ping, F.; Wu, J.J. Identifying the supercooled liquid water in aircraft icing condition using CloudSat satellite data. Meteor. Mon. 2017, 43, 206–212. (In Chinese) [Google Scholar] [CrossRef]
  28. Liu, X.M.; Zhang, M.J.; Wang, S.J.; Zhao, P.P.; Wang, J.; Zhou, P.P. Estimation and analysis of precipitation cloud base height in China. Meteor. Mon. 2016, 42, 1135–1145. (In Chinese) [Google Scholar] [CrossRef]
  29. Zhu, S.C.; Guo, X.L. Ice crystal habits, distribution and growth process in stratiform clouds with embedded convection in North China: Aircraft measurements. Acta Meteor. Sin. 2014, 72, 366–389. (In Chinese) [Google Scholar] [CrossRef]
  30. Cai, Z.X.; Cai, M.; Li, P.R.; Li, J.X.; Sun, H.C.; Gu, Y.; Gao, X. Aircraft observation research on macro and microphysics characteristics of continental cumulus cloud at different development stages. Chin. J. Atmos. Sci. 2019, 43, 1191–1203. (In Chinese) [Google Scholar] [CrossRef]
  31. Liu, X.E.; Gao, Q.; He, H.; Ma, X.C.; Bi, K.; Zhao, D.L.; Zhou, W. Analysis of aircraft observation data and numerical simulation of vertical structure and precipitation mechanism of stratiform clouds with embedded convections. Acta Meteor. Sin. 2020, 78, 277–288. (In Chinese) [Google Scholar] [CrossRef]
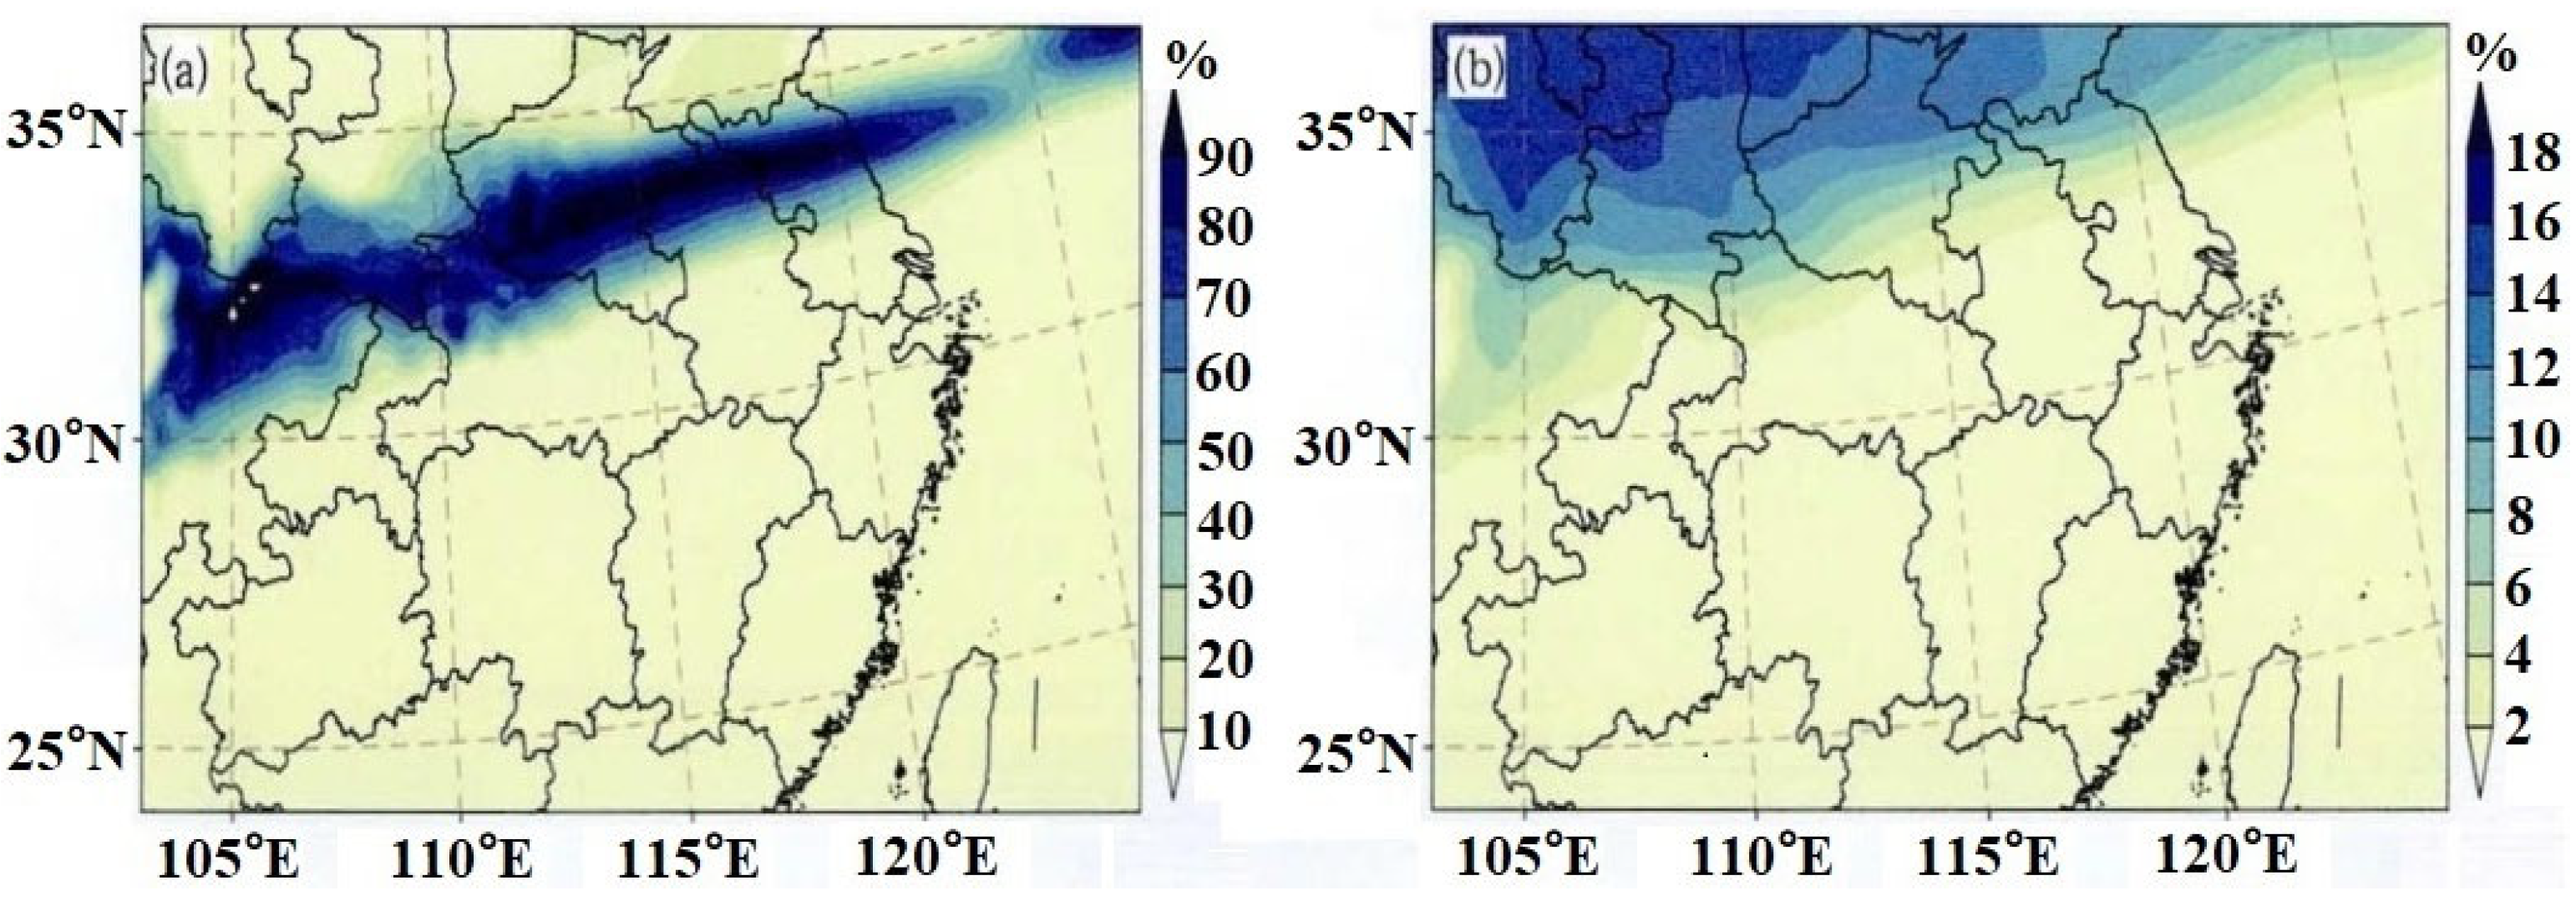
Figure 1. The simulated distribution of icing accumulation intensity via (a) the IC index method and (b) the TF empirical method at 700 hPa at 09:00 (UTC, the same as the subsequent figures) 8 February 2023. Note that the darker the shaded color, the greater the icing accumulation index, the more severe the icing accumulation.
Forecasting 07 00053 g001
Figure 2. The simulated distribution of icing accumulation intensity via (a) the IC index method and (b) the TF empirical method at 850 hPa at 09:00 8 February 2023. Note that the darker the shaded color, the greater the icing accumulation index, the more severe the icing accumulation.
Forecasting 07 00053 g002
Figure 3. The distribution of ice accumulation intensity over Eastern China calculated via the IC index method respectively corresponding to the 12th to 23rd icing accumulation cases in Table 3. Note that the darker the shaded color, the greater the icing accumulation index, the more severe the icing accumulation in (al).
Forecasting 07 00053 g003
Figure 4. The distribution of ice accumulation intensity over Eastern China calculated via the TF empirical method respectively corresponding to the 12th to 23rd icing accumulation cases in Table 3. Note that the darker the shaded color, the greater the icing accumulation index, the more severe the icing accumulation in (al).
Forecasting 07 00053 g004
Figure 5. Predicted spatial-temporal distributions of aircraft icing accumulation index via (a) the IC index method and (b) the TF empirical method in Xinchang on 1 March 2023. Note that the shaded and the black contour in (a,b) stand for the icing accumulation intensity and the air temperature (unit: °C); the darker the shaded color, the greater the icing accumulation index, the more severe the icing accumulation; the dashed black contour and the solid black contour represent the negative temperature contour and positive temperature contour, respectively. The numbers with red color have no practical significance, which are merely used to distinguish them from the adjacent numbers in (a,b).
Forecasting 07 00053 g005
Figure 6. Spatial-temporal distributions of (a) cloud ice water content (shaded, unit: kg·m−3) and (b) cloud liquid water content (shaded, unit: kg·m−3) in Xinchang on 1 March 2023. Note that the black contour in (a,b) represents the vertical velocity (unit: Pa·s−1); the darker the shaded color, the greater the icing accumulation index, the more severe the icing accumulation; the dashed black contour and the solid black contour represent the negative vertical velocity contour (namely there is updraft) and positive vertical velocity contour (namely there is downdraft), respectively. The numbers with red color have no practical significance, which are merely used to distinguish them from the adjacent numbers in (a,b).
Forecasting 07 00053 g006
Figure 7. (a) Medium and low cloud cover (unit: %) and (b) total cloud ice (liquid) water content (unit: kg/m3) in Xinchang on 1 March 2023.
Forecasting 07 00053 g007
Figure 8. Predicted probability of icing accumulation in March at each pressure level at four stations from 2014 to 2023 via (a) the IC index method and (b) the TF empirical method.
Forecasting 07 00053 g008
Figure 9. Predicted probabilities of hourly icing accumulation in March from 2014 to 2023: (a) Harbin at 750~800 hPa; (b) Beijing at 700~750 hPa; (c) Changsha at 550~600 hPa; (d) Guangzhou at 550~600 hPa.
Forecasting 07 00053 g009
Table 1. Criteria of the IC index method.
IC Index (%)<00 ≤ IC ≤ 5050 ≤ IC ≤ 80IC ≥ 80
Icing intensityNo icingLight icingModerate icingSevere icing
Table 2. Criteria of the TF empirical method.
Tfi Index T fi T   0.15 ( V 100 ) 2 T fi T > 0.15 ( V 100 ) 2 T fi T   > 0
Icing intensityNo icingIcingModerate or severe icing
Table 3. Verification of 25 individual cases of icing accumulation.
Series
Number
Time/UTC
(Day Month Year, Hour: Minute)
Aircraft TypeInspection Height/Pressure Level
(Unit: m/hPa)
Aircraft ReportIC Index MethodTF Empirical Method
106 February 2023, 00:00Yun 8800/925Light icingModerate icingLight icing
206 February 2023, 01:00B737800/925Light icingLight icingLight icing
307 February 2023, 00:00B737800/925Light icingSevere icingSevere icing
407 February 2023, 11:00B737800/925Light icingModerate icingModerate icing
508 February 2023, 02:00B7373000/700Light icingLight icingLight icing
608 February 2023, 02:00B7375500/500Light icingNo icingModerate icing
708 February 2023, 09:00B7373000/700Light icingLight icingLight icing
808 February 2023, 09:00B7371500/850Light icingLight icingLight icing
908 February 2023, 09:00B737800/925Light icingModerate icingModerate icing
1018 February 2023, 02:00B7377000/400Light icingNo icingSevere icing
1118 February 2023, 02:00B7379000/300No icingNo icingSevere icing
1218 February 2023, 02:00B7373000/700No icingNo icingNo icing
1318 February 2023, 02:00B7371500/850No icingNo icingNo icing
1418 February 2023, 08:00B7371500/850Light icingLight icingLight icing
1518 February 2023, 08:00B737800/925Light icingNo icingLight icing
1618 February 2023, 11:00B7371500/850Light icingLight icingLight icing
1718 February 2023, 11:00B737800/925Light icingLight icingLight icing
1819 February 2023, 03:00B7373000/700Light icingLight icingLight icing
1919 February 2023, 04:00B7375500/500No icingNo icingModerate icing
2001 March 2023, 02:00A3205500/500No icingNo icingNo icing
2101 March 2023, 02:00A3203000/700Light icingLight icingLight icing
2201 March 2023, 02:00A3201500/850Light icingNo icingLight icing
2320 March 2023, 12:00Yi 76800/925Light icingLight icingLight icing
2428 March 2023, 02:00Yun 85500/500Light icingNo icingLight icing
2528 March 2023, 02:00Yun 83000/700No icingNo icingNo icing
Disclaimer/Publisher’s Note: The statements, opinions and data contained in all publications are solely those of the individual author(s) and contributor(s) and not of MDPI and/or the editor(s). MDPI and/or the editor(s) disclaim responsibility for any injury to people or property resulting from any ideas, methods, instructions or products referred to in the content.