
The Lasso and the Factor Zoo-Predicting Expected Returns in the Cross-Section


Abstract
:1. Introduction
2. Methodology
2.1. Notation
2.2. FC and the Return Generating Process
- P priced factors: ,
- U unpriced factors: ,
- S spurious factors: .
2.3. Methods
2.4. Data Sparsity
2.5. Selection and Prediction Evaluation
3. Simulation Study
3.1. Calibration
- We set the number of priced and unpriced factors to 6 each. Even if it were theoretically assumed that unpriced factor risk should not exist, it could empirically still be present. Moreover, we assume that the factors are independent of one another and that the stock market factor explains the highest proportion of variance of all priced factors.
- Firm characteristics fall into one of the following three groups: Group 1 measures factor exposure to priced factors and group 2 to unpriced factors. Group 3 measures FCs which are independent of the return-generating process. FCs are potentially correlated across groups.
- The signal-to-noise ratio is relatively small, assuming a ratio implying a yearly of 5% (see the Appendix A for details on the transformation to monthly s). This is in line with empirically documented s in the case of the linear model; see, for example, Lewellen [41].
- The stock market factor follows a time-varying volatility process (implying heteroskedasticity for the individual stocks over time as well).
- The simulated return series do not possess any auto-correlation.
- The return-generating process follows (1) with and . FC, , represents the stock market return, which follows a latent volatility process (see next item). is set to 0 (spurious factor). The elements of the vector of risk-premia, , are drawn from and are set equal to zero . We assume a stock market premium, , of 5.5% per year. The risk-premia are drawn only once per case and are kept constant through each simulation. The market premium is the estimate of the Fama French market factor.
- , the stock market volatility, is estimated by using a GARCH(1,1) process, where the estimated are obtained by fitting a GARCH(1,1) model on daily observed US stock market returns. The GARCH(1,1) model captures a sufficient fraction of distribution properties observed in stock returns for our simulation study. Moreover, model performance seems reasonable compared to many less parsimonious approaches (see Hansen and Lunde [42]). Better volatility models exist, but are beyond the scope of this paper and not of crucial relevance.
- represents the idiosyncratic stock-specific component and is drawn from . Bekaert et al. [43] show that aggregated idiosyncratic volatility varies over time. Despite this empirical evidence, we choose a parsimonious approach to model idiosyncratic volatility. This is mainly motivated by the statistical properties our DGP already possesses.
- marks the vector of FC of stock n at t of length C. We simulate the characteristics from ).
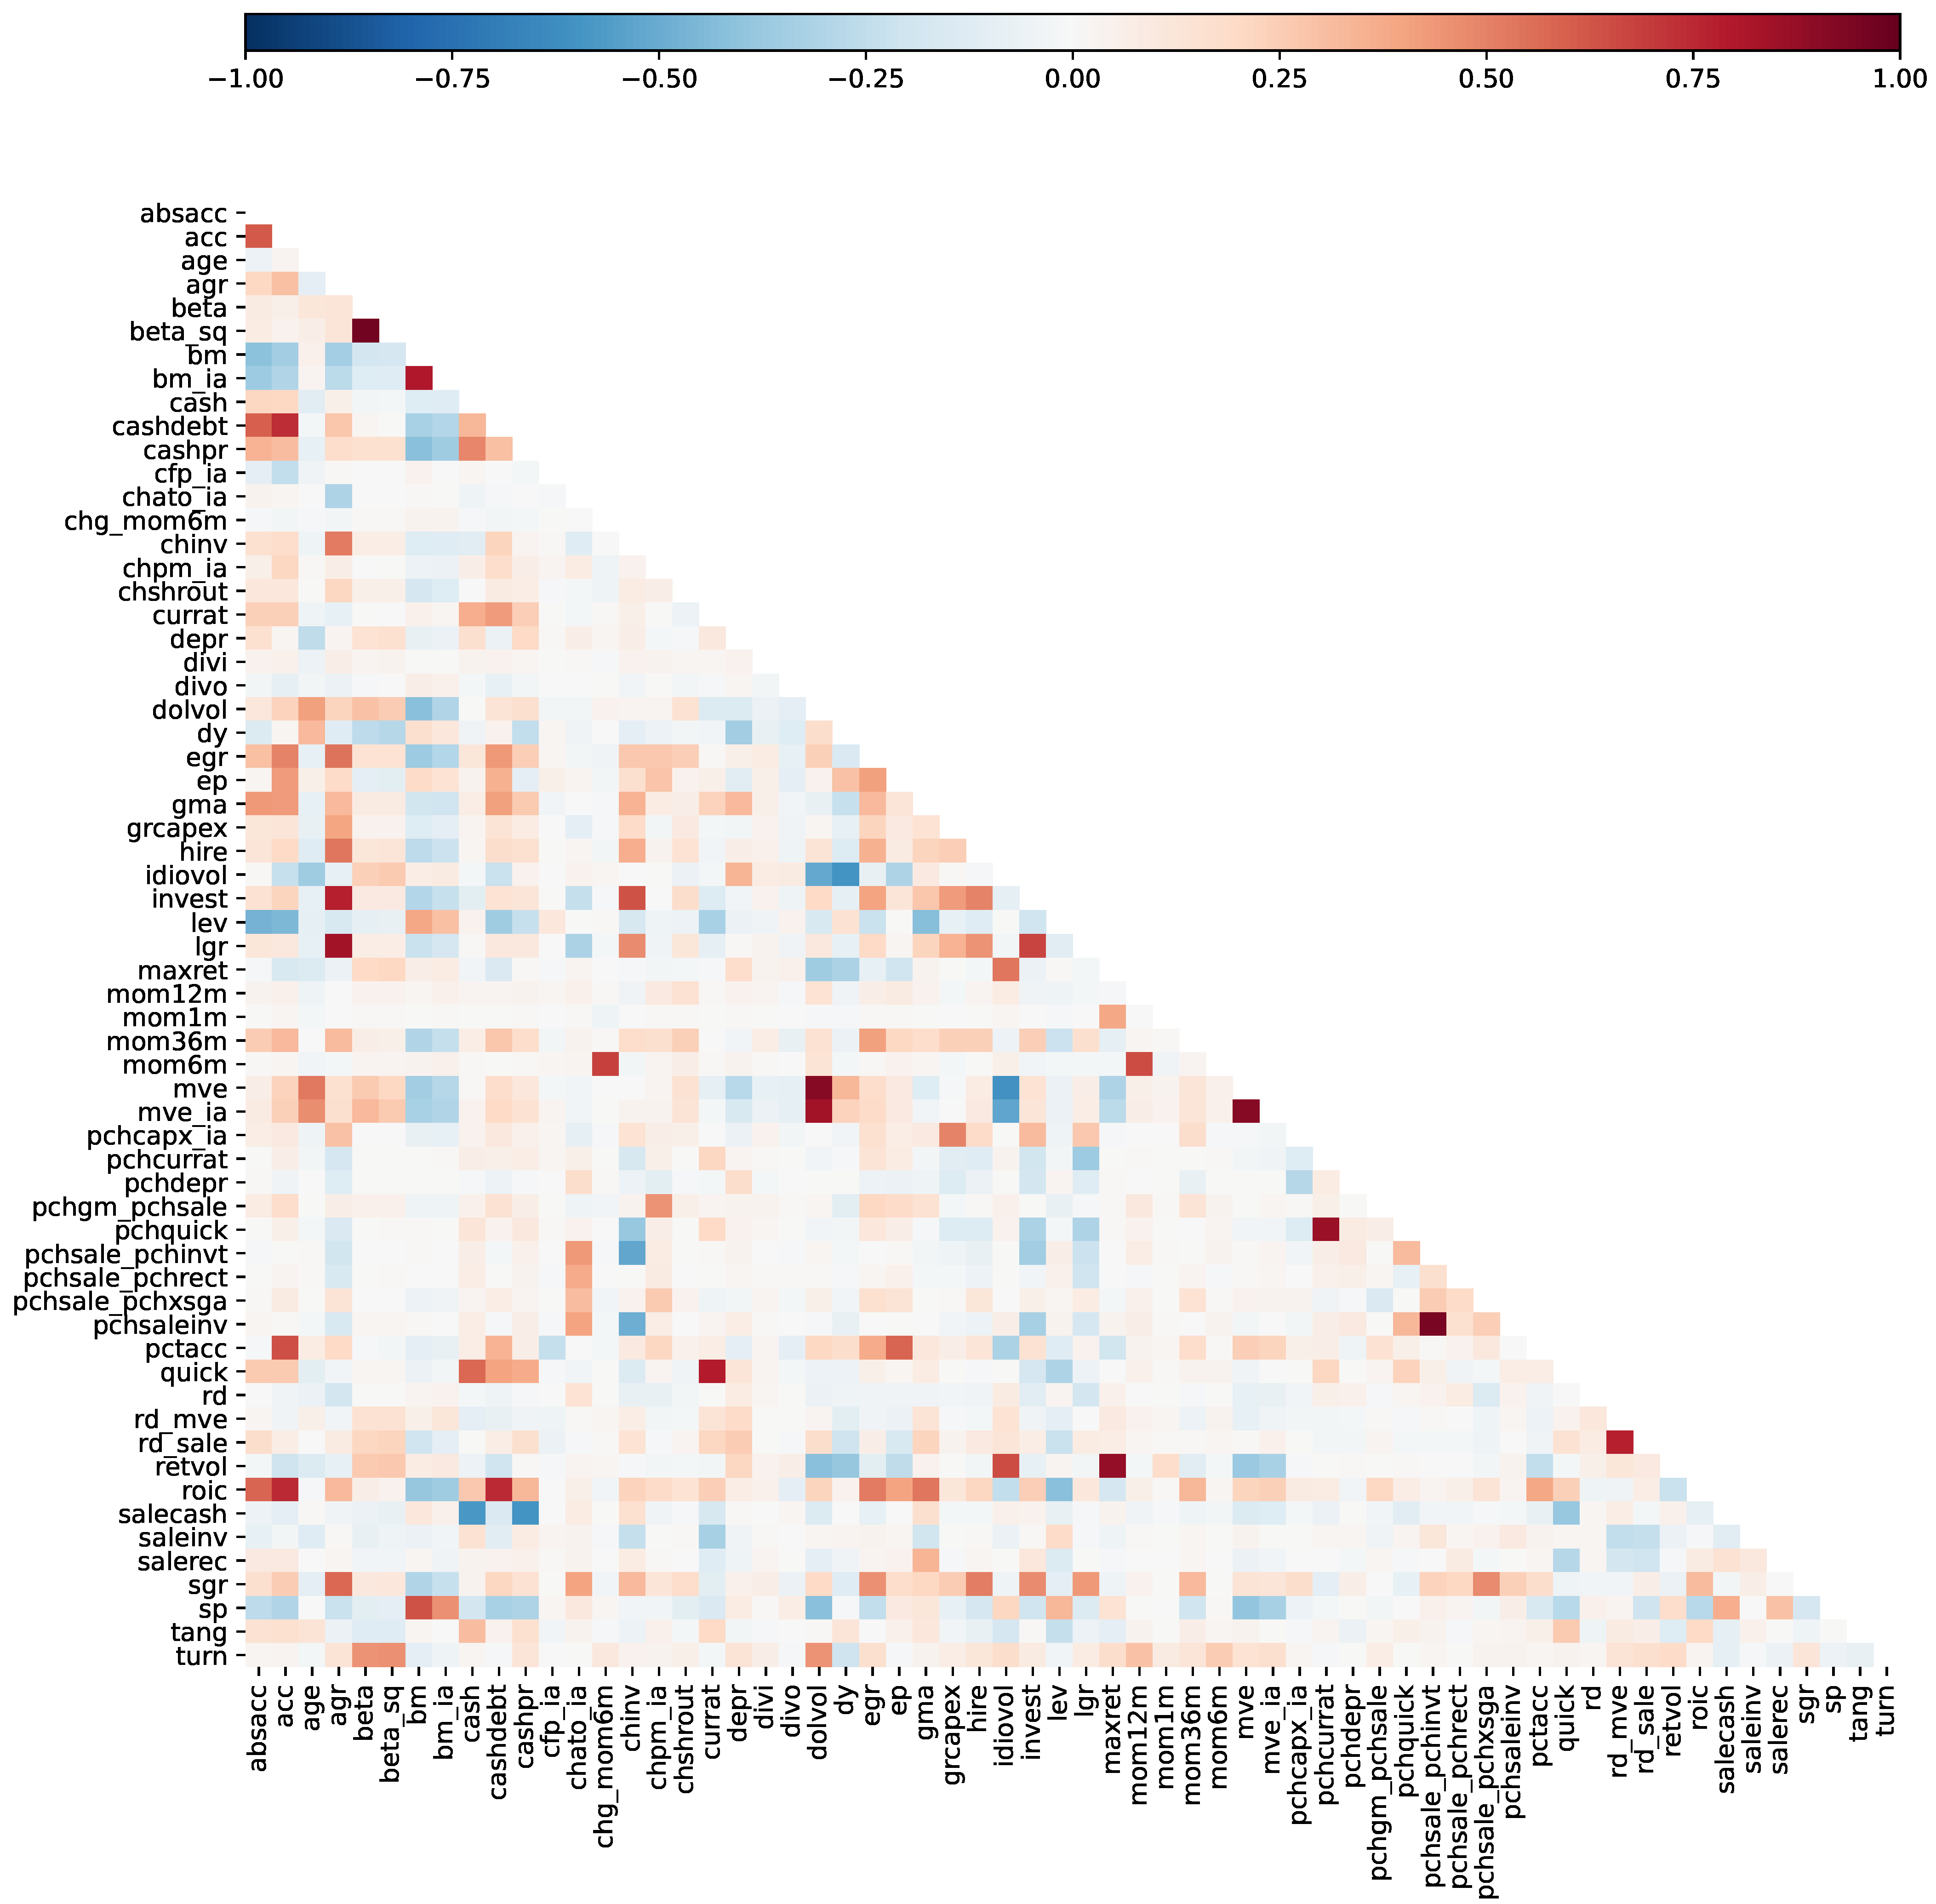
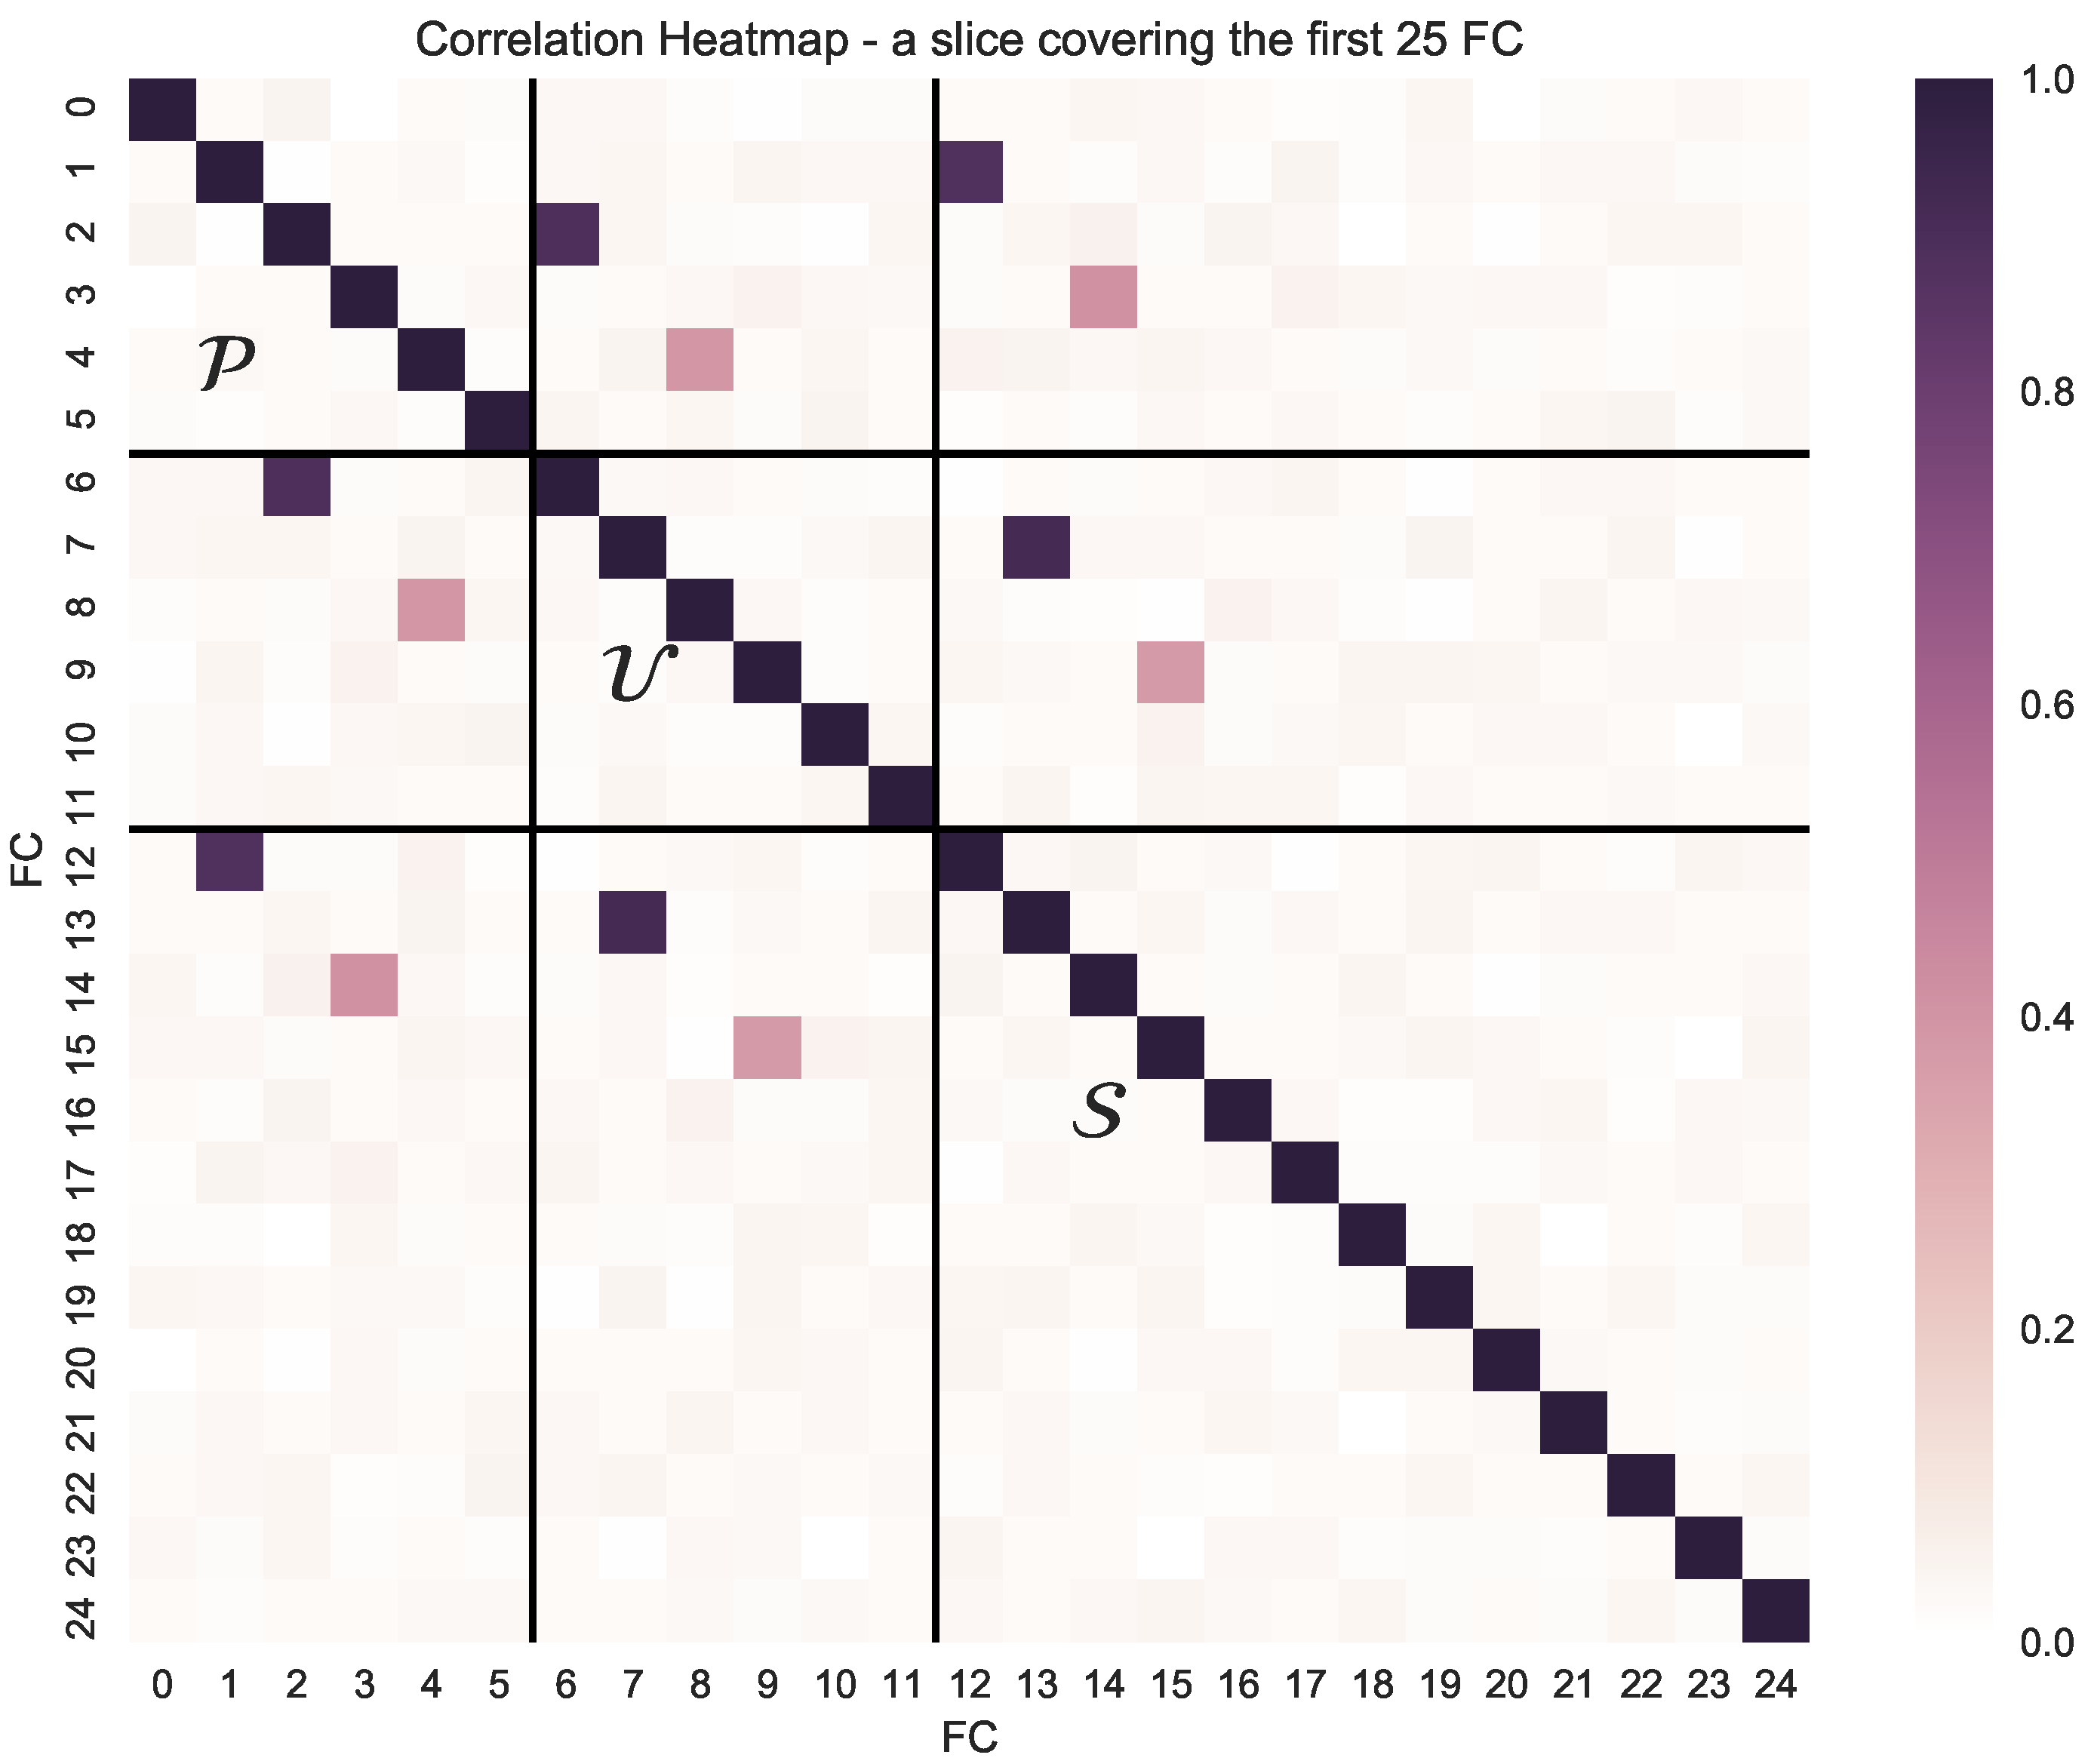
- The correlation matrix of FC, , is obtained following the simulation approach of Hardin et al. [44] and is a crucial feature of our simulation. It is important, as many FC measure empirically similar variations. The base case refers to the constant correlation structure within groups (Algorithm 1) in Hardin et al. [44]. The is drawn only initially and kept constant in each specification. The empirical correlation structure described in Section 5.1 shows a handful of cases with pairwise correlations around 0.9 and many between 0.4 and 0.5. Our simulated correlation pairs reflect this, in order to investigate the impact of this difference. However, this study does not consider a correlation grouping of more than two FCs, or any other forms of more involved linear dependencies.
- Number of simulations, 2000.
- Number of in-sample periods, 600, corresponding to 50 years of monthly data.
- Number of out-of-sample periods, 240, corresponding to 20 years of monthly data.
- Number of stocks, 4000, where 4000 corresponds to the average number of stocks used in the empirical part.
- Number of firm characteristics, 100—with , and .
- and result from the pre-specified level of , where the noise variance is distributed as described in the Appendix A.
- The correlation matrix, , is simulated such that we have one high (0.9) and one low (0.4) pairwise correlation between FC from each group. See Figure 1 for a visualization of one realization of the specified correlation matrix simulation.
3.2. Sensitivity Analysis
3.3. Performance Evaluation
3.3.1. Prediction
3.3.2. Selection
4. Data
5. Empirical Results
5.1. Estimation Set-Up
5.2. Predicting the Cross-Section of Returns
5.2.1. Performance Evaluation
5.3. Shrinking the Zoo of Firm Characteristics for Prediction
5.3.1. FC Selection including All Stocks
5.3.2. FC Selection Conditioned on Size
6. Conclusions
Author Contributions
Funding
Data Availability Statement
Acknowledgments
Conflicts of Interest
Appendix A
Appendix A.1. Signal-to-Noise Ratio
Appendix A.2. Simulation Study: Additional Robustness Checks
Appendix A.2.1. Additional Cases
Appendix A.2.2. Results

| Case | Method | — Type II | — Type I | — Type I | Summary FC 16–99 | ||||||||||||||||
|---|---|---|---|---|---|---|---|---|---|---|---|---|---|---|---|---|---|---|---|---|---|
| 0 | 1 | 2 | 3 | 4 | 5 | 6 | 7 | 8 | 9 | 10 | 11 | 12 | 13 | 14 | 15 | mean | std | min | max | ||
| 1a | POLS | 0.46 | 0.01 | 0.05 | 0.06 | 0.04 | 0.03 | 0.05 | 0.06 | 0.05 | 0.03 | 0.06 | 0.07 | 0.05 | 0.02 | 0.02 | 0.10 | ||||
| POLS BY | 0.84 | 0.10 | 0.01 | 0.01 | 0.01 | 0.01 | 0.01 | 0.01 | |||||||||||||
| POLS Holm | 0.85 | 0.10 | 0.01 | 0.01 | 0.01 | 0.01 | 0.01 | ||||||||||||||
| POLS Bonf | 0.85 | 0.10 | 0.01 | 0.01 | 0.01 | 0.01 | 0.01 | ||||||||||||||
| AL BIC | 0.01 | 0.03 | 0.15 | 0.12 | 0.14 | 0.17 | 0.18 | ||||||||||||||
| AL AIC | 0.01 | 0.03 | 0.19 | 0.12 | 0.18 | 0.20 | 0.21 | ||||||||||||||
| AL CV5 | 0.06 | 0.02 | 0.02 | 0.01 | 0.02 | 0.01 | 0.08 | 0.06 | 0.05 | 0.07 | 0.09 | ||||||||||
| L BIC | 0.01 | 0.41 | 0.66 | 0.62 | 0.70 | 0.66 | 0.76 | 0.24 | 0.15 | 0.06 | 0.02 | 0.01 | 0.01 | 0.03 | |||||||
| L AIC | 0.56 | 0.80 | 0.84 | 0.91 | 0.84 | 0.91 | 0.34 | 0.32 | 0.28 | 0.32 | 0.25 | 0.03 | 0.18 | 0.33 | |||||||
| L CV5 | 0.03 | 0.02 | 0.01 | 0.01 | 0.01 | 0.01 | 0.41 | 0.54 | 0.52 | 0.60 | 0.57 | 0.59 | 0.22 | 0.14 | 0.04 | 0.02 | 0.02 | 0.01 | 0.04 | ||
| 2a | POLS | 0.97 | 0.06 | 0.06 | 0.04 | 0.04 | 0.07 | 0.06 | 0.06 | 0.06 | 0.04 | 0.04 | 0.05 | 0.02 | 0.01 | 0.09 | |||||
| POLS BY | 1.00 | 0.12 | 0.01 | 0.01 | 0.01 | 0.01 | 0.01 | 0.01 | 0.01 | 0.01 | |||||||||||
| POLS Holm | 1.00 | 0.12 | 0.01 | 0.01 | 0.01 | 0.01 | 0.01 | 0.01 | 0.01 | 0.01 | |||||||||||
| POLS Bonf | 1.00 | 0.12 | 0.01 | 0.01 | 0.01 | 0.01 | 0.01 | 0.01 | 0.01 | 0.01 | |||||||||||
| AL BIC | 0.13 | 0.02 | 0.14 | 0.12 | 0.20 | 0.17 | 0.15 | ||||||||||||||
| AL AIC | 0.11 | 0.02 | 0.18 | 0.17 | 0.23 | 0.20 | 0.18 | ||||||||||||||
| AL CV5 | 0.53 | 0.19 | 0.27 | 0.21 | 0.19 | 0.20 | 0.01 | 0.04 | 0.01 | 0.04 | 0.03 | 0.02 | |||||||||
| L BIC | 0.04 | 0.38 | 0.65 | 0.63 | 0.65 | 0.61 | 0.65 | 0.26 | 0.17 | 0.02 | 0.02 | 0.01 | 0.01 | 0.03 | |||||||
| L AIC | 0.02 | 0.48 | 0.79 | 0.84 | 0.83 | 0.84 | 0.88 | 0.38 | 0.34 | 0.34 | 0.23 | 0.25 | 0.03 | 0.18 | 0.31 | ||||||
| L CV5 | 0.30 | 0.10 | 0.14 | 0.11 | 0.10 | 0.11 | 0.24 | 0.35 | 0.33 | 0.31 | 0.31 | 0.33 | 0.14 | 0.09 | 0.03 | 0.02 | 0.02 | 0.01 | 0.04 | ||
| 3a | POLS | 0.97 | 0.04 | 0.06 | 0.06 | 0.08 | 0.05 | 0.07 | 0.04 | 0.05 | 0.05 | 0.02 | 0.05 | 0.01 | 0.02 | 0.08 | |||||
| POLS BY | 1.00 | 0.01 | 0.01 | 0.01 | |||||||||||||||||
| POLS Holm | 1.00 | 0.01 | 0.01 | 0.01 | |||||||||||||||||
| POLS Bonf | 1.00 | 0.01 | 0.01 | 0.01 | |||||||||||||||||
| AL BIC | 0.15 | 0.06 | 0.06 | 0.12 | 0.06 | 0.09 | |||||||||||||||
| AL AIC | 0.15 | 0.07 | 0.08 | 0.14 | 0.10 | 0.11 | |||||||||||||||
| AL CV5 | 0.44 | 0.11 | 0.11 | 0.11 | 0.11 | 0.11 | 0.01 | 0.01 | 0.01 | 0.01 | 0.01 | ||||||||||
| L BIC | 0.03 | 0.43 | 0.55 | 0.57 | 0.67 | 0.69 | 0.63 | 0.28 | 0.16 | 0.04 | 0.01 | 0.01 | 0.01 | 0.03 | |||||||
| L AIC | 0.02 | 0.56 | 0.74 | 0.80 | 0.89 | 0.86 | 0.83 | 0.41 | 0.34 | 0.21 | 0.23 | 0.23 | 0.03 | 0.14 | 0.33 | ||||||
| L CV5 | 0.28 | 0.08 | 0.09 | 0.08 | 0.09 | 0.08 | 0.28 | 0.29 | 0.33 | 0.33 | 0.40 | 0.34 | 0.12 | 0.12 | 0.03 | 0.01 | 0.01 | 0.01 | 0.04 | ||
Appendix A.3. Firm Characteristics
| ID | Acronym | Name | Description | Reference |
|---|---|---|---|---|
| 1 | beta | Beta | Measured based on 3 years (min 52 weeks) weekly excess returns with standard ols () | Fama and MacBeth [8] |
| 2 | beta_sq | Beta squared | Simply obtained by squaring the based on the beta from # 1 | Fama and MacBeth [8] |
| 3 | retvol | Volatility | Volatility is measured by the standard deviation of daily returns of the previous months | Ang et al. [47] |
| 4 | maxret | Maximum return | Maximum return is defined over the max of the daily returns in month | Bali et al. [48] |
| 5 | idiovol | Idiosyncratic volatility | Calculated based on the residuals of regression in # 1 | Ali et al. [49] |
| 6 | mom1m | 1-month momentum | Return in month | Jegadeesh [50] |
| 7 | mom6m | 6-month momentum | Cumulative return over 5 months ending in | Jegadeesh and Titman [51] |
| 8 | mom12m | 12-month momentum | Cumulative return over 11 months ending in | Jegadeesh [50] |
| 9 | mom36m | 36-month momentum | Cumulative return over 24 months ending in | Bondt and Thaler [52] |
| 10 | mve | Market capitalization (size) | log of (SHROUT×PRC) | Banz [53] |
| 11 | ep | Earnings-to-price | Earnings per share | Basu [54] |
| 12 | dy | Dividends-to-price | Yearly dividends (dvt) divided by market cap at fiscal year | Litzenberger and Ramaswamy [55] |
| 13 | bm | Book-to-market | Book value of equity (ceq) divided by market cap | Rosenberg et al. [56] |
| 14 | lev | Leverage | Total liabilities (lt) divided by market cap | Bhandari [57] |
| 15 | currat | Current ratio | Current assets (act) divided by current liabilities (lct) | Ou and Penman [58] |
| 16 | pchcurrat | Pct change in current ratio | Percentage change in currat from year to t | Ou and Penman [58] |
| 17 | quick | Quick ratio | Current assets (act) minus inventory (invt), divided by current liabilities (lct) | Ou and Penman [58] |
| 18 | pchquick | Pct change in quick ratio | Percentage change in quick from year to t | Ou and Penman [58] |
| 19 | salecash | Sales-to-cash | Annual sales (sale) divided by cash and cash equivalents (che) | Ou and Penman [58] |
| 20 | salerec | Sales-to-receivables | Annual sales (sale) divided by accounts receivable (rect) | Ou and Penman [58] |
| 21 | saleinv | Sales-to-inventory | Annual sales (sale) divided by total invetory (invt) | Ou and Penman [58] |
| 22 | pchsaleinv | Pct change in sales-to-inventory | Percentage change in saleinv from year to t | Ou and Penman [58] |
| 23 | cashdebt | Cashflow-to-debt | Earnings before depreciation and extraordinary items (ib + dp) divided by avg total liabilities (lt) | Ou and Penman [58] |
| 24 | baspread | Illiquidity (bid-ask-spread) | Monthly avg of daily bid-ask spread divided by avg of daily bid-ask spread | Amihud and Mendelson [59] |
| 25 | depr | Depreciation-to-gross PP&E | Depreciation expense (dp) divided by gross PPE (ppegt) | Holthausen and Larcker [60] |
| 26 | pchdepr | Pct change in Depreciation-to-gross PP&E | Percentage change in depr from year to t | Holthausen and Larcker [60] |
| 27 | mve_ia | Industry-adjusted firm size | Log market caps are adjusted by log of the mean of the industry | Asness et al. [61] |
| 28 | cfp_ia | Industry-adjusted cashflow-to-price | Industry adjusted cash flow-to-price ratio equal weighted average | Asness et al. [61] |
| 29 | bm_ia | Industry-adjusted book-to-market | Industry adjusted book-to-market equal weighted average | Asness et al. [61] |
| 30 | sgr | Annual sales growth | Percentage change in sales from year to t | Lakonishok et al. [62] |
| 31 | ipo | IPO | Indicated by 1 if first 12 months available on CRSP monthly file | Loughran and Ritter [63] |
| 32 | divi | Dividend initiation | Indicated by 1 if company pays dividends but did not in prior year. | Michaely et al. [64] |
| 33 | divo | Dividend omission | Indicated by 1 if company does not pay dividends but did in prior year. | Michaely et al. [64] |
| 34 | sp | Sales-to-price | Annual sales (sale) divided by market cap | Barbee Jr et al. [65] |
| 35 | acc | WC accruals | (ib) - (oancf)/(at), if (oancf) is missing then (ib)-(delta_act)-(delta_che) -(delta_lct) | Sloan [66] |
| + (delta_dlc) + (txp-dp) where each item 0 if missing | ||||
| 36 | turn | Share turnover | Average monthly trading volume for the three months to divided by SHROUT at | Datar et al. [67] |
| 37 | pchsale_pchinvt | Delta pct change sales vs. inventory | Difference of percentage changes in sales (sale) and inventory (invt) | Abarbanell and Bushee [68] |
| 38 | pchsale_pchrect | Delta pct change sales vs. receivables | Difference of percentage changes in sales (sale) and receivables (rect) | Abarbanell and Bushee [68] |
| 39 | pchcapx_ia | CAPEX | Industry adjusted (two digit SIC) fiscal year mean adjusted percentage | Abarbanell and Bushee [68] |
| change in capital expenditures (capx) | ||||
| 40 | pchgm_pchsale | Delta pct gross margin vs. sales | Annual percentage change in gross margin (sale minus cogs) minus percentage change in sales (sale) | Abarbanell and Bushee [68] |
| ID | Acronym | Name | Description | Reference |
|---|---|---|---|---|
| 41 | pchsale_pchxsga | Delta pct sales vs. SGaA | Annual percentage change in sales (sale) minus percentage change in SGaA (xsga) | Abarbanell and Bushee [68] |
| 42 | dolvol | Dollar trading volume | Log of trading volume times price per share from month t-2 | Chordia et al. [69] |
| 43 | std_dolvol | Volatility trading volume | Monthly standard deviation of daily trading volume | Chordia et al. [69] |
| 44 | std_turn | Volatility turnover | Monthly standard deviation of daily share turnover | Chordia et al. [69] |
| 45 | chinv | Change in inventory | First difference of inventory (invt) divided by total assets | Thomas and Zhang [70] |
| 46 | pchemp_ia | Industry-adjusted pch in employees | Industry adjusted percentage change in employees | Asness et al. [61] |
| 47 | cfp | Cashflow-to-price | Operating cash flows (oancf) scaled by market capitalization (fiscal year end) | Desai et al. [71] |
| 48 | rd | R&D Increase | If annual increase in R&D expenses (xrd) scaled by total assets (at) >0.05, 1, else 0 | Eberhart et al. [72] |
| 49 | lgr | Pct change in long-term debt | Annual percentage change in long term debt (lt) | Richardson et al. [73] |
| 50 | egr | Pct change in book equity | Annual percentage change in book equity (ceq) | Richardson et al. [73] |
| 51 | rd_sale | R&D-to-sales | R&D expenses(xrd) scaled by sales (sale) | Guo et al. [74] |
| 52 | rd_mve | R&D-to-market | R&D expenses(xrd) scaled by market cap | Guo et al. [74] |
| 53 | chg_mom6m | change in mom6m | difference of mom6m measured at t and | Gettleman and Marks [75] |
| 54 | hire | Pct change in employee | Annual percentage change in employee (emp) | Belo et al. [76] |
| 55 | agr | Asset growth | Annual percentage change in assets (at) | Cooper et al. [77] |
| 56 | cashpr | Cash productivity | Market cap plus long term debt (dltt) minus assets (at) divided by cash (che) | Chandrashekar and Rao [78] |
| 57 | gma | Gross-profitability | Sales (sale) minus costs of goods sold (cogs) divided by one-year lagged assets(at) | Novy-Marx [79] |
| 58 | cash | Cash-to-assets | Cash (che) divided by assets(at) | Palazzo [80] |
| 59 | pctacc | Accruals-to-income | (ib) minus (oancf) divided by abs ((ib)), when (ib) equals 0, it is set to 0.01, if (oancf) is | Hafzalla et al. [81] |
| missing then (ib)-(delta_act)-(delta_che) -(delta_lct) + (delta_dlc) + (txp-dp) where each item 0 if missing | ||||
| 60 | absacc | Absolut accruals | Absolute value of acc | Bandyopadhyay et al. [82] |
| 61 | roic | Return on invested capital | Earnings before interest and taxes (ebit) - non-operating income (nopi), divided by non-cash enterprise value | Brown and Rowe [83] |
| (ceq+lt-che) | ||||
| 62 | grcapex | Pct change in two year CAPX | Percentage change in two year capital expenditure (capx) | Anderson and Garcia [84] |
| 63 | tang | Debt capacity-to-firm-tangability | (Cash (che) + 0.715 receivables (rect) + 0.547 inventory(invt) + 0.535 (ppegt))/ total assets (at) | Hahn and Lee [85] |
| 64 | chshrout | Change in shares-outstanding | Yearly percentage change in outstanding shares (SHROUT) | Pontiff and Woodgate [86] |
| 65 | invest | CAPEX and inventory | Yearly difference in gross property, plant and equipment (ppegt) + diff in (invt) / (t-1) total assets (at) | Chen and Zhang [87] |
| 66 | age | Years since CS coverage | Years since first compustat coverage years(datadate - min(datadate)) | Jiang et al. [88] |
| 67 | chpm_ia | Industry-adjusted change in profit margin | Industry adjusted (two-digit SIC) change in profit margin (ib/sale) | Soliman [89] |
| 68 | chato_ia | Industriy-adjusted change in asset turnover | Industry adjusted (two-digit SIC) change in asset turnover (sale/at) | Soliman [89] |
Appendix A.4. Code
Appendix A.5. Additional Figures
References
- Harvey, C.R.; Liu, Y.; Zhu, H. ... and the Cross-Section of Expected Returns. Rev. Financ. Stud. 2016, 29, 5. [Google Scholar] [CrossRef] [Green Version]
- McLean, R.D.; Pontiff, J. Does academic research destroy stock return predictability? J. Financ. 2016, 71, 5–32. [Google Scholar] [CrossRef]
- Green, J.; Hand, J.R.; Zhang, X.F. The characteristics that provide independent information about average us monthly stock returns. Rev. Financ. Stud. 2017, 30, 4389–4436. [Google Scholar] [CrossRef]
- Fama, E.F.; French, K.R. The cross-section of expected stock returns. J. Financ. 1992, 47, 427–465. [Google Scholar] [CrossRef]
- Fama, E.F.; French, K.R. Common risk factors in the returns on stocks and bonds. J. Financ. Econ. 1993, 33, 3–56. [Google Scholar] [CrossRef]
- Tibshirani, R. Regression shrinkage and selection via the lasso. J. R. Stat. Soc. Ser. Methodol. 1996, 267–288. [Google Scholar] [CrossRef]
- Zou, H. The adaptive Lasso and its oracle properties. J. Am. Stat. Assoc. 2006, 101, 1418–1429. [Google Scholar] [CrossRef] [Green Version]
- Fama, E.F.; MacBeth, J.D. Risk, return, and equilibrium: Empirical tests. J. Political Econ. 1973, 607–636. [Google Scholar] [CrossRef]
- Fama, E.F.; French, K.R. A five-factor asset pricing model. J. Financ. Econ. 2015, 116, 1–22. [Google Scholar] [CrossRef] [Green Version]
- Cochrane, J.H. Asset Pricing; Princeton University Press: Princeton, NJ, USA, 2005; Volume 41. [Google Scholar]
- Cochrane, J.H. Presidential address: Discount rates. J. Financ. 2011, 66, 1047–1108. [Google Scholar] [CrossRef]
- Goyal, A. Empirical cross-sectional asset pricing: A survey. Financ. Mark. Portf. Manag. 2012, 26, 3–38. [Google Scholar] [CrossRef] [Green Version]
- Hou, K.; Xue, C.; Zhang, L. Replicating anomalies. Rev. Financ. Stud. 2020, 33, 2019–2133. [Google Scholar] [CrossRef]
- Kozak, S.; Nagel, S.; Santosh, S. Shrinking the cross-section. J. Financ. Econ. 2020, 135, 271–292. [Google Scholar] [CrossRef]
- Feng, G.; Giglio, S.; Xiu, D. Taming the factor zoo: A test of new factors. J. Financ. 2020, 75, 1327–1370. [Google Scholar] [CrossRef]
- Bryzgalova, S. Spurious Factors in Linear Asset Pricing Models; Working Paper; Stanford University: Stanford, CA, USA, 2016. [Google Scholar]
- Freyberger, J.; Neuhierl, A.; Weber, M. Dissecting characteristics nonparametrically. Rev. Financ. Stud. 2020, 33, 2326–2377. [Google Scholar] [CrossRef]
- DeMiguel, V.; Martin-Utrera, A.; Nogales, F.J.; Uppal, R. A transaction-cost perspective on the multitude of firm characteristics. Rev. Financ. Stud. 2020, 33, 2180–2222. [Google Scholar] [CrossRef]
- Messmer, M. Deep learning and the Cross-Section of Expected Returns. 2017. Available online: https://ssrn.com/abstract=3081555 (accessed on 11 December 2017).
- Moritz, B.; Zimmermann, T. Tree-Based Conditional Portfolio Sorts: The Relation between Past and Future Stock Returns. 2016. Available online: https://ssrn.com/abstract=2740751 (accessed on 5 March 2016).
- Gu, S.; Kelly, B.; Xiu, D. Empirical asset pricing via machine learning. Rev. Financ. Stud. 2020, 33, 2223–2273. [Google Scholar] [CrossRef] [Green Version]
- Meinshausen, N. Quantile regression forests. J. Mach. Learn. Res. 2006, 7, 983–999. [Google Scholar]
- Bühlmann, P.; Van De Geer, S. Statistics for High-Dimensional Data: Methods, Theory and Applications; Springer: Berlin/Heidelberg, Germany, 2011. [Google Scholar]
- Medeiros, M.C.; Mendes, E.F. L1-regularization of high-dimensional time-series models with non-Gaussian and heteroskedastic errors. J. Econom. 2016, 191, 255–271. [Google Scholar] [CrossRef]
- Caner, M.; Zhang, H.H. Adaptive elastic net for generalized methods of moments. J. Bus. Econ. Stat. 2014, 32, 30–47. [Google Scholar] [CrossRef]
- Caner, M.; Kock, A.B. Asymptotically honest confidence regions for high dimensional parameters by the desparsified conservative lasso. J. Econom. 2018, 203, 143–168. [Google Scholar] [CrossRef]
- Kock, A.B.; Callot, L. Oracle inequalities for high dimensional vector autoregressions. J. Econom. 2015, 186, 325–344. [Google Scholar] [CrossRef] [Green Version]
- Audrino, F.; Camponovo, L. Oracle Properties, Bias Correction, and Bootstrap Inference for Adaptive Lasso for Time Series M-Estimators. J. Time Ser. Anal. 2018, 39, 111–128. [Google Scholar] [CrossRef]
- Kock, A.B. Consistent and conservative model selection with the adaptive lasso in stationary and nonstationary autoregressions. Econom. Theory 2016, 32, 243–259. [Google Scholar] [CrossRef]
- Kock, A.B. Oracle inequalities, variable selection and uniform inference in high-dimensional correlated random effects panel data models. J. Econom. 2016, 195, 71–85. [Google Scholar] [CrossRef]
- Medeiros, M.C.; Mendes, E. Estimating High-Dimensional Time Series Models; Working Paper; Pontificia Universidade Catolica (PUC): Rio de Janeiro, Brazil, 2012. [Google Scholar]
- Rosenberg, B. Extra-market components of covariance in security returns. J. Financ. Quant. Anal. 1974, 9, 263–274. [Google Scholar] [CrossRef]
- Daniel, K.; Titman, S. Evidence on the characteristics of cross sectional variation in stock returns. J. Financ. 1997, 52, 1–33. [Google Scholar] [CrossRef]
- Zhang, C.H.; Huang, J. The sparsity and bias of the lasso selection in high-dimensional linear regression. Ann. Stat. 2008, 36, 1567–1594. [Google Scholar] [CrossRef]
- Greenshtein, E.; Ritov, Y. Persistence in high-dimensional linear predictor selection and the virtue of overparametrization. Bernoulli 2004, 10, 971–988. [Google Scholar] [CrossRef]
- Bickel, P.J.; Ritov, Y.; Tsybakov, A.B. Simultaneous analysis of Lasso and Dantzig selector. Ann. Stat. 2009, 37, 1705–1732. [Google Scholar] [CrossRef]
- Sirimongkolkasem, T.; Drikvandi, R. On Regularisation Methods for Analysis of High Dimensional Data. Ann. Data Sci. 2019, 6, 737–763. [Google Scholar] [CrossRef]
- Driscoll, J.C.; Kraay, A.C. Consistent covariance matrix estimation with spatially dependent panel data. Rev. Econ. Stat. 1998, 80, 549–560. [Google Scholar] [CrossRef]
- Hansen, P.R.; Lunde, A.; Nason, J.M. The model confidence set. Econometrica 2011, 79, 453–497. [Google Scholar] [CrossRef] [Green Version]
- Campbell, J.Y.; Thompson, S.B. Predicting excess stock returns out of sample: Can anything beat the historical average? Rev. Financ. Stud. 2008, 21, 1509–1531. [Google Scholar] [CrossRef] [Green Version]
- Lewellen, J. The Cross-section of Expected Stock Returns. Crit. Financ. Rev. 2015, 4, 1–44. [Google Scholar] [CrossRef]
- Hansen, P.R.; Lunde, A. A Forecast Comparison of Volatility Models: Does Anything Beat a Garch(1,1)? J. Appl. Econom. 2005, 20, 873–889. [Google Scholar] [CrossRef] [Green Version]
- Bekaert, G.; Hodrick, R.J.; Zhang, X. Aggregate idiosyncratic volatility. J. Financ. Quant. Anal. 2012, 47, 1155–1185. [Google Scholar] [CrossRef]
- Hardin, J.; Garcia, S.R.; Golan, D. A method for generating realistic correlation matrices. Ann. Appl. Stat. 2013, 7, 1733–1762. [Google Scholar] [CrossRef]
- Ang, A.; Liu, J.; Schwarz, K. Using Stocks or Portfolios in Tests of Factor Models. J. Financ. Quant. Anal. 2020, 55, 709–750. [Google Scholar] [CrossRef] [Green Version]
- Fama, E.F.; French, K.R. Multifactor explanations of asset pricing anomalies. J. Financ. 1996, 51, 55–84. [Google Scholar] [CrossRef]
- Ang, A.; Hodrick, R.J.; Xing, Y.; Zhang, X. The cross-section of volatility and expected returns. J. Financ. 2006, 61, 259–299. [Google Scholar] [CrossRef]
- Bali, T.G.; Cakici, N.; Whitelaw, R.F. Maxing out: Stocks as lotteries and the cross-section of expected returns. J. Financ. Econ. 2011, 99, 427–446. [Google Scholar] [CrossRef] [Green Version]
- Ali, A.; Hwang, L.S.; Trombley, M.A. Arbitrage risk and the book-to-market anomaly. J. Financ. Econ. 2003, 69, 355–373. [Google Scholar] [CrossRef]
- Jegadeesh, N. Evidence of predictable behavior of security returns. J. Financ. 1990, 45, 881–898. [Google Scholar] [CrossRef]
- Jegadeesh, N.; Titman, S. Returns to buying winners and selling losers: Implications for stock market efficiency. J. Financ. 1993, 48, 65–91. [Google Scholar] [CrossRef]
- Bondt, W.F.; Thaler, R. Does the stock market overreact? J. Financ. 1985, 40, 793–805. [Google Scholar] [CrossRef]
- Banz, R.W. The relationship between return and market value of common stocks. J. Financ. Econ. 1981, 9, 3–18. [Google Scholar] [CrossRef] [Green Version]
- Basu, S. Investment performance of common stocks in relation to their price-earnings ratios: A test of the efficient market hypothesis. J. Financ. 1977, 32, 663–682. [Google Scholar] [CrossRef]
- Litzenberger, R.H.; Ramaswamy, K. The effect of personal taxes and dividends on capital asset prices: Theory and empirical evidence. J. Financ. Econ. 1979, 7, 163–195. [Google Scholar] [CrossRef]
- Rosenberg, B.; Reid, K.; Lanstein, R. Persuasive evidence of market inefficiency. J. Portf. Manag. 1985, 11, 9–16. [Google Scholar] [CrossRef]
- Bhandari, L.C. Debt/equity ratio and expected common stock returns: Empirical evidence. J. Financ. 1988, 507–528. [Google Scholar] [CrossRef]
- Ou, J.A.; Penman, S.H. Financial statement analysis and the prediction of stock returns. J. Account. Econ. 1989, 11, 295–329. [Google Scholar] [CrossRef]
- Amihud, Y.; Mendelson, H. The effects of beta, bid-ask spread, residual risk, and size on stock returns. J. Financ. 1989, 479–486. [Google Scholar] [CrossRef]
- Holthausen, R.W.; Larcker, D.F. The prediction of stock returns using financial statement information. J. Account. Econ. 1992, 15, 373–411. [Google Scholar] [CrossRef]
- Asness, C.S.; Porter, R.B.; Stevens, R.L. Predicting Stock Returns Using Industry-Relative Firm Characteristics. 2000. Available online: https://ssrn.com/abstract=213872 (accessed on 5 July 2000).
- Lakonishok, J.; Shleifer, A.; Vishny, R.W. Contrarian investment, extrapolation, and risk. J. Financ. 1994, 49, 1541–1578. [Google Scholar] [CrossRef]
- Loughran, T.; Ritter, J.R. The new issues puzzle. J. Financ. 1995, 50, 23–51. [Google Scholar] [CrossRef]
- Michaely, R.; Thaler, R.H.; Womack, K.L. Price Reactions to Dividend Initiations and Omissions: Overreaction or Drift? J. Financ. 1995, 50, 573–608. [Google Scholar] [CrossRef]
- Barbee, W.C., Jr.; Mukherji, S.; Raines, G.A. Do sales-price and debt-equity explain stock returns better than book-market and firm size? Financ. Anal. J. 1996, 52, 56–60. [Google Scholar] [CrossRef]
- Sloan, R. Do stock prices fully reflect information in accruals and cash flows about future earnings?(Digest summary). Account. Rev. 1996, 71, 289–315. [Google Scholar]
- Datar, V.T.; Naik, N.Y.; Radcliffe, R. Liquidity and stock returns: An alternative test. J. Financ. Mark. 1998, 1, 203–219. [Google Scholar] [CrossRef]
- Abarbanell, J.S.; Bushee, B.J. Fundamental analysis, future earnings, and stock prices. J. Account. Res. 1997, 1–24. [Google Scholar] [CrossRef]
- Chordia, T.; Subrahmanyam, A.; Anshuman, V.R. Trading activity and expected stock returns. J. Financ. Econ. 2001, 59, 3–32. [Google Scholar] [CrossRef]
- Thomas, J.K.; Zhang, H. Inventory changes and future returns. Rev. Account. Stud. 2002, 7, 163–187. [Google Scholar] [CrossRef]
- Desai, H.; Rajgopal, S.; Venkatachalam, M. Value-glamour and accruals mispricing: One anomaly or two? Account. Rev. 2004, 79, 355–385. [Google Scholar] [CrossRef]
- Eberhart, A.C.; Maxwell, W.F.; Siddique, A.R. An examination of long-term abnormal stock returns and operating performance following R&D increases. J. Financ. 2004, 59, 623–650. [Google Scholar]
- Richardson, S.A.; Sloan, R.G.; Soliman, M.T.; Tuna, I. Accrual reliability, earnings persistence and stock prices. J. Account. Econ. 2005, 39, 437–485. [Google Scholar] [CrossRef]
- Guo, R.J.; Lev, B.; Shi, C. Explaining the Short-and Long-Term IPO Anomalies in the US by R&D. J. Bus. Financ. Account. 2006, 33, 550–579. [Google Scholar]
- Gettleman, E.; Marks, J.M. Acceleration Strategies; Working Paper; University of Illinois, Urbana-Champaign: Champaign, IL, USA, 2006. [Google Scholar]
- Belo, F.; Lin, X.; Bazdresch, S. Labor hiring, investment, and stock return predictability in the cross section. J. Political Econ. 2014, 122, 129–177. [Google Scholar] [CrossRef] [Green Version]
- Cooper, M.J.; Gulen, H.; Schill, M.J. Asset growth and the cross-section of stock returns. J. Financ. 2008, 63, 1609–1651. [Google Scholar] [CrossRef]
- Chandrashekar, S.; Rao, R.K. The Productivity of Corporate Cash Holdings and the Cross-Section of Expected Stock Returns; Working Paper; University of Texas: Austin, TX, USA, 2009. [Google Scholar]
- Novy-Marx, R. The other side of value: The gross profitability premium. J. Financ. Econ. 2013, 108, 1–28. [Google Scholar] [CrossRef] [Green Version]
- Palazzo, B. Cash holdings, risk, and expected returns. J. Financ. Econ. 2012, 104, 162–185. [Google Scholar] [CrossRef] [Green Version]
- Hafzalla, N.; Lundholm, R.; Matthew Van Winkle, E. Percent accruals. Account. Rev. 2011, 86, 209–236. [Google Scholar] [CrossRef]
- Bandyopadhyay, S.P.; Huang, A.G.; Wirjanto, T.S. The Accrual Volatility Anomaly; Technical Report, Working Paper; University of Waterloo: Waterloo, ON, Canada, 2010. [Google Scholar]
- Brown, D.P.; Rowe, B. The Productivity Premium in Equity Returns 2007. Available online: https://ssrn.com/abstract=993467 (accessed on 13 June 2007).
- Anderson, C.W.; Garcia-Feijóo, L. Empirical evidence on capital investment, growth options, and security returns. J. Financ. 2006, 61, 171–194. [Google Scholar] [CrossRef]
- Hahn, J.; Lee, H. Financial constraints, debt capacity, and the cross-section of stock returns. J. Financ. 2009, 64, 891–921. [Google Scholar] [CrossRef]
- Pontiff, J.; Woodgate, A. Share Issuance and Cross-sectional Returns. J. Financ. 2008, 63, 921–945. [Google Scholar] [CrossRef]
- Chen, L.; Zhang, L. A better three-factor model that explains more anomalies. J. Financ. 2010, 65, 563–595. [Google Scholar]
- Jiang, G.; Lee, C.M.; Zhang, Y. Information uncertainty and expected returns. Rev. Account. Stud. 2005, 10, 185–221. [Google Scholar] [CrossRef]
- Soliman, M.T. The use of DuPont analysis by market participants. Account. Rev. 2008, 83, 823–853. [Google Scholar] [CrossRef]


| Case | Method | — Type II | — Type I | — Type I | Summary FC 16-99 | ||||||||||||||||
|---|---|---|---|---|---|---|---|---|---|---|---|---|---|---|---|---|---|---|---|---|---|
| 0 | 1 | 2 | 3 | 4 | 5 | 6 | 7 | 8 | 9 | 10 | 11 | 12 | 13 | 14 | 15 | mean | std | min | max | ||
| 1 | POLS | 0.50 | 0.05 | 0.04 | 0.06 | 0.06 | 0.05 | 0.05 | 0.05 | 0.05 | 0.05 | 0.04 | 0.05 | 0.01 | 0.04 | 0.06 | |||||
| POLS BY | 0.88 | 0.06 | 0.04 | 0.02 | |||||||||||||||||
| POLS Holm | 0.89 | 0.06 | 0.04 | 0.02 | |||||||||||||||||
| POLS Bonf | 0.90 | 0.06 | 0.04 | 0.02 | |||||||||||||||||
| AL BIC | 0.02 | 0.01 | 0.11 | 0.11 | 0.12 | 0.12 | 0.13 | ||||||||||||||
| AL AIC | 0.02 | 0.01 | 0.13 | 0.14 | 0.16 | 0.15 | 0.16 | ||||||||||||||
| AL CV5 | 0.14 | 0.10 | 0.11 | 0.09 | 0.08 | 0.10 | 0.05 | 0.05 | 0.06 | 0.05 | 0.06 | ||||||||||
| L BIC | 0.01 | 0.40 | 0.60 | 0.63 | 0.65 | 0.65 | 0.63 | 0.28 | 0.18 | 0.05 | 0.02 | 0.01 | 0.01 | ||||||||
| L AIC | 0.52 | 0.78 | 0.83 | 0.84 | 0.85 | 0.83 | 0.42 | 0.35 | 0.29 | 0.26 | 0.25 | 0.01 | 0.21 | 0.27 | |||||||
| L CV5 | 0.09 | 0.06 | 0.06 | 0.06 | 0.06 | 0.06 | 0.37 | 0.51 | 0.53 | 0.55 | 0.54 | 0.55 | 0.25 | 0.17 | 0.07 | 0.04 | 0.03 | 0.02 | 0.04 | ||
| 2 | POLS | 0.52 | 0.04 | 0.17 | 0.12 | 0.05 | 0.06 | 0.05 | 0.06 | 0.06 | 0.06 | 0.06 | 0.05 | 0.05 | 0.05 | 0.06 | 0.06 | 0.04 | 0.07 | ||
| POLS BY | 0.90 | 0.36 | 0.65 | 0.58 | 0.41 | 0.03 | |||||||||||||||
| POLS Holm | 0.89 | 0.32 | 0.61 | 0.54 | 0.37 | 0.02 | |||||||||||||||
| POLS Bonf | 0.89 | 0.33 | 0.62 | 0.54 | 0.37 | 0.02 | |||||||||||||||
| AL BIC | 0.03 | 0.07 | 0.01 | 0.10 | 0.36 | 0.32 | 0.38 | 0.37 | 0.37 | ||||||||||||
| AL AIC | 0.02 | 0.05 | 0.01 | 0.11 | 0.39 | 0.37 | 0.43 | 0.41 | 0.41 | ||||||||||||
| AL CV5 | 0.15 | 0.11 | 0.25 | 0.15 | 0.12 | 0.08 | 0.05 | 0.15 | 0.13 | 0.16 | 0.15 | 0.15 | |||||||||
| L BIC | 0.01 | 0.02 | 0.47 | 0.74 | 0.74 | 0.76 | 0.79 | 0.78 | 0.29 | 0.23 | 0.05 | 0.04 | 0.01 | 0.01 | 0.02 | ||||||
| L AIC | 0.01 | 0.63 | 0.85 | 0.89 | 0.90 | 0.90 | 0.90 | 0.39 | 0.37 | 0.28 | 0.27 | 0.26 | 0.01 | 0.23 | 0.29 | ||||||
| L CV5 | 0.10 | 0.07 | 0.11 | 0.08 | 0.07 | 0.06 | 0.38 | 0.51 | 0.49 | 0.52 | 0.53 | 0.52 | 0.17 | 0.12 | 0.02 | 0.02 | 0.01 | 0.01 | 0.02 | ||
| 3 | POLS | 0.06 | 0.05 | 0.06 | 0.05 | 0.05 | 0.05 | 0.06 | 0.05 | 0.04 | 0.05 | 0.05 | 0.01 | 0.04 | 0.06 | ||||||
| POLS BY | 0.04 | ||||||||||||||||||||
| POLS Holm | 0.04 | ||||||||||||||||||||
| POLS Bonf | 0.04 | ||||||||||||||||||||
| AL BIC | |||||||||||||||||||||
| AL AIC | 0.01 | 0.01 | |||||||||||||||||||
| AL CV5 | |||||||||||||||||||||
| L BIC | 0.37 | 0.37 | 0.38 | 0.40 | 0.40 | 0.43 | 0.26 | 0.10 | 0.03 | 0.02 | 0.01 | 0.01 | |||||||||
| L AIC | 0.46 | 0.62 | 0.70 | 0.71 | 0.71 | 0.74 | 0.39 | 0.30 | 0.23 | 0.24 | 0.22 | 0.01 | 0.20 | 0.24 | |||||||
| L CV5 | 0.42 | 0.49 | 0.52 | 0.56 | 0.54 | 0.57 | 0.33 | 0.19 | 0.11 | 0.10 | 0.06 | 0.01 | 0.05 | 0.08 | |||||||
| 4 | POLS | 0.34 | 0.06 | 0.05 | 0.06 | 0.06 | 0.05 | 0.06 | 0.06 | 0.06 | 0.05 | 0.05 | 0.05 | 0.04 | 0.06 | ||||||
| POLS BY | 0.79 | ||||||||||||||||||||
| POLS Holm | 0.80 | ||||||||||||||||||||
| POLS Bonf | 0.81 | ||||||||||||||||||||
| AL BIC | 0.01 | 0.02 | 0.21 | 0.19 | 0.24 | 0.22 | 0.24 | ||||||||||||||
| AL AIC | 0.01 | 0.02 | 0.24 | 0.23 | 0.27 | 0.26 | 0.28 | ||||||||||||||
| AL CV5 | 0.04 | 0.10 | 0.09 | 0.11 | 0.10 | 0.11 | |||||||||||||||
| L BIC | 0.43 | 0.70 | 0.71 | 0.74 | 0.75 | 0.74 | 0.31 | 0.22 | 0.04 | 0.03 | 0.01 | 0.01 | 0.01 | ||||||||
| L AIC | 0.58 | 0.83 | 0.87 | 0.87 | 0.89 | 0.90 | 0.42 | 0.37 | 0.28 | 0.29 | 0.26 | 0.01 | 0.23 | 0.28 | |||||||
| L CV5 | 0.02 | 0.42 | 0.58 | 0.58 | 0.62 | 0.62 | 0.62 | 0.25 | 0.16 | 0.04 | 0.04 | 0.02 | 0.02 | 0.03 | |||||||
| 5 | POLS | 0.44 | 0.02 | 0.05 | 0.06 | 0.05 | 0.05 | 0.06 | 0.05 | 0.05 | 0.06 | 0.05 | 0.05 | 0.05 | 0.04 | 0.06 | |||||
| POLS BY | 0.88 | 0.03 | 0.27 | 0.05 | |||||||||||||||||
| POLS Holm | 0.88 | 0.03 | 0.26 | 0.05 | |||||||||||||||||
| POLS Bonf | 0.89 | 0.03 | 0.27 | 0.05 | |||||||||||||||||
| AL BIC | 0.03 | 0.01 | 0.03 | 0.06 | 0.07 | 0.08 | 0.09 | 0.07 | 0.01 | 0.01 | |||||||||||
| AL AIC | 0.02 | 0.08 | 0.15 | 0.16 | 0.20 | 0.19 | 0.17 | 0.02 | 0.04 | 0.01 | 0.01 | 0.01 | |||||||||
| AL CV5 | 0.07 | 0.01 | 0.03 | 0.02 | 0.01 | 0.01 | 0.04 | 0.06 | 0.07 | 0.07 | 0.08 | 0.08 | 0.01 | 0.01 | |||||||
| L BIC | 0.02 | 0.33 | 0.16 | 0.21 | 0.20 | 0.19 | 0.18 | 0.27 | 0.06 | 0.04 | 0.02 | 0.01 | 0.01 | ||||||||
| L AIC | 0.01 | 0.42 | 0.44 | 0.52 | 0.54 | 0.55 | 0.55 | 0.38 | 0.25 | 0.23 | 0.20 | 0.20 | 0.01 | 0.18 | 0.22 | ||||||
| L CV5 | 0.04 | 0.01 | 0.01 | 0.01 | 0.01 | 0.01 | 0.39 | 0.34 | 0.39 | 0.40 | 0.41 | 0.42 | 0.34 | 0.17 | 0.15 | 0.10 | 0.09 | 0.01 | 0.08 | 0.11 | |
| Size Sample | Estimator | MSE | MCS | Median # | Mean # | ∑ abs(coef) | |
|---|---|---|---|---|---|---|---|
| All | AL AIC | 142.48 | 0.39 | 0.60 | 26.6 | 25.0 | 3.7 |
| AL BIC | 142.49 | 0.21 | 0.60 | 21.5 | 20.8 | 3.2 | |
| AL CV5 | 142.48 | 0.52 | 0.60 | 16.8 | 15.9 | 2.7 | |
| L AIC | 142.50 | 0.05 | 0.59 | 41.8 | 42.0 | 4.6 | |
| L BIC | 142.47 | 0.69 | 0.61 | 31.8 | 31.9 | 3.4 | |
| L CV5 | 142.47 | 0.91 | 0.62 | 29.8 | 30.5 | 3.1 | |
| POLS PVSOLS | 142.49 | 0.49 | 0.58 | 18.0 | 17.8 | 3.3 | |
| POLS PVSOLS Holm | 142.52 | 0.50 | 0.54 | 6.5 | 6.5 | 1.8 | |
| Zero | 143.04 | 0.01 | 0.00 | 0.0 | 0.0 | 0.0 | |
| Large | AL AIC | 73.48 | 0.17 | −0.13 | 21.9 | 20.5 | 2.1 |
| AL BIC | 73.47 | 0.33 | −0.11 | 13.2 | 12.6 | 1.5 | |
| AL CV5 | 73.41 | 0.83 | −0.03 | 4.0 | 5.1 | 0.7 | |
| L AIC | 73.49 | 0.17 | −0.17 | 39.2 | 39.5 | 3.0 | |
| L BIC | 73.44 | 0.72 | −0.07 | 21.2 | 20.4 | 1.4 | |
| L CV5 | 73.45 | 0.48 | −0.06 | 11.1 | 14.0 | 0.9 | |
| POLS PVSOLS | 73.46 | 0.43 | −0.13 | 12.1 | 11.5 | 1.5 | |
| POLS PVSOLS Holm | 73.40 | 0.82 | −0.01 | 1.2 | 1.5 | 0.3 | |
| Zero | 73.39 | 0.89 | 0.00 | 0.0 | 0.0 | 0.0 | |
| Large + mid | AL AIC | 97.60 | 0.60 | −0.05 | 23.2 | 22.3 | 2.4 |
| AL BIC | 97.59 | 0.58 | −0.04 | 15.5 | 15.3 | 1.8 | |
| AL CV5 | 97.58 | 0.72 | −0.02 | 5.5 | 7.3 | 1.0 | |
| L AIC | 97.61 | 0.25 | −0.08 | 42.1 | 41.4 | 3.5 | |
| L BIC | 97.58 | 0.74 | −0.03 | 27.0 | 26.2 | 1.9 | |
| L CV5 | 97.58 | 0.73 | −0.02 | 17.4 | 18.0 | 1.3 | |
| POLS PVSOLS | 97.58 | 0.73 | −0.05 | 14.2 | 14.2 | 2.1 | |
| POLS PVSOLS Holm | 97.53 | 0.96 | 0.00 | 3.2 | 3.4 | 0.6 | |
| Zero | 97.52 | 0.84 | 0.00 | 0.0 | 0.0 | 0.0 | |
| Mid | AL AIC | 118.75 | 0.16 | −0.04 | 24.0 | 23.4 | 2.7 |
| AL BIC | 118.73 | 0.16 | −0.01 | 10.0 | 10.3 | 1.4 | |
| AL CV5 | 118.71 | 0.43 | −0.01 | 7.0 | 8.1 | 1.1 | |
| L AIC | 118.76 | 0.17 | −0.06 | 39.8 | 39.3 | 3.5 | |
| L BIC | 118.68 | 0.83 | 0.03 | 15.0 | 15.1 | 1.2 | |
| L CV5 | 118.70 | 0.45 | 0.00 | 15.8 | 17.2 | 1.4 | |
| POLS PVSOLS | 118.74 | 0.29 | −0.05 | 13.1 | 13.5 | 2.3 | |
| POLS PVSOLS Holm | 118.67 | 0.87 | −0.01 | 3.2 | 3.4 | 0.8 | |
| Zero | 118.65 | 0.86 | 0.00 | 0.0 | 0.0 | 0.0 | |
| Small | AL AIC | 187.66 | 0.45 | 0.76 | 29.9 | 28.1 | 4.6 |
| AL BIC | 187.67 | 0.33 | 0.76 | 19.0 | 18.5 | 3.5 | |
| AL CV5 | 187.68 | 0.31 | 0.75 | 19.2 | 18.3 | 3.4 | |
| L AIC | 187.67 | 0.09 | 0.75 | 41.4 | 41.1 | 5.3 | |
| L BIC | 187.64 | 0.83 | 0.77 | 26.0 | 25.0 | 3.3 | |
| L CV5 | 187.64 | 0.68 | 0.77 | 30.0 | 29.6 | 3.6 | |
| POLS PVSOLS | 187.69 | 0.35 | 0.73 | 17.8 | 16.7 | 4.0 | |
| POLS PVSOLS Holm | 187.81 | 0.16 | 0.61 | 5.8 | 5.9 | 2.2 | |
| Zero | 188.63 | 0.00 | 0.00 | 0.0 | 0.0 | 0.0 |
| Sample | All | Large | Mid | Small | ||||||||
|---|---|---|---|---|---|---|---|---|---|---|---|---|
| Method | AL CV5 | L CV5 | POLS | AL CV5 | L CV5 | POLS | AL CV5 | L CV5 | POLS | AL CV5 | L CV5 | POLS |
| # selected | 21 | 47 | 23 (13) | 14 | 38 | 10 (0) | 18 | 50 | 14 (6) | 25 | 54 | 17 (9) |
| absacc | −0.50 | −0.85 | −1.03 (3.36) | −0.19 (0.75) | −0.32 | −0.49 (1.82) | −0.55 | −0.97 | −1.21 (3.07) | |||
| acc | −0.45 | −0.77 (2.32) | −0.33 | −0.70 (2.40) | −0.34 | −0.60 (1.81) | −0.82 | −1.25 (2.82) | ||||
| age | −0.13 | −0.12 (0.56) | −0.04 | −0.07 (0.25) | 0.03 (0.13) | 0.32 | 0.43 (1.45) | |||||
| agr | −1.96 | −1.29 | −1.52 (4.67) | −0.43 | −0.53 | −0.87 (2.30) | −1.02 | −0.95 | −1.17 (2.37) | −2.22 | −1.79 | −2.05 (5.37) |
| beta | 1.12 | 1.39 | 1.58 (2.38) | 0.02 | 0.31 (0.49) | 1.31 | 1.39 | 1.58 (2.23) | 1.06 | 1.14 | 1.33 (2.03) | |
| bm | 1.39 | 1.12 | 1.20 (3.86) | 0.41 | 0.72 (1.94) | 0.18 | 0.30 (0.71) | 0.29 | 0.48 | 0.52 (1.24) | ||
| bm_ia | 0.18 | 0.19 (0.73) | −0.20 (0.59) | 0.07 | 0.11 (0.28) | 0.43 | 0.53 | 0.53 (1.76) | ||||
| cash | 0.48 | 0.82 | 0.82 (1.45) | 0.25 | 0.35 (0.54) | 0.18 | 0.72 | 0.92 (1.55) | 0.79 | 0.99 | 0.93 (1.55) | |
| cashdebt | 0.34 | 0.59 | 0.72 (2.25) | 0.24 | 0.53 (1.35) | 0.37 | 0.65 | 0.82 (1.90) | 0.54 | 0.79 | 0.95 (2.61) | |
| cashpr | −0.08 | −0.13 (0.69) | −0.09 | −0.21 (0.99) | −0.08 | −0.15 (0.76) | −0.27 | −0.38 (1.50) | ||||
| cfp_ia | 0.42 | 0.52 | 0.50 (2.66) | −0.22 (1.00) | −0.07 (0.30) | 0.48 | 0.54 | 0.53 (1.68) | ||||
| chato_ia | 0.43 | 0.52 (3.11) | 0.11 | 0.32 (1.43) | 0.15 | 0.24 (1.11) | 0.18 | 0.30 (1.13) | ||||
| chg_mom6m | −1.52 | −1.84 | −2.29 (2.86) | −3.00 | −2.75 | −3.57 (2.73) | −2.32 | −1.84 | −2.44 (2.43) | −0.24 | −0.79 (0.95) | |
| chinv | −0.05 | 0.03 (0.15) | 0.16 (0.49) | −0.16 | −0.09 (0.35) | −0.10 | −0.02 (0.07) | |||||
| chpm_ia | 0.07 (0.48) | 0.03 | 0.15 (1.00) | 0.27 | 0.36 (1.91) | −0.10 | −0.20 (0.87) | |||||
| chshrout | −0.35 | −0.58 | −0.63 (2.84) | −0.05 (0.21) | −0.35 | −0.45 (1.72) | −0.43 | −0.61 | −0.65 (1.98) | |||
| currat | −0.11 | −1.55 (1.85) | −0.46 | −1.56 (1.69) | −0.30 | −0.71 | −2.05 (1.94) | −1.85 (1.66) | ||||
| depr | 0.04 | 0.09 (0.40) | 0.08 | 0.11 (0.44) | 0.20 | 0.18 (0.71) | 0.48 | 0.62 (1.94) | ||||
| divi | −0.03 (0.21) | −0.13 | −0.23 (1.90) | −0.08 | −0.17 (0.99) | −0.01 (0.04) | ||||||
| divo | 0.01 | 0.08 (0.57) | −0.09 (0.72) | 0.04 | 0.12 (0.80) | 0.08 | 0.16 (0.74) | |||||
| dolvol | 0.46 (0.60) | 0.21 (0.33) | 0.15 | 0.67 (1.58) | 0.59 | 1.16 (1.68) | ||||||
| dy | −0.64 | −0.82 | −0.87 (2.74) | −0.29 | −0.43 (1.21) | −0.20 | −0.55 | −0.63 (1.91) | −0.48 | −0.76 | −0.86 (2.40) | |
| egr | −0.18 | −0.21 (1.18) | −0.31 | −0.30 (1.49) | −0.05 (0.22) | 0.12 | 0.26 (1.00) | |||||
| ep | 1.22 | 1.36 | 1.46 (4.28) | 0.47 | 0.69 | 0.74 (2.26) | 0.49 | 0.65 | 0.71 (1.81) | 1.82 | 1.95 | 2.12 (4.88) |
| gma | 1.46 | 1.33 | 1.42 (4.74) | 0.12 | 0.60 | 0.80 (1.95) | 1.06 | 1.08 | 1.22 (3.56) | 1.60 | 1.50 | 1.59 (4.36) |
| grcapex | −0.23 | −0.28 (1.87) | −0.03 | −0.11 (0.56) | −0.47 | −0.65 | −0.72 (3.47) | −0.31 | −0.36 (1.62) | |||
| hire | 0.06 | 0.20 (0.94) | 0.08 (0.34) | 0.24 | 0.40 (1.78) | −0.19 | −0.25 (0.97) | |||||
| idiovol | −3.93 | −4.08 | −4.34 (7.03) | −0.22 | −0.59 | −0.90 (1.84) | −2.11 | −2.13 | −2.41 (4.51) | −4.62 | −4.46 | −4.67 (6.91) |
| invest | −0.34 | −0.35 (1.15) | 0.10 (0.33) | −0.02 | 0.05 (0.13) | −0.32 | −0.40 | −0.34 (0.89) | ||||
| lev | 0.14 | 0.22 (0.50) | 0.13 | 0.20 (0.43) | 0.38 | 0.53 (1.26) | 0.46 | 0.70 | 0.83 (1.40) | |||
| lgr | 0.19 (0.94) | 0.33 (1.21) | 0.01 (0.04) | 0.20 (0.71) | ||||||||
| maxret | 0.19 (0.29) | 0.57 (1.03) | 0.39 (0.71) | −0.68 | −0.63 (0.71) | |||||||
| mom12m | 2.56 | 2.35 | 2.08 (2.12) | 0.31 | −0.23 (0.20) | 0.69 | 0.34 (0.32) | 3.88 | 3.59 | 3.28 (3.05) | ||
| mom1m | −4.23 | −4.19 | −4.27 (6.63) | −1.31 | −1.39 | −1.65 (3.03) | −2.18 | −2.14 | −2.26 (4.04) | −6.48 | −6.23 | −6.23 (7.41) |
| mom36m | 0.26 | 0.40 (0.94) | 0.08 (0.19) | 0.07 | 0.27 (0.72) | 0.32 | 0.46 (0.96) | |||||
| mom6m | 1.44 | 1.86 | 2.43 (2.06) | 2.49 | 2.13 | 3.17 (2.02) | 2.96 | 2.20 | 2.95 (2.24) | 0.35 | 1.04 (0.85) | |
| mve | −0.52 | −1.68 (1.33) | −0.64 | −1.23 | −2.01 (2.43) | −0.18 | −0.53 | −0.97 (2.42) | −0.09 | −0.70 (0.65) | ||
| mve_ia | 0.54 (0.49) | 0.48 | 0.95 (1.36) | 0.19 | 0.37 (0.68) | −0.39 | −0.85 | −0.87 (0.98) | ||||
| pchcapx_ia | −0.33 | −0.38 (2.38) | −0.19 | −0.25 (1.53) | −0.07 | −0.13 (0.87) | −0.17 | −0.44 | −0.49 (2.51) | |||
| pchcurrat | −0.30 (0.66) | −0.09 | −0.46 (1.00) | −0.07 | −0.44 (0.86) | −0.42 (0.71) | ||||||
| pchdepr | −0.06 (0.31) | −0.02 (0.10) | 0.06 (0.27) | −0.27 | −0.38 (1.46) | |||||||
| pchgm_pchsale | 0.31 | 0.32 (2.05) | −0.07 (0.38) | 0.27 | 0.30 (1.47) | 0.13 | 0.45 | 0.47 (1.80) | ||||
| pchquick | 0.42 (0.90) | 0.42 (0.88) | 0.39 (0.74) | 0.17 | 0.75 (1.19) | |||||||
| pchsale_pchinvt | 0.24 | 0.29 (1.64) | 0.01 (0.05) | 0.12 | 0.16 (0.77) | 0.36 | 0.48 (1.83) | |||||
| pchsale_pchrect | −0.04 (0.28) | 0.02 (0.12) | −0.08 | −0.20 (1.07) | 0.35 | 0.46 (2.12) | ||||||
| pchsale_pchxsga | −0.09 | −0.16 (0.70) | −0.41 | −0.54 (2.33) | −0.18 | −0.51 | −0.62 (2.69) | −0.03 (0.09) | ||||
| pchsaleinv | 0.13 | 0.17 (0.82) | 0.11 | 0.25 (0.92) | 0.26 | 0.30 (1.32) | −0.16 (0.56) | |||||
| pctacc | 0.06 | 0.20 (0.73) | 0.11 (0.56) | −0.01 (0.04) | 0.18 | 0.37 (1.13) | ||||||
| quick | 1.46 (1.57) | 0.88 (1.05) | 1.34 (1.22) | 0.35 | 2.32 (1.88) | |||||||
| rd | 0.00 (0.03) | −0.11 (1.03) | 0.21 | 0.25 (1.77) | −0.09 | −0.19 (0.93) | ||||||
| rd_mve | 1.72 | 1.80 | 1.88 (5.75) | 0.81 | 0.70 | 0.72 (2.22) | 1.16 | 1.12 | 1.21 (3.54) | 2.29 | 2.37 | 2.50 (6.56) |
| rd_sale | 0.09 | 0.23 (0.78) | 0.08 | 0.71 | 1.00 (1.90) | 0.61 | 0.83 (1.91) | 0.09 (0.25) | ||||
| retvol | −2.57 | −2.60 | −2.75 (3.49) | −1.24 | −1.08 | −1.62 (2.97) | −2.54 | −2.39 | −2.70 (4.76) | −2.54 | −1.94 | −1.96 (1.86) |
| roic | 0.23 | 0.58 | 0.69 (2.68) | 0.72 | 0.83 | 0.84 (1.62) | 0.15 | 0.58 | 0.70 (2.14) | 0.49 | 0.58 (1.52) | |
| salecash | 0.07 (0.46) | 0.09 (0.53) | 0.03 | 0.20 (1.12) | −0.03 | −0.13 (0.51) | ||||||
| saleinv | 0.16 | 0.12 (0.91) | −0.13 (0.84) | −0.05 (0.28) | 0.26 | 0.25 (1.02) | ||||||
| salerec | 0.08 (0.33) | 0.08 | 0.20 (0.73) | 0.23 | 0.36 (1.15) | 0.02 | 0.13 (0.49) | |||||
| sgr | −0.41 | −0.50 (1.86) | −0.21 (0.62) | −0.00 (0.00) | −0.50 | −0.66 | −0.72 (2.07) | |||||
| sp | 0.25 | 0.51 | 0.52 (1.58) | 0.23 | 0.48 | 0.52 (1.60) | 0.24 | 0.24 (0.70) | 0.73 | 0.68 | 0.70 (1.41) | |
| tang | 0.18 | 0.22 (0.68) | −0.02 | −0.46 | −0.60 (1.90) | −0.09 | −0.26 (0.80) | 0.09 | 0.12 (0.31) | |||
| turn | −0.93 | −1.05 | −1.28 (3.51) | −0.32 | −0.59 (1.53) | −0.50 | −0.97 (2.28) | −2.26 | −2.50 | −2.82 (4.92) | ||
Publisher’s Note: MDPI stays neutral with regard to jurisdictional claims in published maps and institutional affiliations. |
© 2022 by the authors. Licensee MDPI, Basel, Switzerland. This article is an open access article distributed under the terms and conditions of the Creative Commons Attribution (CC BY) license (https://creativecommons.org/licenses/by/4.0/).
Share and Cite
Messmer, M.; Audrino, F. The Lasso and the Factor Zoo-Predicting Expected Returns in the Cross-Section. Forecasting 2022, 4, 969-1003. https://doi.org/10.3390/forecast4040053
Messmer M, Audrino F. The Lasso and the Factor Zoo-Predicting Expected Returns in the Cross-Section. Forecasting. 2022; 4(4):969-1003. https://doi.org/10.3390/forecast4040053
Chicago/Turabian StyleMessmer, Marcial, and Francesco Audrino. 2022. "The Lasso and the Factor Zoo-Predicting Expected Returns in the Cross-Section" Forecasting 4, no. 4: 969-1003. https://doi.org/10.3390/forecast4040053
APA StyleMessmer, M., & Audrino, F. (2022). The Lasso and the Factor Zoo-Predicting Expected Returns in the Cross-Section. Forecasting, 4(4), 969-1003. https://doi.org/10.3390/forecast4040053