Explainable Ensemble Machine Learning for Breast Cancer Diagnosis Based on Ultrasound Image Texture Features
Abstract
1. Introduction
2. Materials and Methods
2.1. Data
2.2. Texture Analysis
2.2.1. First-Order Statistics’ Texture Features
2.2.2. Second-Order Statistics’ Texture Features
2.3. Decision Tree Models
2.3.1. Gradient Boosting Decision Tree
2.3.2. LightGBM
2.4. Machine Learning Diagnosis Pipeline
3. Results
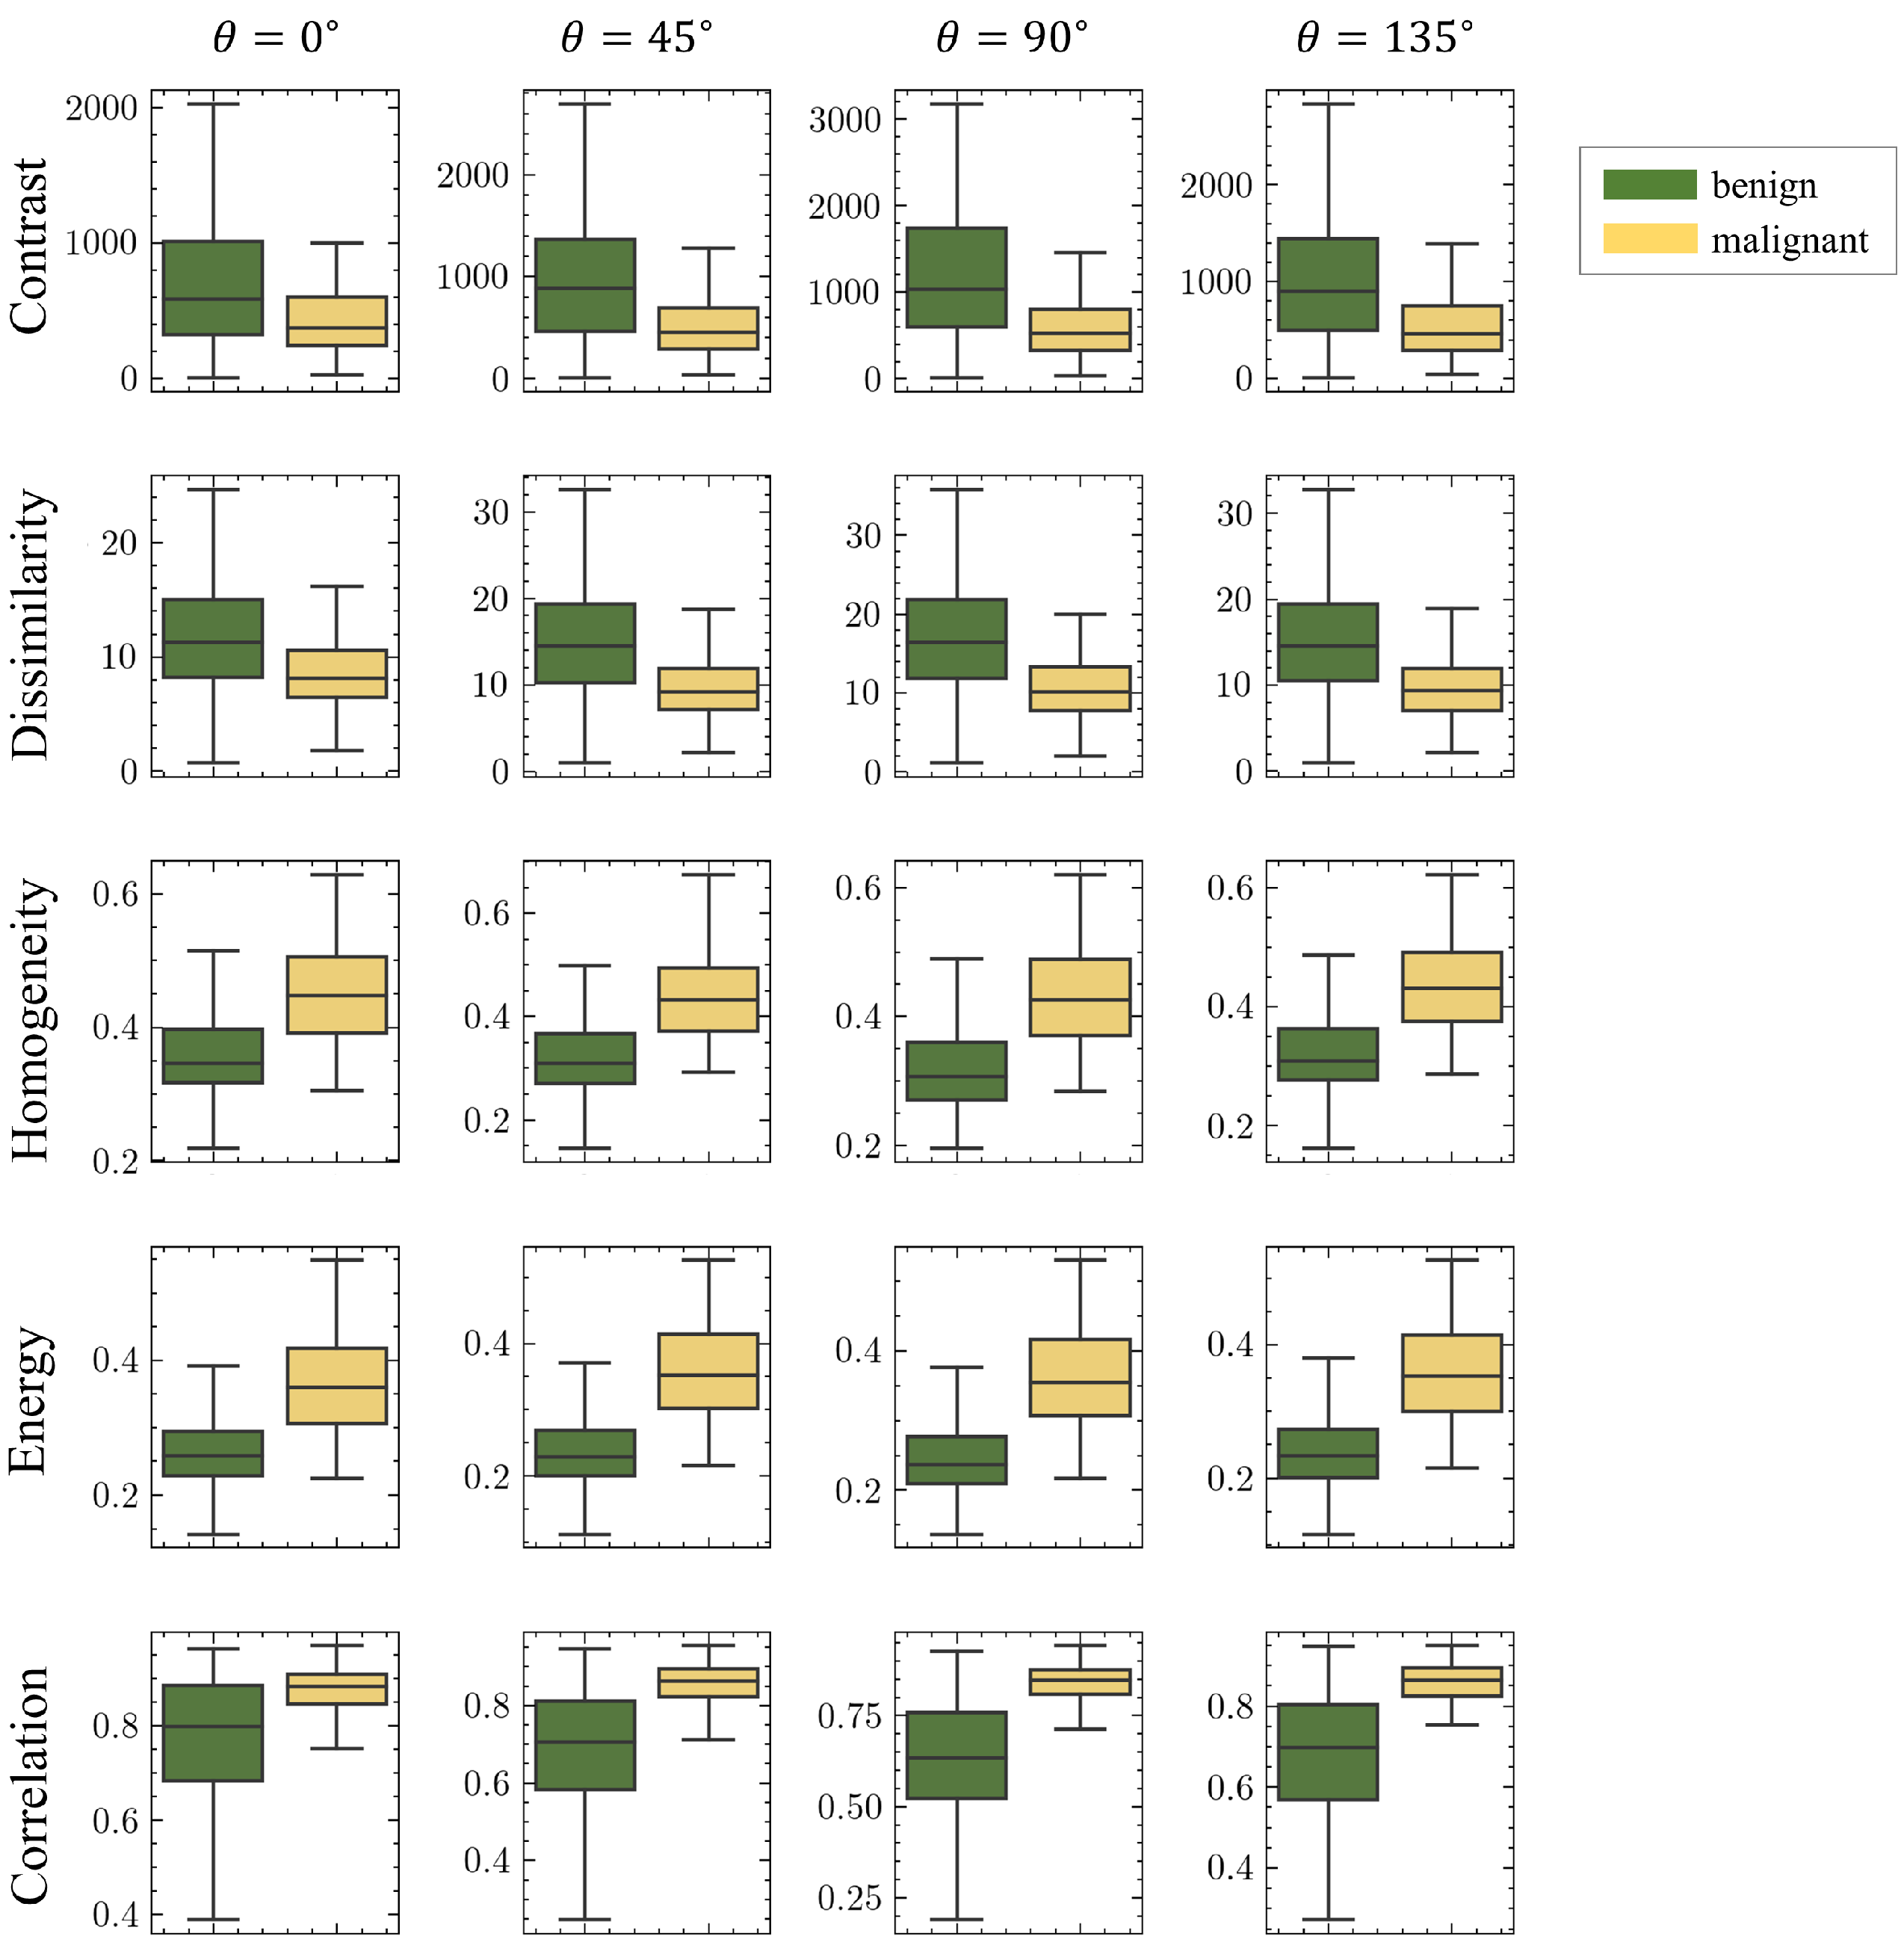
3.1. Texture Analysis and Statistical Analysis
3.2. Machine Learning Diagnosis Pipeline Performance
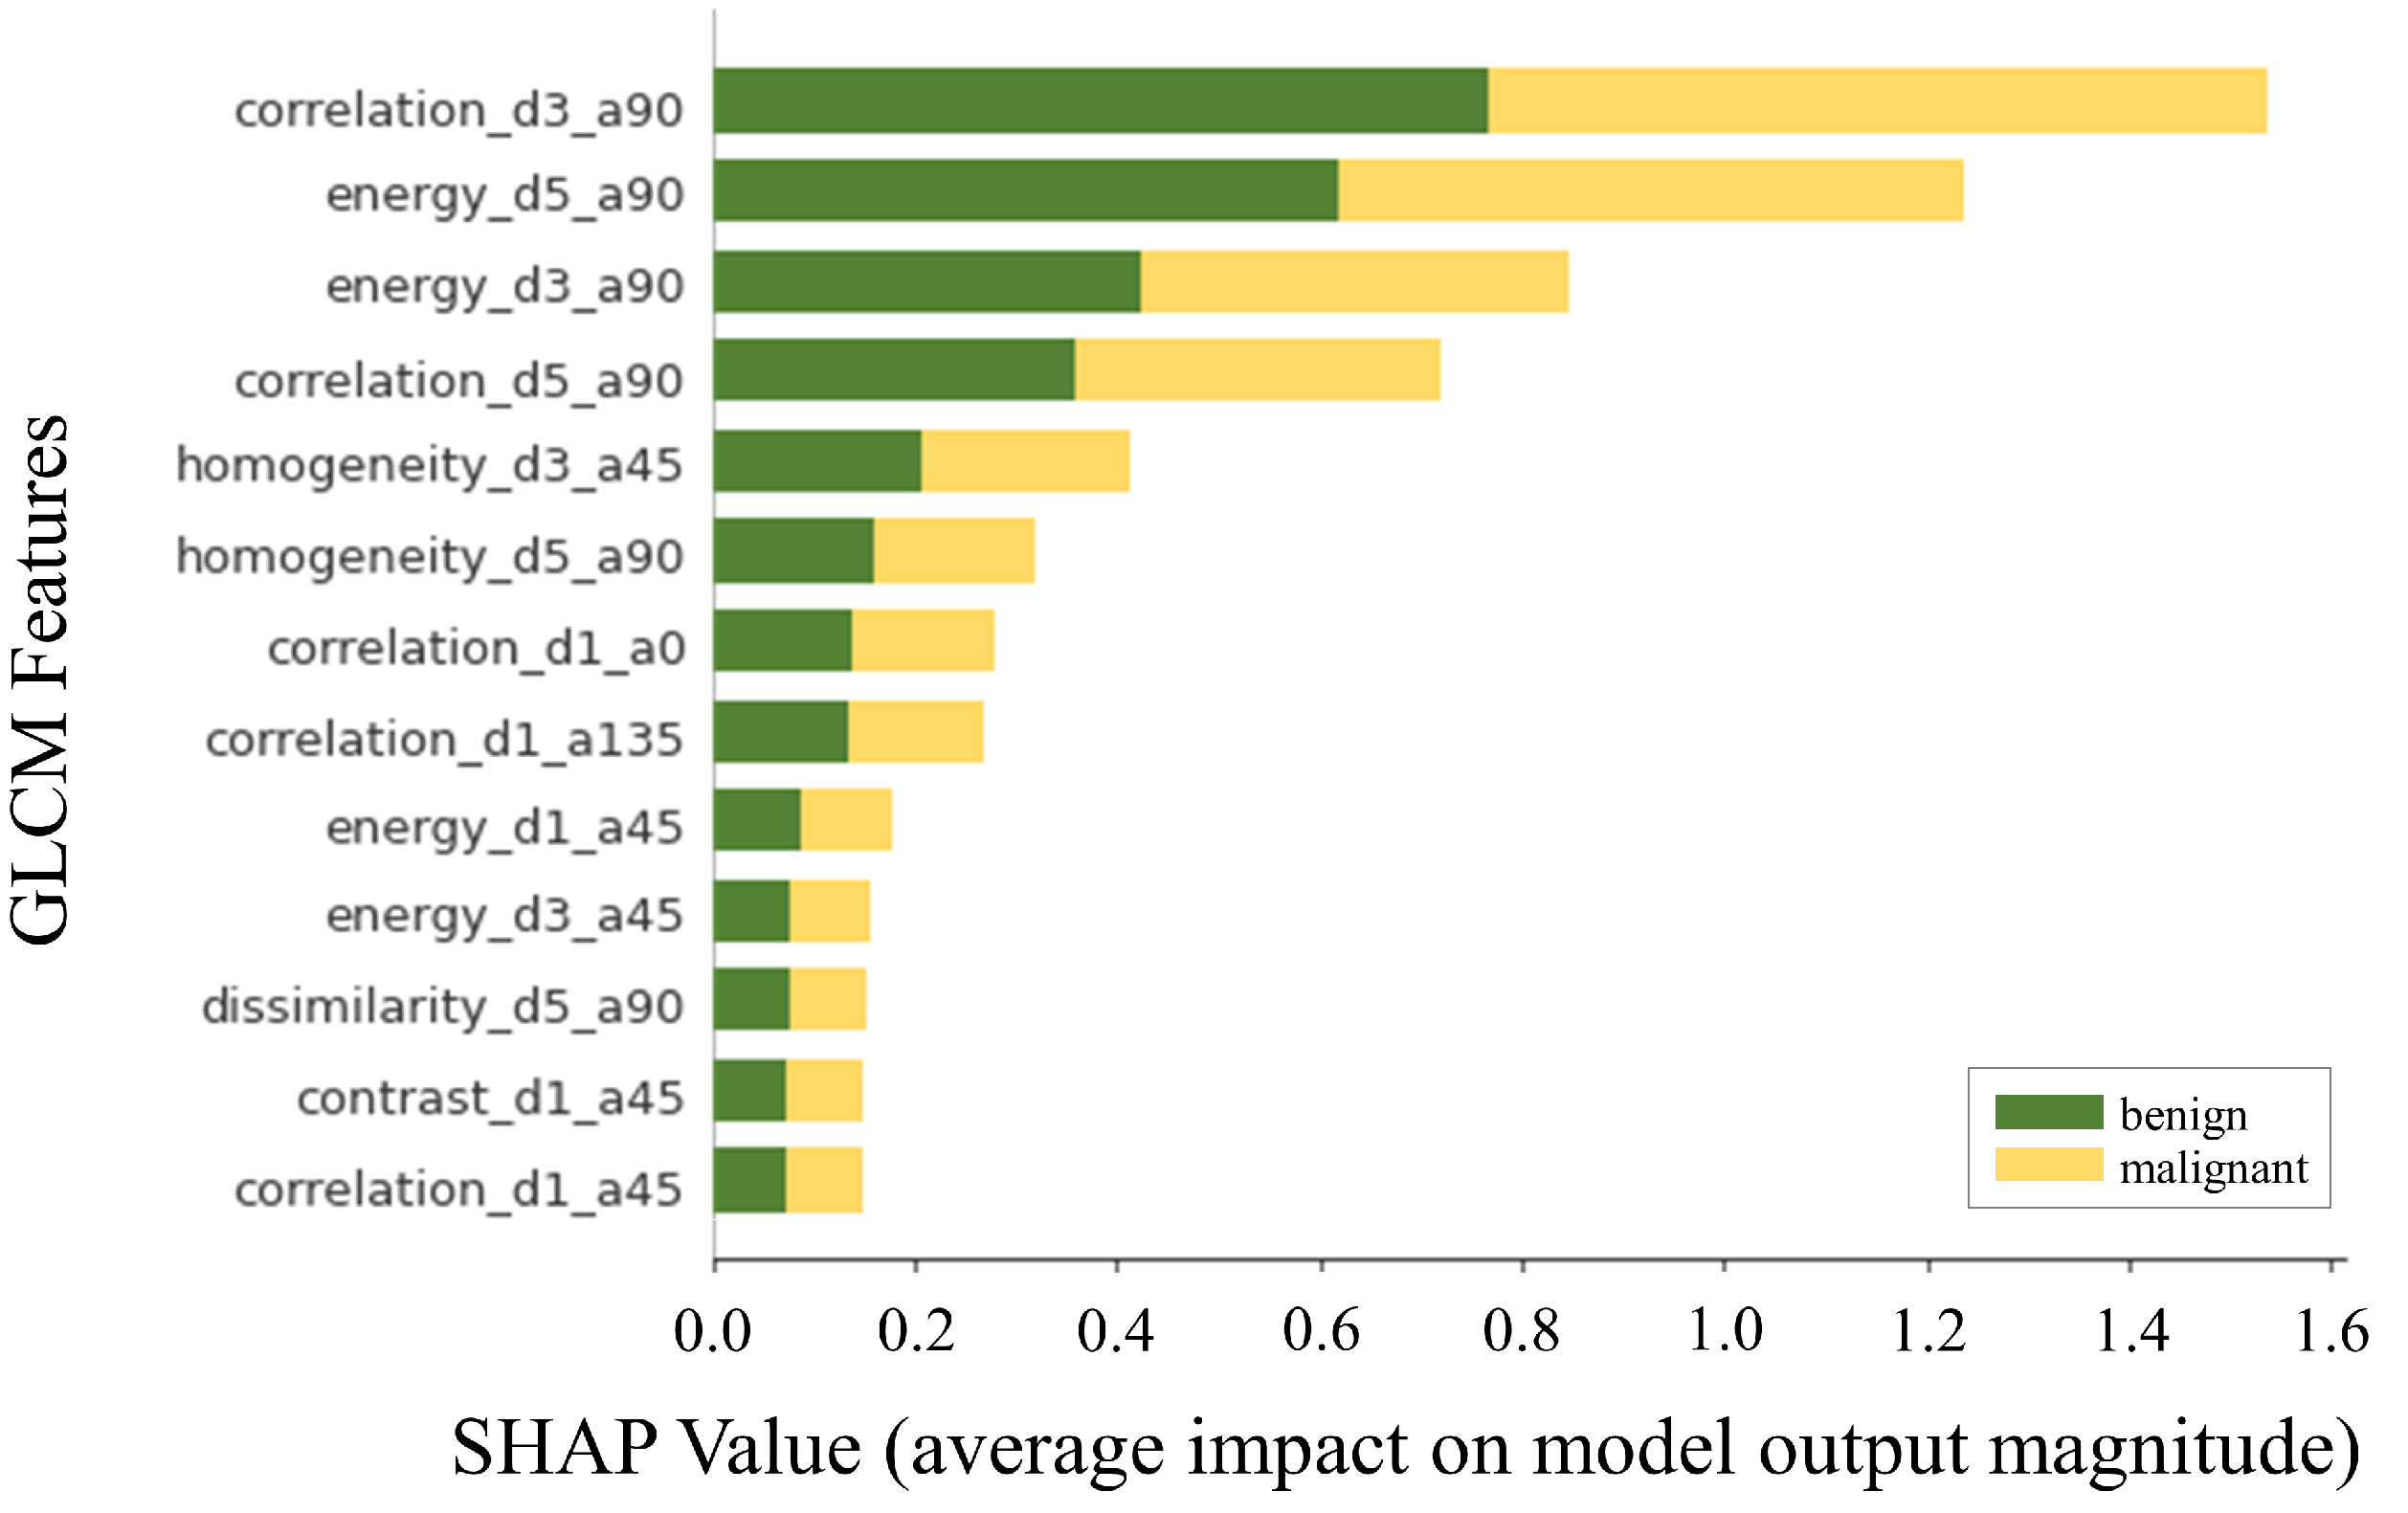
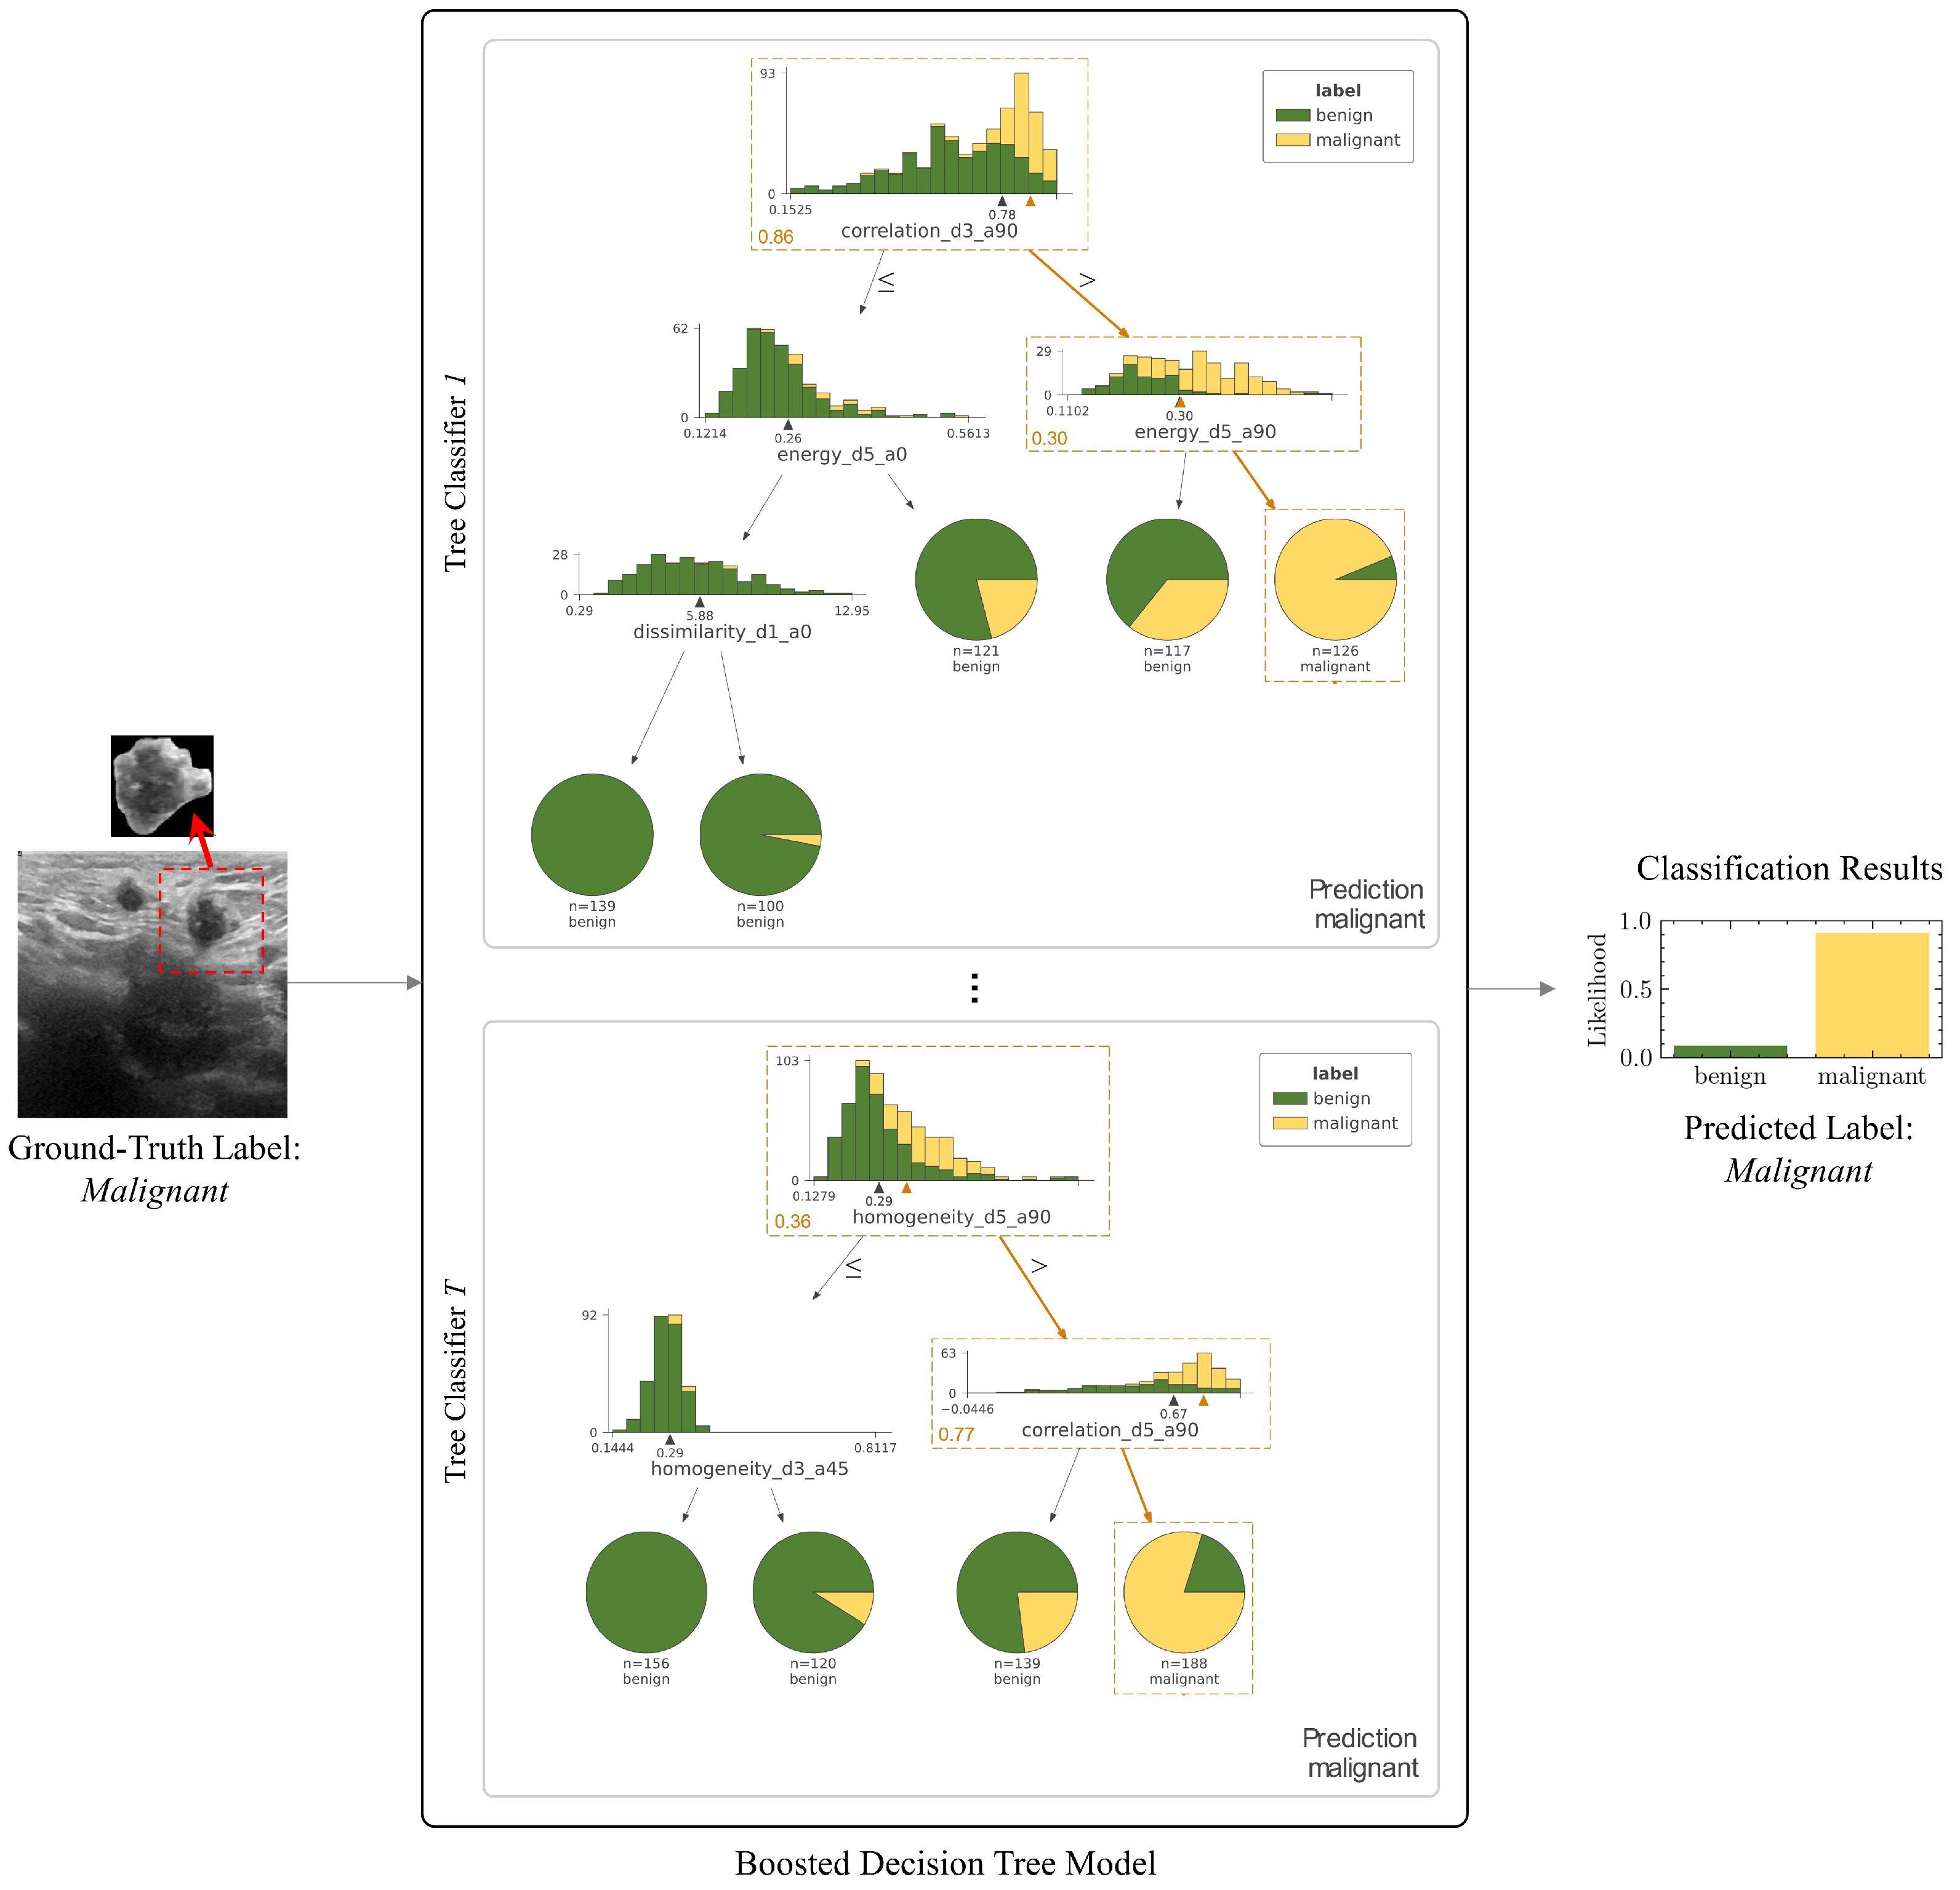
3.3. Explainability of the Machine Learning Diagnosis Pipeline
4. Conclusions
Author Contributions
Funding
Institutional Review Board Statement
Informed Consent Statement
Data Availability Statement
Conflicts of Interest
Appendix A
| Feature | Description | p-Value | ||
|---|---|---|---|---|
| energy | 6.66 × 10 | 1.17 × 10 | <0.001 | |
| entropy | 1.98 | 2.23 | <0.001 | |
| kurtosis | 6.50 | 4.27 | <0.001 | |
| mean | 6.40 × 10 | 6.59 × 10 | 0.43 | |
| rms | 7.26 × 10 | 7.51 × 10 | 0.28 | |
| skewness | 1.45 | 0.99 | <0.001 | |
| uniformity | 3.40 × 10 | 2.69 × 10 | <0.001 | |
| variance | 1.04 × 10 | 1.22 × 10 | <0.001 |
| GLCM Feature | Description |
|---|---|
| contrast | |
| energy | |
| correlation | |
| dissimilarity | |
| energy | |
| energy | |
| homogeneity |
| GLCM Contrast | ||||
|---|---|---|---|---|
| Distance | Angle | p-Value | ||
| 1 | 0° | 184.86 | 114.20 | <0.001 |
| 45° | 433.20 | 238.06 | <0.001 | |
| 90° | 304.20 | 154.26 | <0.001 | |
| 135° | 438.01 | 238.07 | <0.001 | |
| 3 | 0° | 730.45 | 493.19 | <0.001 |
| 45° | 1032.13 | 582.21 | <0.001 | |
| 90° | 1229.20 | 660.83 | <0.001 | |
| 135° | 1049.76 | 582.42 | <0.001 | |
| 5 | 0° | 1136.95 | 830.26 | <0.001 |
| 45° | 1768.76 | 1132.49 | <0.001 | |
| 90° | 1681.63 | 1040.57 | <0.001 | |
| 135° | 1801.47 | 1130.44 | <0.001 | |
| GLCM Correlation | ||||
|---|---|---|---|---|
| Distance | Angle | p-Value | ||
| 1 | 0° | 0.94 | 0.97 | <0.001 |
| 45° | 0.87 | 0.94 | <0.001 | |
| 90° | 0.91 | 0.96 | <0.001 | |
| 135° | 0.86 | 0.94 | <0.001 | |
| 3 | 0° | 0.77 | 0.87 | <0.001 |
| 45° | 0.68 | 0.85 | <0.001 | |
| 90° | 0.63 | 0.83 | <0.001 | |
| 135° | 0.68 | 0.85 | <0.001 | |
| 5 | 0° | 0.64 | 0.78 | <0.001 |
| 45° | 0.46 | 0.70 | <0.001 | |
| 90° | 0.47 | 0.73 | <0.001 | |
| 135° | 0.44 | 0.70 | <0.001 | |
| GLCM Dissimilarity | ||||
|---|---|---|---|---|
| Distance | Angle | p-Value | ||
| 1 | 0° | 4.84 | 3.41 | <0.001 |
| 45° | 8.67 | 5.75 | <0.001 | |
| 90° | 7.09 | 4.58 | <0.001 | |
| 135° | 8.69 | 5.74 | <0.001 | |
| 3 | 0° | 12.10 | 8.84 | <0.001 |
| 45° | 15.33 | 10.07 | <0.001 | |
| 90° | 17.04 | 10.97 | <0.001 | |
| 135° | 15.40 | 10.06 | <0.001 | |
| 5 | 0° | 16.76 | 12.76 | <0.001 |
| 45° | 23.10 | 15.95 | <0.001 | |
| 90° | 22.06 | 14.98 | <0.001 | |
| 135° | 23.18 | 15.90 | <0.001 | |
| GLCM Energy | ||||
|---|---|---|---|---|
| Distance | Angle | p-Value | ||
| 1 | 0° | 0.30 | 0.38 | <0.001 |
| 45° | 0.28 | 0.37 | <0.001 | |
| 90° | 0.29 | 0.38 | <0.001 | |
| 135° | 0.28 | 0.37 | <0.001 | |
| 3 | 0° | 0.26 | 0.36 | <0.001 |
| 45° | 0.24 | 0.35 | <0.001 | |
| 90° | 0.25 | 0.35 | <0.001 | |
| 135° | 0.24 | 0.35 | <0.001 | |
| 5 | 0° | 0.24 | 0.34 | <0.001 |
| 45° | 0.19 | 0.32 | <0.001 | |
| 90° | 0.22 | 0.33 | <0.001 | |
| 135° | 0.19 | 0.32 | <0.001 | |
| GLCM Homogeneity | ||||
|---|---|---|---|---|
| Distance | Angle | p-Value | ||
| 1 | 0° | 0.49 | 0.56 | <0.001 |
| 45° | 0.41 | 0.49 | <0.001 | |
| 90° | 0.43 | 0.51 | <0.001 | |
| 135° | 0.41 | 0.50 | <0.001 | |
| 3 | 0° | 0.37 | 0.45 | <0.001 |
| 45° | 0.33 | 0.44 | <0.001 | |
| 90° | 0.33 | 0.43 | <0.001 | |
| 135° | 0.33 | 0.44 | <0.001 | |
| 5 | 0° | 0.33 | 0.41 | <0.001 |
| 45° | 0.26 | 0.32 | <0.001 | |
| 90° | 0.30 | 0.40 | <0.001 | |
| 135° | 0.27 | 0.39 | <0.001 | |
References
- Kuhl, C.K.; Schrading, S.; Leutner, C.C.; Morakkabati-Spitz, N.; Wardelmann, E.; Fimmers, R.; Kuhn, W.; Schild, H.H. Mammography, breast ultrasound, and magnetic resonance imaging for surveillance of women at high familial risk for breast cancer. J. Clin. Oncol. 2005, 23, 8469–8476. [Google Scholar] [CrossRef] [PubMed]
- Al-Dhabyani, W.; Gomaa, M.; Khaled, H.; Fahmy, A. Dataset of breast ultrasound images. Data Brief 2020, 28, 104863. [Google Scholar] [CrossRef] [PubMed]
- Moon, W.K.; Lee, Y.W.; Ke, H.H.; Lee, S.H.; Huang, C.S.; Chang, R.F. Computer-aided diagnosis of breast ultrasound images using ensemble learning from convolutional neural networks. Comput. Methods Programs Biomed. 2020, 190, 105361. [Google Scholar] [CrossRef] [PubMed]
- Samulski, M.; Hupse, R.; Boetes, C.; Mus, R.D.; den Heeten, G.J.; Karssemeijer, N. Using computer-aided detection in mammography as a decision support. Eur. Radiol. 2010, 20, 2323–2330. [Google Scholar] [CrossRef] [PubMed][Green Version]
- Sahiner, B.; Chan, H.P.; Roubidoux, M.A.; Hadjiiski, L.M.; Helvie, M.A.; Paramagul, C.; Bailey, J.; Nees, A.V.; Blane, C. Malignant and benign breast masses on 3D US volumetric images: Effect of computer-aided diagnosis on radiologist accuracy. Radiology 2007, 242, 716–724. [Google Scholar] [CrossRef] [PubMed]
- Jiménez-Gaona, Y.; Rodríguez-Álvarez, M.J.; Lakshminarayanan, V. Deep-Learning-Based Computer-Aided Systems for Breast Cancer Imaging: A Critical Review. Appl. Sci. 2020, 10, 8298. [Google Scholar] [CrossRef]
- Castelvecchi, D. Can we open the black box of AI? Nat. News 2016, 538, 20. [Google Scholar] [CrossRef]
- Arrieta, A.B.; Díaz-Rodríguez, N.; Del Ser, J.; Bennetot, A.; Tabik, S.; Barbado, A.; García, S.; Gil-López, S.; Molina, D.; Benjamins, R.; et al. Explainable Artificial Intelligence (XAI): Concepts, taxonomies, opportunities and challenges toward responsible AI. Inf. Fusion 2020, 58, 82–115. [Google Scholar] [CrossRef]
- Zhu, J.; Liapis, A.; Risi, S.; Bidarra, R.; Youngblood, G.M. Explainable AI for designers: A human-centered perspective on mixed-initiative co-creation. In Proceedings of the 2018 IEEE Conference on Computational Intelligence and Games (CIG), Maastricht, The Netherlands, 14–17 August 2018; pp. 1–8. [Google Scholar]
- Preece, A.; Harborne, D.; Braines, D.; Tomsett, R.; Chakraborty, S. Stakeholders in explainable AI. arXiv 2018, arXiv:1810.00184. [Google Scholar]
- Masud, M.; Rashed, A.E.E.; Hossain, M.S. Convolutional neural network-based models for diagnosis of breast cancer. Neural Comput. Appl. 2020, 1–12. [Google Scholar] [CrossRef]
- Byra, M.; Jarosik, P.; Szubert, A.; Galperin, M.; Ojeda-Fournier, H.; Olson, L.; O’Boyle, M.; Comstock, C.; Andre, M. Breast mass segmentation in ultrasound with selective kernel U-Net convolutional neural network. Biomed. Signal Process. Control 2020, 61, 102027. [Google Scholar] [CrossRef] [PubMed]
- Irfan, R.; Almazroi, A.A.; Rauf, H.T.; Damaševičius, R.; Nasr, E.A.; Abdelgawad, A.E. Dilated semantic segmentation for breast ultrasonic lesion detection using parallel feature fusion. Diagnostics 2021, 11, 1212. [Google Scholar] [CrossRef] [PubMed]
- Tuceryan, M.; Jain, A.K. Texture analysis. Handb. Pattern Recognit. Comput. Vis. 1993, 235–276. [Google Scholar]
- Materka, A.; Strzelecki, M. Texture analysis methods—A review. Tech. Univ. Lodz Inst. Electron. COST B11 Rep. Bruss. 1998, 10, 4968. [Google Scholar]
- Varghese, B.A.; Cen, S.Y.; Hwang, D.H.; Duddalwar, V.A. Texture analysis of imaging: What radiologists need to know. Am. J. Roentgenol. 2019, 212, 520–528. [Google Scholar] [CrossRef]
- Srinivasan, G.; Shobha, G. Statistical texture analysis. World Acad. Sci. Eng. Technol. 2008, 36, 1264–1269. [Google Scholar]
- Kim, N.D.; Amin, V.; Wilson, D.; Rouse, G.; Udpa, S. Ultrasound image texture analysis for characterizing intramuscular fat content of live beef cattle. Ultrason. Imaging 1998, 20, 191–205. [Google Scholar] [CrossRef]
- Sebastian V, B.; Unnikrishnan, A.; Balakrishnan, K. Gray level co-occurrence matrices: Generalisation and some new features. arXiv 2012, arXiv:1205.4831. [Google Scholar]
- Iqbal, F.; Pallewatte, A.S.; Wansapura, J.P. Texture analysis of ultrasound images of chronic kidney disease. In Proceedings of the 2017 Seventeenth International Conference on Advances in ICT for Emerging Regions (ICTer), Colombo, Sri Lanka, 6–9 September 2017; pp. 1–5. [Google Scholar]
- Xu, S.S.D.; Chang, C.C.; Su, C.T.; Phu, P.Q. Classification of liver diseases based on ultrasound image texture features. Appl. Sci. 2019, 9, 342. [Google Scholar] [CrossRef]
- Sharma, H.; Kumar, S. A survey on decision tree algorithms of classification in data mining. Int. J. Sci. Res. (IJSR) 2016, 5, 2094–2097. [Google Scholar]
- Myles, A.J.; Feudale, R.N.; Liu, Y.; Woody, N.A.; Brown, S.D. An introduction to decision tree modeling. J. Chemom. A J. Chemom. Soc. 2004, 18, 275–285. [Google Scholar] [CrossRef]
- Safavian, S.R.; Landgrebe, D. A survey of decision tree classifier methodology. IEEE Trans. Syst. Man Cybern. 1991, 21, 660–674. [Google Scholar] [CrossRef]
- Ke, G.; Meng, Q.; Finley, T.; Wang, T.; Chen, W.; Ma, W.; Ye, Q.; Liu, T.Y. Lightgbm: A highly efficient gradient boosting decision tree. Adv. Neural Inf. Process. Syst. 2017, 30, 3146–3154. [Google Scholar]
- Rezazadeh, A. A Generalized Flow for B2B Sales Predictive Modeling: An Azure Machine-Learning Approach. Forecasting 2020, 2, 267–283. [Google Scholar] [CrossRef]
- Chen, C.; Zhang, Q.; Ma, Q.; Yu, B. LightGBM-PPI: Predicting protein-protein interactions through LightGBM with multi-information fusion. Chemom. Intell. Lab. Syst. 2019, 191, 54–64. [Google Scholar] [CrossRef]
- Sun, X.; Liu, M.; Sima, Z. A novel cryptocurrency price trend forecasting model based on LightGBM. Financ. Res. Lett. 2020, 32, 101084. [Google Scholar] [CrossRef]
- Hossin, M.; Sulaiman, M.N. A review on evaluation metrics for data classification evaluations. Int. J. Data Min. Knowl. Manag. Process 2015, 5, 1. [Google Scholar]
- Lundberg, S.M.; Erion, G.G.; Lee, S.I. Consistent individualized feature attribution for tree ensembles. arXiv 2018, arXiv:1802.03888. [Google Scholar]
- Sundararajan, M.; Najmi, A. The many Shapley values for model explanation. In Proceedings of the International Conference on Machine Learning, Virtual, 13–18 July 2020; pp. 9269–9278. [Google Scholar]


| Model | Precision | Recall | F1-Score | AUC | Accuracy |
|---|---|---|---|---|---|
| DT | 0.85 | 0.82 | 0.83 | 0.82 | 0.86 |
| RF | 0.87 | 0.84 | 0.86 | 0.85 | 0.88 |
| LightGBM-10 | 0.90 | 0.80 | 0.83 | 0.79 | 0.87 |
| LightGBM-50 | 0.88 | 0.87 | 0.88 | 0.90 | 0.87 |
| LightGBM-100 | 0.93 | 0.91 | 0.92 | 0.92 | 0.90 |
| LightGBM-500 | 0.94 | 0.93 | 0.93 | 0.93 | 0.91 |
| Model | Precision | Recall | F1-Score | AUC | Accuracy |
|---|---|---|---|---|---|
| VGG | 0.75 | 0.76 | 0.76 | 0.87 | 0.85 |
| ResNet | 0.89 | 0.89 | 0.89 | 0.96 | 0.91 |
| DenseNet | 0.90 | 0.92 | 0.91 | 0.97 | 0.94 |
| Decision Tree Ensemble (ours) | 0.94 | 0.93 | 0.93 | 0.93 | 0.91 |
Publisher’s Note: MDPI stays neutral with regard to jurisdictional claims in published maps and institutional affiliations. |
© 2022 by the authors. Licensee MDPI, Basel, Switzerland. This article is an open access article distributed under the terms and conditions of the Creative Commons Attribution (CC BY) license (https://creativecommons.org/licenses/by/4.0/).
Share and Cite
Rezazadeh, A.; Jafarian, Y.; Kord, A. Explainable Ensemble Machine Learning for Breast Cancer Diagnosis Based on Ultrasound Image Texture Features. Forecasting 2022, 4, 262-274. https://doi.org/10.3390/forecast4010015
Rezazadeh A, Jafarian Y, Kord A. Explainable Ensemble Machine Learning for Breast Cancer Diagnosis Based on Ultrasound Image Texture Features. Forecasting. 2022; 4(1):262-274. https://doi.org/10.3390/forecast4010015
Chicago/Turabian StyleRezazadeh, Alireza, Yasamin Jafarian, and Ali Kord. 2022. "Explainable Ensemble Machine Learning for Breast Cancer Diagnosis Based on Ultrasound Image Texture Features" Forecasting 4, no. 1: 262-274. https://doi.org/10.3390/forecast4010015
APA StyleRezazadeh, A., Jafarian, Y., & Kord, A. (2022). Explainable Ensemble Machine Learning for Breast Cancer Diagnosis Based on Ultrasound Image Texture Features. Forecasting, 4(1), 262-274. https://doi.org/10.3390/forecast4010015


