Fourier Analysis of Cerebral Metabolism of Glucose: Gender Differences in Mechanisms of Color Processing in the Ventral and Dorsal Streams in Mice


Abstract
:1. Introduction
2. Materials and Methods
2.1. Animals
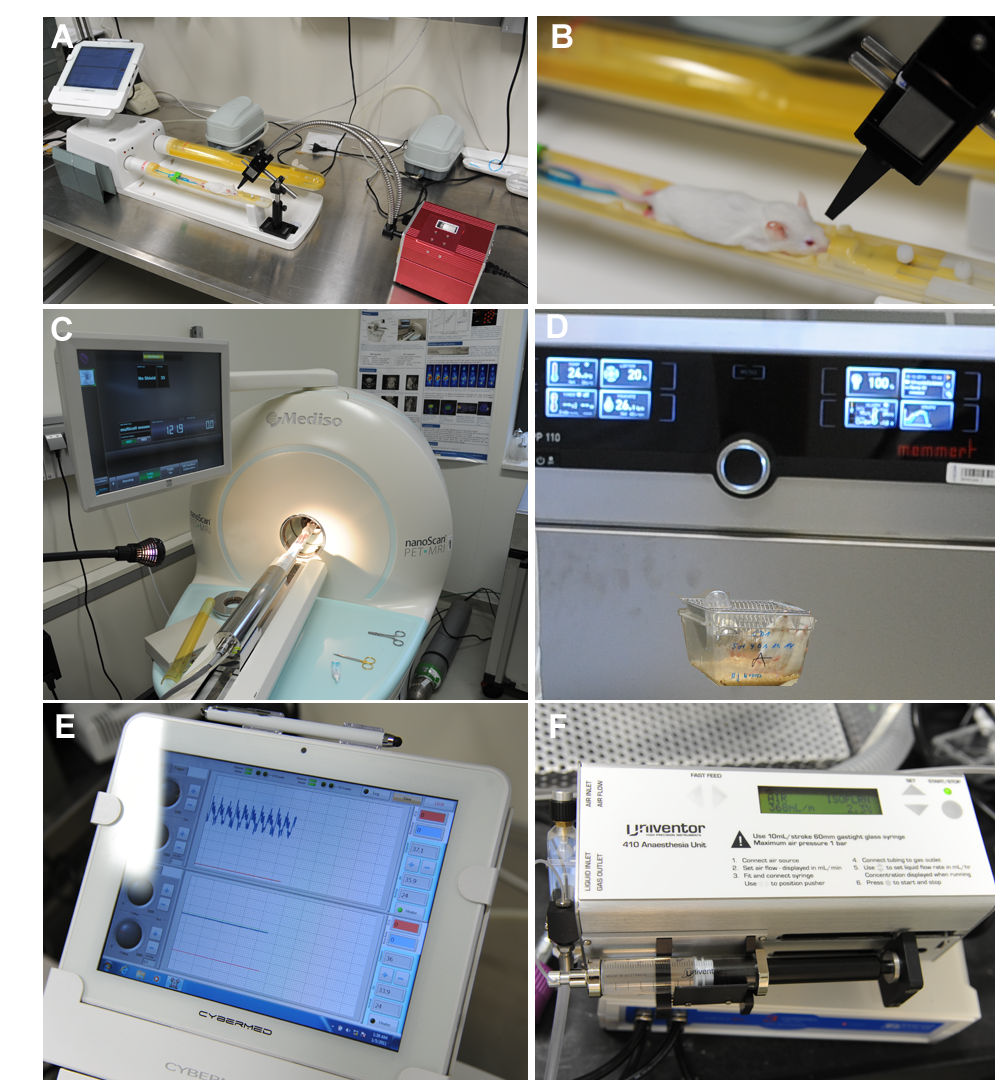
2.2. Light Stimulation Studies
2.3. Color Vision Testing in Mice Using PET/MRI
- dark: both eyes (1) closed (dark)
- light: left (2) or right (3) eye open and subjected to standard light source (short: LightL, LightR)
- blue: left (4) or right (5) eye open and subjected to standard light source with blue filter (short: BlueL, BlueR)
- yellow: left (6) or right (7) eye open and subjected to standard light source with yellow filter (short: YellowL, YellowR).
2.4. Acquisition and Analysis of PET and MRI Data
2.5. Statistical Analysis
Stationarity Assumption
- H0:γ = 0 (i.e., the data needs to be differenced to make it stationary);
- H1: γ < 0 (i.e., the data is stationary and does not need to be differenced).
2.6. Fourier Analysis
2.7. Software Procedure for Data Analysis
3. Results
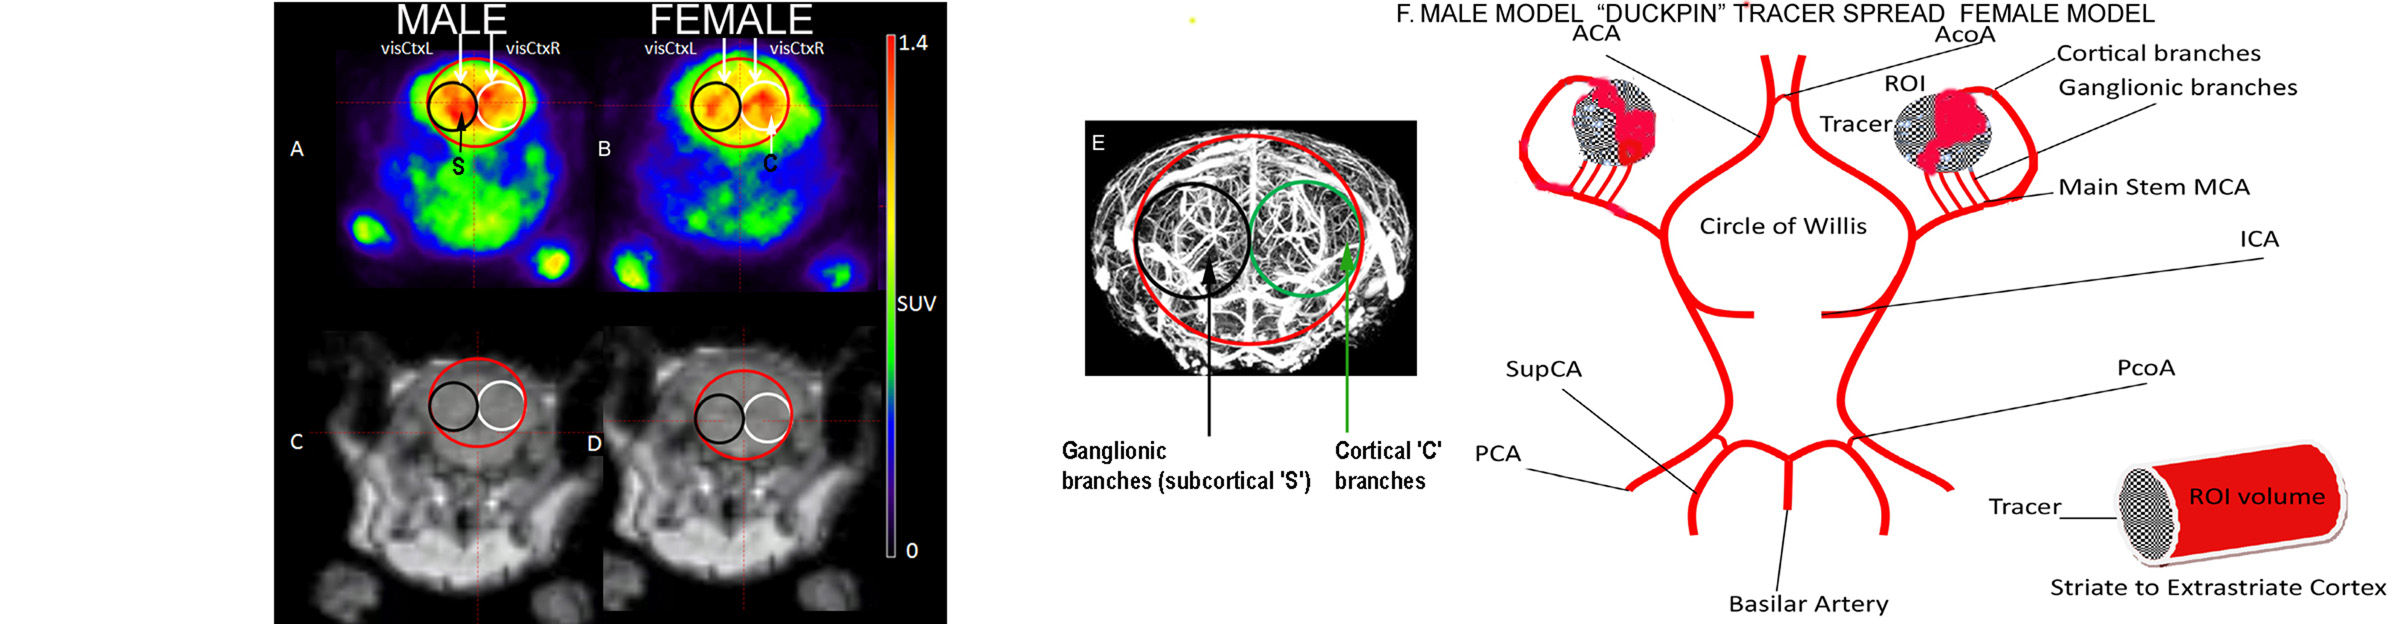
3.1. Analysis of fPET/MRI Images
3.2. Analysis of Mean SUV Data
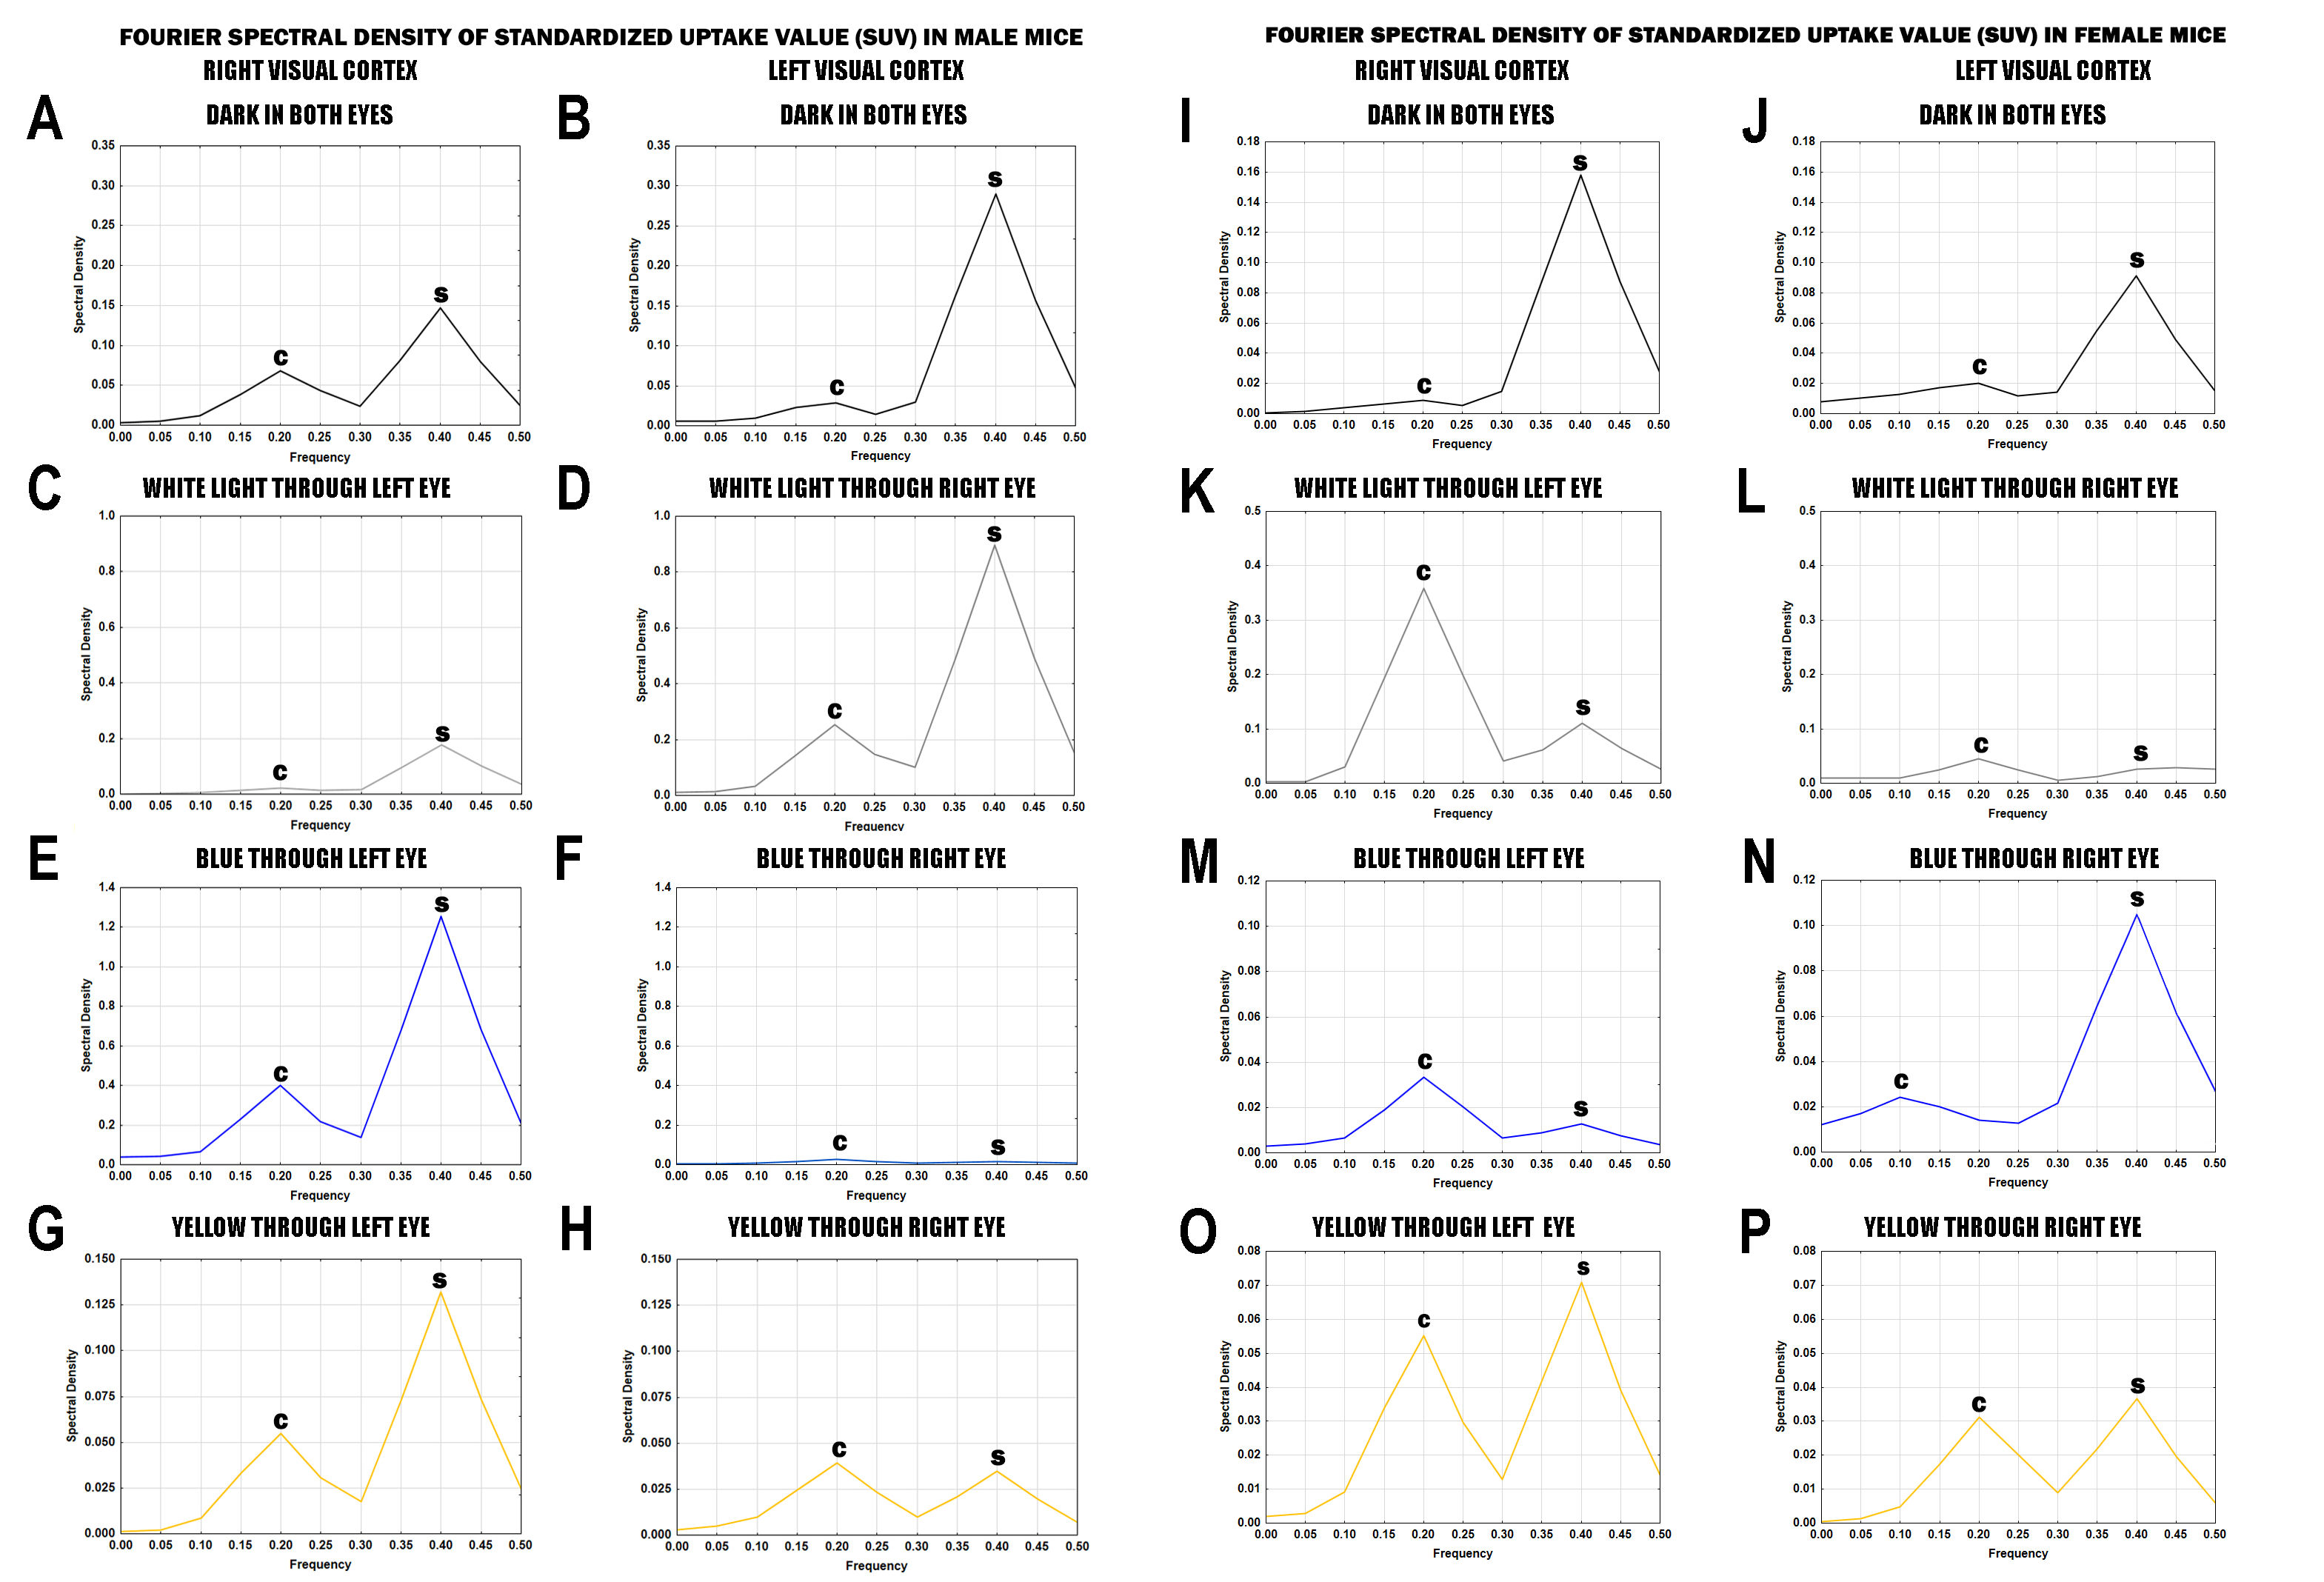
3.3. Analysis of Spectral Density Data
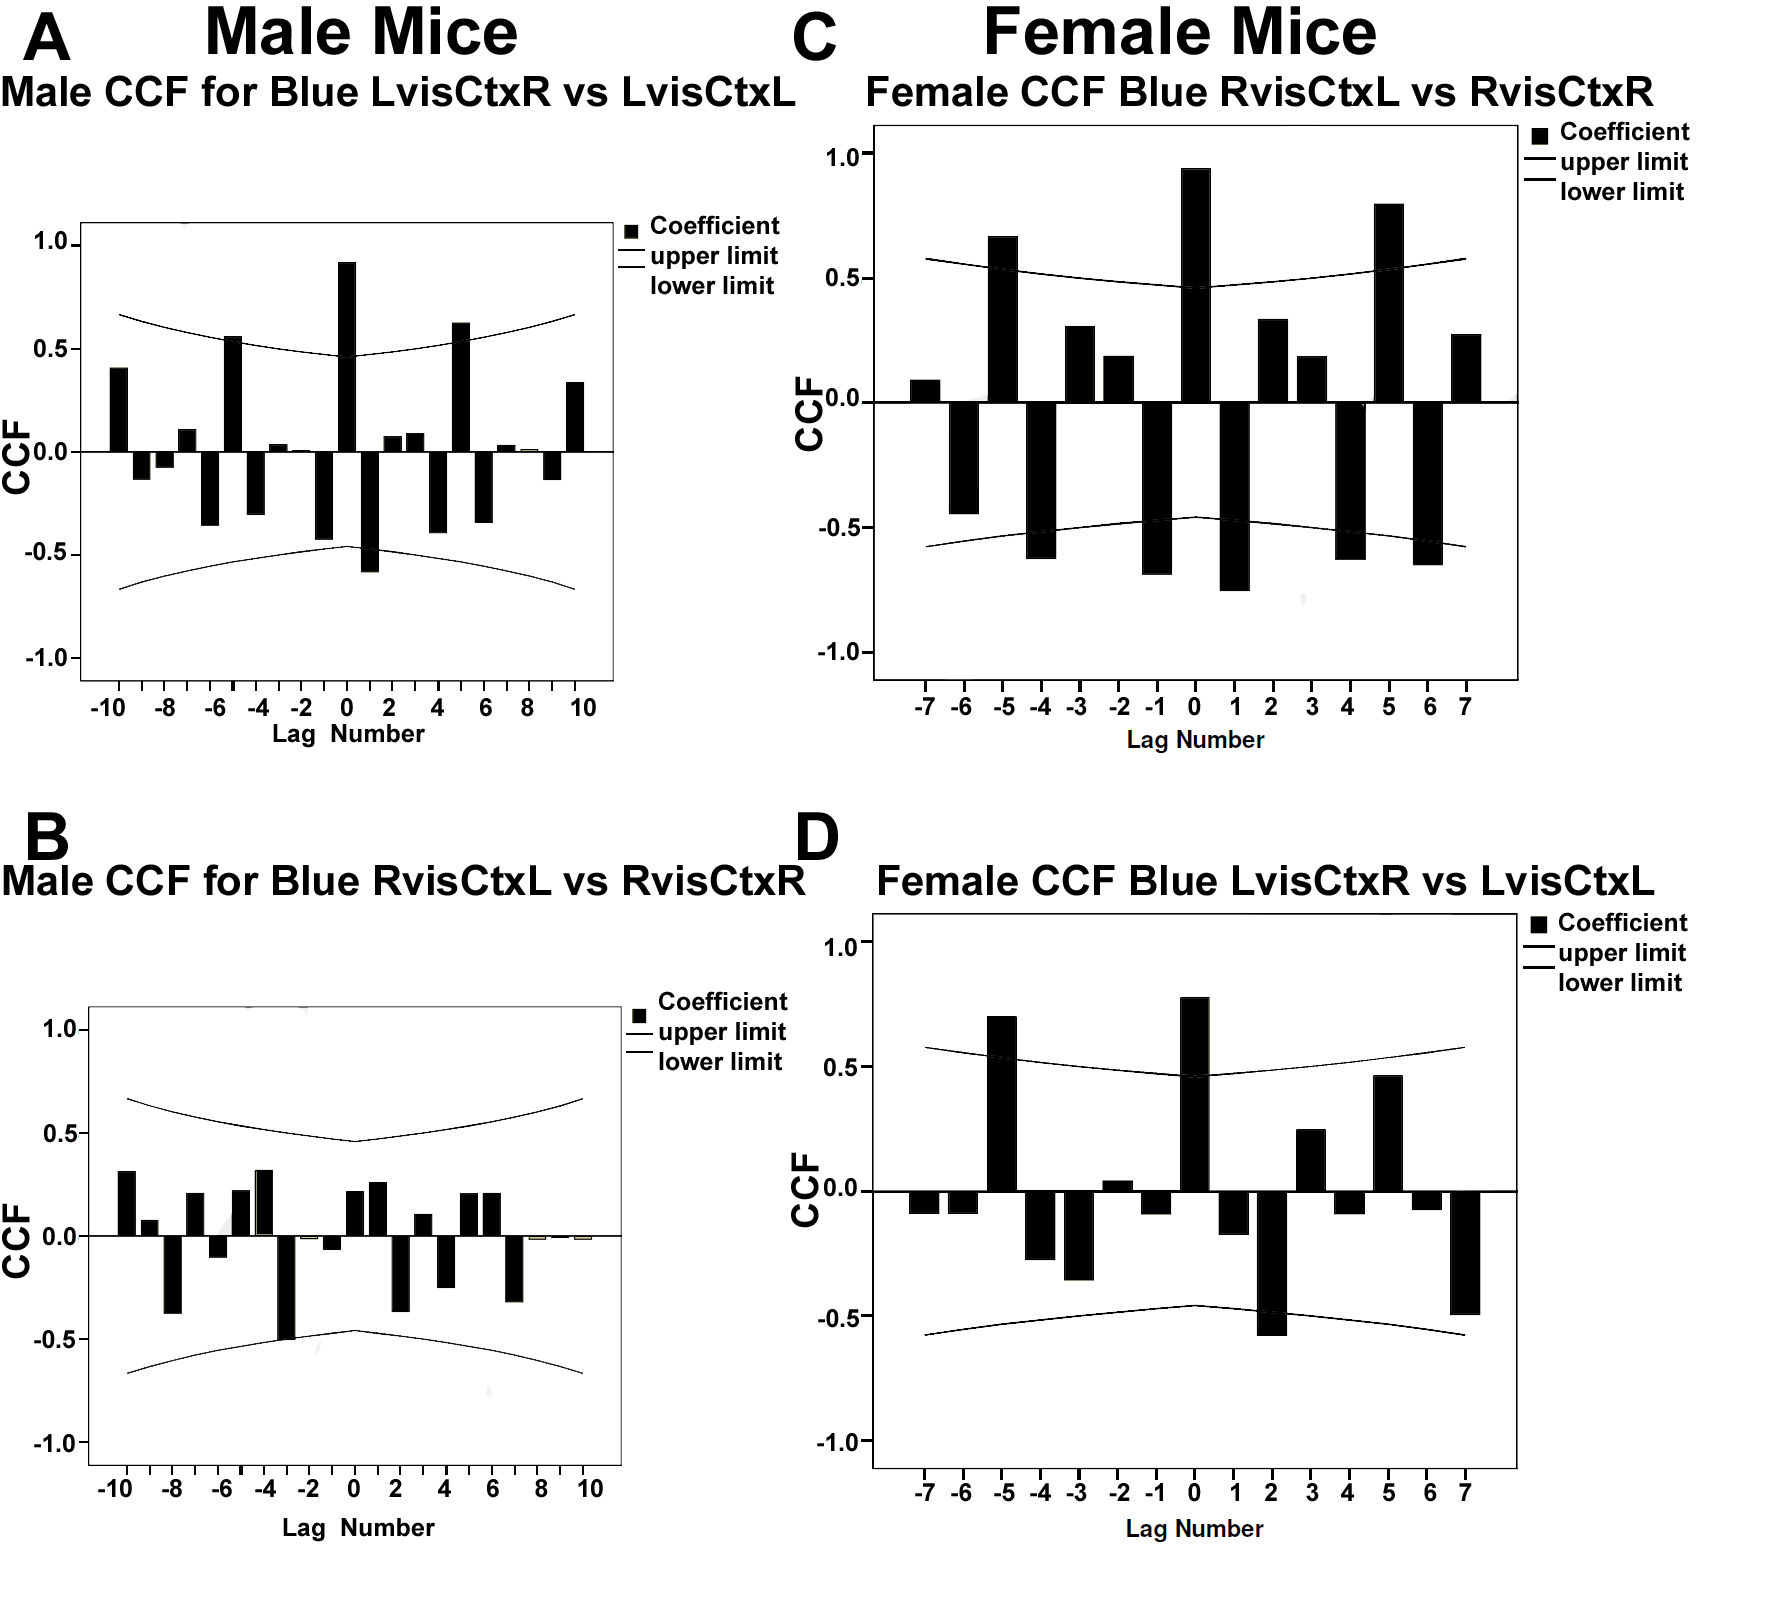
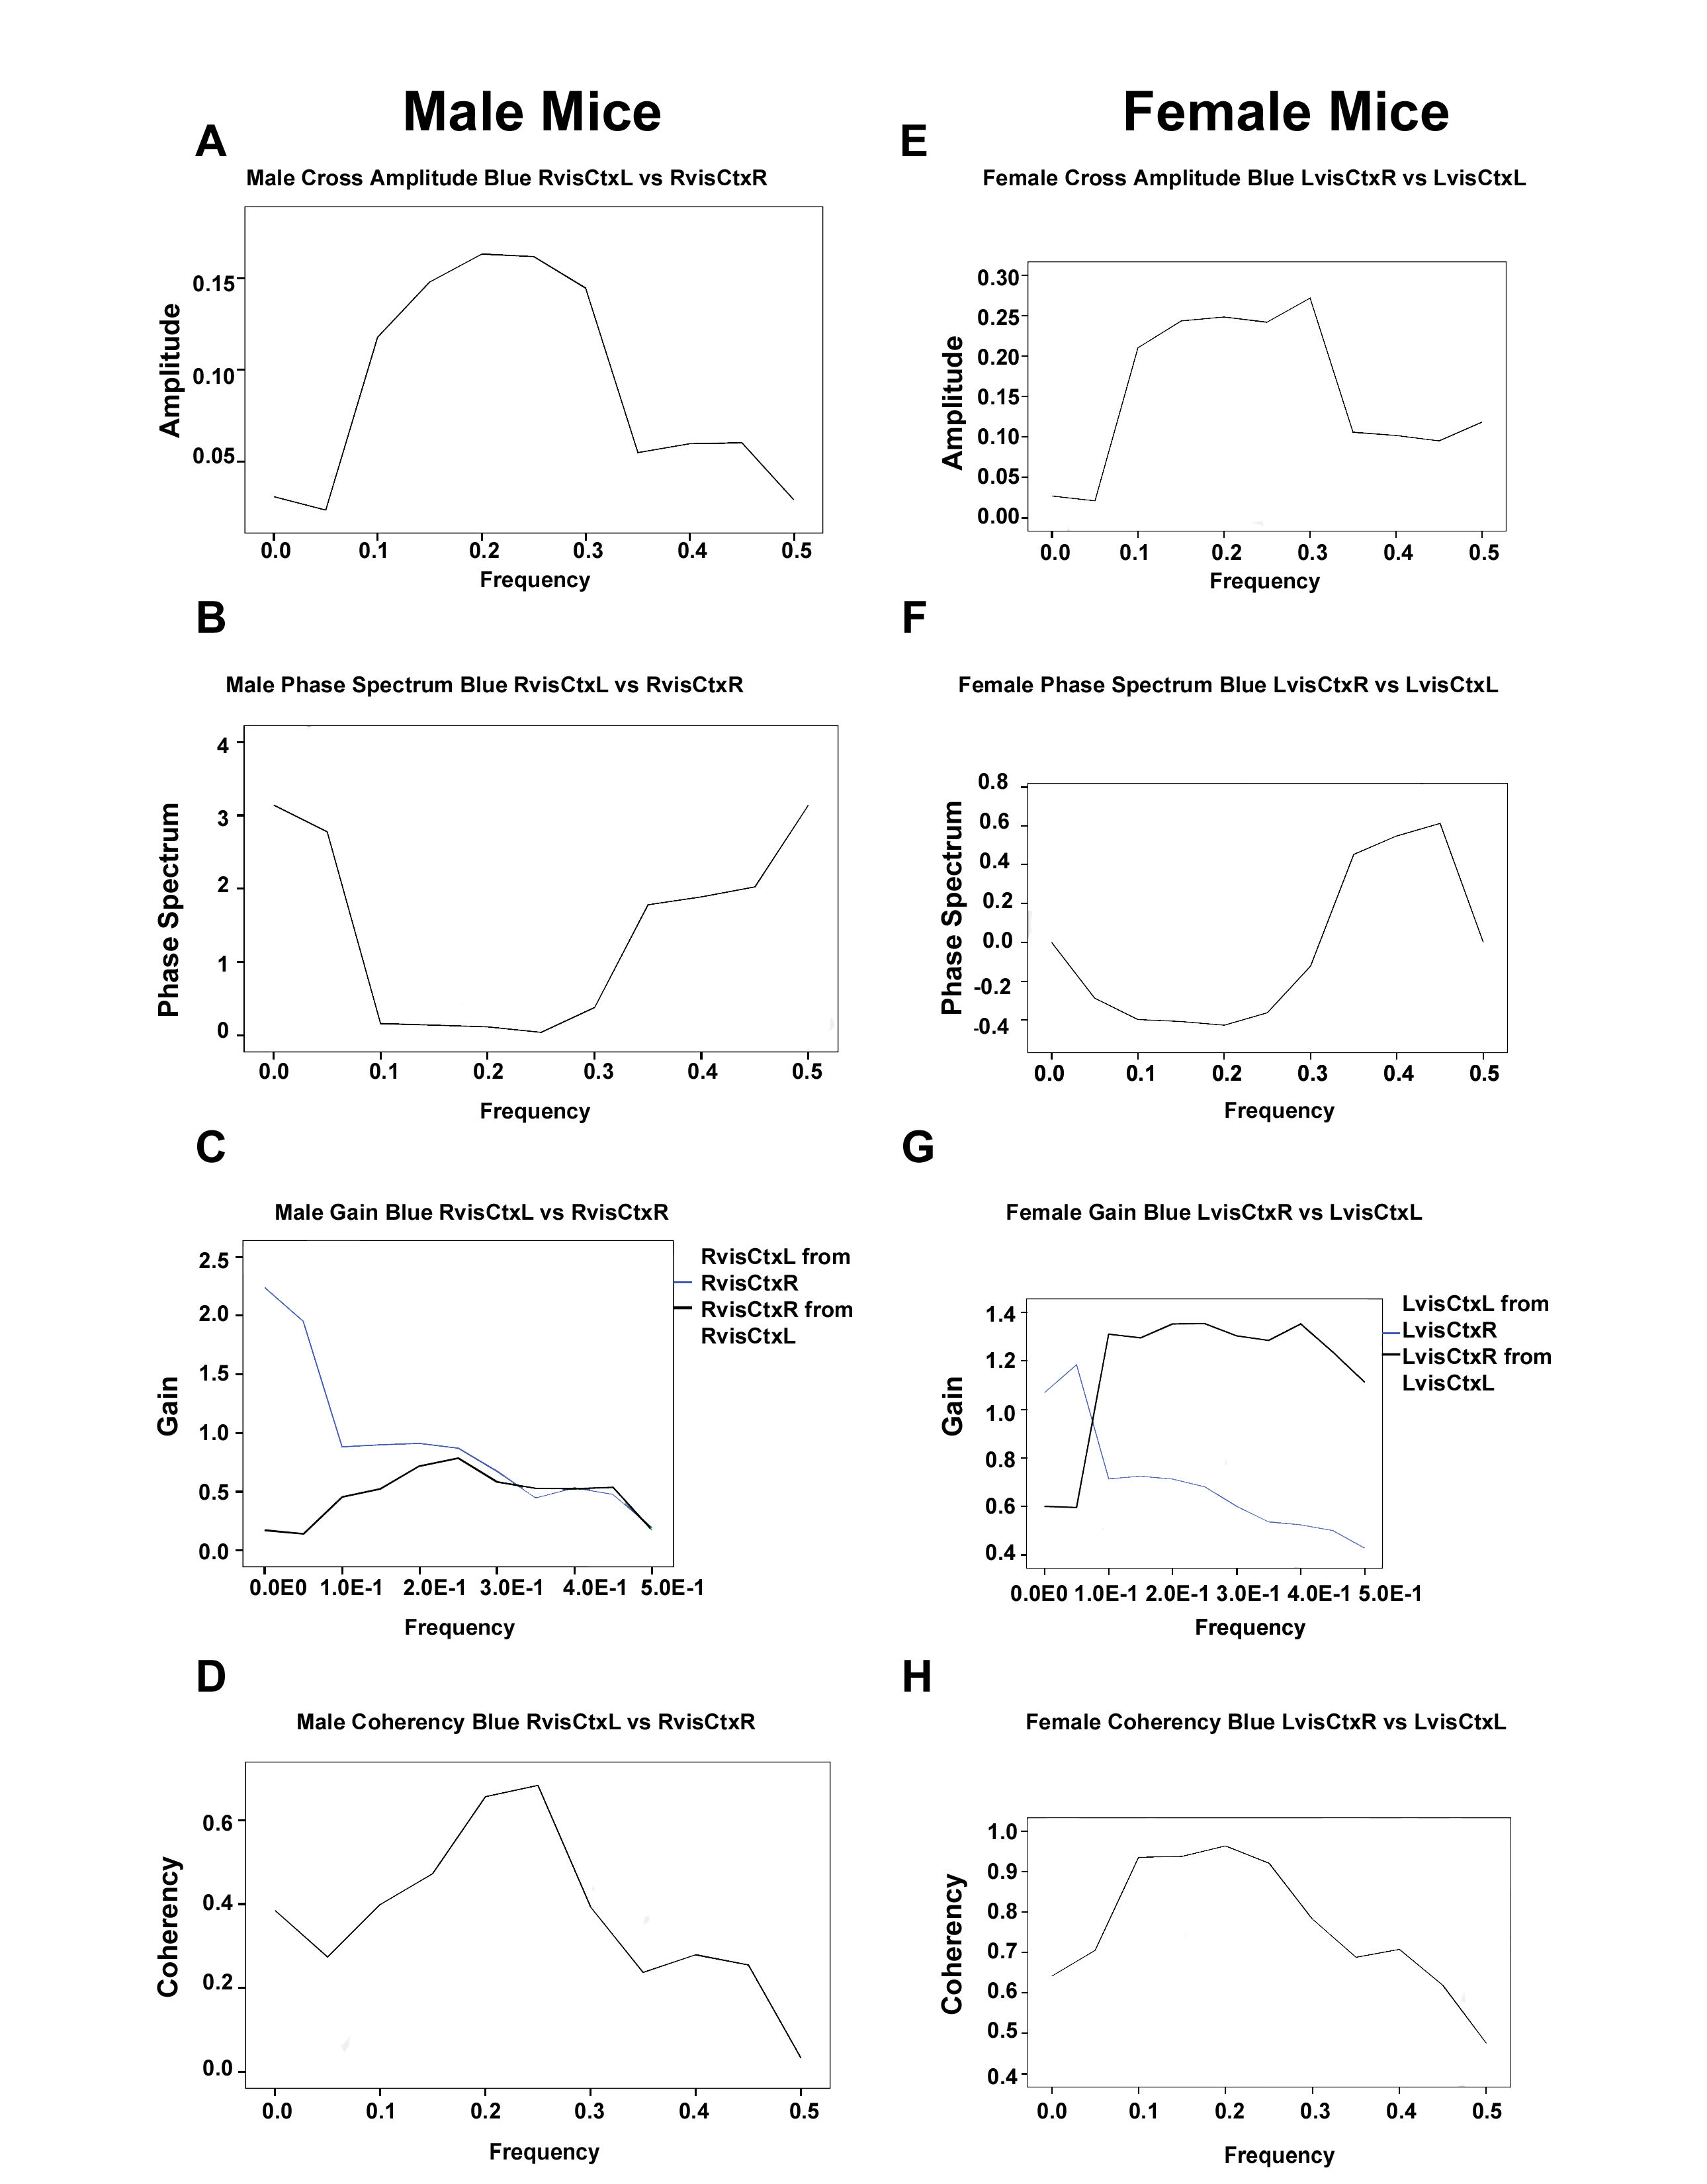
3.3.1. Analysis of Spectral Density Data in Male Mice
3.3.2. Analysis of Spectral Density Data in Female Mice
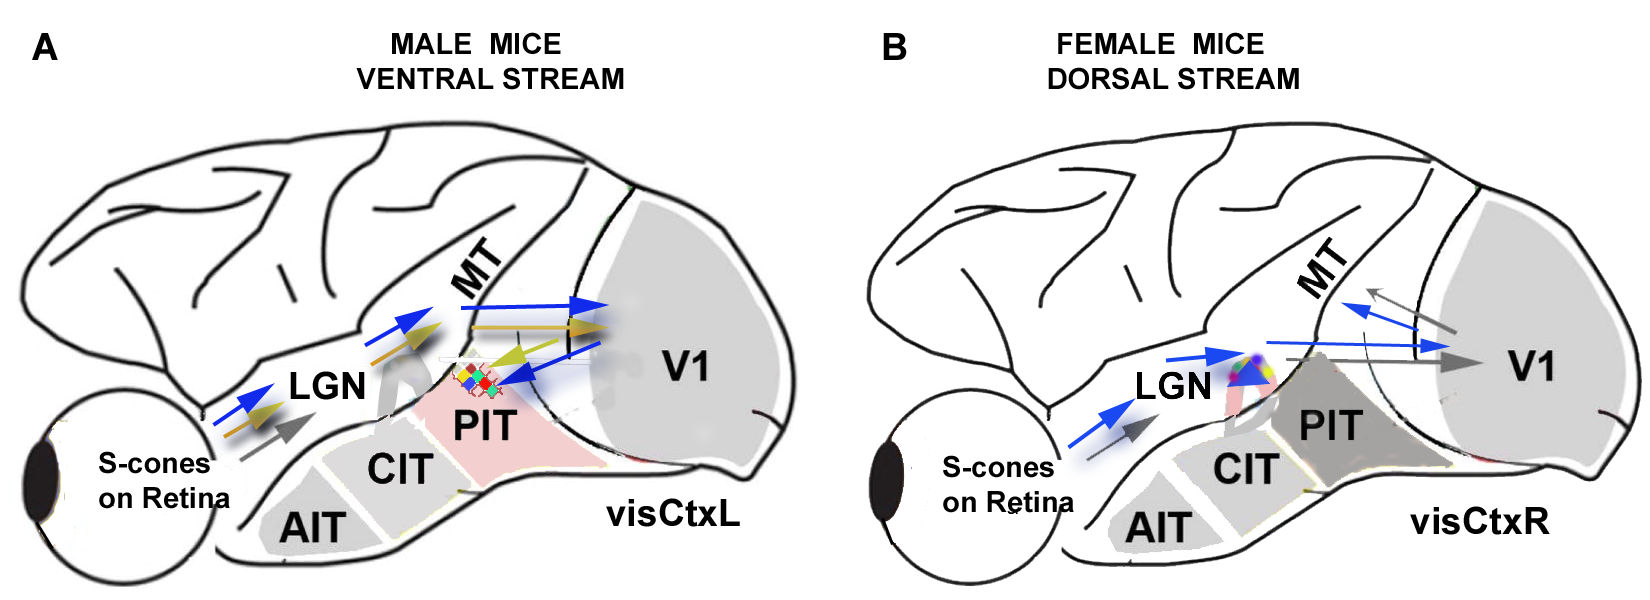
4. Discussion
4.1. Gender Differences in Mechanisms for Color Processing
4.2. Fourier Analysis to Differentiate Cortical and Ganglionic Vessels
5. Conclusions
Author Contributions
Funding
Conflicts of Interest
References
- Njemanze, P.C.; Kranz, M.; Amend, M.; Hauser, J.; Wehrl, H.; Brust, P. Gender differences in cerebral metabolism for color processing in mice: A PET/MRI study. PLoS ONE 2017, 12, e0179919. [Google Scholar] [CrossRef] [PubMed]
- Ungerleider, L.G.; Haxby, J.V. ‘What’ and ‘where’ in the human brain. Curr. Opin. Neurobiol. 1994, 4, 157–165. [Google Scholar] [CrossRef]
- Ungerleider, L.G.; Mishkin, M. Two cortical visual systems. In Analysis of Visual Behavior; Goodale, M.A., Mansfield, R.J.Q., Eds.; MIT: Cambridge, MA, USA, 1982; pp. 549–586. [Google Scholar]
- Perry, C.J.; Fallah, M. Feature integration and object representations along the dorsal stream visual hierarchy. Front. Comput. Neurosci. 2014, 8, 84. [Google Scholar] [CrossRef] [PubMed]
- McKeefry, D.J.; Zeki, S. The position and topography of the human color centre as revealed by functional magnetic resonance imaging. Brain 1997, 120, 2229–2242. [Google Scholar] [CrossRef] [PubMed]
- Gray, H.; Clemente, C.D. Gray’s Anatomy of the Human Body, 30th American ed.; Lippincott Williams & Wilkins: Philadelphia, PA, USA, 1984; ISBN-13 978-0812106442. [Google Scholar]
- Takechi, H.; Onoe, H.; Shizuno, H.; Yoshikawa, E.; Sadato, N.; Tsukada, H.Y.; Watanabe, Y. Mapping of cortical areas involved in color vision in non-human primates. Neurosci. Lett. 1997, 230, 17–20. [Google Scholar] [CrossRef]
- Buchsbaum, G.; Gottschalk, A. Trichromacy, opponent colors coding and optimum color information transmission in the retina. Proc. R. Soc. Lond. B Biol. Sci. 1983, 220, 89–113. [Google Scholar] [CrossRef] [PubMed]
- Gouras, P. The Perception of Color: Vision and Dysfunction; Macmillan: England, UK, 1991; pp. 179–197. [Google Scholar]
- Daw, N.W. Goldfish retina: Organization for simultaneous color contrast. Science 1967, 158, 942–944. [Google Scholar] [CrossRef] [PubMed]
- Livingstone, M.S.; Hubel, D.H. Anatomy and physiology of a color system in the primate visual cortex. J. Neurosci. 1984, 4, 309–356. [Google Scholar] [CrossRef] [PubMed]
- Dufort, P.A.; Lumsden, C.J. Color categorization and color constancy in a neural network model of V4. Biol. Cybern. 1991, 65, 293–303. [Google Scholar] [CrossRef] [PubMed]
- Kraft, J.M.; Brainard, D.H. Mechanisms of color constancy under nearly natural viewing. Proc. Natl. Acad. Sci. USA 1999, 96, 307–312. [Google Scholar] [CrossRef] [PubMed] [Green Version]
- Conway, B.R. Spatial structure of cone inputs to color cells in alert macaque primary visual cortex (V-1). J. Neurosci. 2001, 21, 2768–2783. [Google Scholar] [CrossRef] [PubMed]
- Zeki, S. A Vision of the Brain; Plate 16; Blackwell Scientific: Cambridge, MA, USA, 1993. [Google Scholar]
- Njemanze, P.C.; Gomez, C.R.; Horenstein, S. Cerebral lateralization and color perception: A transcranial Doppler study. Cortex 1992, 28, 69–75. [Google Scholar] [CrossRef]
- Njemanze, P.C. Asymmetric neuroplasticity of color processing during head down rest: A functional transcranial Doppler spectroscopy study. J. Gravit. Physiol. 2008, 15, 49–59. [Google Scholar]
- Njemanze, P.C. Gender-related asymmetric brain vasomotor response to color stimulation: A functional transcranial Doppler spectroscopy study. Exp. Transl. Stroke Med. 2010, 2, e21. [Google Scholar] [CrossRef] [PubMed]
- Njemanze, P.C. Gender-related differences in physiologic color space: A functional transcranial Doppler (fTCD) study. Exp. Transl. Stroke Med. 2011, 3, e1. [Google Scholar] [CrossRef] [PubMed]
- Njemanze, P.C. Cerebral lateralisation for facial processing: Gender-related cognitive styles determined using Fourier analysis of mean cerebral blood flow velocity in the middle cerebral arteries. Laterality 2007, 12, 31–49. [Google Scholar] [CrossRef] [PubMed]
- Yarowsky, P.J.; Ingvar, D.H. Symposium summary. Neuronal activity and energy metabolism. Fed. Proc. 1981, 40, 2353–2362. [Google Scholar] [PubMed]
- Fox, P.T.; Raichle, M.E. Focal physiological uncoupling of cerebral blood flow and oxidative metabolism during somatosensory stimulation in human subjects. Proc. Natl. Acad. Sci. USA 1986, 83, 1140–1144. [Google Scholar] [CrossRef] [PubMed]
- Dahl, A.; Lindegaard, K.-F.; Russell, D.; Nyberg-Hansen, R.; Rootwelt, K.; Sorteberg, W.; Nornes, H. A comparison of transcranial Doppler and cerebral blood flow studies to assess cerebral vasoreactivity. Stroke 1992, 23, 15–19. [Google Scholar] [CrossRef] [PubMed]
- Bloomfield, P. Fourier Analysis of Time Series: An Introduction; Wiley: New York, NY, USA, 1976. [Google Scholar]
- Attinger, E.O.; Anne, A.; McDonald, D.A. Use of Fourier series for analysis of biological systems. Biophys. J. 1966, 6, 291–304. [Google Scholar] [CrossRef]
- Njemanze, P.C.; Beck, O.J.; Gomez, C.R.; Horenstein, S. Fourier analysis of the cerebrovascular system. Stroke 1991, 22, 721–726. [Google Scholar] [CrossRef] [PubMed]
- Schuett, S.; Bonhoeffer, T.; Hübener, M. Mapping retinotopic structure in mouse visual cortex with optical imaging. J. Neurosci. 2002, 22, 6549–6559. [Google Scholar] [CrossRef] [PubMed]
- Bastos, A.M.; Vezoli, J.; Bosman, C.A.; Schoffelen, J.M.; Oostenveld, R.; Dowdall, J.R.; De Weerd, P.; Kennedy, H.; Fries, P. Visual areas exert feedforward and feedback influences through distinct frequency channels. Neuron 2015, 85, 390–401. [Google Scholar] [CrossRef] [PubMed]
- Bliss, T.V.; Lomo, T. Long-lasting potentiation of synaptic transmission in the dentate area of the anaesthetized rabbit following stimulation of the perforant path. J. Physiol. 1973, 232, 331–356. [Google Scholar] [CrossRef] [PubMed] [Green Version]
- Ito, M. Long-term depression. Annu. Rev. Neurosci. 1989, 12, 85–102. [Google Scholar] [CrossRef] [PubMed]
- Kwiatkowski, D.; Phillips, P.C.B.; Schmidt, P.; Shin, Y. Testing the null hypothesis of stationarity against the alternative of a unit root: How sure are we that economic time series have a unit root? J. Econom. 1992, 54, 159–178. [Google Scholar] [CrossRef]
- Harris, F.J. On the use of windows for harmonic analysis with the discrete Fourier transform. Proc. IEEE 1978, 66, 51–83. [Google Scholar] [CrossRef] [Green Version]
- Poularikas, A.D. The Handbook of Formulas and Tables for Signal Processing; CRC Press LLC: Boca Raton, FL, USA, 1999. [Google Scholar]
- Ghanavati, S.; Yu, L.X.; Lerch, J.P.; Sled, J.G. A perfusion procedure for imaging of the mouse cerebral vasculature by X-ray micro-CT. J. Neurosci. Methods 2014, 221, 70–77. [Google Scholar] [CrossRef] [PubMed] [Green Version]
- Hutcheon, B.; Yarom, Y. Resonance, oscillation and the intrinsic frequency preferences of neurons. Trends Neurosci. 2000, 23, 216–222. [Google Scholar] [CrossRef]
- DiCarlo, J.J.; Zoccolan, D.; Rust, N.C. How does the brain solve visual object recognition? Neuron 2012, 73, 415–434. [Google Scholar] [CrossRef] [PubMed]
- Kravitz, D.J.; Saleem, K.S.; Baker, C.I.; Mishkin, M. A new neural framework for visuospatial processing. Nat. Rev. Neurosci. 2011, 12, 217–230. [Google Scholar] [CrossRef] [PubMed]
- McDonald, D.A. Blood Flow in Arteries, 2nd ed.; Williams & Wilkins Co.: Baltimore, MD, USA, 1974. [Google Scholar]
- Di Lascio, N.; Stea, F.; Kusmic, C.; Sicari, R.; Faita, F. Non-invasive assessment of pulse wave velocity in mice by means of ultrasound images. Atherosclerosis 2014, 237, 31–37. [Google Scholar] [CrossRef] [PubMed]
- Fries, P. Neuronal gamma-band synchronization as a fundamental process in cortical computation. Annu. Rev. Neurosci. 2009, 32, 209–224. [Google Scholar] [CrossRef] [PubMed]
- Jacobs, G.H.; Williams, G.A.; Cahill, H.; Nathans, J. Emergence of novel color vision in mice engineered to express a human cone photopigment. Science 2007, 315, 1723–1725. [Google Scholar] [CrossRef] [PubMed]
- Zhang, D.Q.; Yang, X.L. GABA modulates color-opponent bipolar cells in carp retina. Brain Res. 1998, 792, 319–323. [Google Scholar] [CrossRef]
- Thie, J.A. Understanding the standardized uptake value, its methods, and implications for usage. J. Nucl. Med. 2004, 45, 1431–1434. [Google Scholar] [PubMed]
- Ramachandran, V.S. The Tell Tale Brain: A Neuroscientist’s Quest for What Makes Us Human; W. W. Norton & Company, Inc.: New York, NY, USA, 2012; ISBN 9780393340624. [Google Scholar]
- Serafini, G.; Hayley, S.; Pompilli, M.; Dwivedi, Y.; Brahmachari, G.; Giraldi, P.; Amore, A. Hippocampal neurogenesis, neurotrophic factors and depression: Possible therapeutic targets? CNS Neurol. Disrd.-Drug Targets 2014, 13, 1708–1721. [Google Scholar] [CrossRef]
- Njemanze, P.C. Cerebral lateralisation and general intelligence: Gender differences in a transcranial Doppler study. Brain Lang 2005, 92, 234–239. [Google Scholar] [CrossRef] [PubMed]


| Stimulation | Dark | Dark | LightR | LightR | LightL | LightL | BlueR | BlueR | BlueL | BlueL | YellowR | YellowR | YellowL | YellowL |
|---|---|---|---|---|---|---|---|---|---|---|---|---|---|---|
| Visual Cortex | visCtxR | visCtxL | visCtxR | visCtxL | visCtxR | visCtxL | visCtxR | visCtxL | visCtxR | visCtxL | visCtxR | visCtxL | visCtxR | visCtxL |
| Time | Male Mice | |||||||||||||
| 150 | 1.48 | 1.28 | 1.58 | 1.81 | 1.53 | 1.35 | 1.41 | 1.37 | 1.32 | 1.29 | 1.48 | 1.31 | 1.16 | 1.08 |
| 150 | 1.41 | 1.23 | 1.12 | 1.04 | 0.94 | 1.03 | 1.34 | 1.49 | 1.22 | 1.12 | 1.24 | 1.32 | 1.01 | 0.91 |
| 150 | 1.52 | 1.55 | 1.63 | 1.56 | 1.67 | 1.79 | 1.36 | 1.52 | 0.88 | 1.00 | 1.54 | 1.50 | 1.42 | 1.46 |
| 150 | 0.99 | 0.97 | 0.69 | 0.72 | 1.14 | 1.06 | 1.58 | 1.65 | 1.43 | 1.46 | 1.48 | 1.43 | 1.19 | 1.13 |
| 150 | 1.38 | 1.34 | 1.05 | 1.02 | 1.51 | 1.41 | 1.37 | 1.52 | 1.21 | 1.22 | 1.48 | 1.55 | 1.16 | 1.18 |
| 450 | 1.44 | 1.20 | 1.73 | 1.84 | 1.43 | 1.39 | 1.41 | 1.50 | 1.33 | 1.31 | 1.50 | 1.36 | 1.20 | 1.18 |
| 450 | 1.35 | 1.21 | 1.12 | 1.08 | 1.00 | 1.07 | 1.39 | 1.56 | 1.27 | 1.28 | 1.26 | 1.37 | 1.07 | 0.96 |
| 450 | 1.52 | 1.73 | 1.71 | 1.61 | 1.66 | 1.75 | 1.45 | 1.46 | 1.03 | 1.06 | 1.57 | 1.62 | 1.49 | 1.46 |
| 450 | 1.06 | 1.07 | 0.80 | 0.78 | 1.13 | 1.14 | 1.56 | 1.63 | 1.43 | 1.33 | 1.47 | 1.45 | 1.21 | 1.27 |
| 450 | 1.49 | 1.47 | 1.12 | 1.15 | 1.54 | 1.49 | 1.56 | 1.55 | 1.26 | 1.24 | 1.56 | 1.49 | 1.29 | 1.24 |
| 750 | 1.53 | 1.32 | 1.79 | 1.64 | 1.40 | 1.41 | 1.52 | 1.43 | 1.35 | 1.28 | 1.51 | 1.25 | 1.26 | 1.29 |
| 750 | 1.38 | 1.21 | 1.08 | 1.02 | 1.05 | 1.12 | 1.50 | 1.48 | 1.20 | 1.23 | 1.27 | 1.41 | 1.00 | 0.93 |
| 750 | 1.45 | 1.66 | 1.70 | 1.58 | 1.58 | 1.71 | 1.50 | 1.49 | 1.14 | 1.17 | 1.64 | 1.60 | 1.50 | 1.47 |
| 750 | 1.12 | 1.15 | 0.78 | 0.80 | 1.24 | 1.24 | 1.66 | 1.59 | 1.51 | 1.30 | 1.53 | 1.48 | 1.33 | 1.22 |
| 750 | 1.46 | 1.45 | 1.27 | 1.18 | 1.50 | 1.53 | 1.45 | 1.68 | 1.30 | 1.24 | 1.46 | 1.57 | 1.29 | 1.32 |
| 1050 | 1.48 | 1.41 | 1.70 | 1.74 | 1.40 | 1.33 | 1.46 | 1.47 | 1.40 | 1.30 | 1.60 | 1.38 | 1.30 | 1.26 |
| 1050 | 1.29 | 1.24 | 1.02 | 1.02 | 1.05 | 1.05 | 1.32 | 1.47 | 1.27 | 1.25 | 1.21 | 1.36 | 0.99 | 0.97 |
| 1050 | 1.55 | 1.61 | 1.74 | 1.63 | 1.62 | 1.55 | 1.41 | 1.49 | 1.22 | 1.18 | 1.57 | 1.59 | 1.50 | 1.50 |
| 1050 | 1.19 | 1.14 | 0.88 | 0.92 | 1.30 | 1.35 | 1.65 | 1.56 | 1.44 | 1.46 | 1.53 | 1.44 | 1.31 | 1.29 |
| 1050 | 1.44 | 1.37 | 1.24 | 1.30 | 1.54 | 1.49 | 1.48 | 1.68 | 1.28 | 1.25 | 1.52 | 1.46 | 1.40 | 1.43 |
| Time | Female Mice | |||||||||||||
| 150 | 1.14 | 0.99 | 0.94 | 0.97 | 1.13 | 1.03 | 1.23 | 1.26 | 1.29 | 1.22 | 1.21 | 1.24 | 1.28 | 1.21 |
| 150 | 1.31 | 1.22 | 1.00 | 0.92 | 1.11 | 1.06 | 1.44 | 1.49 | 1.25 | 1.30 | 1.35 | 1.23 | 1.32 | 1.39 |
| 150 | 1.06 | 1.11 | 1.15 | 1.11 | 1.40 | 1.36 | 1.05 | 1.22 | 1.41 | 1.38 | 1.15 | 1.00 | 1.01 | 1.01 |
| 150 | 1.39 | 1.37 | 1.19 | 1.08 | 1.58 | 1.60 | 1.21 | 1.24 | 1.38 | 1.40 | 1.16 | 1.18 | 1.26 | 1.28 |
| 150 | 1.21 | 1.25 | 1.06 | 0.99 | 1.13 | 1.18 | 1.34 | 1.25 | 1.37 | 1.18 | 1.16 | 1.18 | 1.23 | 1.32 |
| 450 | 1.17 | 1.16 | 0.95 | 0.99 | 1.13 | 0.98 | 1.08 | 1.16 | 1.29 | 1.27 | 1.25 | 1.27 | 1.38 | 1.28 |
| 450 | 1.26 | 1.28 | 1.10 | 1.07 | 1.15 | 1.13 | 1.52 | 1.40 | 1.30 | 1.24 | 1.40 | 1.25 | 1.41 | 1.41 |
| 450 | 1.03 | 1.12 | 1.11 | 1.14 | 1.44 | 1.38 | 1.14 | 1.12 | 1.44 | 1.43 | 1.21 | 0.98 | 1.08 | 1.01 |
| 450 | 1.40 | 1.31 | 1.19 | 1.23 | 1.71 | 1.75 | 1.26 | 1.37 | 1.40 | 1.35 | 1.19 | 1.23 | 1.23 | 1.29 |
| 450 | 1.18 | 1.17 | 0.97 | 1.02 | 1.06 | 1.12 | 1.35 | 1.35 | 1.31 | 1.13 | 1.19 | 1.23 | 1.21 | 1.29 |
| 750 | 1.11 | 1.17 | 0.92 | 0.98 | 1.14 | 0.98 | 1.03 | 1.14 | 1.29 | 1.28 | 1.25 | 1.19 | 1.30 | 1.35 |
| 750 | 1.33 | 1.33 | 1.16 | 1.15 | 1.12 | 1.11 | 1.53 | 1.53 | 1.27 | 1.23 | 1.47 | 1.23 | 1.52 | 1.51 |
| 750 | 1.01 | 1.10 | 1.16 | 1.12 | 1.44 | 1.35 | 1.14 | 1.22 | 1.51 | 1.54 | 1.16 | 1.01 | 1.05 | 1.13 |
| 750 | 1.46 | 1.49 | 1.18 | 1.24 | 1.71 | 1.63 | 1.34 | 1.29 | 1.43 | 1.38 | 1.18 | 1.19 | 1.27 | 1.22 |
| 750 | 1.16 | 1.14 | 0.93 | 0.98 | 1.08 | 1.19 | 1.30 | 1.33 | 1.26 | 1.10 | 1.18 | 1.19 | 1.25 | 1.30 |
| 1050 | 1.17 | 1.05 | 0.91 | 0.98 | 1.04 | 1.01 | 1.04 | 1.05 | 1.34 | 1.34 | 1.27 | 1.20 | 1.28 | 1.25 |
| 1050 | 1.35 | 1.32 | 1.22 | 1.18 | 1.19 | 1.08 | 1.44 | 1.39 | 1.29 | 1.28 | 1.41 | 1.34 | 1.44 | 1.53 |
| 1050 | 0.97 | 1.09 | 1.13 | 1.06 | 1.43 | 1.39 | 1.14 | 1.11 | 1.44 | 1.39 | 1.23 | 1.08 | 1.14 | 1.09 |
| 1050 | 1.37 | 1.33 | 1.21 | 1.23 | 1.68 | 1.66 | 1.29 | 1.30 | 1.36 | 1.36 | 1.18 | 1.17 | 1.24 | 1.28 |
| 1050 | 1.11 | 1.14 | 0.92 | 0.88 | 1.03 | 1.11 | 1.39 | 1.35 | 1.20 | 1.12 | 1.18 | 1.17 | 1.24 | 1.20 |
| Stimulation | Dark | Dark | LightR | LightR | LightL | LightL | BlueR | BlueR | BlueL | BlueL | YellowR | YellowR | YellowL | YellowL |
|---|---|---|---|---|---|---|---|---|---|---|---|---|---|---|
| Visual Cortex | visCtxR | visCtxL | visCtxR | visCtxL | visCtxR | visCtxL | visCtxR | visCtxL | visCtxR | visCtxL | visCtxR | visCtxL | visCtxR | visCtxL |
| Male Mice | ||||||||||||||
| C-peak | 0.005 | 0.006 | 0.012 | 0.014 | 0.002 | 0.003 | 0.014 | 0.004 | 0.001 | 0.002 | 0.002 | 0.005 | 0.002 | 0.005 |
| 0.012 | 0.010 | 0.026 | 0.033 | 0.005 | 0.006 | 0.015 | 0.007 | 0.006 | 0.008 | 0.004 | 0.010 | 0.008 | 0.009 | |
| 0.038 | 0.023 | 0.105 | 0.141 | 0.014 | 0.023 | 0.021 | 0.016 | 0.029 | 0.022 | 0.019 | 0.025 | 0.033 | 0.038 | |
| 0.068 | 0.029 | 0.185 | 0.255 | 0.023 | 0.039 | 0.030 | 0.027 | 0.055 | 0.030 | 0.034 | 0.039 | 0.055 | 0.068 | |
| 0.043 | 0.015 | 0.103 | 0.148 | 0.013 | 0.021 | 0.017 | 0.017 | 0.037 | 0.016 | 0.019 | 0.023 | 0.031 | 0.038 | |
| S-peak | 0.023 | 0.030 | 0.044 | 0.102 | 0.017 | 0.037 | 0.006 | 0.008 | 0.022 | 0.013 | 0.013 | 0.010 | 0.017 | 0.023 |
| 0.081 | 0.162 | 0.170 | 0.485 | 0.095 | 0.224 | 0.014 | 0.011 | 0.061 | 0.039 | 0.051 | 0.021 | 0.073 | 0.098 | |
| 0.147 | 0.290 | 0.312 | 0.896 | 0.177 | 0.420 | 0.022 | 0.014 | 0.102 | 0.058 | 0.088 | 0.035 | 0.132 | 0.180 | |
| 0.080 | 0.157 | 0.169 | 0.490 | 0.101 | 0.239 | 0.013 | 0.011 | 0.058 | 0.030 | 0.048 | 0.020 | 0.073 | 0.100 | |
| 0.025 | 0.048 | 0.051 | 0.152 | 0.036 | 0.083 | 0.007 | 0.007 | 0.021 | 0.010 | 0.016 | 0.007 | 0.025 | 0.033 | |
| Female Mice | ||||||||||||||
| C-peak | 0.002 | 0.010 | 0.002 | 0.010 | 0.003 | 0.006 | 0.003 | 0.009 | 0.004 | 0.002 | 0.002 | 0.001 | 0.003 | 0.006 |
| 0.004 | 0.013 | 0.011 | 0.009 | 0.030 | 0.038 | 0.009 | 0.017 | 0.006 | 0.008 | 0.006 | 0.005 | 0.009 | 0.012 | |
| 0.007 | 0.017 | 0.049 | 0.025 | 0.193 | 0.233 | 0.014 | 0.012 | 0.019 | 0.037 | 0.028 | 0.017 | 0.034 | 0.033 | |
| 0.009 | 0.020 | 0.082 | 0.044 | 0.358 | 0.429 | 0.010 | 0.005 | 0.033 | 0.066 | 0.050 | 0.031 | 0.055 | 0.048 | |
| 0.005 | 0.012 | 0.046 | 0.025 | 0.197 | 0.234 | 0.006 | 0.003 | 0.020 | 0.038 | 0.027 | 0.020 | 0.030 | 0.025 | |
| S-peak | 0.015 | 0.014 | 0.01 | 0.006 | 0.041 | 0.044 | 0.019 | 0.014 | 0.006 | 0.013 | 0.006 | 0.009 | 0.013 | 0.013 |
| 0.086 | 0.054 | 0.009 | 0.012 | 0.061 | 0.034 | 0.1 | 0.064 | 0.009 | 0.023 | 0.012 | 0.022 | 0.042 | 0.055 | |
| 0.158 | 0.091 | 0.018 | 0.026 | 0.111 | 0.058 | 0.183 | 0.111 | 0.013 | 0.034 | 0.021 | 0.037 | 0.071 | 0.103 | |
| 0.087 | 0.049 | 0.016 | 0.029 | 0.064 | 0.035 | 0.102 | 0.06 | 0.008 | 0.019 | 0.012 | 0.02 | 0.039 | 0.059 | |
| 0.028 | 0.015 | 0.014 | 0.026 | 0.026 | 0.017 | 0.034 | 0.02 | 0.004 | 0.007 | 0.005 | 0.006 | 0.014 | 0.022 | |
| Stimulation Through (R,L) | Brain Area | Mean ± SD | Δ% | p-Value | Spatial Opponency p-Value | Luminance Opponency p-Value | Chromatic Opponency p-Value | |||||||
|---|---|---|---|---|---|---|---|---|---|---|---|---|---|---|
| C-Peak | S-Peak | C-Peak | S-Peak | C-Peak | S-Peak | C-Peak vs. S-Peak | C-peak vs. C-Peak | S-peak vs. S-Peak | C-peak plus S-Peak | C-peak vs. C-Peak | S-peak vs. S-Peak | C-peak plus S-Peak | ||
| Male Mice | ||||||||||||||
| *Dark | visCtxR | 0.033 ± 0.255 | 0.071 ± 0.05 | - | - | - | - | NS | ||||||
| *Dark | visCtxL | 0.016 ± 0.009 | 0.137 ± 0.140 | - | - | - | - | 0.05 | ||||||
| LightL | visCtxR | 0.011 ± 0.008 | 0.085 ± 0.063 | −66.7% | 19.7% | 0.05 | NS | 0.05 | NS | NS | ||||
| LightR | visCtxL | 0.118 ± 0.098 | 0.425 ± 0.319 | 638% | 210% | NS | 0.05 | NS | NS | 0.05 | 0.01 | |||
| BlueL | visCtxR | 0.026±0.022 | 0.053 ± 0.033 | −21% | −25% | 0.05 | NS | NS | NS | NS | ||||
| BlueR | visCtxL | 0.014±0.009 | 0.01 ± 0.003 | −12.5% | −92.7% | NS | 0.05 | NS | 0.05 | NS | 0.01 | |||
| YellowL | visCtxR | 0.026 ± 0.021 | 0.064 ± 0.046 | −21% | −9.8% | 0.05 | 0.05 | NS | NS | NS | ||||
| YellowR | visCtxL | 0.02 ± 0.013 | 0.019 ± 0.01 | 25% | −87% | NS | 0.05 | NS | 0.05 | NS | 0.01 | |||
| Female Mice | ||||||||||||||
| *Dark | visCtxR | 0.005 ± 0.003 | 0.075 ± 0.057 | - | - | - | - | 0.05 | ||||||
| *Dark | visCtxL | 0.014 ± 0.004 | 0.045 ± 0.032 | - | - | - | - | NS | ||||||
| LightL | visCtxR | 0.156 ± 0.144 | 0.06 ± 0.032 | 3020% | −18.9% | NS | NS | NS | NS | NS | ||||
| LightR | visCtxL | 0.023 ± 0.014 | 0.02 ± 0.01 | 64% | −55.5% | NS | NS | NS | NS | NS | NS | |||
| BlueL | visCtxR | 0.017 ± 0.012 | 0.008 ± 0.003 | 220% | −90.5% | 0.05 | 0.05 | NS | NS | 0.05 | 0.01 | |||
| BlueR | visCtxL | 0.009 ± 0.005 | 0.054 ± 0.039 | −35.7% | 20% | NS | NS | 0.05 | NS | 0.05 | ||||
| YellowL | visCtxR | 0.026 ± 0.02 | 0.036 ± 0.024 | 420% | −52% | NS | NS | NS | NS | 0.05 | 0.01 | |||
| YellowR | visCtxL | 0.015 ± 0.012 | 0.02 ± 0.012 | 180% | −75% | NS | 0.05 | NS | NS | 0.05 | ||||
© 2018 by the authors. Licensee MDPI, Basel, Switzerland. This article is an open access article distributed under the terms and conditions of the Creative Commons Attribution (CC BY) license (http://creativecommons.org/licenses/by/4.0/).
Share and Cite
Njemanze, P.C.; Kranz, M.; Brust, P. Fourier Analysis of Cerebral Metabolism of Glucose: Gender Differences in Mechanisms of Color Processing in the Ventral and Dorsal Streams in Mice. Forecasting 2019, 1, 135-156. https://doi.org/10.3390/forecast1010010
Njemanze PC, Kranz M, Brust P. Fourier Analysis of Cerebral Metabolism of Glucose: Gender Differences in Mechanisms of Color Processing in the Ventral and Dorsal Streams in Mice. Forecasting. 2019; 1(1):135-156. https://doi.org/10.3390/forecast1010010
Chicago/Turabian StyleNjemanze, Philip C., Mathias Kranz, and Peter Brust. 2019. "Fourier Analysis of Cerebral Metabolism of Glucose: Gender Differences in Mechanisms of Color Processing in the Ventral and Dorsal Streams in Mice" Forecasting 1, no. 1: 135-156. https://doi.org/10.3390/forecast1010010
APA StyleNjemanze, P. C., Kranz, M., & Brust, P. (2019). Fourier Analysis of Cerebral Metabolism of Glucose: Gender Differences in Mechanisms of Color Processing in the Ventral and Dorsal Streams in Mice. Forecasting, 1(1), 135-156. https://doi.org/10.3390/forecast1010010