Abstract
In questionnaires, respondents sometimes feel uncertain about which category to choose and may respond randomly. Including uncertainty in the modeling of response behavior aims to obtain more accurate estimates of the impact of explanatory variables on actual preferences and to avoid bias. Additionally, variables that have an impact on uncertainty can be identified. A model is proposed that explicitly considers this uncertainty but also allows stronger certainty, depending on covariates. The developed uncertainty rating scale model is an extended version of the adjacent category model. It differs from finite mixture models, an approach that has gained popularity in recent years for modeling uncertainty. The properties of the model are investigated and compared to finite mixture models and other ordinal response models using illustrative datasets.
1. Introduction
Rating scales are widely used in psychological, social, and behavioral research to measure attitudes, preferences, and subjective evaluations. These scales typically generate ordinal responses, where the response categories have a meaningful order but do not necessarily have equal intervals between them. Common examples include Likert scales [1], which ask respondents to indicate their level of agreement or satisfaction on a multi-point scale, and categorical rating scales, such as frequency-based or intensity-based scales.
Ordinal regression models, such as the proportional odds model and adjacent category models, are powerful tools for analyzing rating scale and preference data, as they appropriately account for the ordinal nature of responses. Various extensions and adaptations of these models have been proposed; for an overview, see, for example, Agresti [2] and Tutz [3]. Most ordinal regression models aim to identify the explanatory variables that influence the likelihood of choosing higher or lower response categories but ignore other potential effects such as dispersion or a tendency to respond in an unstructured random way. The latter can be seen as a response style known as “random responding”. It occurs when respondents select answers without regard to the content, often due to fatigue, a lack of engagement, or a misunderstanding of the questions [4].
In the last few decades, several finite mixture approaches have been proposed to address the problem of random responding. The basic assumption is that the observations are the result of a combination of a deliberate choice and an uncertainty component. Within this framework, random guessing is referred to as uncertainty and modeled by a uniform distribution, the deliberate choice is most often called feeling and modeled by a shifted binomial distribution, which motivates the name CUB model for the Combination of a Uniform and a Binomial random variable. Their development started with the papers of Piccolo [5] and D’Elia and Piccolo [6] and has led to a multitude of versions. CUB mixture models have been propagated in a series of papers, including Iannario and Piccolo [7], Iannario [8], Iannario [9], Manisera and Zuccolotto [10], Piccolo [11], Simone et al. [12], Iannario et al. [13]. An overview is found in Piccolo and Simone [14].
The model considered here addresses the problem of random responding or uncertainty in quite a different way. Rather than using a finite mixture of unobservable components, a modification of the adjacent category model is proposed. In Section 2, the new model is introduced. In Section 3, alternative approaches to model uncertainty are considered and compared to the proposed uncertainty rating scale model. Further applications are given in Section 4. This paper closes with concluding remarks.The log-likelihood and the score function of the new model are given in the Appendix A.
2. Modeling Uncertainty
The model propagated in the following is an extension of the basic adjacent category model. First, the basic form is briefly considered. Then, the extension and its properties are considered.
The adjacent category model for ordered responses can be given in the form
where is a vector of explanatory variables. It is immediately seen that large values of favor high-response categories, whatever values the category-specific intercepts take.
An alternative but less intuitive and more complicated way of representing the model is by its probabilities, , which are given by
For notational convenience, this definition implicitly uses .
The adjacent categories is one of the three basic models that are most often used in ordinal regression. The three models are the cumulative model, the adjacent category model and the sequential model; see, for example, Agresti [2], Tutz [15]. The basic versions of these models typically yield rather similar results in terms of the effect strength and significance of explanatory variables; however, differences are found in extended versions of the models. In the following, an extended version of the adjacent category model is considered, which is later compared to extensions of cumulative models.
2.1. The Uncertainty Rating Scale Model
The model to be considered here contains an additional term that accounts for uncertainty or random guessing in response behavior. The term depends on explanatory variables , which can be identical to or differ to it. Typically, it is a subset of the variables in the vector . The model, called the Uncertainty Rating Scale (URS) model, is given by
The probabilities of the model are obtained by
While is the location effect found in the basic adjacent category model, the term models uncertainty. How it determines the response probabilities can be seen easily from the representation (2):
- If , one obtains the simple adjacent category model.
- If , one obtains and all probabilities have the same value. It means the person answers in a random way, yielding a uniform distribution.
- If either or , the person knows exactly which category to choose, indicating a deliberate choice.
For illustration, Figure 1 shows the probabilities for intercepts and several values of location (loc = ) and uncertainty (unc = ). It is seen that, whatever the location, large values of yield distributions that are close to the uniform distribution, while small values yield large probabilities in specific categories.
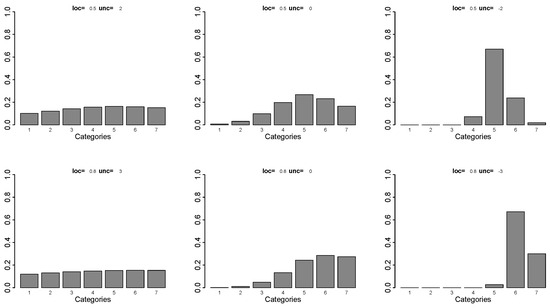
Figure 1.
Probabilities for uncertainty rating scale model with intercepts , location and uncertainty .
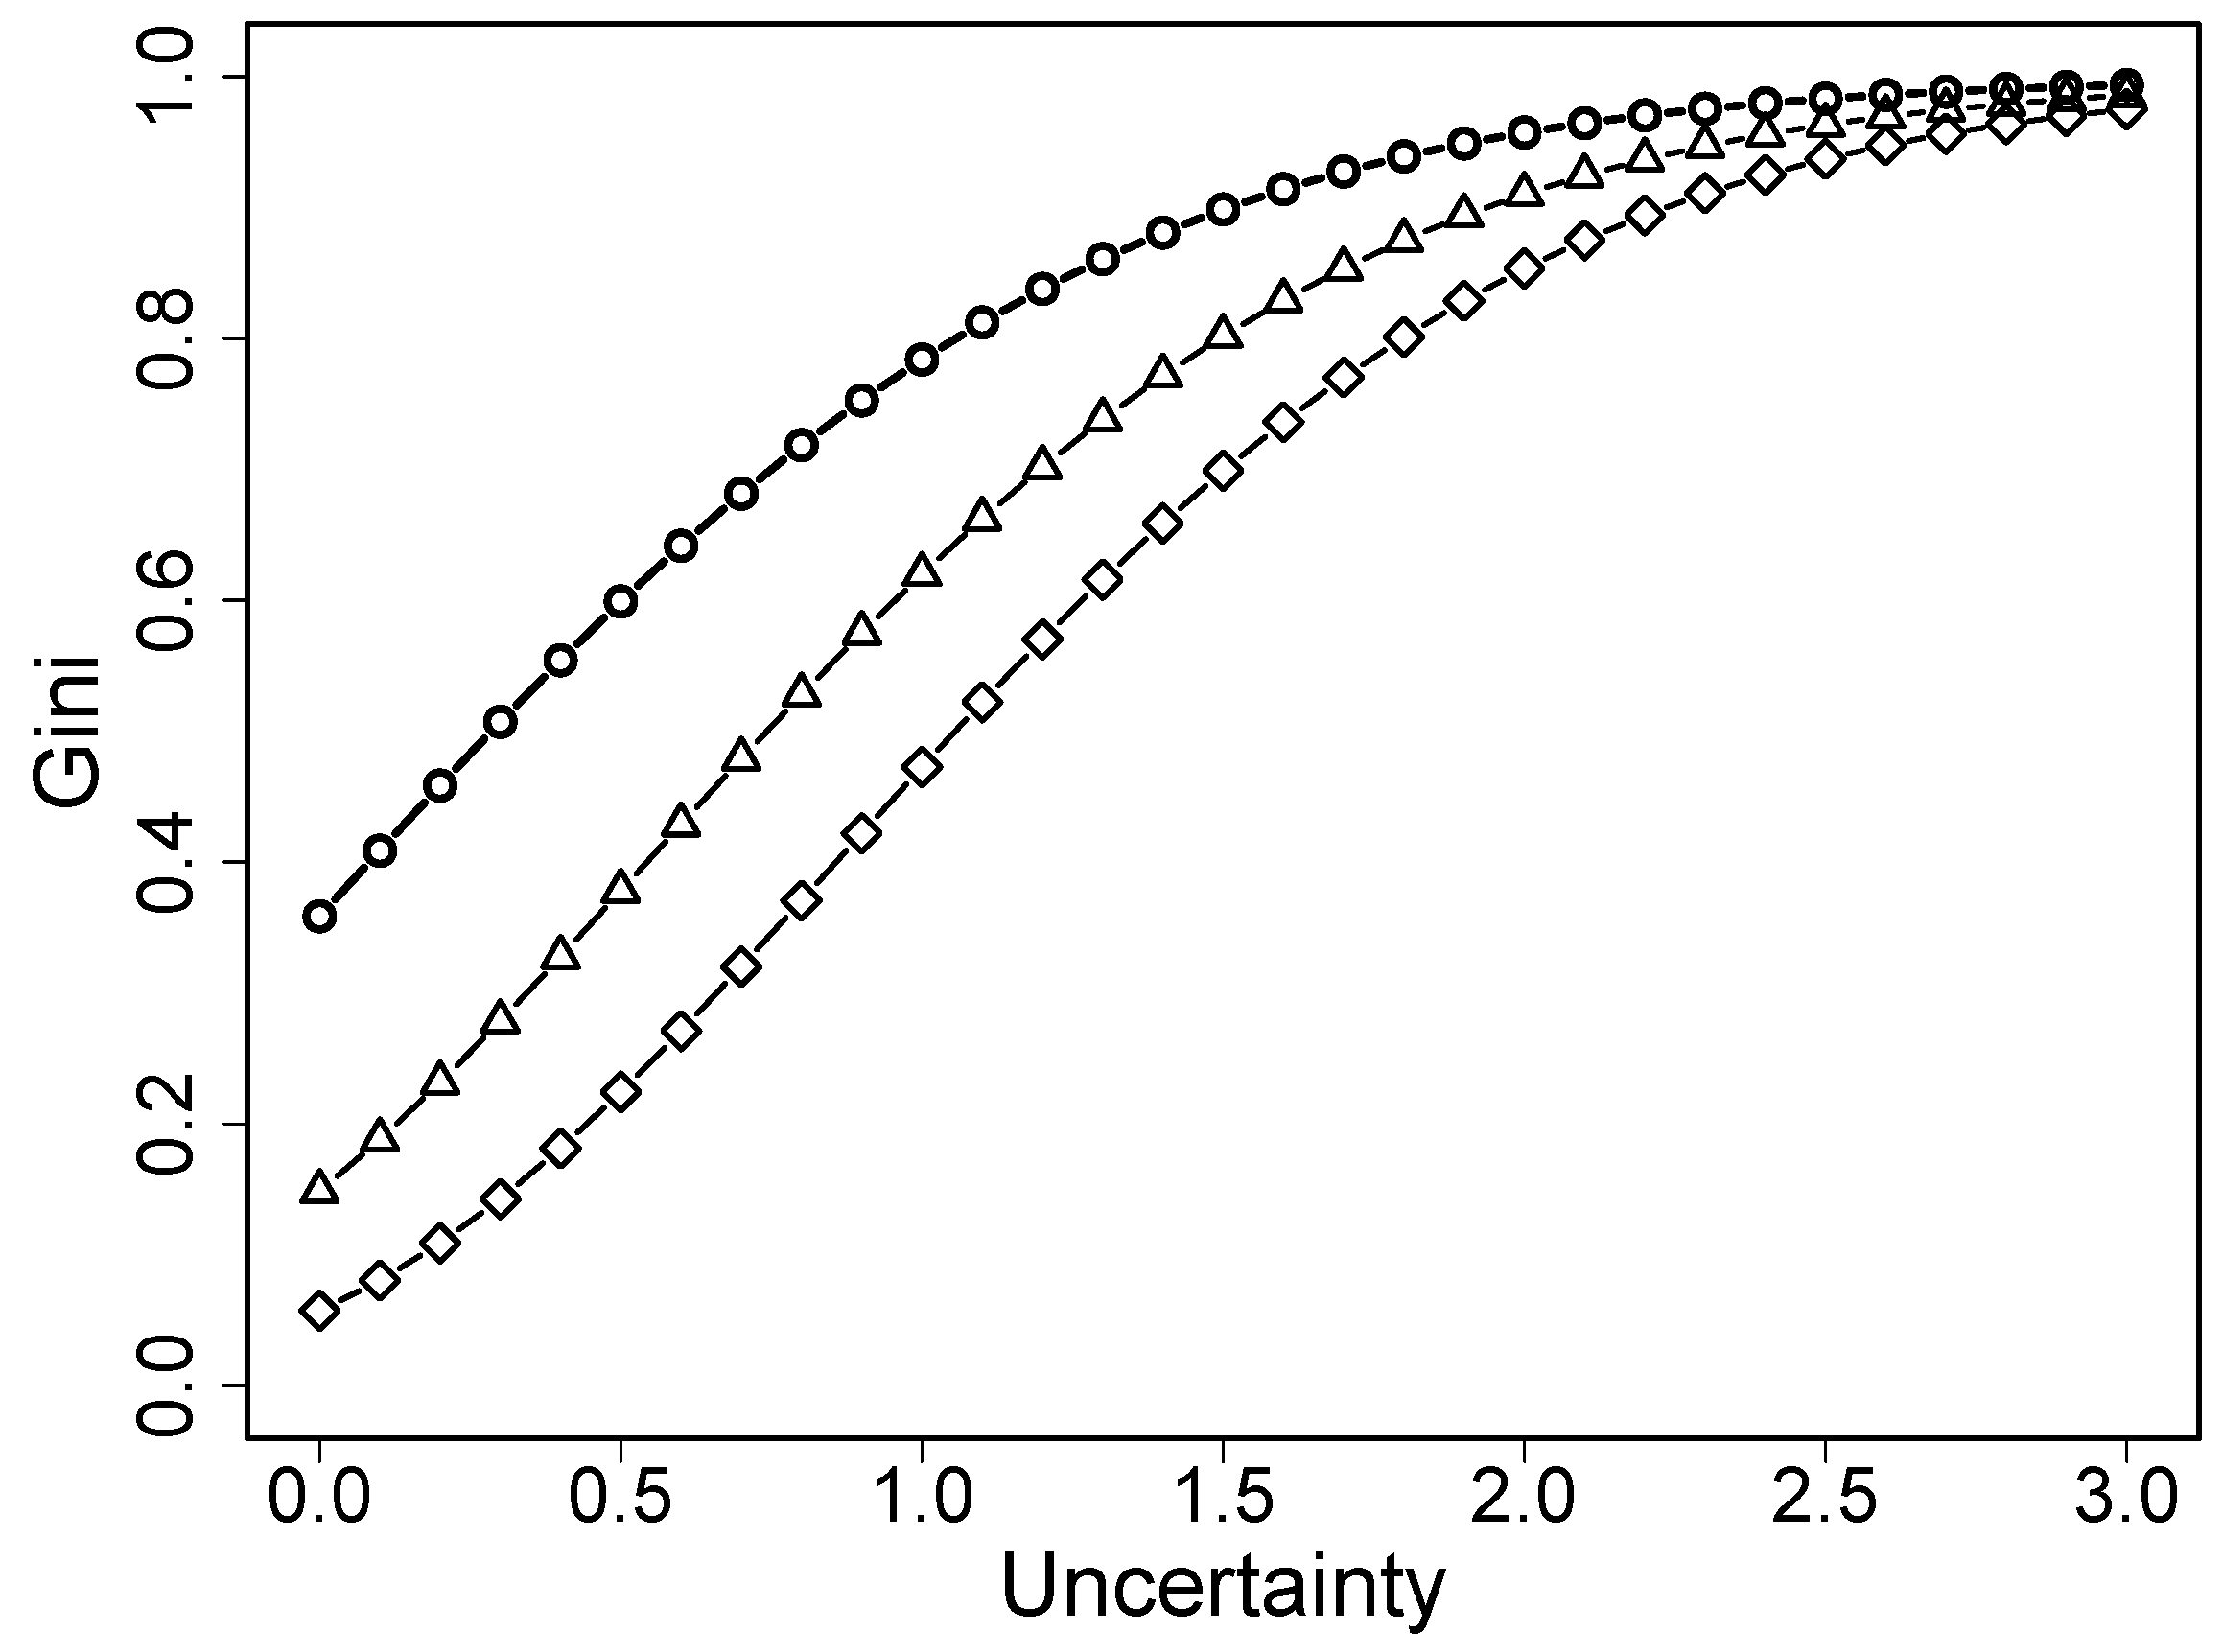
Although uncertainty is associated with dispersion such that strong uncertainty typically comes with stronger dispersion, the effect that is modeled by including the additional term aims at investigating closeness to the uniform distribution, which represents random response behavior. This is also seen by considering heterogeneity, which has also been used as a measure of uncertainty in the finite mixture modeling approach [16]. The measure that is used is the normalized Gini heterogeneity index,
which is zero if one of the response probabilities is 1 and takes a value of 1 if for all r.
Let the probabilities be a function of uncertainty for any location term . Then, the Gini index is a function of u, . Figure 2 shows the Gini index for several values of location. It is seen that it is a strictly increasing function, which holds for all location values that do not equal zero. This means that the additional term in the uncertainty rating scale model models heterogeneity as captured by the Gini coefficient, which, in rating scales, can be seen as the level of certainty (or uncertainty). As will be considered later, additional terms in other ordinal regression models aim at modeling different types of the behavior of respondents.
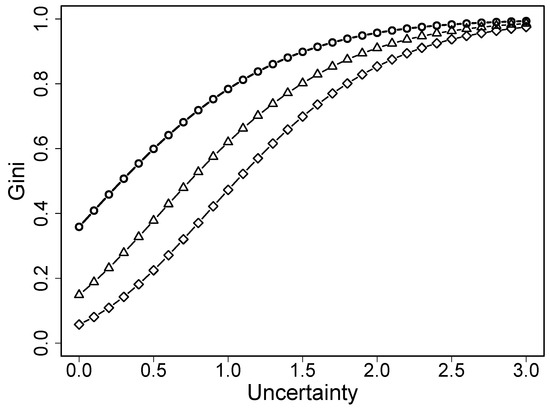
Figure 2.
Gini index as a function of uncertainty (circles: loc = 0, triangles; loc = 2, diamonds: loc = 4).
2.2. Illustrating Example
For illustration, we use data from the German Longitudinal Election Study (GLES), which is a long-term study of the German electoral process [17]. The data consist of 2036 observations and originate from a pre-election survey for the German federal election in 2017 and are concerned with political fears. In particular, the participants were asked the following: “How afraid are you due to the use of nuclear energy?”. The answers were measured on Likert scales from 1 (not afraid at all) to 7 (very afraid). The explanatory variables in the model are Abitur (high school leaving certificate, 1: Abitur/A levels; and 0: other), Age (age of the participant), EastWest (1: East Germany/former GDR; 0: West Germany/former FRG), Gender (1: female; 0: male), and Unemployment (1: currently unemployed; 0: other).
Table 1 shows the parameter estimates when the adjacent category model and the extended version are fitted by using R programs available at https://github.com/GerhardTutz/Uncertainty-Rating-Scale-Model (accessed on 21 May 2025). It is seen that with the exception of unemployment, all variables have an impact on uncertainty. Older people tend to have higher levels of fear and strong uncertainty. Females have higher levels of fear but show less uncertainty than men. Residents of the eastern part of Germany have less fear and stronger uncertainty than residents of the western countries. The log-likelihoods also indicate that the uncertainty component should not be omitted.

Table 1.
Model fits for nuclear fear data.
3. Comparison with Alternative Approaches
In the following, alternative versions of ordinal regression that aim at modeling specific response behavior are considered. First, cumulative-type models are considered and it is shown that extended versions do not model uncertainty. Then, mixture models are considered, which explicitly aim at modeling uncertainty.
3.1. Extended Cumulative Models
Models that are often used in ordinal regression are the so-called cumulative models, which have the form
where is a strictly monotone distribution function and are thresholds. The model can be derived as a coarser version from an underlying continuous response model [18]. The most widely used model is the proportional odds model, which is obtained when using the logistic distribution function .
An extension of the model that accounts for possible dispersion is the location shift model
Model (4) also contains two terms that specify the impact of covariates, the location term and the variance or scaling term . If is large, typically the probabilities for the middle categories become smaller, and the probabilities of extreme categories become larger. If , the total probability mass is concentrated in the extreme categories 1 and k. If is small, probabilities for the categories in the middle become larger. Figure 3 illustrates the effect for several values of location and dispersion (disp: ).
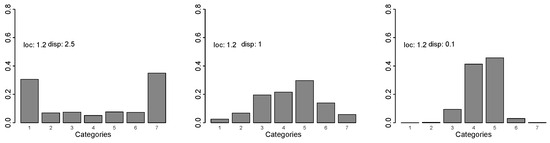
Figure 3.
Probabilities for location shift model with symmetric thresholds, location and dispersion .
The term models dispersion, which, in rating scales, means a tendency towards specific categories in the middle or extreme categories. It is connected to the extreme response style, which means a tendency towards extreme or middle categories, rather than to uncertainty. This can also be seen by looking at the Gini coefficient as a function of dispersion in the cumulative model. Figure 4 shows the Gini coefficient as a function of dispersion for location . It is seen that the function is not monotone. Heterogeneity is low for small values of dispersion, increases with increasing dispersion but then decreases again. It is not connected to heterogeneity in the sense that larger values of always mean higher heterogeneity, as is the case in the uncertainty rating scale model.
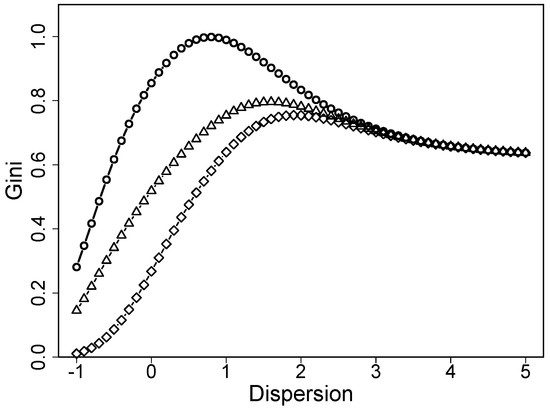
Figure 4.
The Gini index as a function of dispersion when the location shift model holds (circles: loc = 0, triangles; loc = 2, diamonds: loc = 4).
The location-scale model was introduced by McCullagh [18] and has been considered by Nair [19] and Hamada and Wu [20]. In the social sciences, the model is also known as the heterogeneous choice model or heteroscedastic logit model [21,22]. A Bayesian version was considered by Iannario et al. [23].
In the binary case , the location-scale model is identical to the uncertainty rating scale model. While the location-scale model is an extension of the cumulative model, the uncertainty model is an extended version of the adjacent category model. For , the models are also identical to the heterogeneous multinomial logit model.
3.2. Finite Mixture Models
The finite mixture model that has been propagated in recent years under the name CUB explicitly aims at including uncertainty and is therefore comparable to the uncertainty rating scale model. It has the form
where the first component is a shifted binomial distribution given by
It is a simple binomial distribution determined by the parameter but is shifted so that the support is instead of the usual support that includes zero. The component represents the preference for specific categories, which is captured by the parameter , for which
is assumed to hold. Thus, large values of indicate a tendency towards low-response categories. The second component refers to the uniform distribution over categories and represents an unspecific response. is considered as a measure of the uncertainty of responses, and larger values indicate an unspecific response arising from unspecified factors that generate the indecision present in human choices. The specification
means that small values of are associated with a random choice of response categories.
The effect of has similarities to the effect in the uncertainty rating scale model. More concretely, one obtains the following:
- If , one obtains and all probabilities have the same value .
- If , one obtains and the binomial model holds.
This means extremely small values of have the same effect as extremely large values in the uncertainty rating scale model. However, extremely large values in the CUB model mean that the basic binomial model holds and there is no uncertainty component. In the uncertainty rating scale model, extremely small values (as the opposite to extremely large values) mean that specific categories are preferred. While the CUB models fits a model between the binomial distribution (the basic model) and a uniform distribution, the uncertainty rating scale model fits a model between the strong preference of single categories and the uniform distribution. Thus, it allows deviations from the basic adjacent category model in two directions, while the CUB model only allows an additional uniform component but not a deviation from the basic binomial model that favors specific categories more strongly.
Table 2 shows the resulting estimates for the fear data using the package CUB; see Iannario et al. [24], Simone [25], Iannario et al. [26]. It is seen that the uncertainty effects are significant for gender and EastWest, with females having less uncertainty and residents in the eastern part having stronger uncertainty than residents in the Western part, which is in accordance with the fitting of the uncertainty rating scale. Somewhat surprisingly, age shows no uncertainty effect in the CUB model, while it has the strongest effect when fitting the uncertainty rating scale model. Overall, the fit of the rating scale model (AIC 7546.665) is distinctly better than that for the CUB model (AIC 7570.138) and even slightly worse than for the simple adjacent category model (AIC 7565.901).
Table 2.
Fits of CUB model for nuclear fear data.
4. Further Applications
The package CUB [24] contains the data set relgoods, which provides results of a survey collected in the metropolitan area of Naples, Italy. Each respondent was asked to mark a sign on a 110 mm horizontal line according to his/her feeling of happiness (the left endpoint corresponding to completely unhappy and rightmost endpoint corresponding to extremely happy). The response was categorized into 10 categories. We consider the subset of complete observations and the four covariates, Age, Gender (1: male, 0: female), the educational degree (Education) with five levels, Walk, a factor with levels, 1 = usually walking alone and 0 = usually walking in company, and Neighbours indicating the quality of the relationships with neighbors.
Table 3 shows the parameter estimates when the adjacent category model and the extended version are fitted. It is seen that with the exception of age, all variables have an effect on location. In particular, age and walk also have a distinct impact on uncertainty.
Table 3.
Model fits for happiness data.
Table 4 shows the resulting estimates when using the package CUB [24]. It is seen that uncertainty effects are found for all variables with the exception of gender. The model shows more significant uncertainty effects than the uncertainty rating scale model, although the latter also shows large z-values for all variables with the exception of gender. As far as the fit is concerned, the AIC for the uncertainty rating scale model is the smallest, and the AIC of the CUB model is even worse than the AIC of the simple adjacent category model.
Table 4.
Fits of CUB model for happiness data.
When fitting the models to the nuclear fear data, the number of significant uncertainty effects was the same for CUB and the uncertainty rating scale model. When using the happiness data, it turned out that CUB shows more uncertainty effects than the uncertainty rating scale model. To further evaluate if this holds more generally, we fitted the models to the GLES data but with different responses. For the response “How afraid are you due to the refugee crises?”, we found that gender showed an uncertainty effect (z-value 2.1631), but none of the variables in the CUB model had a z-value larger than 1.02. Thus, the assumption that CUB models have more uncertainty effects does not hold in general. In terms of model fit that takes the number of parameters into account, the uncertainty rating scale model did better than CUB. The AIC for the former was 7712.807, and for the latter, 7742.091.
A further application is devoted to the investigation of attitudes toward gender equality using data from the European Values Study 2017 [27]; see also Mauerer and Tutz [28]. The response is to the statement “Family life suffers when woman has full-time job” with four categories. Higher-response categories indicate opposing gender equality and lower ones favor gender equality. The explanatory variables are age, gender (1: male, 0: female), monthly income, and town size (five categories). The sample size is 1267. The data differ from the previous ones with respect to the number of response categories. While the number of response categories was rather large (seven and ten), in the attitude study, the number was four.
Table 5 shows the parameter estimates when the adjacent category model and the extended version are fitted. It is seen that the uncertainty effect of gender should not be neglected. Table 6 shows the corresponding fits if the CUB model is used to investigate uncertainty. It is seen that when using the CUB model uncertainty effects can be neglected. Uncertainty plays a very minor role when fitting the CUB model. That becomes obvious when fitting a model without covariates in the uncertainty component, which yields an estimated probability for the uncertainty component of 0.03 (0.97 for the feeling component). Thus, while uncertainty is found when using the uncertainty rating scale model it is not found when using CUB type models.
Table 5.
Model fits for attitude data.
Table 6.
Fits of CUB model for attitude data.
We also fitted further responses from the attitude questionnaire. When considering the response “Men’s job is to earn money, woman’s job is to look after home”, the effects that were found were very similar. While the uncertainty component is negligible when using the CUB model, there are significant effects when using the rating scale model. For the question “Child suffers with working mother”, uncertainty effects are not significant for both models, but z-values are larger when using the rating scale model than when using CUB models.
5. Concluding Remarks
An alternative model for identifying uncertainty associated with explanatory variables has been proposed and compared to other methods. It is important to note that larger datasets are typically required to detect significant uncertainty effects. Uncertainty effects are often more challenging to identify compared to location effects, a characteristic that uncertainty shares with dispersion.
The new model has been specifically compared to the CUB model, which also aims to model uncertainty. The rating scale model and the CUB model represent quite different approaches. While mixture models assume that a fraction of respondents answer randomly and link explanatory variables to mixture probabilities, the uncertainty rating scale model assumes that responses are determined by two covariate effects: location and uncertainty.
Contrary to expectations, it was found that the two modeling approaches do not always identify the same variables as having uncertainty effects. While some variables showed uncertainty effects in both approaches in certain datasets, there were notable discrepancies in other applications. The variables contributing to uncertainty differed.
There appears to be no general rule regarding the number of uncertainty variables identified by the two approaches. However, it is noteworthy that in cases with few response categories (e.g., ), the uncertainty rating scale model identified distinctly more uncertainty variables than the CUB model. This trend was not observed in applications with a large number of response categories.
In general, CUB models may be less flexible with respect to the location component. They rely on the binomial distribution as the underlying model for ordered categories, whereas the uncertainty rating scale model is based on the adjacent category model. The latter includes more parameters and therefore allows for more flexible distributions. This distinction may explain why the uncertainty rating scale model often achieves better fits in terms of the AIC, despite its higher number of parameters.
Furthermore, CUB models can only represent distributions that lie between the basic binomial model and a uniform distribution. In contrast, the uncertainty rating scale model permits deviations from the adjacent category model in both directions—toward a uniform distribution or toward stronger preferences for specific response categories. In this sense, it functions more as an “uncertainty–certainty” model than a purely uncertainty-focused one, although we prefer the simpler term uncertainty model.
The latter property can guide the selection of a model. For instance, if the goal is to model situations where individuals may respond carelessly, the CUB model suffices. If the aim is to accommodate stronger preferences among individuals for specific categories, the uncertainty model might be more suitable. Nonetheless, other relevant aspects should also be considered when choosing a model. It could be a subject of further research to explore in which scenarios each model is more reliable and when different results can be expected regarding the impact of variables on uncertainty.
It would also be intriguing to investigate whether the uncertainty model can be expanded to incorporate person-specific uncertainty rather than solely uncertainty determined by covariates. Incorporating random effects as person-specific effects is straightforward in repeated measurements but more challenging in cross-sectional data. One reviewer has highlighted the use of random effect models for cross-sectional data, primarily in linear regression contexts, as seen in references such as Hildreth [29] and Demidenko and Mandel [30]. These could serve as a starting point for extending uncertainty models to include individual effects.
Funding
This research received no external funding.
Institutional Review Board Statement
Not applicable.
Informed Consent Statement
Not applicable.
Data Availability Statement
The raw data supporting the conclusions of this article will be made available by the author on request.
Conflicts of Interest
The author declares no conflicts of interest.
Appendix A. Estimation
Let the data be given by , where denotes the vector of covariates and a vector-valued observation of the response variable. Based on the original response in k categories and the probabilities , the vector-valued representation of the response is given by
where is the indicator function ( if a is true, otherwise). Thus, each observation is represented by a vector of zeros and ones. For example, yields .
Given , one assumes a multinomial distribution, , where is the vector of probabilities of the i-th observation.
The log-likelihood has components
For the adjacent category model, one obtains
The score function with denoting the whole vector of parameters has components
where is the indicator function.
For the uncertainty rating scale model, one obtains
and the corresponding score function has components
References
- Likert, R. A technique for the measurement of attitudes. Arch. Psychol. 1932, 140, 44–53. [Google Scholar]
- Agresti, A. Analysis of Ordinal Categorical Data; John Wiley & Sons: Hoboken, NJ, USA, 2010. [Google Scholar]
- Tutz, G. Ordinal regression: A review and a taxonomy of models. Wiley Interdiscip. Rev. Comput. Stat. 2022, 14, e1545. [Google Scholar] [CrossRef]
- Meade, A.W.; Craig, S.B. Identifying careless responses in survey data. Psychol. Methods 2012, 17, 437. [Google Scholar] [CrossRef]
- Piccolo, D. On the moments of a mixture of uniform and shifted binomial random variables. Quad. Stat. 2003, 5, 85–104. [Google Scholar]
- D’Elia, A.; Piccolo, D. A mixture model for preference data analysis. Comput. Stat. Data Anal. 2005, 49, 917–934. [Google Scholar] [CrossRef]
- Iannario, M.; Piccolo, D. Statistical modelling of subjective survival probabilities. Genus 2010, 66, 17–42. [Google Scholar]
- Iannario, M. Hierarchical CUB models for ordinal variables. Commun. -Stat.-Theory Methods 2012, 41, 3110–3125. [Google Scholar] [CrossRef]
- Iannario, M. Modelling shelter choices in a class of mixture models for ordinal responses. Stat. Methods Appl. 2012, 21, 1–22. [Google Scholar] [CrossRef]
- Manisera, M.; Zuccolotto, P. Modeling rating data with nonlinear cub models. Comput. Stat. Data Anal. 2014, 78, 100–118. [Google Scholar] [CrossRef]
- Piccolo, D. Inferential issues on cube models with covariates. Commun.-Stat.-Theory Methods 2015, 44, 5023–5036. [Google Scholar] [CrossRef]
- Simone, R.; Piccolo, D.; Iannario, M. Cumulative and CUB models for rating data: A comparative analysis. Int. Stat. Rev. 2018, 87, 207–236. [Google Scholar] [CrossRef]
- Iannario, M.; Manisera, M.; Piccolo, D.; Zuccolotto, P. Ordinal data models for no-opinion responses in attitude survey. Sociol. Methods Res. 2020, 49, 250–276. [Google Scholar] [CrossRef]
- Piccolo, D.; Simone, R. The class of CUB models: Statistical foundations, inferential issues and empirical evidence (with discussions and a rejoinder). Stat. Methods Appl. 2019, 28, 389–493. [Google Scholar] [CrossRef]
- Tutz, G. Regression for Categorical Data; Cambridge University Press: Cambridge, UK, 2012. [Google Scholar]
- Iannario, M.; Piccolo, D. Cub models: Statistical methods and empirical evidence. In Modern Analysis of Customer Surveys: With Applications Using R; John Wiley & Sons: Hoboken, NJ, USA, 2011; pp. 231–258. [Google Scholar]
- Rattinger, H.; Roßteutscher, S.; Schmitt-Beck, R.; Weßels, B.; Wolf, C. Pre-Election Cross Section (GLES 2013); ZA5700 Data File Version 2.0.0; GESIS Data Archive: Cologne, Germany, 2014. [Google Scholar]
- McCullagh, P. Regression model for ordinal data (with discussion). J. R. Stat. Soc. B 1980, 42, 109–127. [Google Scholar] [CrossRef]
- Nair, V.N. Chi-squared-type tests for ordered alternatives in contingency tables. J. Am. Stat. Assoc. 1987, 82, 283–291. [Google Scholar] [CrossRef]
- Hamada, M.; Wu, C.F.J. A critical look at accumulation analysis and related methods. Technometrics 1990, 32, 119–130. [Google Scholar] [CrossRef]
- Alvarez, R.M.; Brehm, J. American ambivalence towards abortion policy: Development of a heteroskedastic probit model of competing values. Am. J. Political Sci. 1995, 39, 1055–1082. [Google Scholar] [CrossRef]
- Williams, R. Using heterogeneous choice models to compare logit and probit coefficients across groups. Sociol. Methods Res. 2009, 37, 531–559. [Google Scholar] [CrossRef]
- Iannario, M.; Kateri, M.; Tarantola, C. Modelling scale effects in rating data: A bayesian approach. Qual. Quant. 2024, 58, 4053–4071. [Google Scholar] [CrossRef]
- Iannario, M.; Piccolo, D.; Simone, R. CUB: A Class of Mixture Models for Ordinal Data. R package Version 1.1.4. 2020. Available online: http://cran.r-project.org/package=cub (accessed on 21 May 2025).
- Simone, R. FastCUB: Fast EM and Best-Subset Selection for CUB Models for Rating Data, R Package Version 0.0.2. 2020. Available online: https://cran.r-project.org/package=fastcub (accessed on 21 May 2025).
- Iannario, M.; Piccolo, D.; Simone, R. CUB: A Class of Mixture Models for Ordinal Data. R Package Version 1.1.5. 2024. Available online: https://cran.r-project.org/web/packages/CUB/vignettes/CUBvignette-knitr.pdf (accessed on 21 May 2025).
- EVS. European Values Study 2017: Integrated Dataset (EVS 2017); ZA7500 Data file Version 5.0.0; GESIS: Cologne, Germany, 2022. [Google Scholar] [CrossRef]
- Mauerer, I.; Tutz, G. An Ordinal Item Response Model for Understanding Attitudes. SSRN 2024. [Google Scholar] [CrossRef]
- Hildreth, C.; Houck, J.P. Some estimators for a linear model with random coefficients. J. Am. Stat. Assoc. 1968, 63, 584–595. [Google Scholar] [CrossRef]
- Demidenko, E.; Mandel, I. Yield analysis and mixed model. Stress 2005, 1, 1636–1643. [Google Scholar]


Disclaimer/Publisher’s Note: The statements, opinions and data contained in all publications are solely those of the individual author(s) and contributor(s) and not of MDPI and/or the editor(s). MDPI and/or the editor(s) disclaim responsibility for any injury to people or property resulting from any ideas, methods, instructions or products referred to in the content. |
© 2025 by the author. Licensee MDPI, Basel, Switzerland. This article is an open access article distributed under the terms and conditions of the Creative Commons Attribution (CC BY) license (https://creativecommons.org/licenses/by/4.0/).