Abstract
In recent years, the gamma-G family has gained significant popularity for generating new distributions by incorporating an additional shape parameter into the baseline model. This article compiles and documents the existing gamma-G distributions and demonstrates their application to real COVID-19 data.
1. Introduction
Classical distributions are widely used across various fields, but their extended forms are often necessary for more flexible modeling of real-world data. The literature has witnessed a surge in generalized distributions by incorporating additional parameters in baseline ones. Notable generators include Marshall–Olkin-G [1], Beta-G [2], and gamma odd Burr X-G [3]. This has resulted in numerous new distributions, some of which, like the exponentiated Weibull [4], beta flexible Weibull [5], and Kumaraswamy generalized Lomax [6], are now well-established.
The gamma-G family [7,8] has been extensively studied by investigating its mathematical properties for any baseline distribution [9,10]. This work compiles existing distributions in this family, citing their names and authors (see references for details), aiming to inspire further research into unexplored gamma-G distributions.
The gamma-G family of distributions occupies a significant place in the statistical literature due to its flexibility in modeling diverse datasets. The emergence of more than forty distributions highlights its importance. In addition, their densities can be expressed as linear combinations of exponentiated-G densities, making their main properties easy to obtain [9,10,11,12]. Thus, this combination of flexibility and analytical ease makes the gamma-G family an important tool for theoretical and applied statistical research.
2. The Gamma-G Family
Ref. [7] defined the gamma-G (“ZB-G”) generator, whose probability density function (PDF) and cumulative distribution function (CDF) are
and
respectively, where is any baseline CDF, , , is the lower incomplete gamma function, is the gamma function, and is a shape parameter. For , Equation (1) reduces to the baseline density. The hazard rate function (HRF) is derived from Equations (1) and (2) as .
The ZB-modified Weibull (ZB-MW) [13], an example of the ZB-G family, uses the CDF , where is a scale parameter and and are shape parameters. Consequently, its PDF and HRF (for ) are
and
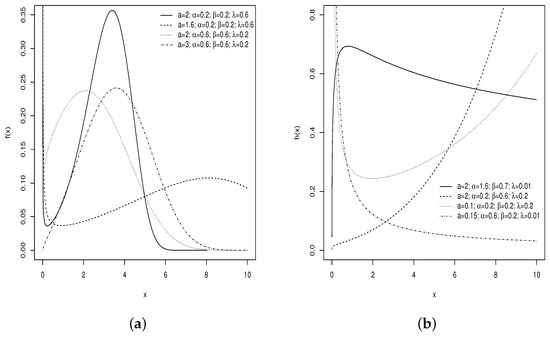
The four-parameter ZB-MW model includes, as special cases, the gamma Weibull, gamma exponential, gamma modified exponential, gamma modified Rayleigh, exponential, Rayleigh, and Weibull distributions. Figure 1a displays potential density shapes, suitable for right-skewed data. Figure 1b reports the HRF with four shapes: increasing, decreasing, bathtub, and unimodal.

Figure 1.
Plots of the PDF (a) and HRF (b) of the ZB-MW distribution.
3. The Dual Gamma Generalized Family
Similarly, ref. [8] introduced the Ristić–Balakrishnan-G (“RB-G”) family, with PDF defined as (for )
The RB-Burr XII (RB-BXII) distribution [14] comes from the BXII CDF , where is a scale and are shape parameters, whose PDF and HRF (for ) are
and
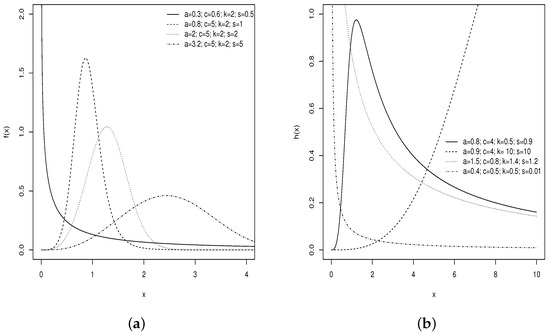
Figure 2a,b depict the PDF and HRF of the RB-BXII model for some parameters, which show various forms. The ZB-G and RB-G families include the baseline parameters plus an extra shape parameter. Table 1 lists thirty-six members of these classes.

Figure 2.
Plots of the PDF (a) and HRF (b) of the RB-BXII distribution.

Table 1.
Distributions in the gamma-G family.
The properties of both families are derived from the exponentiated-G class, as detailed by [11] for ZB-G and [12] for RB-G. Thus, the main properties, such as moments and generating function, are derived from the exponentiated baseline distribution. The random number generation method is detailed in [9] in the form (for )
where is the inverse function of and is the inverse CDF of any baseline distribution. The results in Section 4 are obtained in this way.
4. Simulation
A simulation study is conducted to assess the consistency of the estimates in the models exemplified for each family (ZB-MW and RB-BXII). Random samples of sizes , 100, 200, and 500 are generated in three different scenarios. One thousand Monte Carlo replicates are performed, and the average estimates (AEs), biases, and mean squared errors (MSEs) are calculated. The log-likelihood functions for and are optimized using the Nelder–Mead numerical method within the Optim function of the R statistical software 4.4.1, with the actual values of the parameters as initial inputs.
In order to detail the process of the results obtained in Table 2 and Table 3, the case of the ZB-MW distribution follows, and the RB-BXII case is similar. So, the quantile function (qf) of the ZB-MW follows from (3) as (for )
where the function is the log product function. The R script below generates random variates from the ZB-MW model.

Table 2.
Simulations from the ZB-MW distribution.

Table 3.
Simulations from the RB-BXII distribution.
require(gsl) # Load the gsl package
RZBMW <- function(n, \alpha, \beta, \lambda, a) {
u <- runif(n, 0, 1) # Generate n random uniform values between 0 and 1
A1 <- qgamma(1 - u, a, 1) # Compute the quantile of the gamma distribution
A2 <- (lambda / beta) ∗ ((A1 / alpha)^(1 / beta)) qf from MW distribution
Q1 <- (beta / lambda) ∗ lambert_W0(A2) qf from ZB-MW distribution
return(Q1) # Return the result Q1
Next, an R function is developed that performs Monte Carlo simulations, optimizing the log-likelihood function (by taking the log of the corresponding PDF) using the Nelder–Mead method and calculating the AEs, biases, and MSEs for the parameters. The full script for this section can be found at this link: https://github.com/alexaaf31/gamma_G-family-/blob/main/Gamma-G_simulations.R (accessed on 1 January 2025).
Table 2 shows that the ZB-MW estimators are consistent. As the sample size grows, the AEs converge to true values, and biases and MSEs decrease. Variations in biases and MSEs suggest that parameter choice influences accuracy.
As expected for the RB-G family, the RB-BXII distribution also provides consistent estimators. As the sample size increases, the AEs get closer to the true parameter values, and the biases and MSEs tend towards zero, as shown in Table 3.
5. Application
The dataset reflects the lifetime (in days) of 103 patients diagnosed with COVID-19. It was compiled by a collaborative team of researchers and doctors from Qatar University in Doha, Qatar, and Dhaka Medical College Hospital in Bangladesh. Data collection took place between 12 April and 31 August 2020, at Dhaka Medical College Hospital, with the approval of the hospital’s Ethics Committee. Lifetimes were measured from the date of admission to the hospital until the time of discharge or death of the patient.
The dataset, available at https://www.kaggle.com/tawsifurrahman/covid19-complete-blood-count-clinical-database (accessed on 1 September 2021), is as follows: 61, 77, 17, 72, 71, 9, 190, 69, 98, 7, 36, 128, 128, 157, 128, 36, 127, 5, 126, 34, 122, 121, 213, 152, 152, 39, 39, 1, 243, 91, 91, 60, 30, 60, 23, 1, 151, 31, 115, 61, 183, 122, 26, 30, 46, 108, 136, 136, 8, 23, 23, 112, 6, 6, 13, 83, 13, 7, 53, 23, 12, 6, 36, 65, 95, 42, 16, 13, 14, 131, 41, 48, 137, 75, 9, 14, 14, 8, 14, 14, 7, 7, 7, 21, 14, 9, 14, 14, 18, 67, 14, 14, 14, 14, 14, 19, 13, 20, 13, 45, 14, 14, 14.
Table 4 provides statistical measures for the data, which have positive skewness and kurtosis. The mean is higher than the median and close to the standard deviation (SD), while the amplitude and variance are comparatively high.

Table 4.
Descriptive statistics.
The BXII, MW, and log-logistic (LL) distributions serve as baselines in the ZB-G and RB-G families for comparative analysis. The best models are selected from the Cramér–von Mises (), Anderson–Darling , Akaike information criterion (AIC), consistent AIC (CAIC), Bayesian IC (BIC), and Hannan–Quinn IC (HQIC). Lower values indicate a better fit. Maximum likelihood estimates (MLEs) and goodness-of-fit statistics are calculated using the AdequacyModel script in R.
Table 5 shows the MLEs and their standard errors (SEs) in parentheses. Notably, the ZB-MW, RB-MW, MW, RB-LL, and BXII distributions exhibit higher SE values. In contrast, the ZB-BXII, RB-BXII, RB-LL, and LL distributions provide accurate estimates.

Table 5.
MLEs and their SEs for some fitted models to COVID-19 data.
Table 6 shows the RB-LL distribution with the lowest AIC, CAIC, BIC, and HQIC values, whereas the ZB-BXII distribution has the lowest and statistics. As these models are not nested, the generalized likelihood ratio (LR) test [44] can be applied from

Table 6.
Goodness-of-fit statistics for the fitted models to COVID-19 data.
Equation (4) converges to a standard normal distribution under the null hypothesis of model equivalence, which is not rejected if . At significance level , the null hypothesis is rejected in favor of over if (or ). For the ZB-GBXII () and RB-GLL () models, the test statistic is . Since , the null hypothesis is rejected at the level of 0.05 in favor of the RB-GLL distribution.
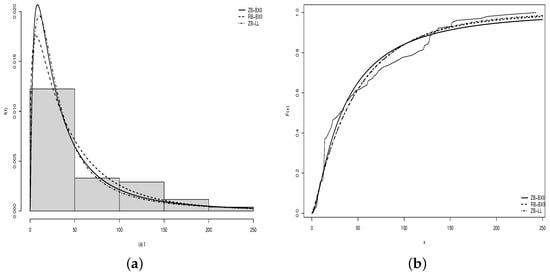
Figure 3a displays estimated densities, and Figure 3b shows estimated and empirical cumulative functions for the top models. The ZB-BXII, RB-BXII, RB-LL, and LL distributions fit well, but the RB-LL distribution fits the data best. Thus, from the RB-LL distribution, obtained by substituting the MLEs of the parameters into its PDF, can accurately estimate various quantities of interest. For example, consider X as a random variable representing the lifetime of individuals with COVID-19. The probability of X falling within an arbitrary interval can be estimated by , while the probability of X being less than a certain value c is given by . Furthermore, the mean can be estimated by , and so on.

Figure 3.
(a) Estimated densities of the ZB-BXII, RB-BXII, and RB-LL; (b) estimated and empirical cumulative functions of these models.
All previous results are obtained using the AdequacyModel package in R with the Broyden–Fletcher–Goldfarb–Shanno (BFGS) numerical method. The R script is available at https://github.com/alexaaf31/gamma_G-family-/blob/main/Gamma-G%20Application.R (accessed on 1 January 2025).
6. Conclusions
This article briefly surveyed the gamma-G families pioneered by [7,8]. It provided some of their main functions, a few special cases, and an application for COVID-19 data. A list of published articles on the gamma-G family was also presented. It was noted that many distributions remain to be generated compared to other families, such as Beta-G [2] and Marshall–Olkin-G [1].
Author Contributions
Conceptualization, A.A.F. and G.M.C.; methodology, A.A.F. and G.M.C.; software, A.A.F. and G.M.C.; validation, A.A.F. and G.M.C.; formal analysis, A.A.F. and G.M.C.; investigation, A.A.F. and G.M.C.; resources, A.A.F. and G.M.C.; data curation, A.A.F. and G.M.C.; writing—original draft preparation, G.M.C.; writing—review and editing, A.A.F. and G.M.C. All authors have read and agreed to the published version of the manuscript.
Funding
This research received no external funding.
Institutional Review Board Statement
Not applicable.
Informed Consent Statement
Not applicable.
Data Availability Statement
Stated in the text.
Acknowledgments
We thank the editor and reviewers for their valuable feedback. This work was supported by the Fundação de Amparo à Ciência e Tecnologia do Estado de Pernambuco (FACEPE) [IBPG-1448-1.02/20].
Conflicts of Interest
The authors declare no conflicts of interest.
References
- Marshall, A.W.; Olkin, I. A new method for adding a parameter to a family of distributions with application to the exponential and Weibull families. Biometrika 1997, 84, 641–652. [Google Scholar] [CrossRef]
- Eugene, N.; Lee, C.; Famoye, F. Beta-normal distribution and its applications. Commun. Stat.-Theory Methods 2002, 31, 497–512. [Google Scholar] [CrossRef]
- Tlhaloganyang, B.P.; Sengweni, W.; Oluyede, B.O. The Gamma Odd Burr X-G Family of Distributions with Applications. Pak. J. Stat. Oper. Res. 2022, 18, 721–746. [Google Scholar] [CrossRef]
- Mudholkar, G.; Srivastava, D. Exponentiated Weibull family for analyzing bathtub failure-rate data. IEEE Trans. Reliab. 1993, 42, 299–302. [Google Scholar] [CrossRef]
- El-Desouky, B.S.; Mustafa, A.; Al-Garash, S. The beta flexible Weibull distribution. arXiv 2017, arXiv:1703.05757. [Google Scholar]
- Shams, T.M. The Kumaraswamy-generalized Lomax distribution. Middle-East J. Sci. Res. 2013, 17, 641–646. [Google Scholar]
- Zografos, K.; Balakrishnan, N. On families of beta- and generalized gamma-generated distributions and associated inference. Stat. Methodol. 2009, 6, 344–362. [Google Scholar] [CrossRef]
- Ristić, M.M.; Balakrishnan, N. The gamma-exponentiated exponential distribution. J. Stat. Comput. Simul. 2012, 82, 1191–1206. [Google Scholar] [CrossRef]
- Nadarajah, S.; Cordeiro, G.M.; Ortega, E.M.M. The Zografos–Balakrishnan-G family of distributions: Mathematical properties and applications. Commun. Stat.-Theory Methods 2015, 44, 186–215. [Google Scholar] [CrossRef]
- Bourguignon, M.; Cordeiro, G.M. New results on the Ristić-Balakrishnan family of distributions. Commun. Stat.-Theory Methods 2016, 45, 6969–6988. [Google Scholar] [CrossRef]
- Castellares, F.; Lemonte, A.J. A new generalized Weibull distribution generated by gamma random variables. J. Egypt. Math. Soc. 2015, 23, 382–390. [Google Scholar] [CrossRef]
- Castellares, F.; Lemonte, A.J. On the gamma dual Weibull model. Am. J. Math. Manag. Sci. 2016, 35, 124–132. [Google Scholar] [CrossRef]
- Cordeiro, G.M.; Aristizábal, W.D.; Suárez, D.M.; Lozano, S. The Gamma Modified Weibull Distribution. Chil. J. Stat. 2015, 6, 37–48. [Google Scholar]
- Guerra, R.R.; Peña-Ramírez, F.A.; Cordeiro, G.M. The gamma Burr XII distributions: Theory and applications. J. Data Sci. 2017, 15, 467–494. [Google Scholar] [CrossRef]
- Pinho, G.B.; Cordeiro, G.M.; Nobre, J.S. The Gamma-exponentiated Weibull distribution. J. Stat. Theory Appl. 2012, 11, 379–395. [Google Scholar]
- Alzaatreh, A.; Famoye, F.; Lee, C. Gamma-Pareto distribution and its applications. J. Mod. Appl. Stat. Methods 2012, 11, 78–94. [Google Scholar] [CrossRef]
- Torabi, H.; Montazeri Hedesh, N. The gamma-uniform distribution and its applications. Kybernetika 2012, 48, 16–30. [Google Scholar]
- Silva, R.V.; Andrade, T.A.N.; Maciel, D.B.M.; Campos, R.P.S.; Cordeiro, G.M. A New Lifetime Model: The Gamma Extended Fréchet Distribution. J. Stat. Theory Appl. 2013, 12, 39–54. [Google Scholar] [CrossRef]
- Alzaatreh, A.; Knight, K. On the gamma-half normal distribution and its applications. J. Mod. Appl. Stat. Methods 2013, 12, 103–119. [Google Scholar] [CrossRef]
- Ramos, M.W.A.; Cordeiro, G.M.; Marinho, P.R.D.; Dias, C.R.B.; Hamedani, G. The Zografos-Balakrishnan Log-Logistic Distribution: Properties and Applications. J. Stat. Theory Appl. 2013, 12, 225–244. [Google Scholar] [CrossRef]
- Cordeiro, G.M.; Ortega, E.M.M.; Popović, B.V. The gamma-linear failure rate distribution: Theory and applications. J. Stat. Comput. Simul. 2014, 84, 2408–2426. [Google Scholar] [CrossRef]
- Oluyede, B.O.; Huang, S.; Pararai, M. A New Class of Generalized Dagum Distribution with Applications to Income and Lifetime Data. J. Stat. Econom. Methods 2014, 3, 125–151. [Google Scholar]
- Rodrigues, J.A.; Silva, A.P.C.M. The Gamma-Dagum distribution: Definition, properties and application. Rev. Eletrônica Matemática Estatística Foco 2015, 3, 1–7. [Google Scholar]
- Alzaatreh, A.; Famoye, F.; Lee, C. The gamma-normal distribution: Properties and applications. Comput. Stat. Data Anal. 2014, 69, 67–80. [Google Scholar] [CrossRef]
- Alzaatreh, A.; Mansoor, M.; Tahir, M.H.; Zubair, M.; Ghazali, S.A. The gamma half-Cauchy distribution: Properties and applications. Hacet. J. Math. Stat. 2015, 45, 1143–1159. [Google Scholar] [CrossRef]
- Pogány, T.K.; Saboor, A. The Gamma exponentiated exponential-Weibull distribution. Filomat 2016, 30, 3159–3170. [Google Scholar] [CrossRef]
- Khaleel, M.A.; Ibrahim, N.A.; Shitan, M.; Merovci, F. Some properties of gamma Burr type X distribution with application. In AIP Conference Proceedings; AIP Publishing: College Park, MD, USA, 2016; Volume 1739, p. 020087. [Google Scholar] [CrossRef]
- Iriarte, Y.A.; Astorga, J.M.; Bolfarine, H.; Gómez, H.W. Gamma-Maxwell distribution. Commun. Stat.-Theory Methods 2017, 46, 4264–4274. [Google Scholar] [CrossRef]
- Foya, S.; Oluyede, B.O.; Fagbamigbe, A.F.; Makubate, B. The gamma log-logistic Weibull distribution: Model, properties and application. Electron. J. Appl. Stat. Anal. 2017, 10, 206–241. [Google Scholar] [CrossRef]
- Kehinde, O.; Osebi, A.; Ganiyu, D. A New Class of Generalized Burr III Distribution for Lifetime Data. Int. J. Stat. Distrib. Appl. 2017, 4, 6–21. [Google Scholar] [CrossRef]
- Korkmaz, M. A Generalized Skew Slash Distribution via Gamma-normal Distribution. Commun. Stat.-Simul. Comput. 2017, 46, 1647–1660. [Google Scholar] [CrossRef]
- Gomes-Silva, F.; Andrade, T.A.N.; Bourguignon, M. Ristić-Balakrishnan extended exponential distribution. Acta Sci. Technol. 2017, 40, e34963. [Google Scholar] [CrossRef]
- Fagbamigbe, A.F.; Melamu, P.; Oluyede, B.O.; Boikanyo, M. The Ristić and Balakrishnan Lindley-Poisson distribution: Model, theory and application. Afr. Stat. 2018, 13, 1837–1864. [Google Scholar] [CrossRef]
- Ghosh, I.; Hamedani, G.G. The Gamma–Kumaraswamy distribution: An alternative to Gamma distribution. Commun. Stat.-Theory Methods 2018, 47, 2056–2072. [Google Scholar] [CrossRef]
- Akarawak, E.; Adeleke, I.; Okafor, R. The Gamma-Rayleigh Distribution and Applications to Survival Data. Niger. J. Basic Appl. Sci. 2018, 25, 130–142. [Google Scholar] [CrossRef]
- Arshad, R.M.I.; Chesneau, C.; Ghazali, S.A.; Jamal, F.; Mansoor, M. The gamma power half-logistic distribution: Theory and applications. São Paulo J. Math. Sci. 2023, 17, 1142–1169. [Google Scholar] [CrossRef]
- Jimoh, H.; Oluyede, B.O.; Wanduku, D.; Makubate, B. The gamma log-logistic Erlang truncated exponential distribution with applications. Afr. Stat. 2019, 14, 2141–2164. [Google Scholar] [CrossRef]
- Chaturvedi, A.; Vyas, S. Generalized Gamma-Maxwell distribution: Properties and estimation of reliability functions. J. Stat. Manag. Syst. 2019, 22, 1425–1444. [Google Scholar] [CrossRef]
- Oluyede, B.O.; Moakofi, T.; Makubate, B. A new gamma generalized Lindley-log-logistic distribution with applications. Afr. Stat. 2020, 15, 2451–2479. [Google Scholar] [CrossRef]
- Shahid, N.; Khalil, R.; Khokhar, J. Zografos Balakrishnan Power Lindley Distribution. J. Data Sci. 2021, 18, 279–298. [Google Scholar] [CrossRef]
- Reis, L.D.R.; Cordeiro, G.M.; Lima, M.D.C.S. The Gamma-Chen distribution: A new family of distributions with applications. Span. J. Stat. 2021, 2, 23–40. [Google Scholar] [CrossRef]
- Irshad, M.R.; D’cruz, V.; Maya, R. The Zografos-Balakrishnan Lindley Distribution: Properties and Applications. Statistica 2021, 81, 45–64. [Google Scholar]
- Shama, M.; Dey, S.; Altun, E.; Afify, A.Z. The Gamma-Gompertz distribution: Theory and applications. Math. Comput. Simul. 2021, 193, 689–712. [Google Scholar] [CrossRef]
- Vuong, Q.H. Likelihood Ratio Tests for Model Selection and Non-Nested Hypotheses. Econometrica 1989, 57, 307–333. [Google Scholar] [CrossRef]
Disclaimer/Publisher’s Note: The statements, opinions and data contained in all publications are solely those of the individual author(s) and contributor(s) and not of MDPI and/or the editor(s). MDPI and/or the editor(s) disclaim responsibility for any injury to people or property resulting from any ideas, methods, instructions or products referred to in the content. |
© 2025 by the authors. Licensee MDPI, Basel, Switzerland. This article is an open access article distributed under the terms and conditions of the Creative Commons Attribution (CC BY) license (https://creativecommons.org/licenses/by/4.0/).