Article

Directional Differences in Thematic Maps of Soil Chemical Attributes with Geometric Anisotropy

by
Dyogo Lesniewski Ribeiro
1,
Tamara Cantú Maltauro
1,*,
Luciana Pagliosa Carvalho Guedes
1,
Miguel Angel Uribe-Opazo
1,* and
Gustavo Henrique Dalposso
2
1
Engineering, Mathematics and Technology Department, Western Paraná State University, UNIOESTE, Cascavel 85819-110, Brazil
2
PPGBIO—Programa de Pós-Graduação em Tecnologias em Biociências, Federal Technological University of Paraná, UTFPR, Toledo 85902-490, Brazil
*
Authors to whom correspondence should be addressed.
Stats 2024, 7(1), 65-78; https://doi.org/10.3390/stats7010005
Submission received: 26 October 2023 / Revised: 5 December 2023 / Accepted: 9 December 2023 / Published: 16 January 2024
(This article belongs to the Section Statistical Methods)

Abstract

:
In the study of the spatial variability of soil chemical attributes, the process is considered anisotropic when the spatial dependence structure differs in relation to the direction. Anisotropy is a characteristic that influences the accuracy of the thematic maps that represent the spatial variability of the phenomenon. Therefore, the linear anisotropic Gaussian spatial model is important for spatial data that present anisotropy, and incorporating this as an intrinsic characteristic of the process that describes the spatial dependence structure improves the accuracy of the spatial estimation of the values of a georeferenced variable in unsampled locations. This work aimed at quantifying the directional differences existing in the thematic map of georeferenced variables when incorporating or not incorporating anisotropy into the spatial dependence structure through directional spatial autocorrelation. For simulated data and soil chemical properties (carbon, calcium and potassium), the Moran directional index was calculated, considering the predicted values at unsampled locations, and taking into account estimated isotropic and anisotropic geostatistical models. The directional spatial autocorrelation was effective in evidencing the directional difference between thematic maps elaborated with estimated isotropic and anisotropic geostatistical models. This measure evidenced the existence of an elliptical format of the subregions presented by thematic maps in the direction of anisotropy that indicated a greater spatial continuity for greater distances between pairs of points.

1. Introduction

Geostatistical modeling analyzes the relationship between the values of a georeferenced variable observed at different locations and also considers that each sample unit carries information about its neighborhood. Thus, the representation of the spatial continuity of a georeferenced variable in the study area is performed with geostatistical techniques and information collected in a sample. One of the geostatistical methodologies consists in the construction of directional semivariograms, which allows for a preliminary analysis of the existence and type of anisotropy in the phenomenon studied [1].
In this context, the spatial dependence structure of a regionalized variable is said to be isotropic when the spatial continuity presents similar behaviors for all directions. Therefore, any function used to describe the spatial dependence structure, such as the semivariance (γ(h)) and covariance (C(h)) functions, depends only on the modulus (h) of the vector distance h between two locations, where h = ‖h‖ is the Euclidean distance [2,3,4].
Consequently, the estimated values of the parameters that define the spatial dependence structure (practical range, nugget effect and sill) are similar in all directions. However, if the spatial dependence structure differs in relation to the direction, then the process that describes the spatial dependence structure is said to be anisotropic [5].
If the presence of anisotropy is identified in the phenomenon studied, then this characteristic is incorporated in the covariance structure, since the correct specification of the spatial dependence structure can influence the spatial estimation of values of the georeferenced variable in non-sampled locations, as well as its accuracy. For example, when the spatial dependence structure is anisotropic, the spatial prediction assigns greater kriging weights to the samples in the direction of greater spatial continuity, and both the variance and the error of spatial prediction that are obtained in kriging are smaller when the anisotropic model in the kriging rather than the isotropic model is considered [6,7].
Studies developed by Facas et al. [8] and Guedes et al. [5,9], in simulated and real data sets (both with geometric anisotropy), showed relevant differences between the thematic maps elaborated considering or not considering the presence of the anisotropy. The overall difference between these thematic maps, ranging from pixel to pixel, varied from 5% to 35%, and this variation was influenced by the size and sampling design, as well as by the anisotropy factor.
These authors also concluded that the main difference presented in these thematic maps was the formation of elliptic subregions in the direction of anisotropy when an anisotropic model was considered in the analysis of spatial variability. However, this result was only observed through a visual analysis of these thematic maps as well as omnidirectional measures (omnidirectional accuracy indices) to quantify a global difference between the thematic maps. Thus, the objective of this work was to identify, in a quantitative way, the directional difference that exists in the thematic maps when the anisotropy is incorporated in the geostatistical model, using Moran’s directional spatial autocorrelation index (I(d)).

2. Materials and Methods

2.1. Simulation Study

Four trials, each with 100 simulations, from the Monte Carlo experiment were performed, where each simulated data set represents a set of stochastic process realizations {Z(si), siS}, where si = (xi, yi)T is a vector that represents the i-th location in the study area (i = 1, …, n), such that S ⊂ ℝ2 and ℝ2 is the two-dimensional Euclidean space [10]. This simulation study reproduces possible real data sets and improves the theoretical and practical knowledge about the anisotropy.
For each simulated data set, an irregular sampling design with 100 points (n = 100) was considered, with ordinates ranging from 0 to 1 on the X and Y and where each Z(si), com i = 1, …, n, represents a georeferenced variable.
This georeferenced variable was expressed by the isotropic linear Gaussian spatial model Z(si) = μ(si) + ϵ(si) [11], where the deterministic term (μ(si) = μ), ϵ(si) is the stochastic term for i = 1,..., n, such that both depend on the spatial location in which is observed Z(si), such that E[ϵ(si)] = 0 and the variation between points in space is determined by a covariance function C(si, sj) = cov[ϵ(si), ϵ(sj)]. Also, we have assumed that Z = (Z(s1), …, Z(sn))T has a Gaussian distribution n-variate, with vector mean equal to μ1, n × 1, and the covariance matrix = [(σij)], n × n, with σij = C(si, sj), i, j = 1, …, n, with particular parametric form given by = φ1In + φ2R, where In is an identity matrix, n × n, R = R3) = [(rij)] is a symmetric matrix, n × n, with diagonal elements rii = 1 and rij = φ2−1σij for i ≠ j = 1, …, n. Thus, the covariance function is the function associated with semivariance by γ(hij) = C(0) – C(hij) for many isotropic and stationary Gaussian processes, where hij = ‖sisj‖ is the value of Euclidian distance between the points si and sj [4]. Moreover, this covariance matrix has the following parameters: φ3 is a function of the range (a > 0), φ1 is the nugget effect and φ2 is the partial sill.
In the first trial, we are assuming that μ = 200, and an exponential function correlation [12] composed of the following parameters that define the structure of spatial dependence: φ1 = 0, φ2 = 1, and a = 0.6.
In the order trials (2°, 3°, and 4°), this georeferenced variable was expressed by the anisotropic linear Gaussian spatial model [9], with the following technical characteristics: the same correlation function and one change in the linear Gaussian spatial model described above, where ‖Ahij‖ expresses the Euclidean distance between pairs of points in n sampled locations in the semivariance function, i.e., γ(‖Ahij‖) = C(‖0‖) − C(‖Ahij‖), considering a linear transformation at those locations expressed by the product matricial Ahij, with hij = sisj, where the transformation matrix is equal to A = c o s β s e n β F a s e n β c o s β F a , with β as the highest spatial continuity angle in π radians (0 ≤ βπ) defined in the azimuth system and F a = α β α β + π 2 is the anisotropic ratio (Fa > 1), where αβ is the spatial dependency distance (range) in the direction of higher spatial continuity (β) and α β + π 2 is the spatial dependency distance (range) in the direction of lower spatial continuity ( β + π 2 ) [5,7,9]. In the order trials (2°, 3° e 4°), we are assuming that the angle of greater spatial continuity is equal to 90° and the anisotropic ratio is (Fa = 2, 3, and 4). Moreover, the first trial (isotropic) is a particular case of the anisotropic model (Fa = 1) [4].
For each simulation, the estimation of the anisotropic Gaussian space linear model was carried out using the maximum likelihood method obtained by the following parameters: mean (μ), nugget effect (φ1), partial sill (φ2), practical range (a) and anisotropic ratio (Fa) [9,11].
Then, ordinary kriging was used in the spatial estimation of each simulated data set at unsampled locations. In order to compare the differences in the spatial estimation when considering the presence of geometric anisotropy in the application of the linear Gaussian spatial model, kriging was used for each simulated data set with an estimated isotropic linear Gaussian spatial model.
For each simulated data set, the directional comparison between the two maps using the predicted values (one considering the isotropic model and the other considering the anisotropic model) was made. The directional comparison for I(d) (Equation (1)), proposed by Rosenberg [13] was measured. For this calculation, five distance classes (0.15, 0.30, 0.45, 0.60, and 0.75) and two directions (90° and 0°) were considered. Each distance was chosen to guarantee a relevant number of points pairs, greater than or equal to 40, for the calculation of I(d) [13].
I d = 1 W d l = 1   l k n k = 1   k l n w lk d m l m ¯ m k m ¯ l = 1 n m l m ¯ 2 ,
where n is the number of unsampled points that were considered in the kriging; m l and m k are the predicted values in the point s l and s k ( l , k = 1 ,   ,   n ); m ¯ is the mean of predicted values for all points; W d = l = 1   l k n k = 1   k l n w lk d is the sum of the elements of a spatial weights matrix W′  n × n elaborated with the distance class d; and w lk d = w lk is the element at the l -th row and k -th column of the weights matrix W′, expressed by:
w lk = w lk cos 2 α lk θ ,
where w lk = 0 ,   if   d lk > d 1 ,   if   d lk d , for which d lk is the Euclidean distance between points s l and s k ( l , k = 1 ,   ,   n and l k ); θ is the direction (in radians) of interest for the calculation of the Moran directional index; and α lk is the angular direction (in radians) between points s l and s k (i.e., between a line parallel to the X axis and the line formed by the points s l and s k ), such that 0 α lk < π and α lk = α kl , calculated by: α lk = atan y k y l x k x l , if 0 < α lk < π / 2 ; α lk = atan y k y l x k x l + π , if π / 2 < α lk < π ; α lk = 0 , if x k x l = 0 ; and α lk = π / 2 , if y k y l = 0 , where s l = x l , y l T and s k = x k , y k T are the coordinates of the points s l and s k ( l , k = 1 ,   ,   n and l k ), respectively.
Equation (2) demonstrates that Rosenberg [13] defined the Moran directional considering, in this index, the inclusion of a weight (or penalty) factor weights matrix W , expressed by cos 2 α lk θ , with l , k = 1 ,   ,   n and l k . In this way, w lk = w lk , if the direction between points s l and s k is equal to the direction of interest (i.e., α lk = θ ). However, the greater the distance between the direction of interest ( θ ) and the direction between points s l and s k ( α lk ), the smaller the value of w lk (relative to the value of w lk ).
High values of I d indicate that there is a spatial autocorrelation of the georeferenced variable [14]. Thus, the influence of distance class on the magnitude of the index can be explained by the basic geostatistical concept that closer data look more like more distant data [1]. Thus, the analysis of the variation of I d as a function of the distance class d serves as an indication of the range of spatial dependence of the georeferenced variable for a specific direction.
Also, the significance of this index was evaluated by the pseudo-significance test, with a 5% probability [14].

2.2. Soil Chemical Property Study

The agricultural data were collected in a commercial area of grain production in Cascavel, Paraná, Brazil (Figure 1), with a total area of 167.35 ha. The area is located at approximately 24.95° of South and 53.57° of West, with a mean altitude of 650 m above sea level. The soil is classified as typical Dystroferric Red Latosol, with a clayey texture. The region’s climate is classified as mesothermal and super-humid temperate, climate type Cfa (Köeppen classification system), and the mean annual temperature is 21 °C. The sampling points were georeferenced and localized using a GNSS receiver (GeoExplorer, Trimble Navigation Limited, Sunnyvale, CA, USA) in a Datum WGS84 coordinate reference system, UTM (Universal Transverse Mercator) projection. The lattice plus close pairs sampling with 102 points was sampled [1,15]. This sampling consists of a regular grid, with a minimum distance between points of 141 m; 19 points were randomly added in this regular grid, such that the smallest distance between the points added and the point of this regular grid is 75 and 50 m (Figure 1).
The sample data were obtained through a routine chemical analysis in the soil analysis laboratory of COODETEC (Cooperativa Central de Pesquisa Agrícola) of representative samples of each plot weighing approximately 500 g and collected at each demarcated point (Figure 1). The following soil chemical properties with geometric anisotropy were considered: carbon content (C) (g dm−3), calcium content (Ca) (cmolc dm−3) and potassium content (K) (cmolc dm−3). The chemical analyses were performed using the Walkley–Black method [16].
Descriptive and geostatistical analyses were performed for each soil chemical property to verify the existence of directional trends and spatial dependence. Directional trends represent a linear association between the respective values of the soil chemical properties with the coordinates of the X or Y axis, and were assessed by Pearson’s linear correlation coefficient ( r x ,   r y ), in which values above 0.30 in a module indicate a directional trend [17]. Spatial dependence was assessed by the spatial dependence index (SDI), being classified as weak when SDI ≤ 9%, moderate when 9% < SDI ≤ 20% and strong when SDI ≥ 20% [4,18]. Still, the directional comparison analyses described above were also performed. For the calculation of (Equation (1)), five distance classes (150, 300, 450, 600 and 750 m) and two directions (the direction of greater spatial continuity (θ) and the direction orthogonal to it) were considered.
Moreover, the global comparison between the two maps using the predicted values (one considering the isotropic model and the other considering the anisotropic model) were made. The measurements for global comparison were performed by the Global Accuracy and the Kappa and Tau concordance indices [19,20].

2.3. Computational Resources

Simulated data sets, statistical and geostatistical analyses and the calculation of the Moran directional index were made in the geoR package [21] of software R version 3.5.1 [22].

3. Results

3.1. Simulation Study

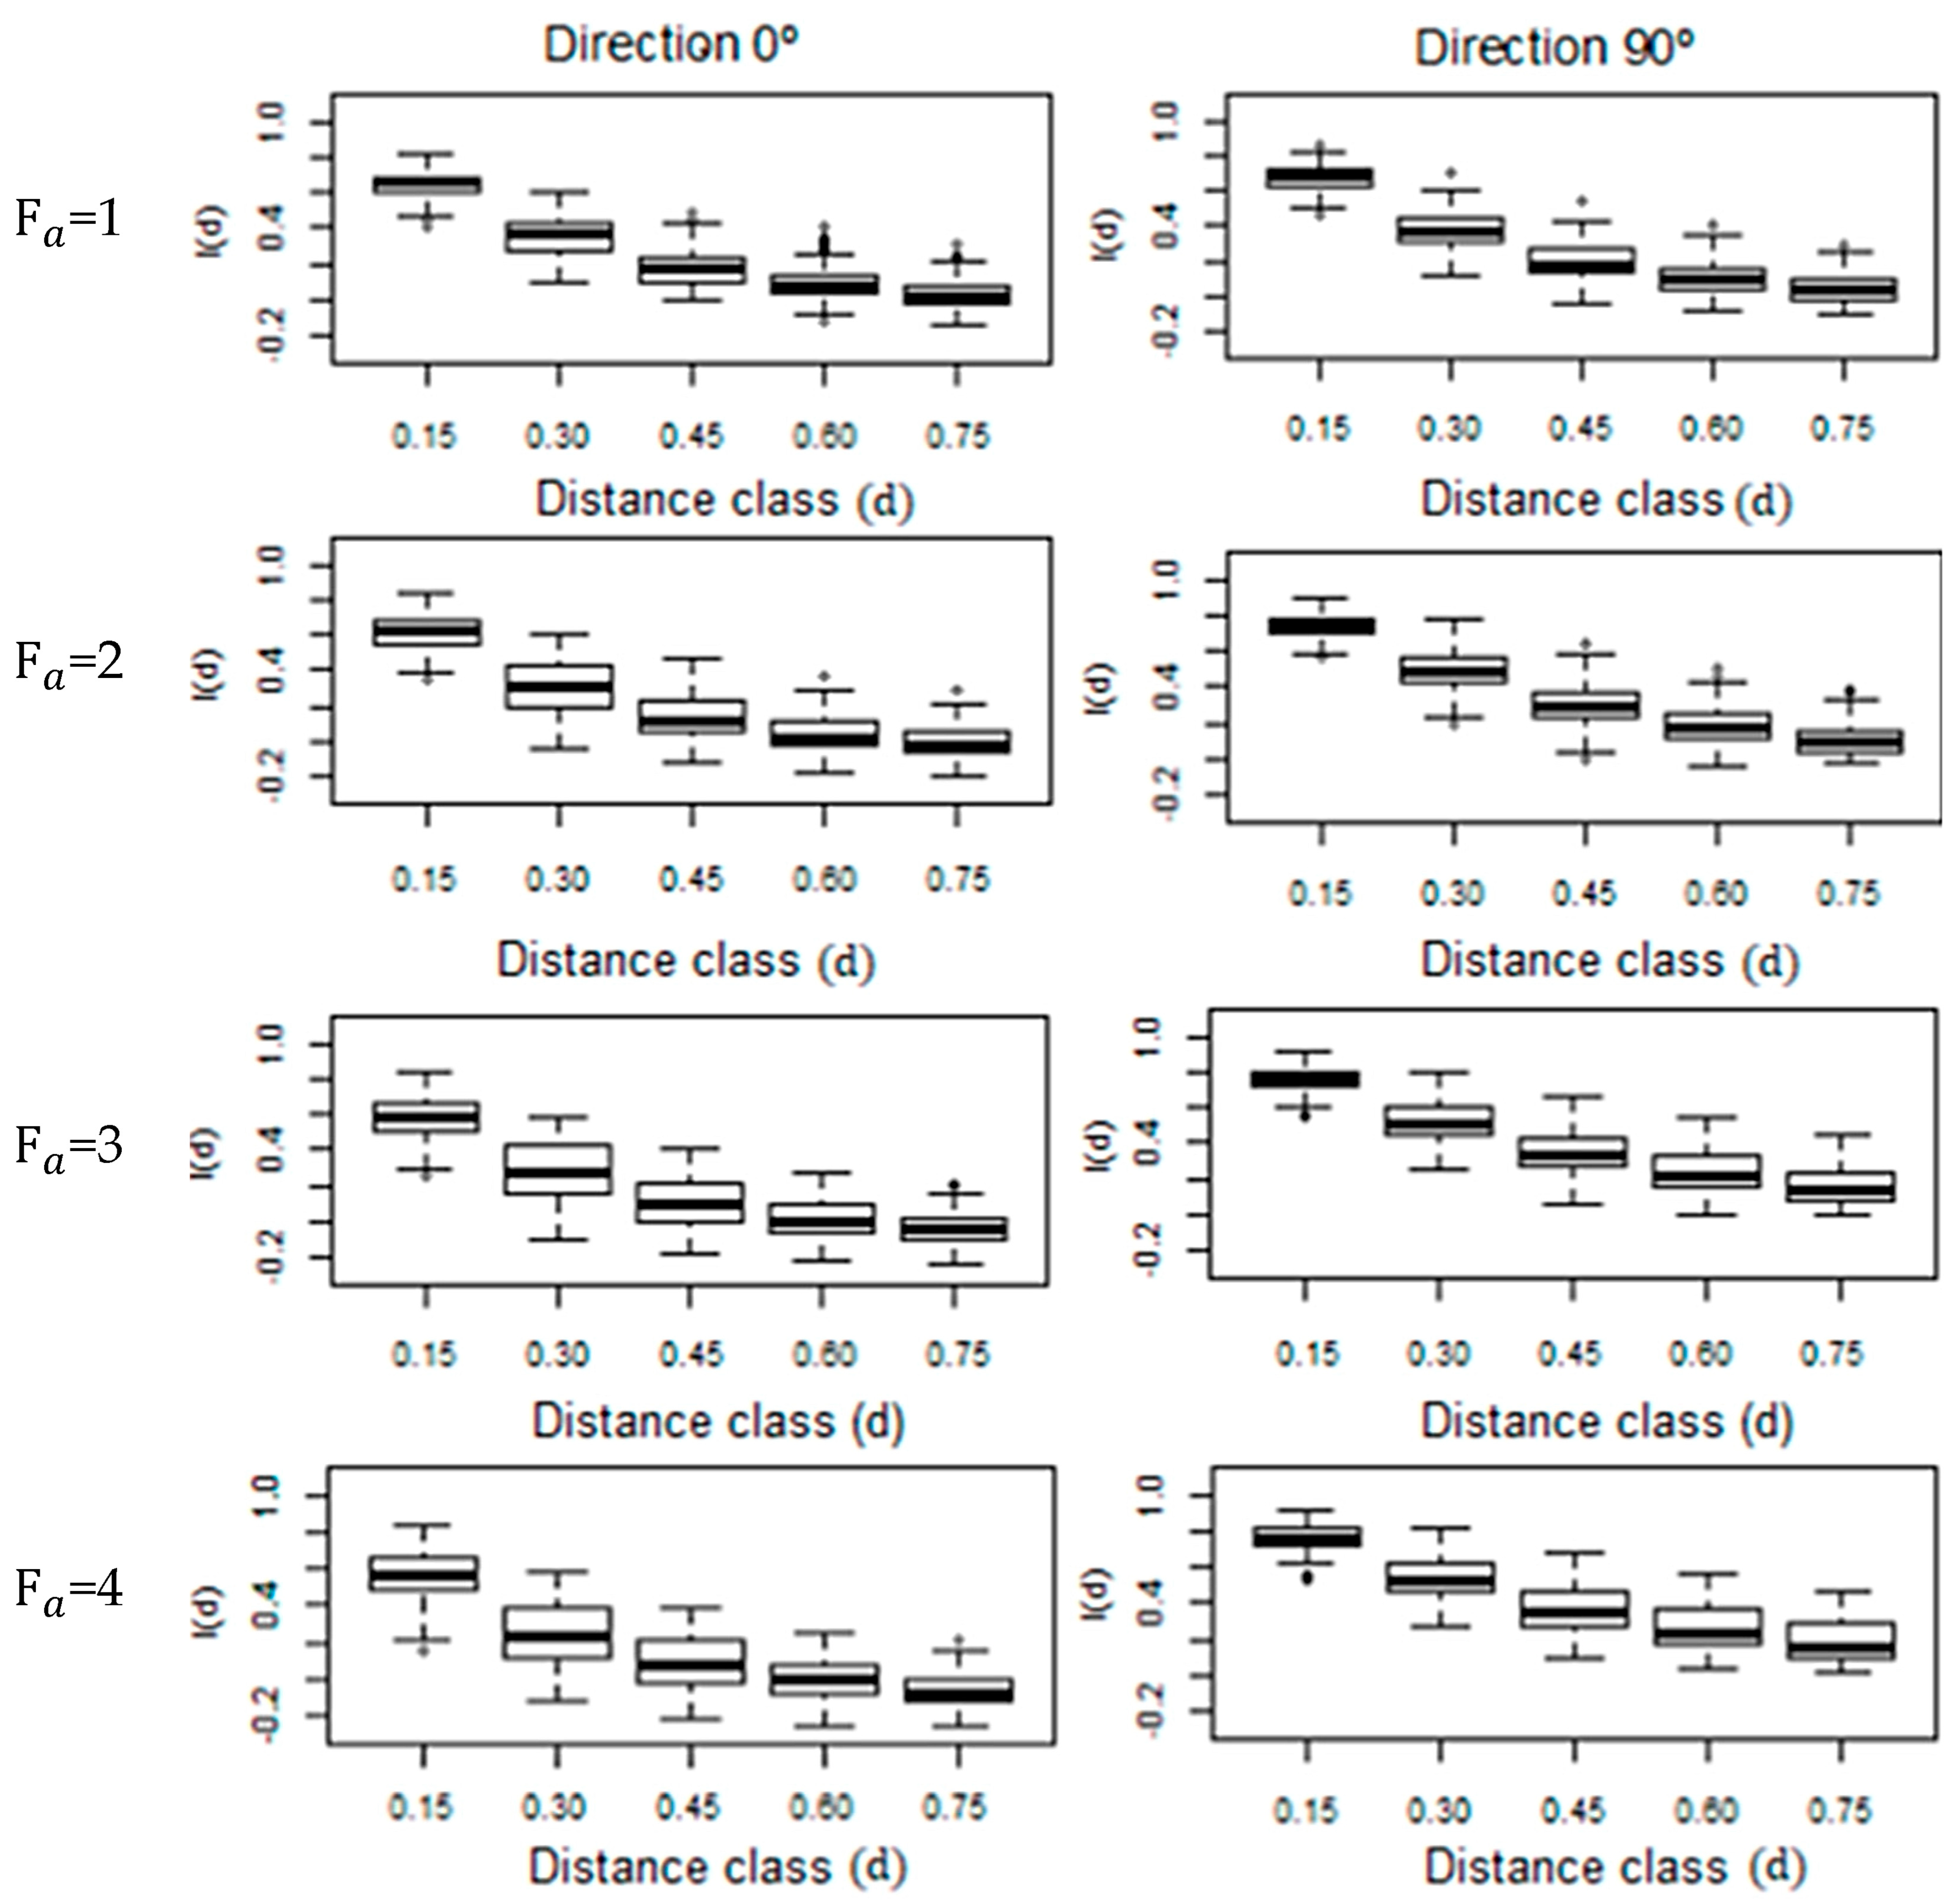
For the simulated data, the results obtained for the values of the Moran directional index I d calculated for the estimated values of the georeferenced variable in unsampled locations are presented in Table 1 and Figure 2. For the isotropic model ( F a = 1 ) and for all distance classes, similar values of I d were observed in both directions considered (0° and 90°) (Figure 2). In all directions, most of the simulations presented significant values of I d (Table 1). In addition, as the distance class increased, there was a similar trend of decreasing of the values of I d in both directions (Figure 2), as well as the percentage of significant values of this index (Table 1).
In this way, under the presence of isotropy the results indicate that the pairs of unsampled locations considered in kriging presented the same degree of spatial similarity in both directions (0° and 90°). Thus, in the 0° and 90° directions there was a similar description of the spatial continuity of the variable georeferenced in the thematic map.
For all other anisotropic ratios considered in the simulations ( F a = 2 , 3 , 4 ), the higher the distance class, the higher the decay rate and percentage of significant values of I d in the 0° direction compared with the 90° direction (Figure 2 and Table 1).
Even in the largest distance class (d = 0.75), the 90° direction presented the higher values of I(d), as well as the higher percentage of I(d) significant values. These relevant differences occurred in almost all the simulations with the largest values of the anisotropic ratio ( F a = 3 ,   4 ).
These results suggest that the 90° direction presented spatially similar predicted values within a radius of distance between their respective locations equal to 0.75, while in the 0° direction, the distance radius separating pairs of predicted values that are considered similar is less than 0.60.

3.2. Soil Chemical Property Study

For the soybean crop, the difference between maximum and minimum samples (Table 2) indicated that each soil chemical property is classified from medium to very high level [23]. According to Pimentel Gomes [24], the sample values of carbon content (C), calcium content (Ca) and potassium content (K) presented medium (10% ≤ CV ≤ 20%), high (20% ≤ CV ≤ 30%) and very high (CV > 30%) dispersion in relation to their corresponding average, respectively (Table 2). In addition, the soil chemical properties, when associated with the x and y coordinates, presented the estimated value of Pearson’s linear correlation coefficient as lower than 0.30 ( r x ,   r y ) (Table 2). This result suggests an absence of a linear trend of these properties with the X and Y axes [17]. However, as for some properties the p-value is lower than 0.05 (Table 2), the linear correlation can be considered statistically significant, and thus the coordinate x has a significant linear association with the carbon content (C) and calcium content (Ca), while the y coordinate has a significant linear association with the potassium content (K) (regardless of the correlation coefficient value) (Table 2).
According to the Postplot graph (Figure 3), the soil chemical attributes presented discrepant points that are located in the central region of the study area for carbon and calcium contents (Figure 3a,b), whereas for the potassium content, these are located in the southern region of the study area (Figure 3c).
In addition, for each soil chemical property, the Postplot graph showed the formation of clusters of sample points with similar values, mainly with a higher concentration of points in the 90° direction (Figure 3). This result indicates that the soil chemical properties presented a directional tendency regarding spatial continuity, that is, geometric anisotropy [5].
Table 3 presents the results of the univariate geostatistical analysis with the linear anisotropic Gaussian spatial model estimates by maximum likelihood-ML, which describes the dependence structure of the soil chemical properties in the study area. For all soil chemical properties, the cross-validation criteria, Akaike information (AIC) and Bayesian information (BIC) showed that the covariance function described by the Gaussian model was the best fit [25,26].
The estimated covariance matrix (Σ) is expressed according to Equations (3)–(5), respectively, considering the attributes C, Ca and K.
Σ ^ = 9.027 I n + 4.497 e A ^ h i j 86.425 2   with   A ^ h i j = h i j = u i j 2 + v i j 2 6.078 ,  
Σ ^ = 1.401 I n + 0.39 e A ^ h i j 101.671 2   with   A ^ h i j = h i j = u i j 2 + v i j 2 4.55 ,
Σ ^ = 0.015 I n + 0.003 e A ^ h i j 214.878 2   with   A ^ h i j = h i j = u i j 2 + v i j 2 3.754 ,
where I is an identity matrix, n × n, with n = 102; A ^ h i j is the value of Euclidian distance between the points s i = x i , y i T and s j = x j , y j T [20], considering a linear transformation matrix A , 2 × 2 [27]; where h i j = s i s j ,   u = y i y j sin 90 ° + x i x j cos 90 ° ,   v ij = y i y j cos 90 ° x i x j sin 90 ° , such that 90° is a direction of higher spatial continuity.
The estimated values of the practical range and the spatial dependence index (SDI) indicated the existence of spatial dependence for all soil chemical properties, with a radius of spatial dependence from 149.57 to 371.89 m, and spatial dependence classified as weak for the soil carbon and calcium contents (SDI ≤ 9%) and moderate for the soil potassium content (9% < SDI ≤ 20%) [4,18].
For all the soil chemical properties, the presence of geometric anisotropy in the 90° direction was observed, and the estimated value of the anisotropic ratio indicated a spatial dependence radius of 3.754 to 6.078 times greater in the 90° direction than in its orthogonal direction (0°).
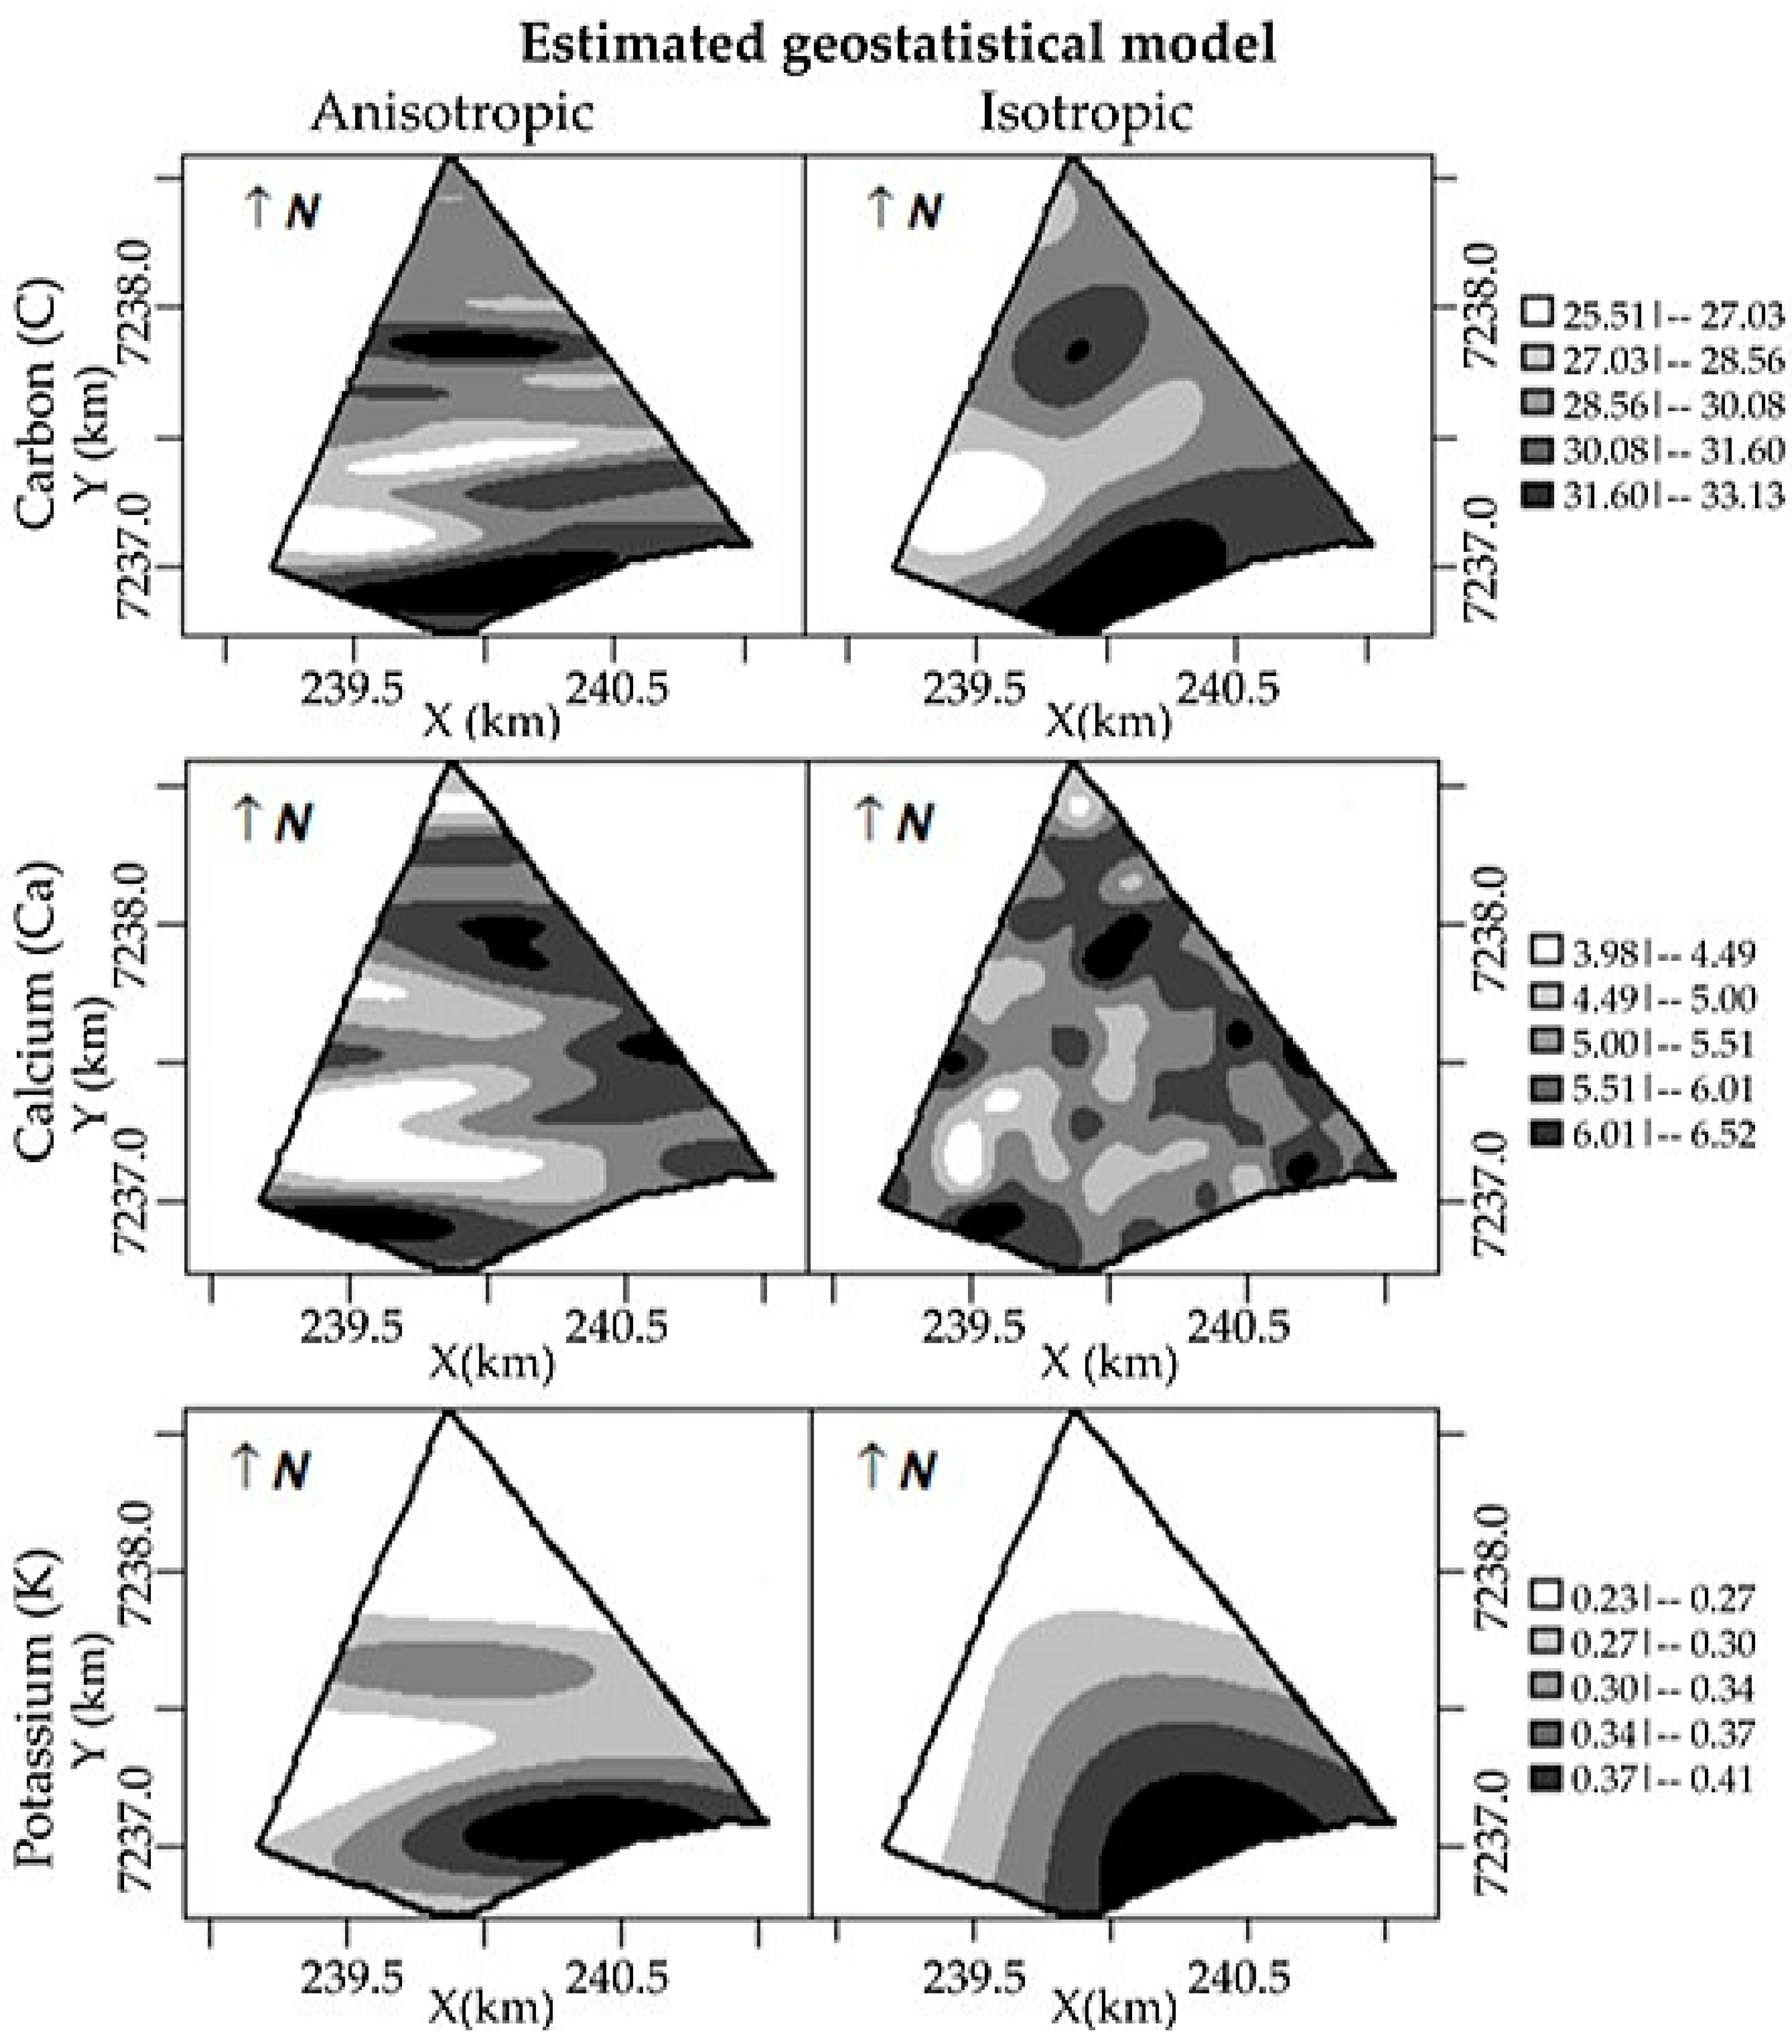
Figure 4 presents the thematic maps of soil chemical properties generated by kriging, also considering anisotropic and isotropic models. The thematic maps generated by the anisotropic model presented subregions with an elliptical format, whereas the same subregions presented a more circular format in the maps generated by the isotropic model.
Comparing the thematic maps of soil chemical attributes considering the isotropic and anisotropic model, an estimated OA ^ value of less than 85% was found, as well as K ^ and T ^ of less than 67%, which indicates that the maps are not similar, that is, that the maps prepared considering both models are not similar in terms of the distribution of attribute content in the area under study ( OA ^ < 0.85 e K ^ , T ^ < 0.67 ; [19,20]) (Table 4).
The similarity measures describe differences in spatial estimation globally, that is, in all directions. Conversely, Table 5 presents the values of the directional Moran I ( I d ), calculated for the predicted values by kriging, considering or not considering the presence of anisotropy in the carbon, calcium and potassium contents in the soil. Thus, for each soil chemical property and a direction of interest, I d describes whether or not there are directional differences between thematic maps elaborated with anisotropic and isotropic models.
For all soil chemical attributes and geostatistical models (anisotropic and isotropic), almost all of the estimated values of I d are significant at 5% probability (Table 5). Also, for all distance classes, higher values of I d were obtained in the direction of greater spatial continuity (90°) compared to the estimated values of I d in the 0° direction (Table 5).
Indeed, the estimated values of I d showed that, in the 90° direction, there was spatial autocorrelation between points spaced at 750 m, and, in the 0° direction, there was a weak spatial correlation from 450 m for the carbon and calcium content in the soil, with estimated values of I d closer to zero (Table 5).
These results indicate that the presence of anisotropy in the carbon, calcium and potassium contents influenced the shape of the subregions (showing a greater spatial continuity towards the anisotropic direction), even though the spatial prediction was performed with the isotropic model.
Moreover, there was a greater difference between the estimated values of I d for the 0° and 90° directions in the spatial prediction performed with the anisotropic model, with higher values of I d in the 90° direction (Table 5). Thus, from the distance class of 450 m, the estimated values of I d in the 90° direction were greater than 1.65 to 7.83 times at the estimated values of I d in the 0° direction (Table 5).
Therefore, the thematic maps elaborated with the anisotropic model presented a greater spatial continuity in the 90° direction compared with those elaborated with the isotropic model, evidencing the existence of directional differences between thematic maps elaborated when considering or not considering the anisotropy in the geostatistical model.

4. Discussion

The simulations with F a 1 showed that the 90° direction is the direction with the highest directional spatial autocorrelation, which indicates the higher similar estimated points density in this direction [13,28,29]. Thus, under the presence of anisotropy, there was a significant difference between the direction that defines the presence of geometric anisotropy and its orthogonal direction, in relation to the spatial continuity of the estimated values of the georeferenced variable in unsampled locations.
There was an inverse trend between the values of the distance classes and I(d). However, the value of the coefficient in the largest distance class is often unreliable due to the few pairs of points in this class [13]. In this way, the same problem that occurs with the directional semivariogram, when compared with the omnidirectional semivariogram, in relation to the existence of a smaller number of pairs of points at each distance [8], also occurs when we compare the calculation of directional and omnidirectional spatial autocorrelation [29]. It may not be possible to analyze the directional spatial correlation for some data sets with a smaller sample size. The directional spatial autocorrelation could be calculated for various classes of distances/directions and the results are plotted in a diagram known as a Windrose, which is a complementary method for identifying the anisotropy [29].
Considering the soil chemical property study, the analyses indicated relevant differences in the thematic maps, when considering the incorporation or not of the geometric anisotropy, mainly in the direction of greater spatial continuity (90°). These differences and the shape of the subregions were also observed in thematic maps generated in studies conducted by Guedes et al. [5], even with data collected in another sampling design, and occur because it is assumed that the ellipsoid representing the anisotropy of the estimated property is centered on each node to be estimated [30].
A low value of the similarity measures ( OA ^ < 0.85 e K ^ , T ^ < 0.67 ; [19,20] was obtained for each soil chemical property (Table 4). According to Richetti et al. [31], this low similarity represents a relevant difference between the generated maps, when the geometric anisotropy was or was not incorporated, in relation to the percentage of the area classified in each class. Thus, this result shows that the incorporation of the anisotropy, when it exists, alters the spatial distribution of these soil chemical properties in the study area.
As reported by Guedes et al. [9], these relevant differences in the spatial estimation of georeferenced variables presented by the similarity measures are justified by the high estimated values of the anisotropic ratio factor, since the values of the anisotropy factor were higher than 2.
These results corroborate other results obtained in the literature for simulated and real data, from the point of view of a traditional anisotropy analysis (modeling, visual analysis of the thematic map) [5,7,8,9]. But the main contribution of this article to research already carried out on anisotropy is the possibility of using directional spatial autocorrelation as a metric to highlight the existence of directional differences in the thematic maps regarding the subregions format, elaborated when considering or not considering the anisotropy in the geostatistical model.
Furthermore, the linear anisotropic Gaussian spatial model is important and suitable for the simulated and real data of this work, because when the data present anisotropy, it must be incorporated as an intrinsic characteristic of the process that describes the spatial dependency structure in order to improve the accuracy of the spatial estimation of the values of a georeferenced variable in unsampled locations [9], and this results in the generation of maps that describe with greater accuracy the spatial variability of the variable throughout the area under study [5,7].

5. Conclusions

Under the presence of geometric anisotropy, the Moran directional index evidenced the existence of directional differences in the thematic maps regarding the subregions format, elaborated when considering or not considering the anisotropy in the geostatistical model. In addition, the higher the anisotropy factor, the lower the decay rate of the Moran directional index values, indicating a greater grouping of similar values, that is, a greater spatial continuity of the georeferenced variable, in the direction that defines the geometric anisotropy. It was possible to use the Moran directional index as a measure of directional comparison between the thematic maps, with or without the anisotropy in the geostatistical analysis.
The results obtained allow us to conclude that improving the use of geostatistics applied to sustainable Precision Agriculture can provide important information for better use of the soil, as it allows for an increase in soybean productivity without affecting the environment with unnecessary applications of inputs in agricultural areas.

Author Contributions

Conceptualization, D.L.R., L.P.C.G. and M.A.U.-O.; methodology, D.L.R. and L.P.C.G.; software, D.L.R.; validation, D.L.R.; formal analysis, D.L.R. and L.P.C.G.; investigation, D.L.R. and L.P.C.G.; resources, D.L.R., L.P.C.G. and M.A.U.-O.; data curation, D.L.R. and L.P.C.G.; writing—original draft preparation, D.L.R.; writing—review and editing, T.C.M. and M.A.U.-O.; visualization, D.L.R., T.C.M., G.H.D. and L.P.C.G.; supervision, T.C.M., L.P.C.G., G.H.D. and M.A.U.-O.; project administration, T.C.M., L.P.C.G., G.H.D. and M.A.U.-O.; funding acquisition, L.P.C.G. and M.A.U.-O. All authors have read and agreed to the published version of the manuscript.

Funding

This research was funded by the Coordination for the Improvement of Higher Education Personnel (CAPES), Funding Code 001 and Fundação Araucária, Funding Code 001.

Institutional Review Board Statement

Not applicable.

Informed Consent Statement

Not applicable.

Data Availability Statement

The data is collected from a private agricultural area, wich we manage through a partnership arrangement. Therefore, data sharing is not feasible.

Acknowledgments

The authors would like to express thanks for the financial support of the Coordination for the Improvement of Higher Education Personnel, Brazil (CAPES), the National Council for Scientific and Technological Development, Brazil (CNPq), Fundação Araucária of the State of Paraná, the Graduate Programs in Agricultural Engineering and the Laboratory of Spatial Statistics (LEE) of the State University of Western Paraná, Brazil.

Conflicts of Interest

The authors declare no conflict of interest.

Abbreviations

The following abbreviations are used in this manuscript:
AICAkaike information
BICBayesian information
CCarbon
CaCalcium
CVCoefficient of variation
FaAnisotropic ratio
GNSSGeoExplorer, Trimble Navigation Limited, Sunnyvale
KPotossium
K ^ Kappa
OA ^ Overall accuracy
r x   and   r y Pearson’s linear correlation coefficient between the soil chemical properties and the x and y coordinates
SDIspatial dependence index
T ^ Tau
UTMUniversal Transverse Mercator

References

  1. Cressie, N.A.C. Statistics for Spatial Data; John Wiley & Sons: New York, NY, USA, 2015. [Google Scholar]
  2. De Bastiani, F.; Cysneiros, A.F.J.; Cysneiros, A.H.M.; Uribe-Opazo, M.A.; Galea, M. Infuence diagnostics in elliptical spatial linear models. Test 2015, 24, 322–340. [Google Scholar] [CrossRef]
  3. Uribe-Opazo, M.A.; De Bastiani, F.; Galea, M.; Schemmer, R.C.; Assumpção, R.A. Influence diagnostics on a reparameterized t-Student spatial linear model. Spat. Stat. 2021, 41, 100481. [Google Scholar] [CrossRef]
  4. Uribe-Opazo, M.A.; Dalposso, G.H.; Galea, M.; Johann, J.A.; De Bastiani, F.; Moyano, E.N.C.; Grzegozewski, D. Spatial variability of wheat yield using the Gaussian spatial linear model. Aust. J. Crop Sci. 2023, 17, 179–189. [Google Scholar] [CrossRef]
  5. Guedes, L.P.C.; Uribe-Opazo, M.A.; Ribeiro, P.J., Jr. Influence of incorporating geometric anisotropy on the construction of thematic maps of simulated data and chemical attributes of soil. Chil. J. Agric. Res. 2013, 73, 414–423. [Google Scholar] [CrossRef]
  6. Guan, Y.; Sherman, M.; Calvin, J.A. A nonparametric test for spatial isotropy using subsampling. J. Am. Stat. Assoc. 2004, 99, 810–821. [Google Scholar] [CrossRef]
  7. Guedes, L.P.C.; Uribe-Opazo, M.A.; Johann, J.A.; Souza, E.G. Anisotropia no estudo da variabilidade espacial de algumas variáveis químicas do solo. Rev. Bras. Ciênc. Solo 2008, 7, 2217–2226. [Google Scholar] [CrossRef]
  8. Facas, N.W.; Mooney, M.A.; Asce, M.; Furrer, R. Anisotropy in the spatial distribution of roller-measured soil stiffness. Int. J. Geomech. 2010, 10, 129–135. [Google Scholar] [CrossRef]
  9. Guedes, L.P.C.; Uribe-Opazo, M.A.; Ribeiro, P.J., Jr.; Dalposso, G.H. Relationship between sample design and geometric anisotropy in the preparation of thematic maps of chemical soil atributes. Eng. Agríc. 2018, 38, 260–269. [Google Scholar] [CrossRef]
  10. Mardia, K.V.; Marshall, R.J. Maximum likelihood models for residual covariance in special regression. Biometrika 1984, 71, 319–332. [Google Scholar] [CrossRef]
  11. Uribe-Opazo, M.A.; Borssoi, J.A.; Galea, M. Influence diagnostics in Gaussian spatial linear models. J. Appl. Stat. 2012, 39, 615–630. [Google Scholar] [CrossRef]
  12. Chipeta, M.G.; Terlouw, D.J.; Phiri, K.S.; Diggle, P.J. Inhibitory geostatistical designs for spatial prediction taking account of uncertain covariance structure. Environmetrics 2017, 28, e2425. [Google Scholar] [CrossRef]
  13. Rosenberg, M.S. The bearing correlogram: A new method of analyzing directional spatial autocorrelation. Geogr. Anal. 2000, 32, 267–278. [Google Scholar] [CrossRef]
  14. De Araújo, E.C.; Uribe-Opazo, M.A.; Johann, J.A. Modelo de regressão espacial para estimativa da produtividade da soja associada a variáveis agrometeorológicas na região oeste do estado do Paraná. Eng. Agríc. 2014, 34, 286–299. [Google Scholar] [CrossRef]
  15. Maltauro, T.C.; Guedes, L.P.C.; Uribe-Opazo, M.A.; Canton, L.E.D. Spatial multivariate optimization for a sampling redesign with a reduced sample size of soil chemical properties. Rev. Bras. Cienc. Solo 2023, 47, e0220072. [Google Scholar] [CrossRef]
  16. Walkley, A.; Black, I.A. An examination of the Degtjareff method for determining soil organic matter and a proposed modification of the chromic acid titration method. Soil Sci. 1934, 37, 29–38. [Google Scholar] [CrossRef]
  17. Callegari-Jacques, S.M. Bioestatística: Princípios e Aplicações; Artmed: Porto Alegre, Brazil, 2003. [Google Scholar]
  18. Neto, E.A.; Seidel, E.J.; Oliveira, M.S. Geostatistical-based index for spatial variability in soil properties. Rev. Bras. Cienc. Solo 2020, 44, e0200086. [Google Scholar]
  19. Anderson, J.R.; Hardy, E.E.; Roach, J.T.; Witmer, R.E. A Land Use and Land Cover Classification System for Use with Remote Sensor Data; U.S. Government Print Office: Washington, DC, USA, 2001.
  20. Krippendorff, K. Content Analysis: An Introduction to Its Methodology, 2nd ed.; Sage Publications: Beverly Hills, CA, USA, 2013. [Google Scholar]
  21. Ribeiro, P.J., Jr.; Diggle, P.J. geoR: A package for geostatistical analysis. R-NEWS 2016, 1, 15–18. [Google Scholar]
  22. R Development Core Team. R: A Language and Environment for Statistical Computing; R Foundation for Statistical Computing: Vienna, Austria, 2023; Available online: https://www.r-project.org/ (accessed on 1 March 2020).
  23. Costa, J.M.; Oliveira, E.F. Fertilidade do Solo e Nutrição de Plantas; COAMO: Campo Mourão, Brazil, 2001. [Google Scholar]
  24. Pimentel Gomes, F. Curso de Estatística Experimental, 12th ed.; Nobel: São Paulo, Brazil, 1985. [Google Scholar]
  25. Akaike, H. Information theory and the maximum likelihood principle. In International Symposium on Information Theory, 2nd ed.; Petrov, B.N., Csäki, F., Eds.; Akademiai Kiàdo: Budapest, Hungary, 1973. [Google Scholar]
  26. Faraco, M.A.; Uribe-Opazo, M.A.; Silva, E.A.A.; Johann, J.A.; Borssoi, J.A. Seleção de modelos de variabilidade espacial para elaboração de mapas temáticos de atributos físicos do solo e produtividade da soja. Rev. Bras. Ciênc. Solo 2008, 32, 463–476. [Google Scholar] [CrossRef]
  27. Diggle, P.J.; Ribeiro, P.J., Jr. Model Based Geostatistics; Springer: New York, NY, USA, 2007. [Google Scholar]
  28. Griffith, D.A. Spatial autocorrelation and eigenfunctions of the geographic weights matrix accompanying geo-referenced data. Can. Geogr. 1996, 40, 351–367. [Google Scholar] [CrossRef]
  29. Oden, N.L.; Sokal, R.R. Directional autocorrelation: An extension of spatial correlograms to two dimensions. Syst. Zool. 1986, 35, 608–617. [Google Scholar] [CrossRef]
  30. De Deus Afonseca, B.; Costa, J.F.C. Dynamic anisotropy and non-linear geostatistics supporting short term modelling of structurally complex gold mineralization. Geosciences 2021, 74, 199–207. [Google Scholar] [CrossRef]
  31. Richetti, J.; Uribe-Opazo, M.A.; de Bastiani, F.; Johann, J.A. Técnicas para detecção de pontos influentes em variáveis contínuas regionalizadas. Eng. Agríc. 2016, 36, 152–165. [Google Scholar] [CrossRef]
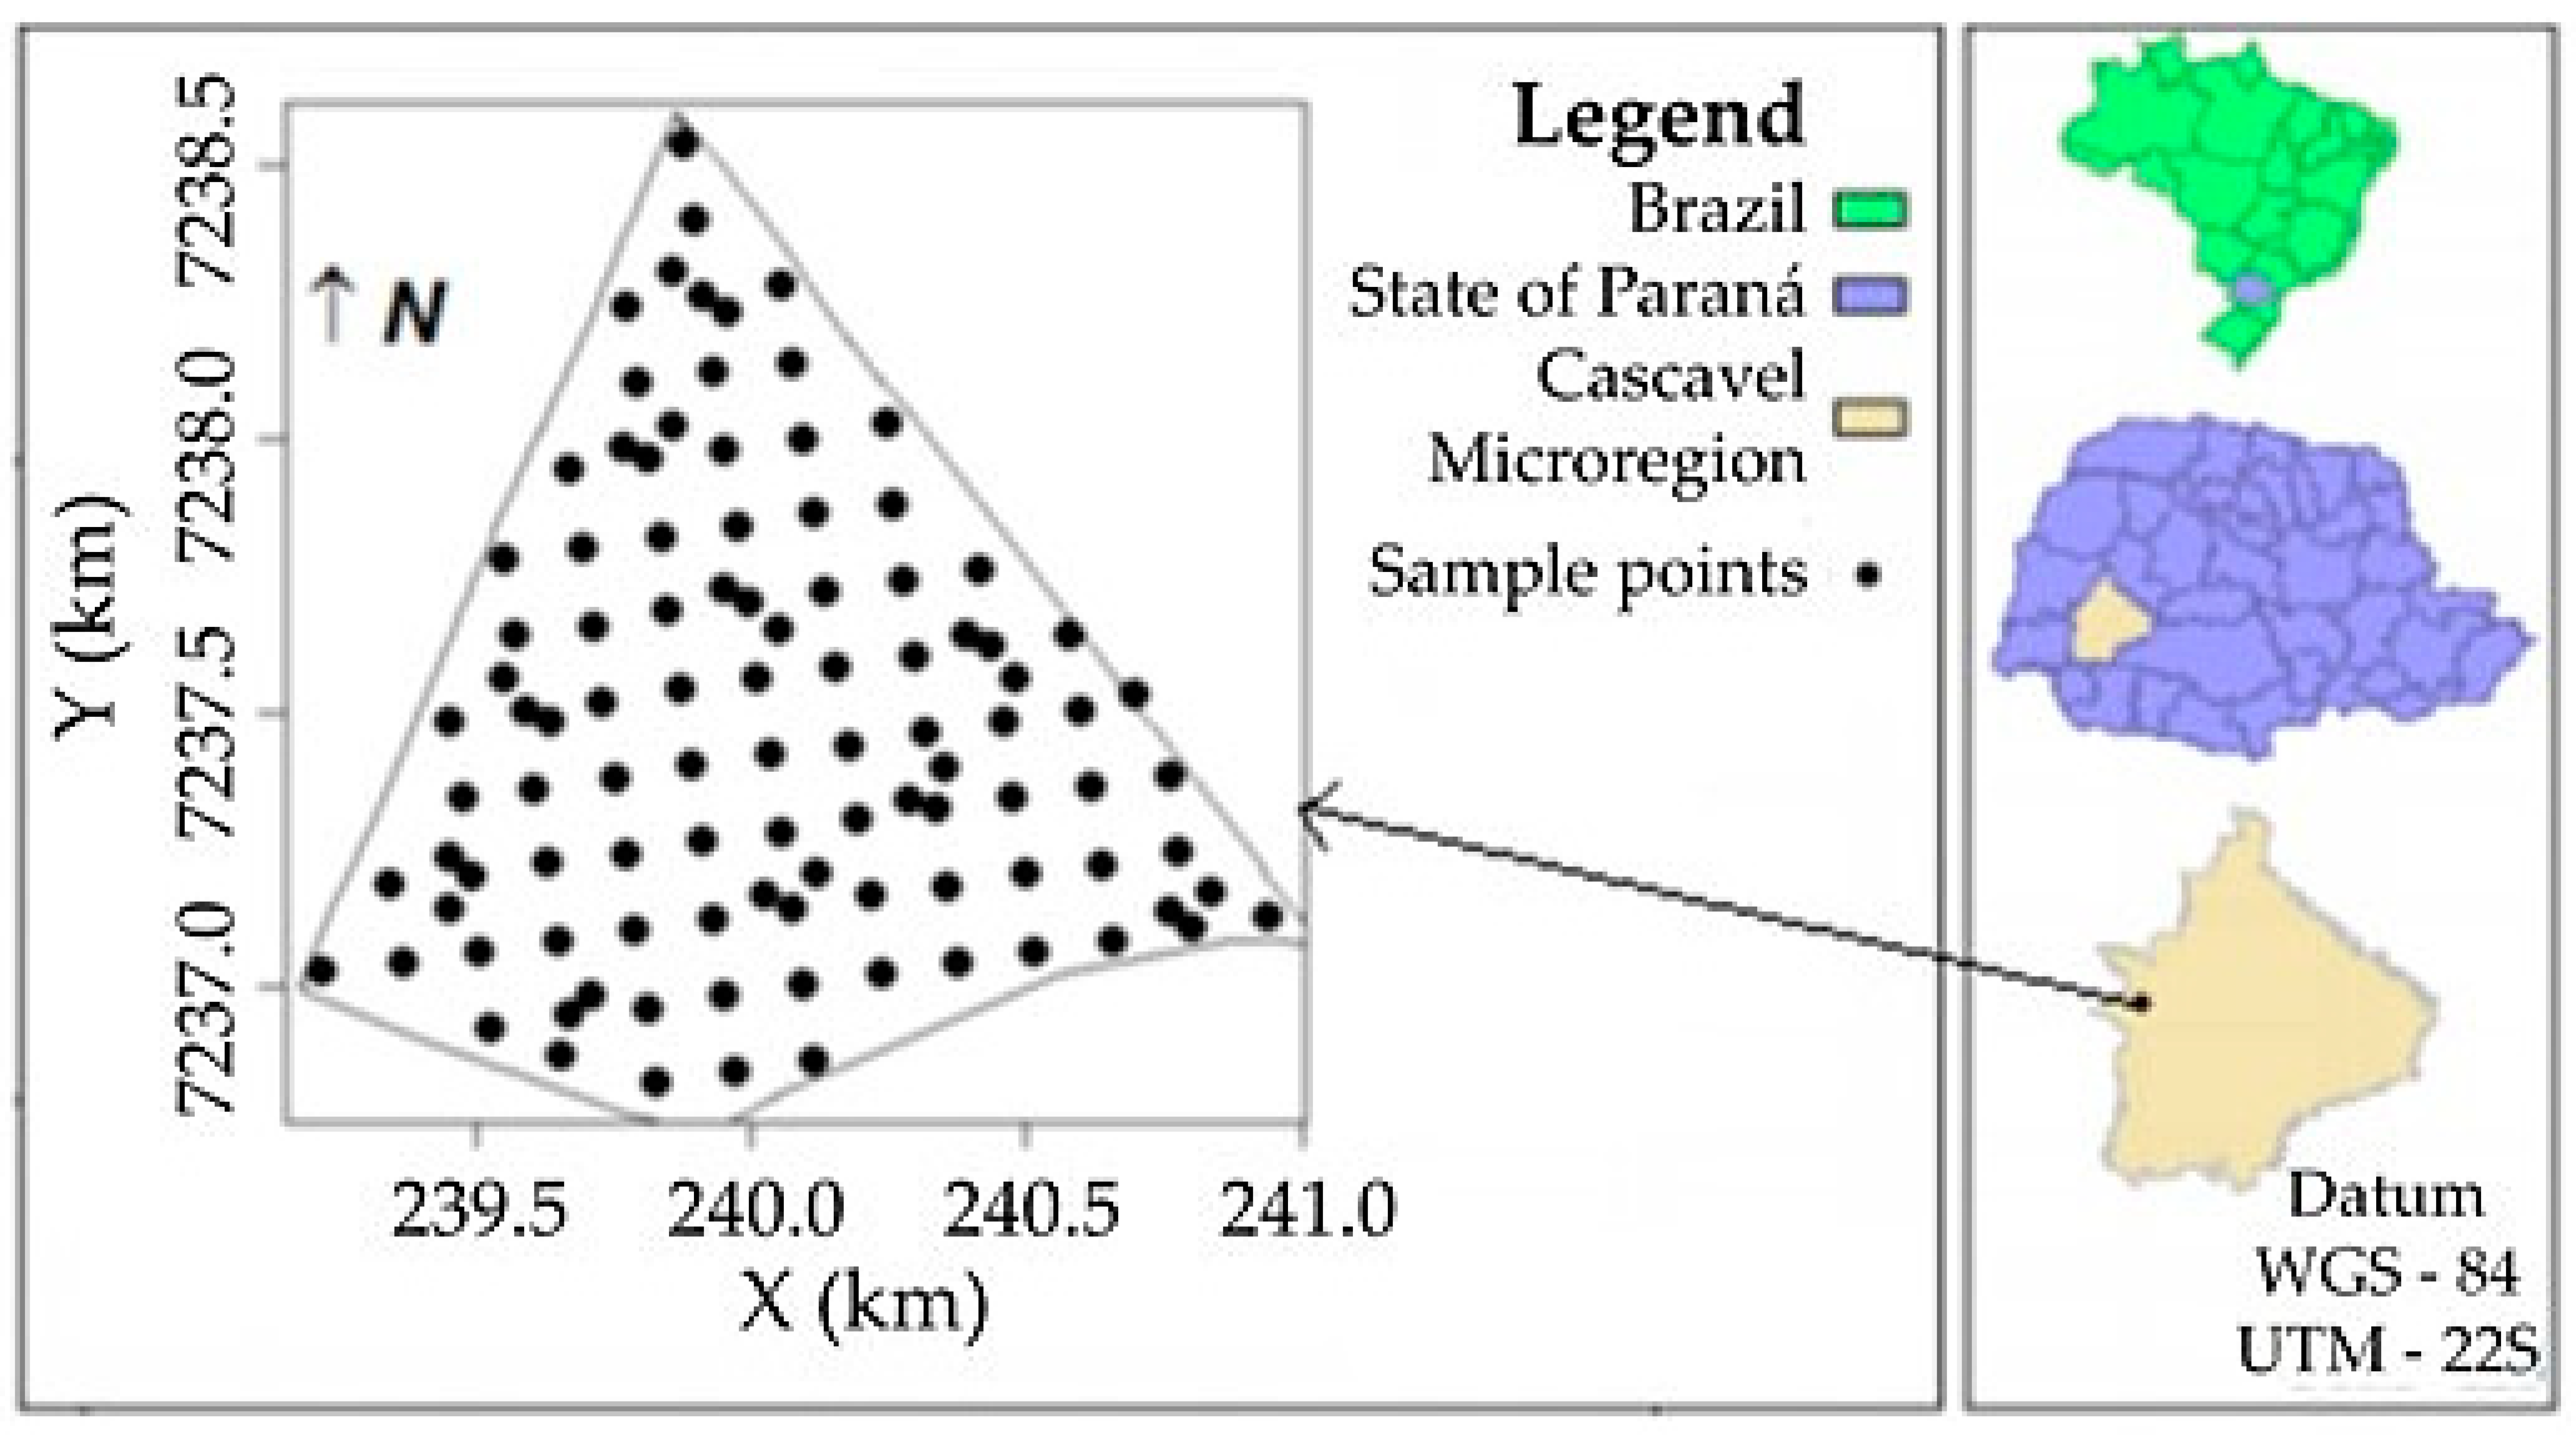
Figure 1. Area of study and locations of sampled points.
Stats 07 00005 g001
Figure 2. Boxplot for the values of the Moran directional index (I(d)), calculated according to the distance class (d) and the direction (θ), considering the predicted values of the simulations, for different values of the anisotropic ratio (Fa) (° indicates discrepant points).
Stats 07 00005 g002
Figure 3. Postplot graph spatial representation of the locations sampled in the study area, classified into equal amplitude for the (a) carbon content (C), (b) calcium content (Ca) and (c) potassium content (K).
Stats 07 00005 g003
Figure 4. Thematic map of soil chemical property, with the isotropic (“bottom panel”) and anisotropic (“top panel”) model.
Stats 07 00005 g004
Table 1. Percentage of simulations with significant values of the Moran directional index (I(d)) (with 5% significance by the pseudo-significance test) calculated for the predicted values considering the estimated anisotropic model, in each distance class and direction; according to the anisotropic ratio considered in the simulations.
Anisotropic Ratio (Fa)Direction (θ)Percentage
Distance Class (d)
0.150.300.450.600.75
Fa = 1 (isotropic)100100958260
90°100100928356
Fa = 210099825737
90°100100989684
Fa = 310095704225
90°1001001009995
Fa = 410090593919
90°10010010010098
Table 2. Descriptive statistics of the soil chemical properties and Pearson’s linear correlation coefficient between the soil chemical properties and the x and y coordinates (r(x) and r(y)).
StatisticCarbon (C)Calcium (Ca)Potassium (K)
Average29.425.390.30
Minimum22.402.250.10
Median29.335.320.26
Maximum45.228.760.67
Coefficient of variation (CV) (%) 12.6725.1845.04
r(x)0.230.220.18
Confidence interval (x)[0.037; 0.406][0.029; 0.399][−0.013; 0.363]
p-value0.019 *0.024 *0.067 ns
r(y)−0.110.03−0.26
Confidence interval (y)[−0.303; 0.081][−0.164; 0.224][−0.437; −0.075]
p-value0.247 ns0.756 ns0.006 *
r(x), r(y): Pearson’s linear correlation coefficient between the soil chemical properties and the x and y coordinates; *: significant p-value; ns: p-value not significant.
Table 3. Estimated values of parameters obtained for anisotropic Gaussian spatial model and similarity measures in the comparison of spatial estimation between anisotropic and isotropic models.
Soil Chemical Property μ ^ φ ^ 1 φ ^ 2 φ ^ 1 + φ ^ 2 φ ^ 3 F ^ a a ^ S D I ^
Carbon (C)29.4439.0274.49713.52486.4256.078149.5755.80%
Calcium (Ca)5.3881.4010.3901.791101.6714.550175.9627.86%
Potassium (K)0.2920.0150.0030.018214.8783.754371.89017.70%
Estimated values of mean ( μ ^ ), nugget effect ( φ ^ 1 ) , partial sill ( φ ^ 2 ) , anisotropic ratio F ^ a , practical range ( a ^ ), where φ ^ 3 is a function of practical range, and spatial dependence index ( SDI ^ = MF K φ ^ 1 / φ ^ 1 + φ ^ 2 min 1 ;   a ^ 0.5 MD 100 , where, MF K : model fato and MD: maximum distance [21].
Table 4. Estimated values of global comparison measures between thematic maps considering estimated anisotropic and isotropic models for the soil chemical properties.
Soil Chemical PropertyOverall Accuracy ( O A ^ )Kappa ( K ^ )Tau ( T ^ )
Carbon0.510.310.38
Calcium0.580.380.47
Potassium0.480.320.36
Table 5. Estimated value of Moran’s directional spatial autocorrelation index with the predicted values calculated by kriging, considering anisotropic and isotropic models, for the soil chemical properties.
dθCarbon (C)Calcium (Ca)Potassium (K)
Isotropic ModelAnisotropic ModelIsotropic ModelAnisotropic ModelIsotropic ModelAnisotropic Model
1500.896 *0.538 *0.531 *0.607 *0.963 *0.838 *
90°0.942 *0.838 *0.629 *0.864 *0.972 *0.945 *
3000.657 *0.257 *0.168 *0.248 *0.869 *0.538 *
90°0.781 *0.591 *0.320 *0.605 *0.899 *0.799 *
4500.346 *0.091 *0.061 *0.093 *0.715 *0.275 *
90°0.537 *0.404 *0.192 *0.404 *0.784 *0.621 *
6000.121 *−0.0420.040 *0.042 *0.542 *0.186 *
90°0.327 *0.267 *0.136 *0.277 *0.661 *0.498 *
7500.008−0.096 *0.029 *0.023 *0.359 *0.147 *
90°0.168 *0.158 *0.089 *0.180 *0.526 *0.390 *
Distance class (d); direction (θ); and *: significant values of Moran’s directional spatial autocorrelation index, at 5% probability (p-value < 0.05) by the pseudo-significance test.
Disclaimer/Publisher’s Note: The statements, opinions and data contained in all publications are solely those of the individual author(s) and contributor(s) and not of MDPI and/or the editor(s). MDPI and/or the editor(s) disclaim responsibility for any injury to people or property resulting from any ideas, methods, instructions or products referred to in the content.