Abstract
Artificial neural networks are powerful tools for data analysis, particularly in the context of highly nonlinear regression models. However, their utility is critically limited due to the lack of interpretation of the model given its black-box nature. To partially address the problem, the paper focuses on the important problem of feature selection. It proposes and discusses a statistical test procedure for selecting a set of input variables that are relevant to the model while taking into account the multiple testing nature of the problem. The approach is within the general framework of sensitivity analysis and uses the conditional expectation of functions of the partial derivatives of the output with respect to the inputs as a sensitivity measure. The proposed procedure extensively uses the bootstrap to approximate the test statistic distribution under the null while controlling the familywise error rate to correct for data snooping arising from multiple testing. In particular, a pair bootstrap scheme was implemented in order to obtain consistent results when using misspecified statistical models, a typical characteristic of neural networks. Numerical examples and a Monte Carlo simulation were carried out to verify the ability of the proposed test procedure to correctly identify the set of relevant features.
1. Introduction
Feedforward artificial neural networks (ANNs) are widely used and well-established tools for modelling (possibly) highly nonlinear, complex relationships between a set of inputs and a set of outputs. A large part of the literature highlights their advantages, especially in terms of predictive accuracy and flexibility with respect to more traditional, alternative modelling strategies.
Under very general conditions, ANNs provide an arbitrarily accurate approximation of an unknown function of interest. Furthermore, within particular classes of functions, the form of approximation does not suffer the so-called “curse of dimensionality” of being less sensitive to the increasing dimensions of the data space. Therefore, they may deliver good predictive accuracy [1], along with the ability to implicitly detect complex nonlinear relationships between dependent and independent variables without a strong theoretical framework.
However, the complexity of ANNs hinders obtaining information on how the model uses the input variables to predict the target. In other words, despite the good properties of ANN models, they suffer from a lack of interpretability, since the relationship-related information of data and models is hidden in these systems, effectively transforming them into black boxes. Although such neural modelling strategies are routinely applied to many complex problems, they are considered to be unable to provide much insight into the analysis of the underlying system. In particular, the black-box nature of ANNs greatly limits their usefulness, complicating interpreting and identifying which variables (predictors) are the most important and related to the output. The problem is the hyperparameterized structure of ANNs, which creates complex functions from the input that can approximate an observed outcome with minimal error. These issues require rendering systems explainable, turning the black box into a white box, and allowing for a transparent exploration of the various aspects of the underlying relationships captured by the model.
This significant shortcoming of neural-network modelling methods is the focus of research in many studies on the topic, especially in the applicative context. Recently, in [2], ANNs were employed to predict clinical outcomes, and some tools were introduced to facilitate a better understanding of the model. The authors in [3] introduced a variant of the traditional ANN to render the open-box learning network transparent when applied to predict bubble-point pressure from a pressure–volume–temperature dataset.
Finding methods for extracting information on how input variables affect the response variable is a recurring topic of research in neural networks. That problem can be approached in the general context of global sensitivity analysis, frequently aimed to analyze the influence of input variables or factors in both in machine and statistical learning, and to assess their relative importance in determining the value of an assigned output variable (see [4,5] and references therein). In this context, identifying relevant features can improve the estimated models’ generalized performance, and can give a better understanding and insights to the black-box nature of the model.
Various proposed approaches can be grouped into five broad classes.
The first class includes methods that measure variable importance by using some functions of neural network weights considering both their magnitude and their sign [6]. However, the number of weights in a neural network can be very large and even huge, somewhat complicating computation. More importantly, single weights have no clear interpretation, and different weight configurations might lead to the same network output, hindering their usage for measuring variable importance.
The second group includes approaches based on forward stepwise addition or backward stepwise elimination, where an input neuron is included or excluded along with its weights. An appropriate metric can be used to highlight that effect by measuring the relative importance of the corresponding input [7]. These methods are computationally demanding and might produce different results depending on the order in which the inputs are included in or excluded from the training process. Moreover, the dependence of the final result from the initial training conditions of each model may negatively affect the overall procedure.
The third group includes approaches based on some sieve interpretable model-agnostic explanations. The behavior of a complex neural network model is locally approximated with a simpler and more interpretable model, such as a linear regression or a decision tree model [8]. Sieve approximators and local linearization deliver a measure of the input variable importance just in specific regions of the dataset without giving any insight on the quantitative importance of a given variable for the entire dataset.
The fourth group includes input perturbation methods where a small amount of white noise is added to each input variable while keeping other inputs constant. The importance of each input variable is measured by the resulting change in a proper chosen error metric [7].
The last group includes approaches where sensitivity analysis is based on partial derivatives. They perform sensitivity analysis by computing the partial derivatives of ANN outputs with regard to input neurons evaluated on samples of the training dataset (see [9,10,11,12,13,14,15,16]).
Global sensitivity based on partial derivatives may overcome the drawbacks of other approaches. In this case, the effect of each input on the output is calculated in both magnitude and sign, taking into account the values of optimal connection weights, activation functions, and the values of each input. By using the complete dataset and the estimated neural network model, the effect of the input variables in the response is calculated for real values of the data, avoiding information loss due to considering just a subsample of the data, a subset of the weights, or the use of a different type of local sieve approximators. The partial derivatives can be considered to be a more robust diagnostic tool since they depend on the capability of the neural network model in predicting the output. In other words, if an ANN can accurately predict the output, the partial derivatives of the output with respect to each input remain unchanged regardless of both training conditions and the topology of the network [2].
The aim of the paper is to propose and discuss a statistical procedure for extracting information on how the input features of an ANN model affect the response variable. The approach from a strong inferential statistical perspective allows for the identification of a set of relevant variables and gives some insights on the back-box nature of the ANN model. The approach uses as a sensitivity measure, the conditional expectation of the squared partial derivatives of the output with respect to the inputs. It is based on a joint statistical test for the selection of a relevant set of input variables, and it extensively uses bootstrap for the approximation of test statistic distributions under the null. As a side product, the same bootstrap distribution can be used for the construction of confidence intervals for the average absolute impact of the inputs on the output for those variables that had been identified as relevant. As a resampling scheme, we propose using the pair bootstrap since it delivers consistent results in a regression setup under general assumptions. This is an essential requirement for neural networks that are intrinsically misspecified statistical models.
The paper is organized as follows. Section 2 describes the structure of the data-generating process and introduces the considered neural network model Section 3 discusses the proposed multiple testing procedure and the bootstrap resampling scheme for the inference on the input sensitivity measures. Section 4 reports the results of some numerical examples and a small Monte Carlo experiment. Some remarks close the paper.
2. Neural Networks for Nonlinear Regression Models
Let be a random vector of order with joint distribution , where Y denotes the variable of interest, and is a vector of order d of explanatory variables with marginal distribution . The probabilistic relationship between and Y is completely summarized by the conditional probability law of Y given . Certain aspects of that conditional probability law play a crucial role in the application. In particular, conditional expectation gives the value of Y that is realized “on average”, given a particular realization for . Whenever exists, it can solely be represented as a function of , that is,
for some mapping .
The expected value for Y, given that we observe a realization of , is . This value is only correct on average. The actual realization of Y almost always differs from . We can define a random error term as . Since , we can also write
where unknown deterministic regression function is continuously differentiable and embodies the systematic part of the stochastic relation between and Y and . Function is the natural object of interest in many applications. By the definition of and by the properties of conditional expectation, it follows that . That is, the average error term given any realization of is zero. As usual, we further assumed that .
Regression function can be approximated by using neural networks with a single output and additive nodes, clarifying what is actually learned by the artificial neural networks in a nonlinear regression framework. The class of used ANNs is defined as:
with:
where , m is the hidden layer size, is a monotone, bounded, differentiable, real function with non-negative derivative at each point (sigmoidal activation function), are d dimensional vectors of weights for the connections between input layer and hidden layer, are the weights of the link between hidden layer and output, are the bias terms of the hidden neurons. Network weights are restricted here to lie in a compact set of finite dimension given by total number of weights .
Let , with a random sample of size n. Once the neural network topology is fixed, the estimation of the network weights (learning) can be obtained as:
where is a proper chosen loss function.
Under general regularity conditions, vector exists and converges almost surely to , given by:
if the integral exists and the optimization problem has a unique solution vector interior to . This latter condition is necessary to avoid numerous distinct weight vectors yielding identical network outputs, which could be a severe challenge when dealing with this kind of model. However, several authors [17] provided sufficient conditions to ensure uniqueness of in a suitable parameter space for specific network configurations.
Generally, the stability of the network solution can be improved by considering a regularized version of the optimization problem (3)
where is the -norm, and is a regularization parameter called weight decay, as it forces weights to decay towards zero. Larger weight values of the ANN are more penalized if the value of is large. Similarly, for a smaller value of , the regularization effect is smaller. This parameter is usually fixed by cross-validation.
Aadvantages related to the use of ANNs are that, with sufficiently many hidden units and properly adjusted parameters, they can approximate any regular function arbitrarily well. Particularly, in [18], the authors gave conditions ensuring that multilayer feedforward networks with a single hidden layer and an appropriately smooth hidden layer activation function are capable of an arbitrarily accurate approximation to an arbitrary function and its derivatives. Moreover, when compared to other nonparametric approaches, ANNs are less sensitive to the “curse of dimensionality”, allowing for applications of that modelling strategy even to sparse problems in a high dimension.
However, despite their proven theoretical capabilities of nonparametric universal approximation for a general class of nonlinear regression functions, ANNs face a challenging issue related to the specification of the network topology in accordance with the underlying structure of the data. This involves the specification of the size and design of the input layer, the size of the hidden layer, and signal processing within nodes (i.e., the choice of the activation function).
In this context, popular approaches are pruning, stopped training, and regularization. However, these techniques generally focus on single weights rather than on single variables, and consequently suffer from a lack of interpretability of which variable is relevant to the model. Moreover, as already highlighted, they are often routinely applied and computationally justified. They are often inserted into the “black-box” model without any possibility again to evaluate the relevance and the influence of a variable on the model. Instead, it would be interesting to look at the choice of the network topology by including it in global sensitivity analysis.
To address the problem in the context of network design, it is helpful to underline the different roles in the model of explanatory variables and hidden layer neurons. The former relates to explanatory variables valid for the identification and interpretation of the model; the latter, apparently without significance, plays the same role of smoothing parameters in other nonparametric techniques, taking into account the trade-off between bias and variability.
Here, we focus on input variables and propose the expectation of some function of the derivatives of the ANN as a relevance measure to identify those inputs that play a relevant role on the output. Pruning the estimated neural network model of those irrelevant inputs improves the capability of the neural network to model the relationship between response and explanatory variables, and consequently the quality of information that can be extracted from the model. Moreover, the use of partial derivatives resembles the usual approach used in linear and nonlinear parametric models, where they are expressed as a function of the parameters, greatly improving the general interpretability of the model.
However, using the partial derivatives method has some disadvantages that cannot be ignored. First, computing derivatives is a time-consuming process, especially when considering complex networks with many hidden nodes and layers. Computing time grows with the size of the network and the size of the sample used for training. Second, input variables need to be normalized when using this approach, since the scale of each variable may influence the value of the partial derivatives, producing possibly misleading results. However, normalization steps are routinely used in ANN modelling in order to improve the training process, so they are not specifically connected to the sensitivity analysis step.
Variable selection procedures based on partial derivatives were proposed and discussed in a time series context in [11,12,15] using subsampling as a resampling scheme. In this paper, we further explore those ideas in the more general framework of sensitivity analysis and interpretable or explainable machine learning.
3. Bootstrap Inference for Input Sensitivity Measures
Function g is unknown, but we equivalently investigate hypotheses
since f is known, and can be closely approximated.
Function is a random variable, and a general formulation for any sensitivity index derived from it is given by:
where is a proper chosen function, and is the expected value regarding probability measure of the vector of the explanatory variables. Asymptotic results can be established by assuming that function is continuously measurable and differentiable of order 2, as in [11]. Those sufficient conditions are fulfilled if (squared average derivative) and (average derivative). The mean squared derivative should be preferred to the mean derivative. It does not retain any information on the sign of the effect of the predictor on the output, but it avoids any cancelation effects that might be due to compensation on average between negative and positive values of the derivatives. As an alternative, to prevent cancelation effects, the absolute average derivative () might be considered as well. Even if it does not fulfil the previous assumption, Monte Carlo simulation experiments show that it delivers good results in finite samples, comparable to those obtained by using .
Sensitivity Index (8) can be used for variable selection. On average, variable has no effect on output Y (i.e., it is not relevant to the model) if:
Given estimated network weights , an estimate of relevance measure is given by:
so including the complete network structure, all observations, and all network weights.
Any further inference step requires the knowledge of the sampling distribution of , . That is, for ,
An asymptotic approximation can be derived under appropriate regularity conditions on function , loss function , and the data-generating process (see [9,11]). However, given the analytic and probabilistic complexity of the neural network estimator, it is difficult to derive and use for inference purposes. Here, as an alternative, we propose the use of pair bootstrap (see [19]) that can be easily implemented when applied to neural networks. This resampling scheme renders the overall procedure robust with respect to model misspecification, an important point since neural networks are intrinsically misspecified models. Moreover, it is able to deliver consistent results under general assumptions when applied to nonlinear data structures. Unlike model-based bootstrap techniques, such as the residual and wild bootstrap, the pair bootstrap consists of bootstrapping pairs or tuples of the dependent and explanatory variables in the regression model.
In particular, the pair bootstrap runs as follows:
- Let , be an i.i.d. sample from set of tuples .
- Select m, the hidden layer size, and obtain the bootstrap counterpart of the neural network weights:
- Obtain as the bootstrap counterpart of , with .
- The probabilistic law of , , d, given observed sample , can be used to approximate the unknown sampling distribution of , , let’s say .
As usual, bootstrap distribution can be approximated by Monte Carlo simulations, as detailed in Algorithm 1.
| Algorithm 1 Calculate bootstrap distribution . |
|
Sensitivity measures along with bootstrap distribution can be used in a formal testing procedure. Let us assume that , in order to avoid any cancellation effect. The hypothesis that a given set of variables has no effect on Y can be formulated in a multiple testing framework as:
where , with symbol denoting the use of a mean square function to summarize sensitivities.
Each null in (13) can be tested by using statistic
and vector is a consistent estimator of unknown parameter vector . Large values of the test statistics indicate evidence against hypothesis .
The problem here is the large number of hypotheses to test, and the problem to produce true rejections is the main issue. In this context of data snooping, when a significant adjustment for multiple-hypothesis testing is necessary, the usual approach is to control (asymptotically) the familywise error rate (FWE), the probability of producing one or more false rejections. Several approaches are proposed in the literature, ranging from simple techniques such as the Bonferroni method or Holms’ stepwise procedure to more complex approaches that greatly use resampling techniques, such as the Reality Check [20] and the StepM procedure [21,22]. The first two procedures are too conservative since they do not take into account the dependence structure of individual p-values, while resampling-based approaches are more suitable for the joint comparison of multiple misspecified models. However, controlling the FWE could be too stringent when the number of hypotheses is vast, rendering true rejections very difficult. In this context, it could be more appropriate to control the probability of producing k or more false rejections for some integer k greater than or equal to 1 (k-FWE). Here, we use the k-StepM procedure proposed in [23], which is suitable for the joint comparison of several unspecified models while keeping the k-FWE under control.
The procedure runs as follows.
Relabel the hypothesis from to in redescending order with respect to the value of test statistics , that is . Define where and is the k-th largest value of with .
The step-down procedure begins by testing the joint null hypothesis that all hypotheses are true. This hypothesis is rejected if is large; otherwise, all hypotheses are accepted. In other words, in the first step, the procedure constructs a rectangular joint confidence region for vector , with nominal joint coverage probability . The confidence region is of the form
where common value is chosen to ensure proper joint (asymptotic) coverage probability. That is, . If a particular individual confidence interval does not contain zero, corresponding null hypothesis is rejected.
If the first relabeled hypotheses are rejected in the first step, then hypotheses remain corresponding to labels . In the second step, a rectangular joint confidence region for vector is constructed with nominal joint coverage probability again. The new confidence region has the form
where common constant is chosen to ensure proper joint (asymptotic) coverage probability. That is,
Again, if a particular individual confidence interval does not contain zero, corresponding null hypothesis is rejected.
If no further hypotheses are rejected in the second step, the procedure stops. Otherwise, the stepwise process continues until no further hypotheses are rejected.
The critical values in each step of the multiple testing scheme can be estimated using the previously described pair bootstrap procedure, as detailed in Algorithm 2.
| Algorithm 2 Calculate with pair bootstrap. |
|
The procedure can easily be modified for different choices of function with some caution.
If is the identity function, , and is the mean sensitivity, that is, the arithmetic mean of first-order derivatives of the target variable with respect to the input variable. This is a popular sensitivity measure used in many applications. In that case, the testing procedure could in principle easily be adapted by considering two-sided alternatives and including absolute values of the test statistics and of the bootstrap replicates. However, if cancellation effects arise, the test procedure may be misleading.
The testing procedure remains basically the same, fully effective for any other function h that avoids cancellation effects. A notable example is the mean absolute sensitivity measure where . Here, sensitivity is given by and estimated as
Once the set of relevant variables is detected, a confidence interval for the average absolute effect of a given input on the output can be easily derived, exploiting the same bootstrap distribution used for the multiple testing procedure. More specifically, a confidence interval of nominal level for is given by
where is the quantile of the bootstrap distribution computed as ECDF of , . The sign of the average impact is deduced by the sign of .
4. Numerical Examples and Simulations
To investigate and evaluate the performance and ability of the bootstrap procedure to give insight into the black-box nature of ANNs from an explainable machine-learning perspective, some numerical examples and a small Monte Carlo simulation were implemented.
As the data generation process, three different models were used to generate synthetic data.
Model M1 was introduced in [24], where Y depends on 10 explicative variables , but just variables are relevant to the model. The specification is
where is the logistic activation function, is a vector of multivariate Gaussian random variables with zero mean, unit variance and pairwise correlation equal to 0.5, and is Gaussian with zero mean and variance equal to 0.7. This gives a signal-to-noise ratio roughly equal to 1.2. An ANN with a logistic activation function, four input neurons, and two hidden neurons is a correctly specified model, and no misspecification is present.
Model M2 was introduced in [25], where Y depends on 10 explicative variables , but just variables are relevant to the model. The specification is
where is randomly drawn from the unit hypercube. The regression function is radially symmetric in these three variables, and is a Gaussian random variable with zero mean and variance equal to 0.7. The number of the neurons in the hidden layer is unknown, so the neural network model is by construction misspecified.
Model M3 was introduced in [26], where Y depends on 10 explicative variables , but just variables are relevant. The specification is
where all explicative variables are randomly drawn from the unit hypercube, and is a Gaussian random variable with zero mean and variance equal to .
Those three models were nonparametrically approximated with neural networks. For the training step, since the appropriate topology of the networks tends to not be too complex, the optimization problem was treated as a nonlinear least-squares problem and solved with a Broyden–Fletcher–Goldfarb–Shanno algorithm, which is more efficient and requires little intervention from the user. That may be seen as an alternative learning process with respect to the backpropagation algorithm, a first-order gradient method for parameter optimization that suffers from slow convergence, local minima problems, and high sensitivity to the choice of tuning parameters (learning rate, momentum, etc.). For the resampling step, we used a local bootstrap scheme where, in each bootstrap, replicating the training is initialized by using the estimated values of the weights. That strategy allows for more efficient and stable convergence to the solution in each bootstrap run. For all cases, hidden layer size and weight decay were identified by using 10-fold cross-validation, a very effective approach for neural network topology design. Sample sizes were fixed at and .
In Table 1 we report the result of the -FWE testing procedure with and for a dataset generated from Model M1 (Tibishirani). Here, the hidden layer size was known, so just weight decay was selected via 10-fold cross-validation. The testing procedure clearly identified the true relevant variables set for both and in just one step. A plot of the sequential -FWE test procedure, that is, a plot of the joint confidence regions in each step, is reported in the left panels of Figure 1 and Figure 2. In Table 2, we report values of mean sensitivity and mean absolute sensitivity, and the limits of the bootstrap confidence intervals with nominal level . Confidence intervals are only reported for the relevant variables and depicted in the right panels of Figure 1 and Figure 2, where different colors identify the type of impact (positive or negative) that the given predictor had on the dependent variable, identified with the sign of the corresponding mean sensitivity statistic.

Table 1.
Model M1 (Tibishirani), Test statistic , -FWE rejection step (Step Rej), lower limits of bootstrap confidence region () with replicates and nominal level , for and observations.
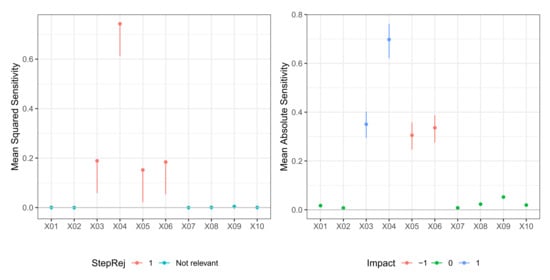
Figure 1.
Model M1 (Tibishirani). Case . (left) Values of test statistic and critical values . (right) Values of mean absolute sensitivity along with bootstrap confidence limits with bootstrap replicates and nominal level for those variable that are relevant to the model.
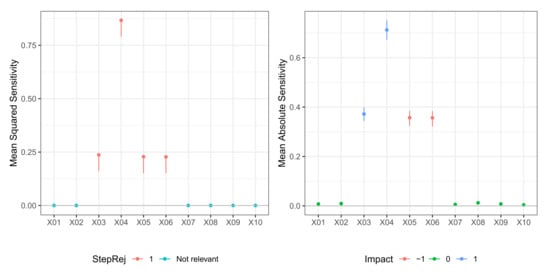
Figure 2.
Model M1 (Tibishirani). Case . (left) Values of test statistic and critical values . (right) Values of mean absolute sensitivity along with bootstrap confidence limits with bootstrap replicates and nominal level for relevant variables to the model.

Table 2.
Model M1 (Tibishirani), mean absolute sensitivity (MAS), mean sensitivity (MS), lower (Low) and upper (Up) bootstrap confidence interval limits with replicates and nominal level , for , and observations. For those variables that were not relevant, no confidence limits are reported.
In Table 3, we report the result of the -FWE testing procedure with and for a dataset generated from Model M2 (De Vleaux). Here, the number of neurons in the hidden layer was not known, so both hidden layer size and weight decay were selected via 10-fold cross-validation. In this case, the testing procedure could correctly identify the true relevant variables set for both and in just one step. A plot of the sequential -FWE test procedure is reported in the left panels of Figure 3 and Figure 4. In Table 4, we report values of mean sensitivity and mean absolute sensitivity, and the limits of the bootstrap confidence intervals with nominal level . Again, confidence intervals are only reported for the relevant variables and depicted in the right panels of Figure 3 and Figure 4. There was some cancellation effect on the mean sensitivity measures with values of the statistic very close to zero. However, both mean absolute sensitivity and mean squared sensitivity correctly identified the relevant variables. In any case, in different datasets, the sign of metrics very close to zero does not deliver unambiguous information.

Table 3.
Model M2 (De Vleaux), Test statistic , -FWE rejection step (Step Rej), lower limits of the bootstrap confidence region () with replicates and nominal level , for , and observations.
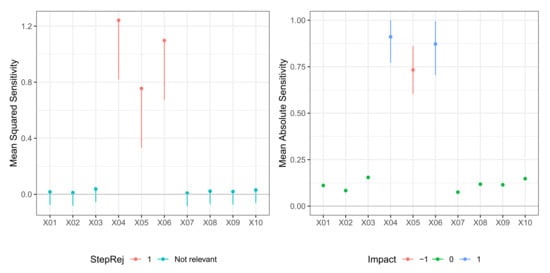
Figure 3.
Model M2 (De Vleaux). Case . (left) Values of test statistic and critical values . (right) Values of mean absolute sensitivity along with bootstrap confidence limits with bootstrap replicates and nominal level for relevant variables to the model.
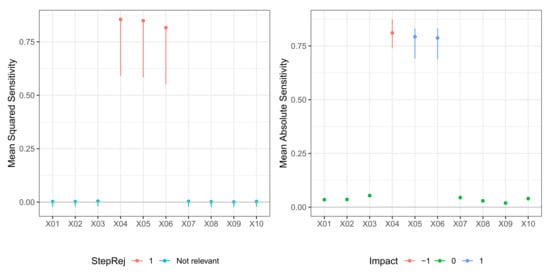
Figure 4.
Model M2 (De Vleaux). Case . (left) Values of test statistic and critical values . (right) Values of mean absolute sensitivity along with bootstrap confidence limits with bootstrap replicates and nominal level for relevant variables to the model.

Table 4.
Model M2 (De Vleaux), mean absolute sensitivity (MAS), mean sensitivity (MS), lower (Low) and upper (Up) bootstrap confidence interval limits with replicates and nominal level , for , and observations. For those variables that were not relevant, no confidence limits are reported.
In Table 5, we report the result of the -FWE testing procedure with and for a dataset generated from Model M3 (Friedman). Here, the number of neurons in the hidden layer was again not known, so both hidden layer size and weight decay were selected via 10-fold cross-validation. In this case, the test procedure could correctly identify the true relevant variables set for both and , but it required two steps for . A plot of the sequential -FWE testing procedure is reported in the left panels of Figure 5 and Figure 6. In Table 6, we report the values of mean sensitivity and mean absolute sensitivity, and the limits of the bootstrap confidence intervals with nominal level . Again, confidence intervals are only reported for the relevant variables and depicted in the right panels of Figure 5 and Figure 6. There was some cancellation effect on the mean sensitivity measures with values of the statistic very close to zero. However, both mean absolute sensitivity and mean squared sensitivity correctly identified the relevant variables. In any case, in different datasets, the sign of those metrics very close to zero does not deliver unambiguous information.

Table 5.
Model M3 (Friedman), Test statistic , -FWE rejection step (Step Rej), lower limits of the bootstrap confidence region () with replicates and nominal level , for , and observations.
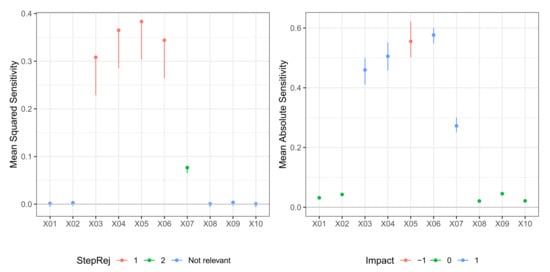
Figure 5.
Model M3 (Friedman). Case . (left) Values of test statistic and critical values . (right) Values of mean absolute sensitivity along with bootstrap confidence limits with bootstrap replicates and nominal level for relevant variables to the model.
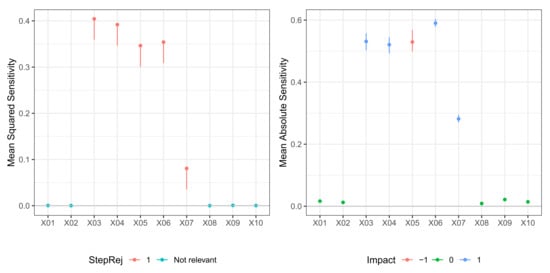
Figure 6.
Model M3 (Friedman). Case . (left) Values of test statistic and critical values . (right) Values of mean absolute sensitivity along with bootstrap confidence limits with bootstrap replicates and nominal level , for relevant variables to the model.

Table 6.
Model M3 (Friedman), mean absolute sensitivity (MAS), mean sensitivity (MS), lower (Low) and upper (Up) bootstrap confidence interval limits with replicates and nominal level , for , and observations. For those variables that were not relevant, no confidence limits are reported.
A small Monte Carlo simulation was conducted to evaluate the impact of the choice of hidden layer size and of the value of weight decay on the performance of the input selection test procedure. The experimental design considered three data generating processes (Models M1, M2, and M3), two sample sizes ( and ), seven values for the hidden layer sizes (), and three values for weight decay ().
In Figure 7, we report the percentage of rejections for each variable in set for Model M1. The ideal plot is the one where those percentages are equal to 1 for those variables that are relevant to the model (), and equal to 0 for those variables that are irrelevant. For (the correct number of neurons in the DGP), the procedure delivered excellent results for both and in all considered weight-decay cases. When the hidden layer size increases, some problems might arise due to some overfitting effect, especially for smaller samples. However, by increasing the weight decay, and thereby by reducing overfitting, the good properties of the input selection testing procedure are recovered. Therefore, using a proper value of weight decay renders the overall procedure somewhat robust with respect to the choice of the hidden layer size. That is quite an interesting point to address, especially when comparing the neural network estimator to other nonparametric regression estimators, where the choice of the smoothing parameter is crucial.
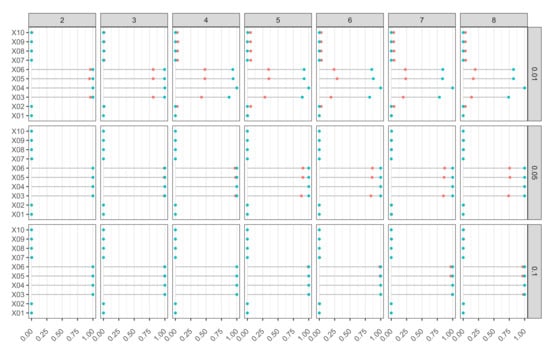
Figure 7.
Model M1 (Tibishirani). Proportion of rejections of null hypothesis based on k-FWE test with for 10 input variables, different combinations of hidden layer sizes (), and weight-decay values (). Nominal FWE was fixed at , 500 Monte Carlo runs, bootstrap replicates, and (in red) and (in blue).
In Figure 8, we report the percentage of rejections for each variable in set for Model M2. The ideal plot is one where those percentages are equal to 1 for those variables that are relevant to model , and equal to 0 for those variables that are irrelevant. In the case of serious underfitting (), the procedure clearly failed to correctly identify the set of relevant variables, even by increasing both sample size and weight-decay value. By increasing the hidden layer size, there were several combinations of m and that produced excellent results, confirming the robustness of the input identification testing procedure by controlling k-FWE. All relevant variables had a radial structure, so the mean derivatives were close to zero due to cancellation effects. That may hinder their identification in presence of heavy underfitting or overfitting. However, underfitting can be easily solved by increasing the hidden layer size, while overfitting can be avoided using several strategies. The use of a penalized training function is just one example among many alternatives.
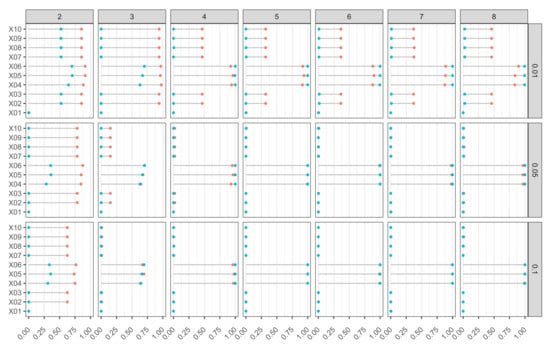
Figure 8.
Model M2 (DeVleaux). Proportion of rejections of null hypothesis based on k-FWE test with for 10 input variables, different combinations of hidden layer sizes (), and of weight-decay values (). Nominal FWE was fixed at , 500 Monte Carlo runs, bootstrap replicates, and (in red) and (in blue).
In Figure 9, we report the percentage of rejections for each variable in set for Model M3. The ideal plot is one where those percentages are equal to 1 for those variables that are relevant to model , and equal to 0 for those variables that are irrelevant. Again, the most difficult variable to identify was the one with a radial structure (). In all other cases, the procedure again appeared to be quite robust, delivering excellent performance for several combinations of m and .
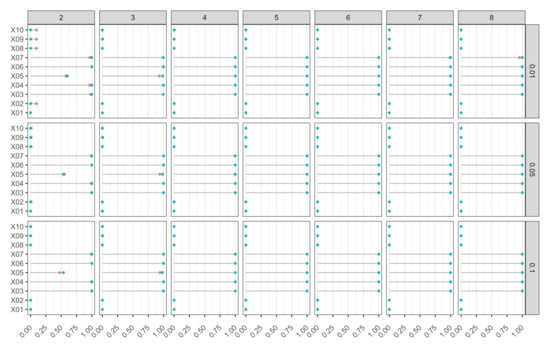
Figure 9.
Model M3 (Friedman). Proportion of rejections of null hypothesis based on k-FWE test with , for 10 input variables, different combinations of hidden layer sizes (), and weight-decay values (). Nominal FWE was fixed at , 500 Monte Carlo runs, bootstrap replicates, and (in red) and (in blue).
5. Concluding Remarks
Explainable machine learning is the focus of an increasing number of papers in both theoretical and applied research. In this framework, we proposed and discussed a procedure for analyzing the influence and relative importance of input variables in neural network modelling. In the general context of sensitivity analysis, the proposed approach identifies the number and the type of input variables by using a solid inferential statistical perspective based on a formal test procedure. It addresses the problem of data snooping that might arise when a dataset is used more than once for inference and model selection. Moreover, the approach extensively uses a pair bootstrap resampling technique to overcome analytical and probabilistic difficulties related to estimating the sampling distribution of the involved test statistics. Simulated datasets and a Monte Carlo study showed that the overall procedure delivers good results and appears to be robust for model misspecification, network topology identification, and tuning-parameter choice. The proposed method can be extended to time-series data when considering pure nonlinear autoregressive dependence structures. In this latter case, the pair bootstrap can deliver consistent estimators for the involved sampling distribution in the inferential steps [27]. This is part of a different line of research that is still under investigation.
Author Contributions
Conceptualization, M.L.R. and C.P.; methodology, M.L.R. and C.P.; writing—original draft preparation, M.L.R. and C.P.; writing—review and editing, M.L.R. and C.P. All authors have read and agreed to the published version of the manuscript.
Funding
This research received no external funding.
Institutional Review Board Statement
Not applicable.
Informed Consent Statement
Not applicable.
Data Availability Statement
Not applicable.
Acknowledgments
We would like to thank three anonymous referees for their careful reading and valuable comments and suggestions that greatly improved the final version of the paper.
Conflicts of Interest
The authors declare no conflict of interest.
References
- Hastie, T.; Tibishirani, R.; Frieman, J. The Elements of Statistical Learning, 2nd ed.; Springer: Berlin/Heidelberg, Germany, 2008. [Google Scholar]
- Zhang, Z.; Beck, M.W.; Winkler, D.A.; Huang, B.; Sibanda, W.; Goyal, H. Opening the black box of neural networks: Methods for interpreting neural network models in clinical applications. Ann. Translactional Med. 2018, 6, 216–226. [Google Scholar] [CrossRef] [PubMed]
- Wood, D.A.; Choubineh, A. Transparent open-box learning network and artificial neural network predictions of bubble-point pressure compared. Petroleum 2020, 6, 375–384. [Google Scholar] [CrossRef]
- Hart, J.L.; Bessac, J.; Constantinescu, E.M. Global Sensitivity Analysis for Statistical Model Parameters. SIAM/ASA J. Uncertain. Quantif. 2019, 7, 67–92. [Google Scholar] [CrossRef] [Green Version]
- Naik, D.L.; Kiran, R. A novel sensitivity-based method for feature selection. J. Big Data 2021, 8, 1–16. [Google Scholar] [CrossRef]
- Olden, J.D.; Joy, M.K.; Death, R.G. An accurate comparison of methods for quantifying variable importance in artificial neural networks using simulated data. Ecol. Model. 2004, 178, 389–397. [Google Scholar] [CrossRef]
- Gevrey, M.; Dimopoulos, I.; Lek, S. Review and comparison of methods to study the contribution of variables in artificial neural network models. Ecol. Model. 2003, 160, 249–264. [Google Scholar] [CrossRef]
- Ribeiro, M.T.; Singh, S.; Guestrin, C. Why Should I Trust You? Explaining the Predictions of Any Classifier. arXiv 2016, arXiv:1602.04938. [Google Scholar]
- White, H.; Racine, J. Statistical inference, the bootstrap, and neural-network modeling with application to foreign exchange rates. IEEE Trans. Neural Netw. 2001, 12, 657–673. [Google Scholar] [CrossRef]
- Refenes, A.P.; Zapranis, A.D. Neural model identification, variable selection and model adequacy. J. Forecast. 1999, 18, 299–332. [Google Scholar] [CrossRef]
- La Rocca, M.; Perna, C. Variable selection in neural network regression models with dependent data: A subsampling approach. Comput. Stat. Data Anal. 2005, 48, 415–429. [Google Scholar] [CrossRef]
- La Rocca, M.; Perna, C. Neural network modeling by subsampling. In Computational Intelligence and Bioinspired Systems; Cabestany, J., Prieto, A., Sandoval, F., Eds.; Lecture Notes in Computer Science; Springer: Berlin/Heidelberg, Germany, 2005; p. 3512. [Google Scholar]
- Giordano, F.; la Rocca, M.; Perna, C. Input variable selection in neural network models. Commun. Stat.-Theory Methods 2014, 43, 735–750. [Google Scholar] [CrossRef]
- La Rocca, M.; Perna, C. Designing neural networks for modeling biological data: A statistical perspective. Math. Biosci. Eng. 2014, 11, 331. [Google Scholar] [CrossRef] [PubMed] [Green Version]
- La Rocca, M.; Perna, C. Model selection for neural network models: A statistical perspective. In Computational Network Theory: Theoretical Foundations and Applications; Dehmer, M., Emmert-Streib, F., Pickl, S., Eds.; Wiley-VCH Verlag GmbH & Co. KGaA: Weinheim, Germany, 2015; pp. 1–27. [Google Scholar]
- Pizarroso, J.; Portela, J.; Muñoz, A. NeuralSens: Sensitivity analysis of neural networks. arXiv 2020, arXiv:2002.11423. [Google Scholar]
- Ossen, A.; Rügen, S.M. An analysis of the metric structure of the weight space of feedforward networks and its application to time series modelling and prediction. In Proceedings of the 4th European Symposium on Artificial Neural Networks (ESANN96), Bruges, Belgium, 24–26 April 1996; pp. 315–322. [Google Scholar]
- Hornik, K.; Stinchcombe, M.; White, H. Universal approximation of an unknown mapping and its derivatives using multilayer feedforward networks. Neural Netw. 1990, 3, 551–560. [Google Scholar] [CrossRef]
- Freedman, D.A. Bootstrapping regression models. Ann. Stat. 1981, 9, 1218–1228. [Google Scholar] [CrossRef]
- White, H. A reality check for data snooping. Econometrica 2000, 68, 1097–1126. [Google Scholar] [CrossRef]
- Romano, J.P.; Wolf, M. Exact and Approximate Stepdown Methods for Multiple Hypothesis Testing. J. Am. Stat. Assoc. 2005, 100, 94–108. [Google Scholar] [CrossRef] [Green Version]
- Romano, J.P.; Wolf, M. Stepwise multiple testing as formalized data snooping. Econometrica 2005, 73, 1237–1282. [Google Scholar] [CrossRef] [Green Version]
- Romano, J.P.; Shaikh, A.M.; Wolf, M. Formalized data snooping based on generalized error rates. Econom. Theory 2008, 24, 404–447. [Google Scholar] [CrossRef] [Green Version]
- Tibshirani, R. A comparison of some error estimates for neural network models. Neural Comput. 1996, 8, 152–163. [Google Scholar] [CrossRef]
- De Vleaux, R.D.; Schumi, J.; Schweinsberg, J.; Ungar, L.H. Prediction intervals for neural networks via nonlinear regression. Technometrics 1998, 40, 273–282. [Google Scholar] [CrossRef]
- Friedman, J.H. Multivariate adaptive regression splines. Ann. Stat. 1991, 19, 1–67. [Google Scholar] [CrossRef]
- Gonçalves, S.; Kilian, L. Bootstrapping autoregressions with conditional heteroskedasticity of unknown form. J. Econom. 2004, 123, 89–120. [Google Scholar] [CrossRef] [Green Version]
Publisher’s Note: MDPI stays neutral with regard to jurisdictional claims in published maps and institutional affiliations. |
© 2022 by the authors. Licensee MDPI, Basel, Switzerland. This article is an open access article distributed under the terms and conditions of the Creative Commons Attribution (CC BY) license (https://creativecommons.org/licenses/by/4.0/).