Abstract
The widely used fitting method of least squares is neither unique nor does it provide the most accurate results. Other fitting methods exist which differ on the metric norm can be used for expressing the total deviations between the given data and the fitted statistical model. The least square method is based on the Euclidean norm L2, while the alternative least absolute deviations method is based on the Taxicab norm, L1. In general, there is an infinite number of fitting methods based on metric spaces induced by Lq norms. The most accurate, and thus optimal method, is the one with the (i) highest sensitivity, given by the curvature at the minimum of total deviations, (ii) the smallest errors of the fitting parameters, (iii) best goodness of fitting. The first two cases concern fitting methods where the given curve functions or datasets do not have any errors, while the third case deals with fitting methods where the given data are assigned with errors.
1. Introduction
The keys to evaluate experimental results—e.g., comparing with results anticipated by theories—requires the right selection of statistical and data analysis techniques. These involve three general types of problems: One problem arises when a function is given analytically by a complicated formula, but we would like to find an alternative approximating function with a simpler form (Figure 1a). The second problem concerns the fitting of the modeled function to a given set of a discrete dataset, but all data points are considered to have large signal-to-noise and inconsiderable errors (Figure 1b). The third problem involves fitting a noisy data set with random errors (Figure 1c).

Figure 1.
Fitting of a modeled function to (a) a more complicated curve, (b) discrete data with low noise and inconsiderable errors, and (c) data with random errors.
For the first problem, we come to the fitting of the statistical modeled function to the set of given fixed function by minimizing the deviations integrated over the whole domain , where the set of the parameters to be fitted and optimized are denoted with {p}. For the second problem, the modeled function is fitted to the data derived from an explicated fixed function , by minimizing the sum of the deviations . Finally, for the third problem, the modeled function is fitted to the data with errors , by minimizing the sum of the normalized deviations . For the integration or sum of the deviations, we use any Lq-normed complete vector space (e.g., see references [1,2,3,4,5,6,7]).
The widely used fitting method of least squares involves minimizing the sum of the squares of the residuals, i.e., the differences between the given fixed and the approximating functions. However, the least square method is not unique. For instance, the absolute deviations minimization method can also be applied. Generally, as soon as the desired norm of the metric space is given, the respective method of minimizing the total deviations can be defined. The least square method is based on the Euclidean norm L2, while the alternative absolute deviations method is based on the Taxicab norm, L1 (see, for example references [5,8]). In general, an infinite number of fitting methods can be used, based on metric spaces induced by Lq norms; these have been studied by references [7,8,9,10,11,12,13,14,15] (see also the applications in references [16,17,18,19,20,21,22,23,24,25,26,27,28]).
Every norm can equivalently define a fitting method, different from any other fitting method based on other norms. Each fitting method is characterized by different: (i) optimal values of the parameters and their errors; (ii) sensitivity, which is given by the scalar curvature near the deviations global minimum; (iii) goodness, which is associated with the estimated Chi-q value, the constructed Chi-q distribution, and the corresponding p-value. All of these values depend strongly on the selection of the q-norm.
Then, we may ask: If the results of each fitting method are strongly dependent on the selection of the Lq-norm, how can we be sure that the widely used method of least squares provides the best results? Instead, we must first employ the criteria for finding the optimal q-norm and the relevant fitting method. Then, the results will be unaffected by systematic errors of mathematical origin.
The purpose of this paper is to improve our understanding and applicability of the Lq-normed fitting methods. In Section 2, we present the method of the Lq-normed fitting. In Section 3, we show the concept of sensitivity of fitting methods that mostly applies in the case of curve fitting. In Section 4, we show the formulation of the error of the optimal fitting parameter values in Lq-normed fitting. In Section 5, we present the case of multi-parametrical fitting (a number of n fitting parameters). Then, in Section 6, we show the method of Lq-normed fitting of data without errors, characterized by a sufficiently high signal-to-noise ratio, while in Section 7, we show the method of Lq-normed fitting of data with errors, measuring the goodness of fitting. Finally, in Section 8 we summarize and discuss the results.
2. General Lq-Normed Fitting Methods
We first consider the uni-parametrical case, i.e., fitting methods with a single fitting parameter. Let the continuous description, where the given fixed function is , while the one-parametrical approximating function or statistical model is . One approach to determining the optimal approximation finding value of involves minimizing the sum of total absolute deviations (TD1):
This is actually equal to the total bounded area, that is, the total sum of the areas bounded between the fixed and the approximating function. Of course, we may also use the traditional method of least squares, which involves minimizing the sum called total square deviations (TD2):
In the general case, the metric induced [7] by the Lq norm for any q ≥ 1, the q-normed Total Deviations function, denoted by TDq(p), between the fixed and the approximating function in the domain D, is given by
The optimal fitting value of the p parameter, , involves minimizing TDq(p), given in Equation (3). This is derived by setting its derivative to zero, TDq΄(p = p*) = 0. For finding the optimal value , we may minimize either TDq(p), TDq1/q(p), or any other monotonic function F[TDq(p)]. As we will see, however, it is the minimum value and curvature of TDq(p) that plays a significant role in detecting the most accurate q-norm for deriving the fitting parameter and its error.
Note that the transition of the continuous to discrete descriptions of the x-values can be set as:
Then, the expression of the total deviations is given by:
where L is the length of domain D, while xres = L/N is the resolution of x-values (finest meaningful x-value).
The analytical expressions of the total deviations TDq(p) near its minimum provide three sets of equations, (i) the value of total deviations at the global minimum A0(q), (ii) the curvature at the global minimum A2(q) (a matrix in multi-parametrical fitting), and (iii) the “normal equations”, whose root is the parameter value at the global minimum, p* (a vector in multi-parametrical fitting).
The expansion of total deviations in terms of p, gives the definite positive quadratic expression:
where its minimum value is
while its curvature is
where the element γ plays a significant role in the case of q = 1,
The optimal value of the fitting parameter, p*, is determined by the root of the normal equation:
where, for all the above, we set , for short.
3. Sensitivity of Fitting Methods
The sensitivity of a fitting method is given by the curvature of the total deviations at the global minimum . The smaller the curvature, the more outspread and flattened the minimum appears, and thus, the fitting is characterized by less sensitivity.
We demonstrate the concept of sensitivity with the following two examples:
- Example-1: The examined functions, with domain , are:
We have a large number of terms M=100 for calculating TDq(p), in order the statistical model V(x;p = 1) to represent the Fourier expansion of f(x) in D. This is true only for p = 1, thus the fitting parameter value must be . We find that TDq(p) near its global minimum is:
In Figure 2a, the functional of total deviations at the global minimum, TDq(p)-A0, is plotted against p-p*, on the same diagram for the norms q = 1, 2, and 3. We observe that the larger the value of q, the more outspread and flattened the minimum, and thus, the fitting is characterized by smaller sensitivity. Figure 2b plots the same quantities but on a log-log scale. As expected, these graphs approach the lines with slopes equal to 2, due to the definite positive quadratic expression in Equation (4). The sensitivity A2 is about an order of magnitude larger between each successive two norms. The curvature coefficient A2 decreases as the q norm increases, leading to the conclusion that the best fitting method, namely the one corresponding to the largest sensitivity, is the one with the taxicab norm (q = 1).
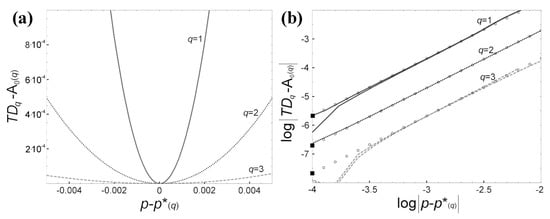
Figure 2.
(a) TDq(p)-A0 is depicted as a function of p-p*, on the same diagram for the values of q = 1 (solid line), 2 (dot line) and 3 (dash line). (b) The same quantities are depicted on log-log scale. The slopes of the asymptotic lines (shown with circular points) are equal to 2. The curvature coefficient A2 decreases as the q norm increases. Indeed, A2 for q = 1 is about one order of magnitude larger than A2 derived for q = 2, which is also about one order of magnitude larger than A2 derived for q = 3 (Modified from reference [7]).
- Example-2: The examined functions are:
with domain , . is the Heaviside step function.
It can be easily shown that the total deviations function TDq(p) equals exactly to
We can rewrite TDq(p) near its minimum, at p* = ½, as follows:
This Taylor expansion gives the definite positive quadratic expression in Equation (6), but all the higher terms, O(p − ½)3, are exactly zero. The curvature A2 measures how abrupt the TD’s variation is near its minimum. The smaller the curvature, then, the more outspread and flattened the minimum. A more flattened minimum is less sensitive, since it leads to an inappreciable variation, and thus, the fitting parameter value at minimum, p*, is detected with a larger error. In particular, the curvature is:
It is apparent that the case of absolute fitting, that is, by using the norm q = 1, is characterized by zero curvature, A2 = 0. Thus, it lacks of sensitivity, and it actually should not be used (the sensitivity of the method becomes finite when considering higher-order terms in the Taylor expansion, but it is orders of magnitude smaller. For more details, see reference [7]). The same problem characterizes the case of uniform fitting, that is, by using the infinity norm, where the sensitivity is also zero. Since the sensitivity of the two extreme norms is zero, there must be a norm 1 < q < ∞ for which the sensitivity is maximized. This is not the square norm, q = 2, but the value that maximizes A2(q) in Equation (15):
In particular, the absolute deviations fitting method (q = 1) gives constant total deviations function TD1(p) = ½, while the least squares method (q = 2) gives TD2(p) = ½ + 2(p − ½)2. Hence, the least square deviations is more sensitive than the insensible case of q=1. However, it is surely not the most sensitive case. Indeed, all the values of q in the interval 2 < q < 5.798 give a larger value of the coefficient A2 than the case of square norm, q = 2. Moreover, the optimal q-norm is the one maximizing the curvature A2(q), and this is given for q ≈ 3.47. Figure 3 plots A2(q) as a function of the norm q.
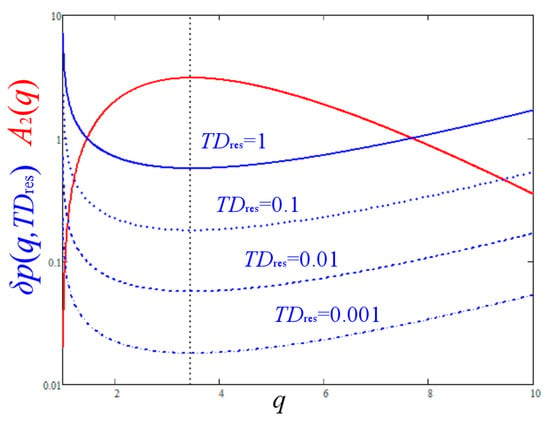
Figure 3.
The curvature A2, which measures the sensitivity of fitting, is plotted as a function of the norm q. Its largest value A2 ≈ 3.09 corresponds to the maximum sensitivity q ≈ 3.47. The corresponding error of the optimal parameter value is minimized for the same norm that maximizes the sensitivity, and is plotted for TDres = 0.001 (dash-dot), 0.01 (dash), 0.1 (dot), and 1 (solid blue line).
4. Errors of the Optimal Fitting Parameter Values
The curvature can be used to derive the error δp* of the optimal value of the parameter p*. For a small variation of the parameter value, p = p* + δp, the corresponding variation of the total deviations function TDq(p) from its minimum, , is:
(ignoring higher terms, O(δp3))). Given the smallest value of ΔTD, denoted with δTD, the error is:
Note that the above derivation comes from the geometric interpretation of errors [15]. However, the statistical derivation of error, derived from maximizing the likelihood [11], has an additional factor q/2, so that
(Note: The derivation of errors comes from two distinct analyses: geometric intuition [11], and maximization of likelihood [15]. Both derivation methods give the same results, aside from the proportionality constant q/2 that was caught by references [15].)
Moreover, it has been shown [15] that the smallest value of ΔTD is given by δTD = A0/N, where N is the number of data points given for describing the fixed function f(x). (In the continuous description, N is given by L/xres). Hence,
As we expected, the error δp*(q) is smaller when the curvature A2(q) increases or when the minimum of the total deviations A0(q) decreases.
There are cases where the total deviations value is subject to an experimental, reading, or any other type of a non-statistical error. In general, this is called the resolution value . Then, the smallest possible value is meaningful only when it stays above the threshold of . In other words, if or if , then . Hence,
When the number of data points is large, or in the continuous description where N ≈ L/xres → ∞, then, the possible value is given by the constant . Hence, the error (at its geometric interpretation) depends exclusively on the curvature A2,
Therefore, the local minimum of the error implies the local maximum of the sensitivity.
5. Multi-Parametrical Fitting
In the case of multi-parametrical fitting, i.e., when we have more than one parameter to fit, the statistical model is , or for short, which denotes a multi-parametrical approximating function, with and . Given the metric induced by the q-norm, the total deviations value between the fixed and the approximating function is
The analytical expressions of the total deviations function near its global minimum are as follows. The Taylor series expansion of TDq({pk}) up to the second order is:
where , .
Using Equation (20), we define the deviation of the total deviations functional from its minimum, , which is expressed with the definite positive quadratic form:
where we set , .
The total deviation function at its minimum is given by:
the curvature tensor is given by the Hessian matrix:
where
and the normal equations, whose roots are the optimal values of the fit parameters p1*, …, pn*, are:
where we set , for short.
In the multi-parametrical fitting, the sensitivity can be defined by the determinant of the Hessian matrix [7], namely:
However, it can also be defined by the inverse product of all the n errors of the optimal fitting parameters,
The former definition can be used to finding the optimal norm in the curve fitting, while the latter can be used in discrete fitting of data points with no errors. (The effective sensitivity can be deduced from the smaller value among these definitions).
Finally, the n errors, δp1*, δp2*, …, δpn*, of the optimal fitting parameters are given by [7,11,15]:
that is, when , otherwise
As an example, consider the case of two-parametrical approximating functions, . Then, the quadratic form of Equation (22b) defines the 2-dimensional paraboloid , immersed into the 3-dimensional space with Cartesian axes given by (see Figure 4). The 2-dimensional ellipsoid is defined by the space bounded by the locus , which is the intersection of the 2-dimensional paraboloid and the 2-dimensional hyperplane .
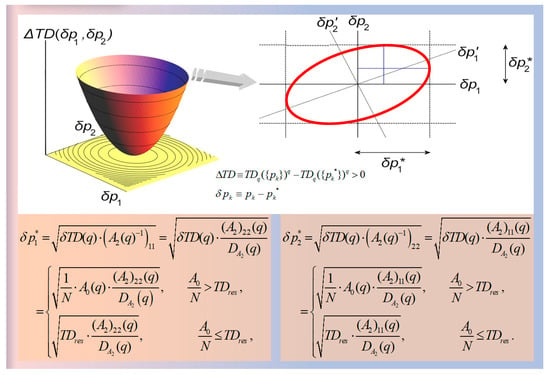
Figure 4.
(a) The n-dimensional paraboloid is the definite positive quadratic form constructed for small deviations of the total residuals from its minimum value, e.g., see Equation (22b). The illustrated example is for the n = 2 dimensional case. (b) The intersection between the paraboloid and a constant hyper-plane is a rotated n-dimensional ellipsoid, or a rotated ellipsis for the case of n = 2. (Modified from [15]).
6. Fitting of Data without Errors
We fit the modeled function to the data derived from an explicated fixed function . The data points do not have errors while the signal-to-noise ratio is considered to be quite large. Then, the general fitting methods based on Lq-norm can be applied, whereas the optimal norm is the one minimizing the error of the fitting parameter value . In the multi-parametrical fitting, we minimize the product of the errors, that is, maximize the second definition of sensitivity in Equation (26b).
We apply a constant statistical model to time series. Then, the corresponding normal equation coincides with the generalized definition of Lq-normed means [9,10,11]:
Here, the p* is interpreted as the Lq-normed mean of the N elements {fi}. The corresponding Lq-normed mean estimator is defined by the nonlinear equation [11,12,13]:
Then, the Lq expectation value of the Lq mean estimator equals the Lq expectation value of the random variables fi [14]. This generalizes the definition and properties of the L2 mean estimator:
It is noted that Equation (30) is generally an M-estimator, a broad class of extremum estimators, which are obtained by minimizing the sums of functions of data. An M-estimator can be defined to be a zero of an estimating function that often is the derivative of another statistical function [29,30].
We demonstrate the optimization of the Lq-normed method based on the error local minimum with the following example:
- Example-3: Earth’s magnetic field.
We consider the time series of the Earth’s magnetic field magnitude (in nT). In particular, we focus on a stationary segment recorded by the GOES-12 satellite between the month 1/1/2008 and 1/2/2008, that is a sampling of one measurement per minute, constituting a segment of N = 46080 data points, plotted in Figure 5a.
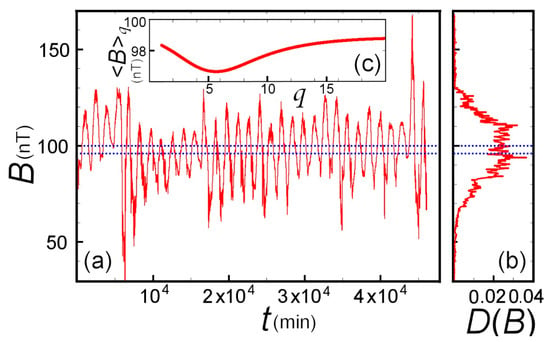
Figure 5.
(a) Magnitude of the Earth’s magnetic field recorded between 1/1/2008 and 1/2/2008. (b) Sampling distribution of these time series values. (c) Lq-expectation values of this dataset plotted against the Lq-norm. (Modified from [11]).
The distribution of these values is almost symmetric (Figure 5b), so the Lq-normed mean <B>q is weakly dependent on q. Indeed, as it has been shown [11] that when the curves f(x) or data points fi have a symmetric distribution of values D(f), then the corresponding fitting parameter value is not dependent on the q-norm. However, the error exhibits a largely variation with the Lq-norm.
The Lq-expectation value of the magnitude of the Earth’s total magnetic field B (also plotted in Figure 5c), ⟨B⟩q, together with its error δ⟨B⟩q, are plotted against the q-norm in Figure 6a,b, respectively. A local minimum of the error is found close to the Euclidean norm, i.e., for q = 2:05, as is shown within the magnified inset in Figure 6c.
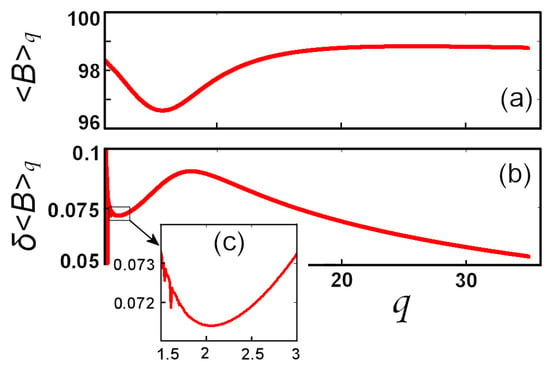
Figure 6.
The Lq-normed (a) expectation value, and (b) error, of the magnitude of the Earth’s magnetic field dataset shown in Figure 5a, plotted against the Lq-norm. (Modified from [11]).
7. Fitting of Data with Errors: Goodness of Fitting
The previous sections concern the fitting of a statistical model V(x; p) to a given fixed function f(x) or a dataset in the absence of any errors. The fitting of the given dataset to the values of a statistical model in the domain , involves finding the optimal parameter value p = p* in that minimizes the total deviations (TD), which are now:
The fitting method is characterized by the same expressions as given by Equations (6)–(9) and (18), with the only difference that the included summations are weighted with .
The difference is that the best fitting method is not determined by the sensitivity, but by the estimated value of the Chi-q value and the Chi-q distribution. The Chi-q distribution is the analog of the Chi-square distribution but for datasets with statistical errors that follow the General Gaussian (GG) distributions of shape q, instead of the standard Gaussian distribution (with the shape q = 2):
Then, the goodness of the fitting is rated based on the p-value, indicating the specific q-norm for which the p-value is maximized. This is achieved with the following steps [6]: (i) Estimate the Chi-q value, that is, the total deviations in Equation (22) at its global minimum, . (ii) Construct the Chi-q distribution for degrees of freedom M = N − n, where N is the number of data points, while n is the number of the parameters to be fitted: , with . (iii) Use this Chi-q distribution to estimate the p-value of fitting, that is, the probability of having the estimated Chi-q value or larger, .
We demonstrate the goodness of fitting with the following two examples:
- Example-4: Data following GG distribution with q = 3.
Let the stationary time series for N = 104 data points that follow the GG distribution of zero mean, fixed standard deviation to 1, and unknown shape parameter q, i.e., (Figure 7a). Finding the average of the time series requires the statistical model to fits a constant to the stationary time series, i.e., V(xi,p) = p. Since the time series has zero-mean, the optimal parameter value is p* ≈ 0; hence, =. The p-value is for large degrees of freedom (M = 9999), and is plotted as a function of q-norms in Figure 7b. We observe that the p-value for q = 2 is practically zero, while the maximum q-norm that makes the optimal case is q = 3. Indeed, Figure 7a shows that the given datasets are distributed with a GG distribution of shape parameter q ≈ 3.
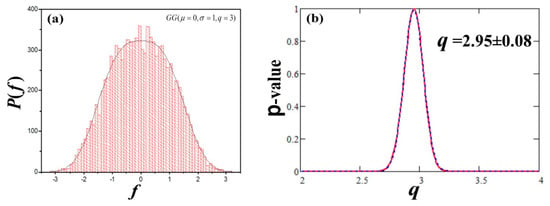
Figure 7.
(a) The N = 104 data points of the examined time series are distributed with . (b) The derived p-value is plotted as a function of the q-norm, where it is maximized for q ≈ 3. (Modified from [12]).
- Example-5: Sunspot umbral areas.
Table 1 shows measurements of the ratios of the umbral area of sunspots for low heliolatitudes. There is no physical reason to expect dependence of these ratios on latitudes. As a result, we want to find the average value of these measurements and its standard deviation. Therefore, the null hypothesis is that the measurements are described by the statistical model of a constant value, i.e., . Then, we minimize the Chi-q, given by , so that the Lq-mean value is implicitly given by:
and the minimized Chi-q, given by =.

Table 1.
Sunspot umbral area per latitude.
Figure 8a shows the six data points co-plotted with four values of p*, corresponding to q = 1, q → ∞, and q1, q2 for which the p-value is equal to 0.05. The whole diagram of is shown in Figure 8b, while the p-value as a function of q-norm is plotted in Figure 8c. We observe that the function is monotonically increasing converging with the q-norm, where for q → ∞, . The p-value has a minimum value at q~2.08 and increases for larger shape values q until it reaches q~5.77 where p-value~0.5 (not shown in the figure). The p-value is < 0.05 for the norms between q1~1.7 and q2~2.5.
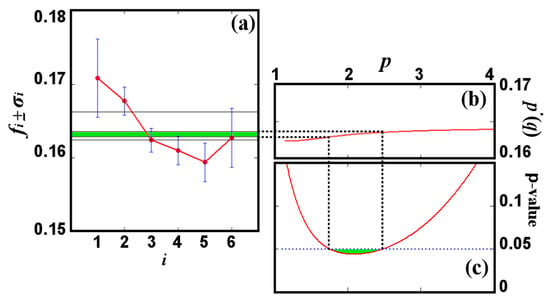
Figure 8.
(a) The data of Table 1 is co-plotted with four values of p*(q) that correspond to q = 1, q → ∞, and the two norms q1~1.7 and q2~2.5 for which the p-value is equal to 0.05. (b) The diagram of p*(q). (c) The p-value as a function of q. We observe that for the Euclidean norm q = 2, the null hypothesis is rejected, i.e., sunspot area ratio data are not invariant with heliolatitude and cannot be represented by an average value. However, the examined data are expected to be invariant, and thus, the null hypothesis to be accepted, hence, norms between q1 and q2 (green) are rejected because lead to p-value < 0.05. Instead, the largest p-value indicates the optimal norm, q~5.77. (Modified from [12]).
Since the data are expected to be invariant with latitude, the null hypothesis should be accepted. Hence, the desired norm is the one that maximizes the p-value, i.e., q~5.77. On the other hand, the norms between q1~1.7 and q2~2.5 lead to false results, since p-value < 0.05. Thus, the null-hypothesis would have been rejected for the least square method, and the fitting would have not been accepted as being good.
Note: The derived p-value that measures the goodness of fitting, expressed as a function of the q-norm, may not indicate to a unique, finite, and clear maximum, thus, finding the optimal q-norm that maximizes the p-value may not be possible. Then, we will focus on the maximum p-value that appears closer to q = 2.
8. Discussion and Conclusions
The widely used fitting method of least squares is neither unique nor does it provide the most accurate results. Other fitting methods based on Lq norms can be used for expressing the deviations between the given data and the fitted model. The most accurate method is the one with the (i) highest sensitivity, for curve fitting, (ii) smallest errors for fitting of data w/o errors, and (iii) best goodness of fitting for data assigned with errors.
In particular, the general fitting methods based on Lq norms minimize the sum of the power q of the absolute deviations between the given data and the fitted statistical model. Clearly, the q-exponent generalizes the case of q = 2, e.g., the least squares method. The mathematical analysis behind the general methods of q ≠ 2 is complicated in contrast to the simplicity that characterizes the case of q = 2. However, the least square method is not the optimal one among the variety of Lq-normed fitting methods.
The optimization of the fitting methods seeks for that method with the highest sensitivity, smallest error, or best goodness:
- -
- In the case of curve fitting where the data are given in continuous description, the sensitivity of a fitting method is measured by the curvature of the total deviations at the global minimum. The smaller the curvature, the more outspread and flattened the minimum appears, and thus, the fitting method is characterized by less sensitivity. The optimal q-norm maximizes the sensitivity.
- -
- In the case of fitting data points without errors, i.e., with sufficiently high signal-to-noise ratio, the variance of the determined fitting parameter is given by the ratio of the total deviations minimum over the curvature. The optimal q-norm stabilizes the error exhibiting local minimum.
- -
- In the case of fitting data with errors, the goodness of a fitting method is rated based on the fitting p-value, namely, the optimal q-norm maximizes the p-value. This is achieved as follows: (i) Estimate the Chi-q value, that is, the total deviations at its global minimum. (ii) Construct the Chi-q distribution for degrees of freedom M = N − n, where N is the number of data points, while n is the number of the fitting parameters. (iii) Use this Chi-q distribution to estimate the p-value of fitting, that is, the probability of having the estimated Chi-q value or larger. Note: All the above are count for uni- or multi-parametrical fitting.
Below we describe the next steps in the development of the general fitting methods and their applications in statistical and data analysis:
- (1)
- Derivation of iteration method(s) and algorithm(s) for solving the Lq normal equations, whose roots are the optimal values of the fitting parameters. In contrast to the least squares fitting method, where the optimal fitting parameters are explicitly derived from the normal equations, in the case of the least q’s fitting method, the optimal fitting parameters are implicitly given by the normal equations (see Equations (9) and (25)). These must be numerically solved to find their roots. For the uni-parametrical fitting, the normal equation is given by:We solve this equation and find its root with an effective iteration process. Setting and , Equation (34) is written asAs an example, we use the model . Then, Equation (35) becomes:Namely, starting from an initial value ϕ0, we find p1* and ϕ1. Afterwards, from ϕ1, we find p2* and ϕ2, etc., until we find pt* and ϕt for some large number of iterations t. Nonetheless, different numerical root finding methods may be used (e.g., reference [31]).
- (2)
- Equations (18a) and (18b) and Equations (27a) and (27b) provide the error of each optimal fitting parameter(s). This is a statistical type of error, whose origin is the nonzero residuals (A0 ≠ 0). Indeed, if the total deviations function were zero at its minimum (A0 = 0), then there was zero statistical error. This type of error has nothing to do with the errors of the involved variables. On the other hand, the propagation type error of the optimal fitting parameter(s) is the error that is caused by the propagation of the errors of the involved variables, e.g., {σxi,σyi}.
- (3)
- Once the Euclidean, L2 norm, and the induced least-squares fitting method are proved to be the optimal options among all the Lq-normed fitting methods, then, we may continue with the standard tools for statistical and data analysis which are based on the L2 norm. Numerical criteria that can be used are the following: (i) The methodology of general fitting method must lead to results statistically similar to those obtained with the classical method of least squares. The differentiation of the results of the fitting methods should be measured with 1-sigma confidence, i.e., the results p2* ± δp2* and pq* ± δpq* must be clearly different: |pq* − p2*| > (δpq2 + δp22)½. (ii) The methodology of general fitting method must conclude that the optimal norm q = q0, which will be used for finding the fitting parameters, does coincide with the classical Euclidean norm q = 2. We may ask for: |q0−2| > 10%, and |p(q0) − p(2)| > 10%.
- (4)
- The paper showed the application of the Lq-normed fitting methods for significantly improving statistical and data analyses. Applications can be ranged in various topics, including among others: (i) curve fitting (inter/extrapolation, smoothing), (ii) time series and forecasting analysis, (iii) regression analysis, (iv) statistical inference problems; (see, for example references [32,33,34,35]). More precisely: (i) Curve fitting involves interpolation, where an exact fit to the data is required, or smoothing, in which a smoothed function is constructed that approximately fits a more complicated curve or data. Extrapolation refers to the use of a fitted curve beyond the range of the observed data. The results depend on the statistical model, i.e., using various functional forms polynomial, exponential etc. (ii) There are various tools used in time series and forecasting analyses, e.g., Moving average (Weighted, Autoregressive, etc.), Trend estimation, Kalman and nonlinear filtering, Growth curve (generalized multivariate analysis of variance), just to mention a few. (iii) Similar to (i), the regression analysis involves fitting with various statistical models. (iv) Statistical inference is the process of using data analysis to deduce properties of an underlying probability distribution.
The methodology of general fitting methods using metrics based on Lq-norms is now straight-forward to apply in various topics, such as, statistics, signal processing, pattern recognition, econometrics, mathematical finance, weather forecasting, earthquake prediction, control engineering, communications engineering, space physics, and astrophysics.
Funding
This research received no external funding.
Conflicts of Interest
The author declares no conflict of interest.
References
- Kenney, J.F.; Keeping, E.S. Linear Regression and Correlation. In Mathematics of Statistics, 3rd ed.; Van Nostrand: Princeton, NJ, USA, 1962; pp. 252–285. [Google Scholar]
- McCullagh, P. What is statistical model? Ann. Stat. 2002, 30, 1225–1310. [Google Scholar] [CrossRef]
- Adèr, H.J. Modelling. In Advising on Research Methods: A Consultant’s Companion; Adèr, H.J., Mellenbergh, G.J., Eds.; Johannes van Kessel Publishing: Huizen, The Netherlands, 2008; pp. 271–304. [Google Scholar]
- Melissinos, A.C. Experiments in Modern Physics; Academic Press Inc.: London, UK, 1966; pp. 438–464. [Google Scholar]
- Burden, R.L.; Faires, J.D. Numerical Analysis; PWS Publishing Company: New Orleans, LA, USA, 1993; pp. 437–438. [Google Scholar]
- Livadiotis, G.; McComas, D.J. Fitting method based on correlation maximization: Applications in Astrophysics. J. Geophys. Res. 2013, 118, 2863–2875. [Google Scholar] [CrossRef]
- Livadiotis, G. Approach to general methods for fitting and their sensitivity. Phys. A 2007, 375, 518–536. [Google Scholar] [CrossRef]
- Livadiotis, G.; Moussas, X. The sunspot as an autonomous dynamical system: A model for the growth and decay phases of sunspots. Phys. A 2007, 379, 436–458. [Google Scholar] [CrossRef]
- Livadiotis, G. Approach to the block entropy modeling and optimization. Phys. A 2008, 387, 2471–2494. [Google Scholar] [CrossRef]
- Livadiotis, G. Non-Euclidean-normed Statistical Mechanics. In Proceedings of the Sigma Phi Intnational Conference on Statistical Physics, Kolympari-Crete, Greece, 14–18 July 2008. [Google Scholar]
- Livadiotis, G. Expectation values and Variance based on Lp norms. Entropy 2012, 14, 2375–2396. [Google Scholar] [CrossRef]
- Livadiotis, G. Chi-p distribution: Characterization of the goodness of the fitting using Lp norms. J. Stat. Distr. Appl. 2014, 1, 4. [Google Scholar] [CrossRef]
- Livadiotis, G. Non-Euclidean-normed Statistical Mechanics. Phys. A 2016, 445, 240–255. [Google Scholar] [CrossRef]
- Livadiotis, G. On the convergence and law of large numbers for the non-Euclidean Lp-means. Entropy 2017, 19, 217. [Google Scholar] [CrossRef]
- Livadiotis, G. Geometric interpretation of errors in multi-parametrical fitting methods. Statistics 2019, 2, 426–438. [Google Scholar]
- Frisch, P.C.; Bzowski, M.; Livadiotis, G.; McComas, D.J.; Möbius, E.; Mueller, H.-R.; Pryor, W.R.; Schwadron, N.A.; Sokól, J.M.; Vallerga, J.V.; et al. Decades-long changes of the interstellar wind through our solar system. Science 2013, 341, 1080. [Google Scholar] [CrossRef] [PubMed]
- Livadiotis, G.; McComas, D.J. Evidence of large scale phase space quantization in plasmas. Entropy 2013, 15, 1118–1132. [Google Scholar] [CrossRef]
- Schwadron, N.A.; Mobius, E.; Kucharek, H.; Lee, M.A.; French, J.; Saul, L.; Wurz, P.; Bzowski, M.; Fuselier, S.; Livadiotis, G.; et al. Solar radiation pressure and local interstellar medium flow parameters from IBEX low energy hydrogen measurements. Astrophys. J. 2013, 775, 86. [Google Scholar] [CrossRef]
- Fusten, H.O.; Frisch, P.C.; Heerikhuisen, J.; Higdon, D.M.; Janzen, P.; Larsen, B.A.; Livadiotis, G.; McComas, D.J.; Möbius, E.; Reese, C.S.; et al. Circularity of the IBEX Ribbon of enhanced energetic neutral atom flux. Astrophys. J. 2013, 776, 30. [Google Scholar] [CrossRef]
- Frisch, P.C.; Bzowski, M.; Drews, C.; Leonard, T.; Livadiotis, G.; McComas, D.J.; Möbius, E.; Schwadron, N.A.; Sokól, J.M. Correcting the record on the analysis of IBEX and STEREO data regarding variations in the neutral interstellar wind. Astrophys. J. 2015, 801, 61. [Google Scholar] [CrossRef]
- Fuselier, S.A.; Dayeh, M.A.; Livadiodis, G.; McComas, D.J.; Ogasawara, K.; Valek, P.; Funsten, H.O. Imaging the development of the cold dense plasma sheet. Geophys. Res. Lett. 2015, 42, 7867–7873. [Google Scholar] [CrossRef]
- Park, J.; Kucharek, H.; Moebius, E.; Fuselier, S.A.; Livadiotis, G.; McComas, D.J. The statistical analyses of the heavy neutral atoms measured by IBEX. Astrophys. J. Suppl. Ser. 2015, 220, 34. [Google Scholar] [CrossRef]
- Zirnstein, E.J.; Funsten, H.; Heerikhuisen, J.; Livadiotis, G.; McComas, D.J.; Pogorelov, N.V. The local interstellar magnetic field determined from the IBEX ribbon. Astrophys. J. Lett. 2016, 818, 18. [Google Scholar] [CrossRef]
- Schwadron, N.A.; Wilson, J.K.; Looper, M.D.; Jordan, A.; Spence, H.E.; Blake, J.B.; Case, A.W.; Iwata, Y.; Kasper, J.; Farrell, W.; et al. Signatures of volatiles in the lunar proton albedo. Icarus 2016, 273, 25–35. [Google Scholar] [CrossRef]
- Schwadron, N.A.; Möbius, E.; McComas, D.J.; Bochsler, P.; Bzowski, M.; Fuselier, S.A.; Livadiotis, G.; Frisch, P.; Müller, H.-R.; Heirtzler, D.; et al. Determination of interstellar O parameters using the first 2 years of data from IBEX. Astrophys. J. 2016, 828, 81. [Google Scholar] [CrossRef]
- Livadiotis, G. Kappa Distribution: Theory & Applications in Plasmas, 1st ed.; Elsevier: Amsterdam, The Netherlands, 2017. [Google Scholar]
- Luspay-Kuti, A.; Altwegg, K.; Berthelier, J.J.; Beth, A.; Dhooghe, F.; Fiethe, B.; Fuselier, S.A.; Gombosi, T.I.; Hansen, K.C.; Hässig, M.; et al. Comparison of neutral outgassing of comet 67P/ Churyumov-Gerasimenko inbound and outbound beyond 3 AU from ROSINA/DFMS. Astron. Astrophys. 2019, 630, A30. [Google Scholar] [CrossRef]
- Livadiotis, G. Linear regression with optimal rotation. Statistics 2019, 2, 28. [Google Scholar] [CrossRef]
- Huber, P. Robust Statistics; John Wiley & Sons: New York, NY, USA, 1981. [Google Scholar]
- Hampel, F.R.; Ronchetti, E.M.; Rousseeuw, P.J.; Stahel, W.A. Robust Statistics. The Approach Based on Influence Functions; John Willey & Sons: New York, NY, USA, 1986. [Google Scholar]
- Broyden, C.G. A Class of Methods for Solving Nonlinear Simultaneous Equations. Math. Comput. AMS 1965, 19, 577–593. [Google Scholar] [CrossRef]
- Arlinghaus, S.L. Practical Handbook of Curve Fitting; CRC Press: Boca Raton, FL, USA, 1994. [Google Scholar]
- Boashash, B. Time-Frequency Signal. Analysis and Processing: A Comprehensive Reference; Elsevier Science: Oxford, UK, 2003. [Google Scholar]
- Birkes, D.; Dodge, Y. Alternative Methods of Regression; John Wiley and Sons: New York, NY, USA, 1993. [Google Scholar]
- Casella, G.; Berger, R.L. Statistical Inference; Duxbury Press: Pacific Grove, CA, USA, 2002. [Google Scholar]
© 2020 by the author. Licensee MDPI, Basel, Switzerland. This article is an open access article distributed under the terms and conditions of the Creative Commons Attribution (CC BY) license (http://creativecommons.org/licenses/by/4.0/).