Improved Small Sample Inference Methods for a Mixed-Effects Model for Repeated Measures Approach in Incomplete Longitudinal Data Analysis


Abstract
:1. Introduction
2. Mixed-Effects Model for Repeated Measures (MMRM) for Longitudinal Data Analysis
3. Improved Inference Methods
3.1. Likelihood Ratio (LR) test
3.2. Bartlett-Type Adjustment by Bootstrap Resampling
| Algorithm 1 Bartlett correction using bootstrap resampling technique. |
|
3.3. Monte Carlo Test Using an Estimated Null Distribution by Bootstrap
| Algorithm 2 Bootstrap-based adjustment of LR test. |
|
4. Simulation Studies
4.1. Design and Setting
4.2. Correlation Structures
4.3. Missing-data Mechanism
4.4. Analysis Methods
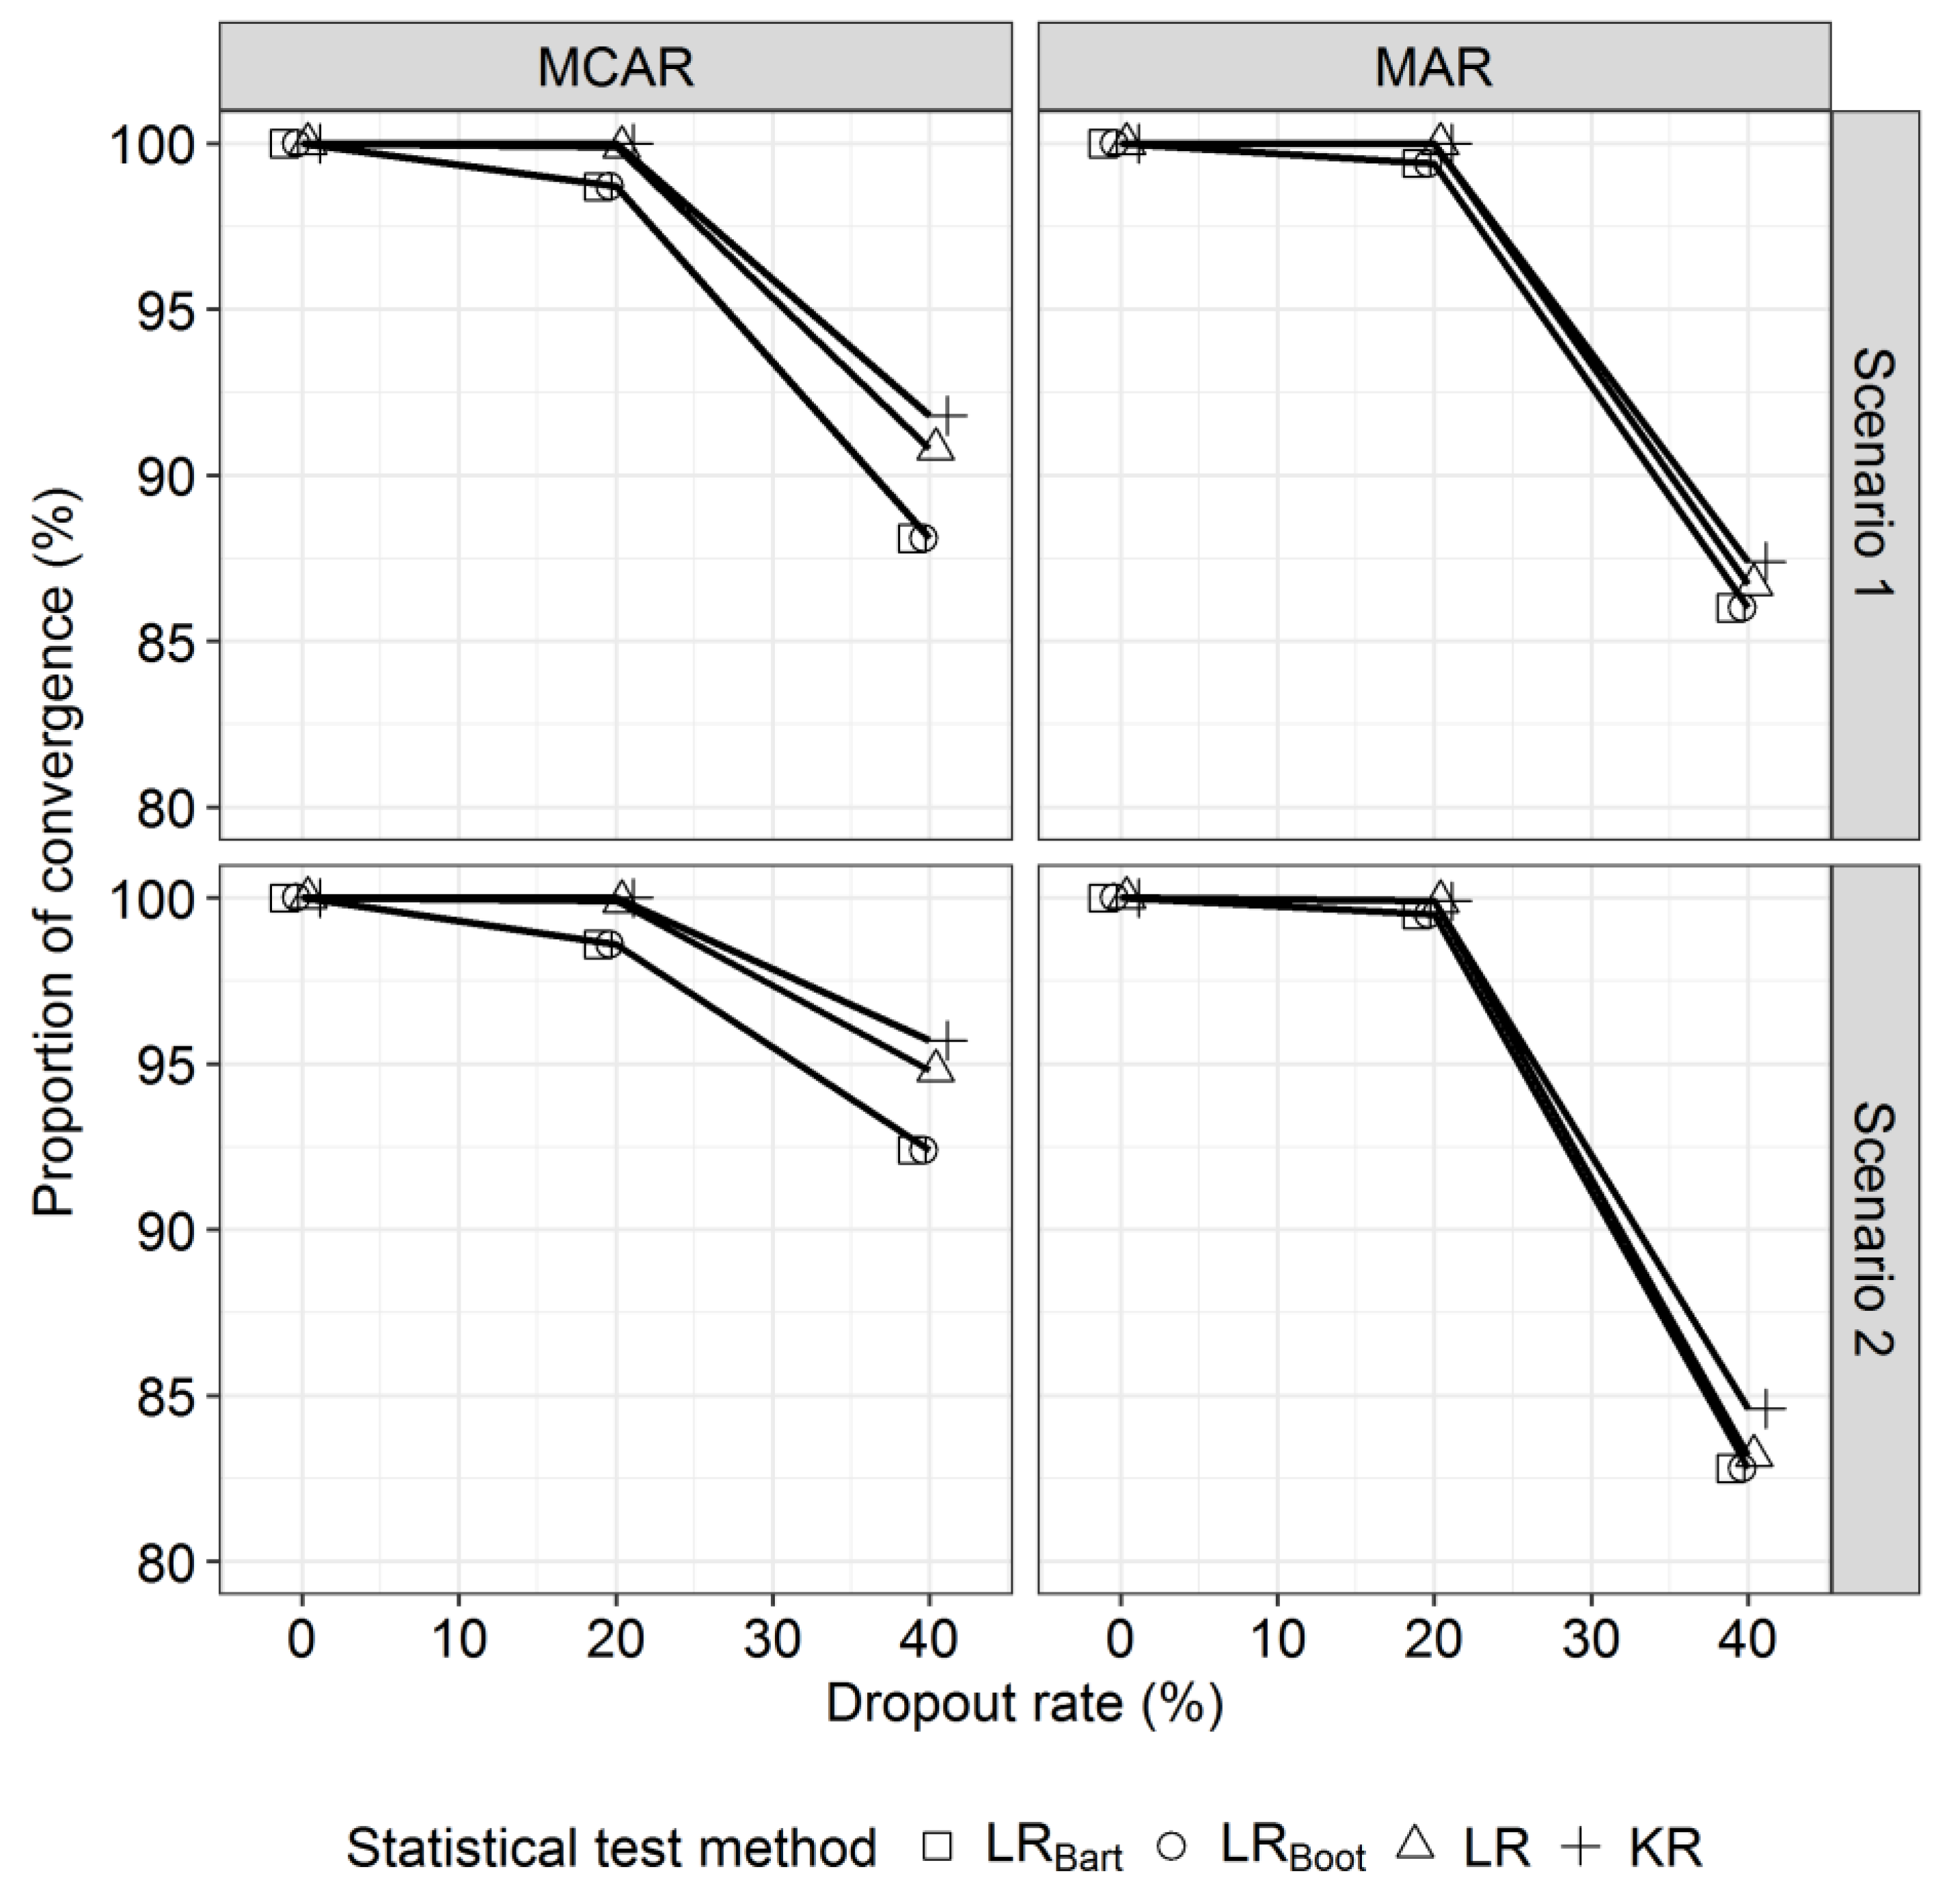
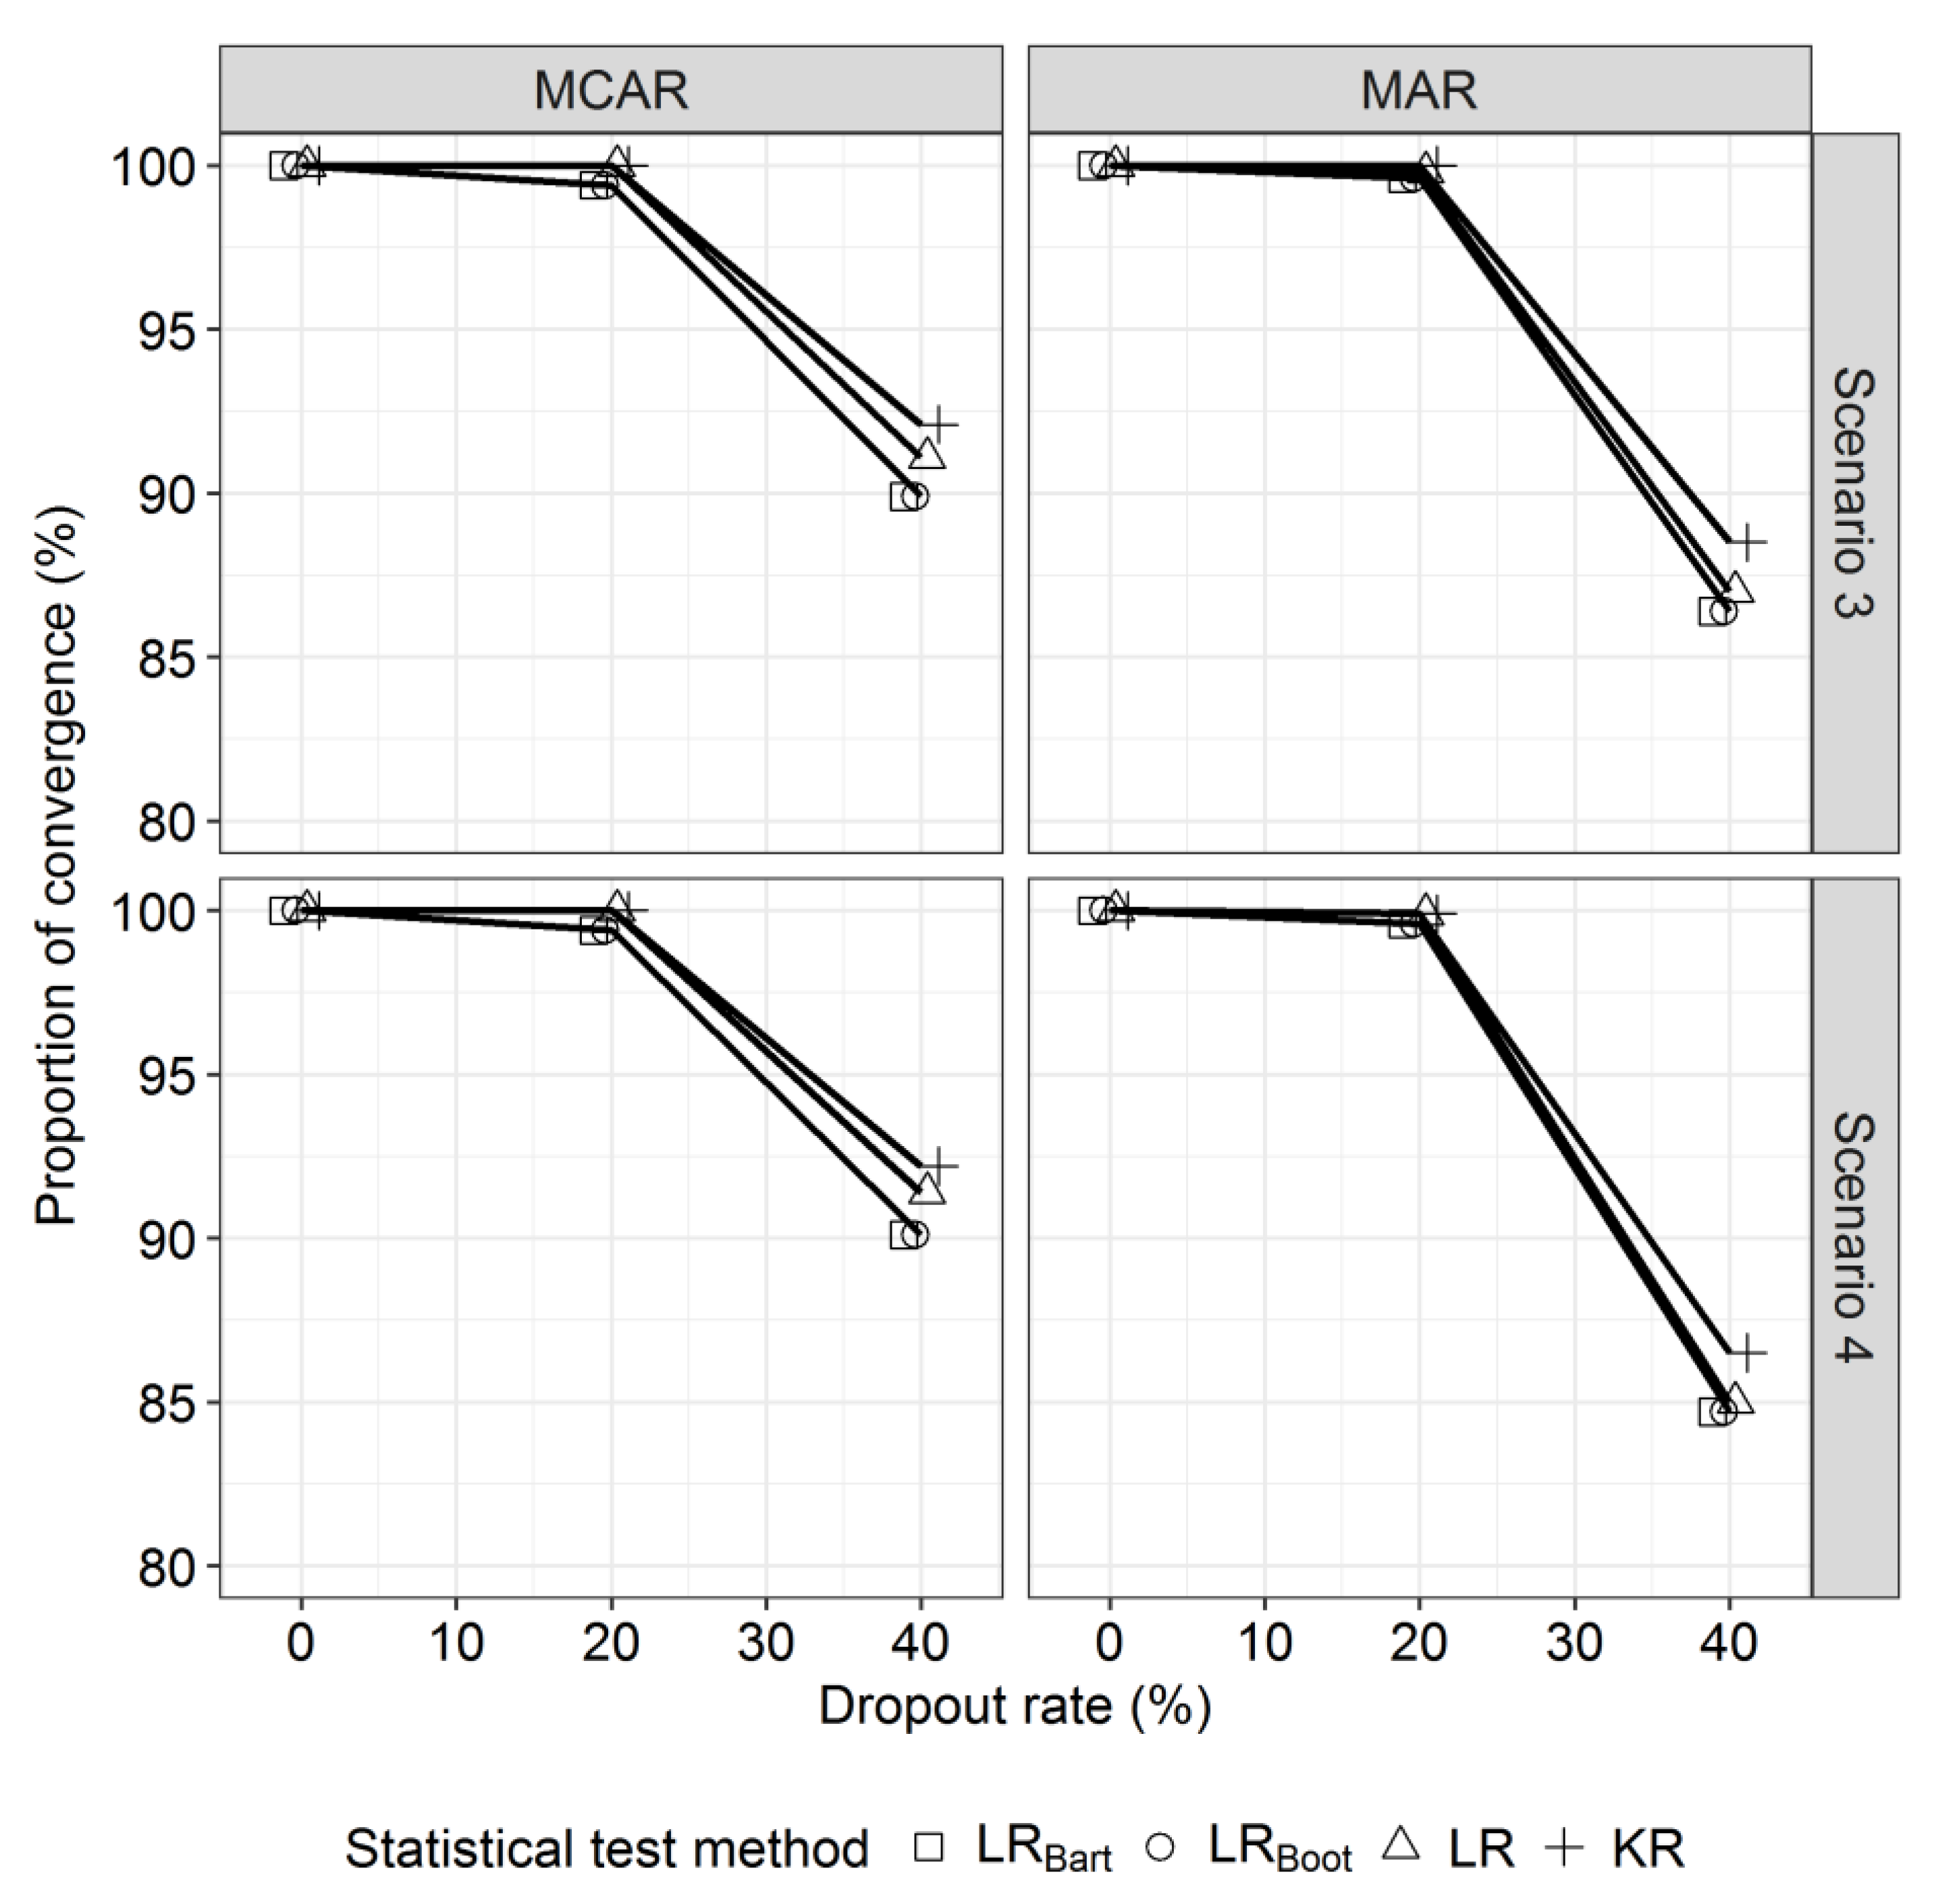
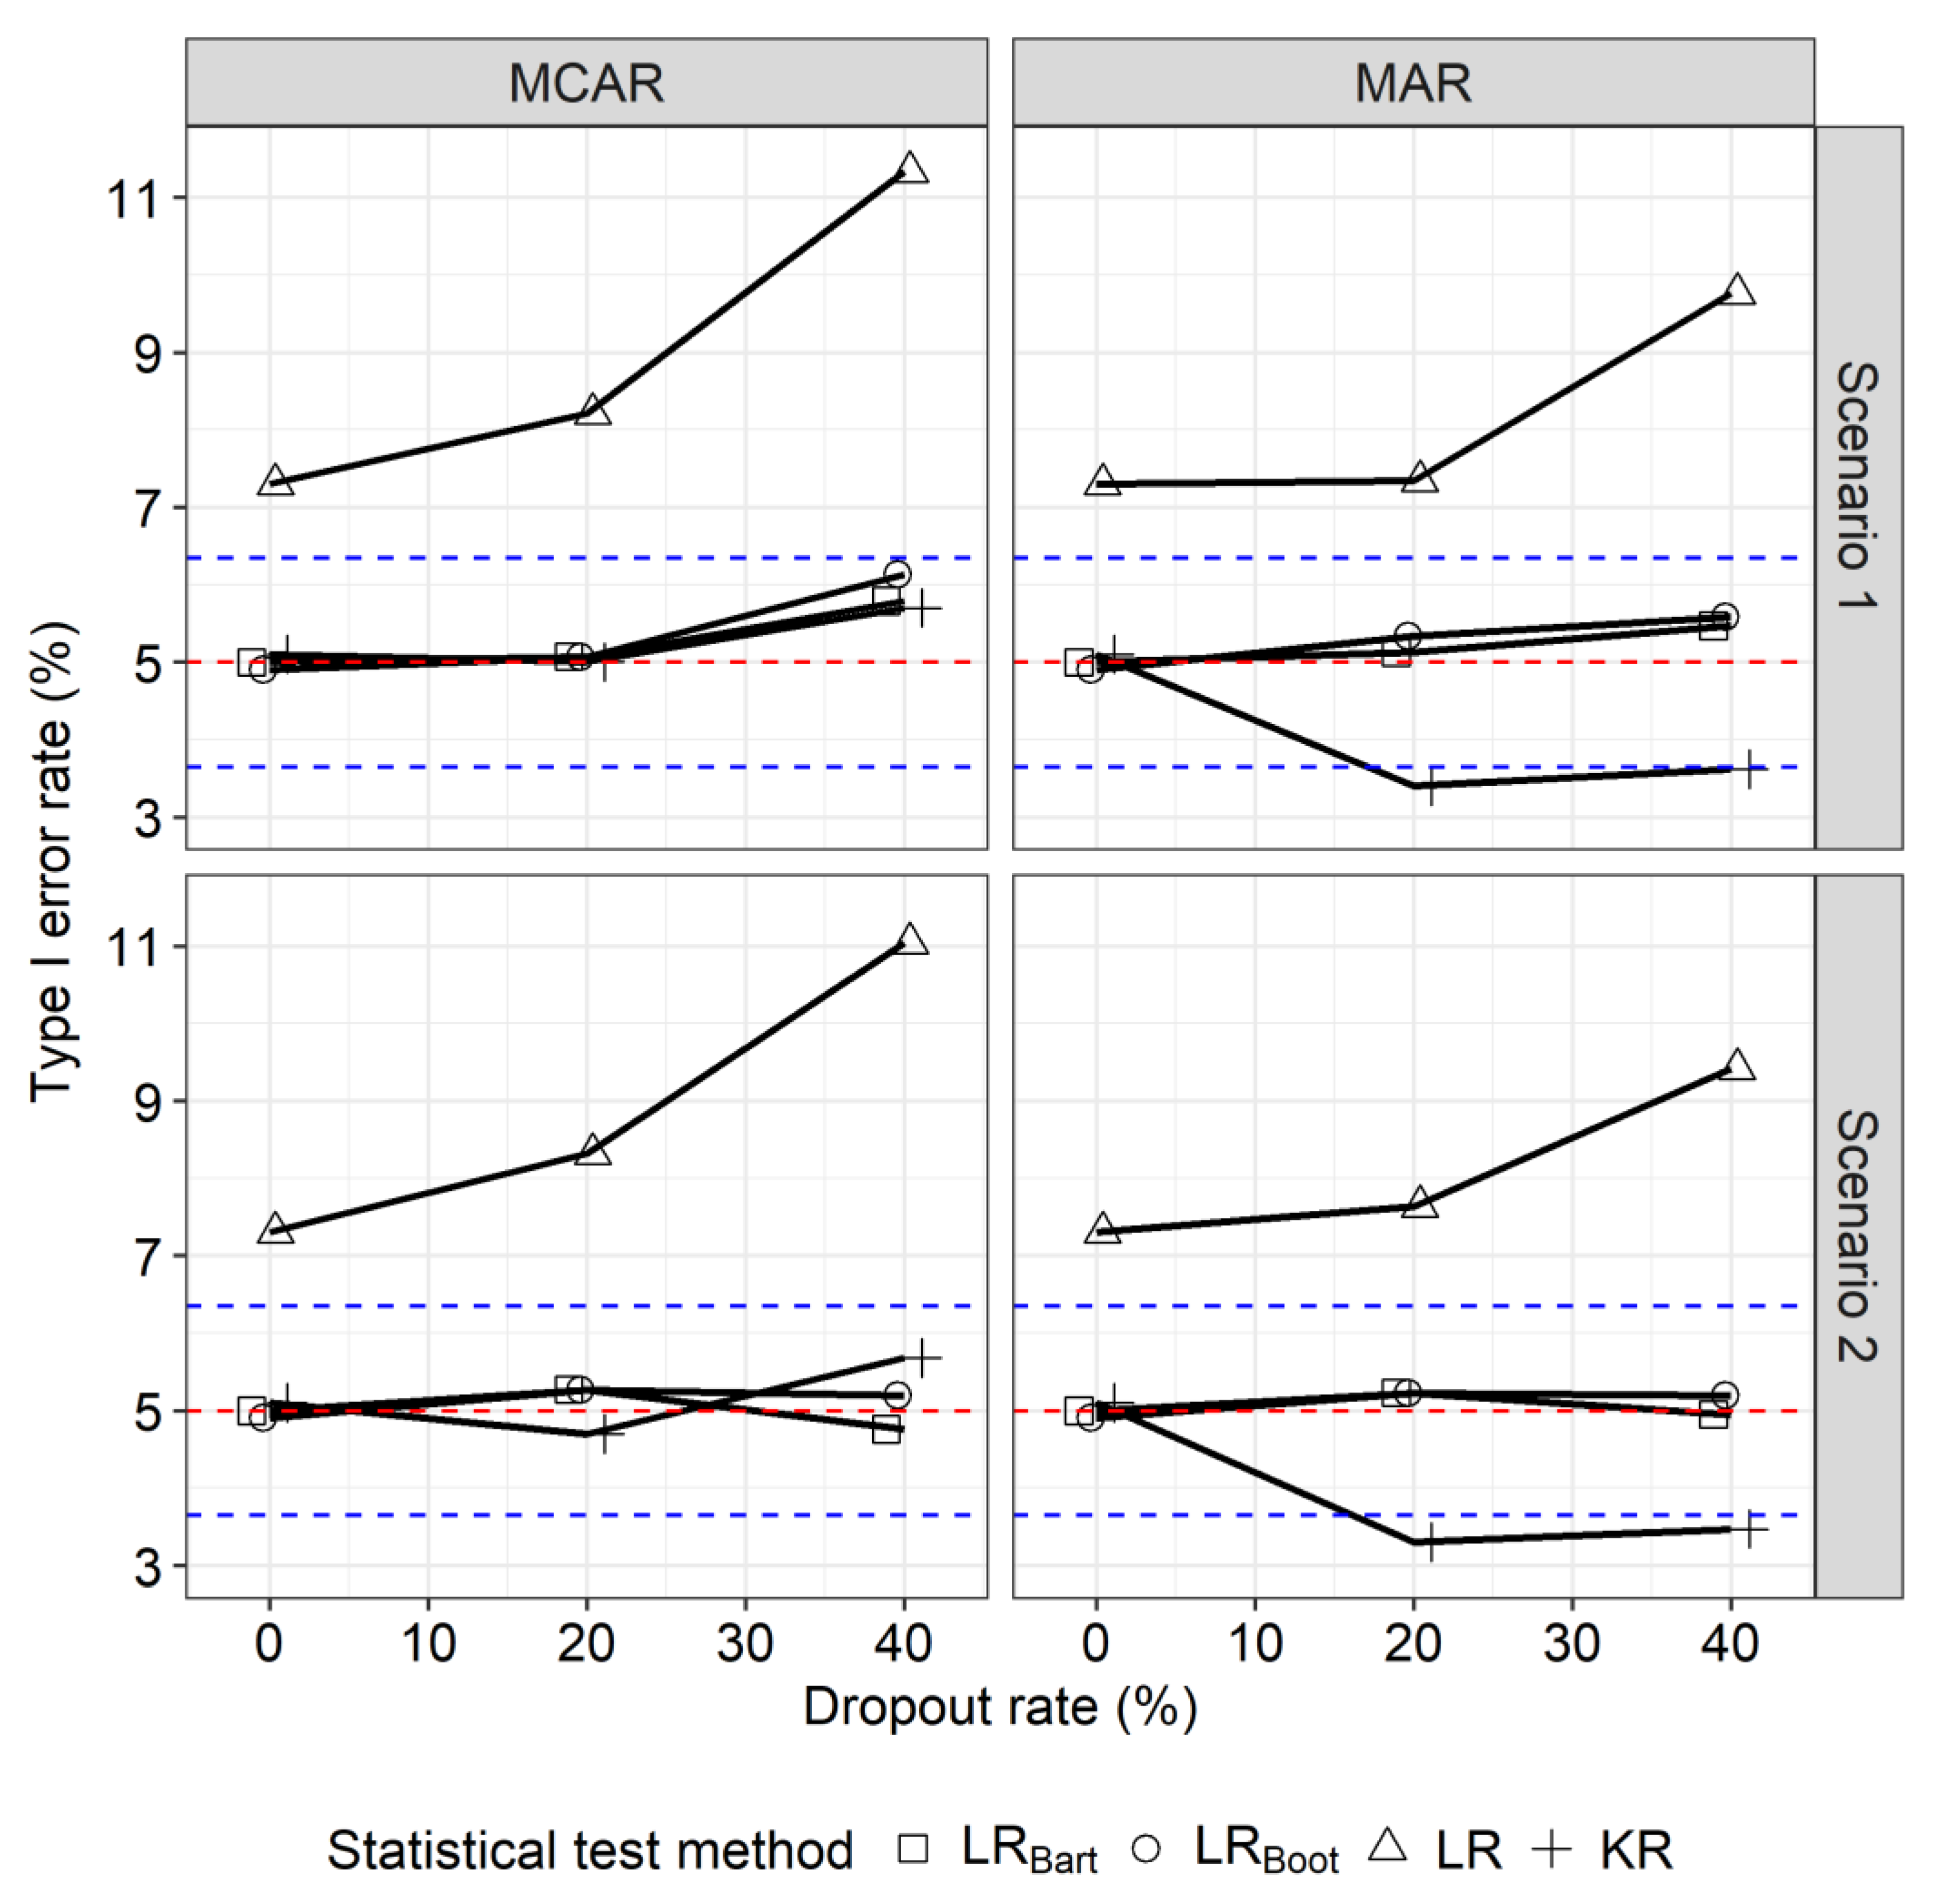
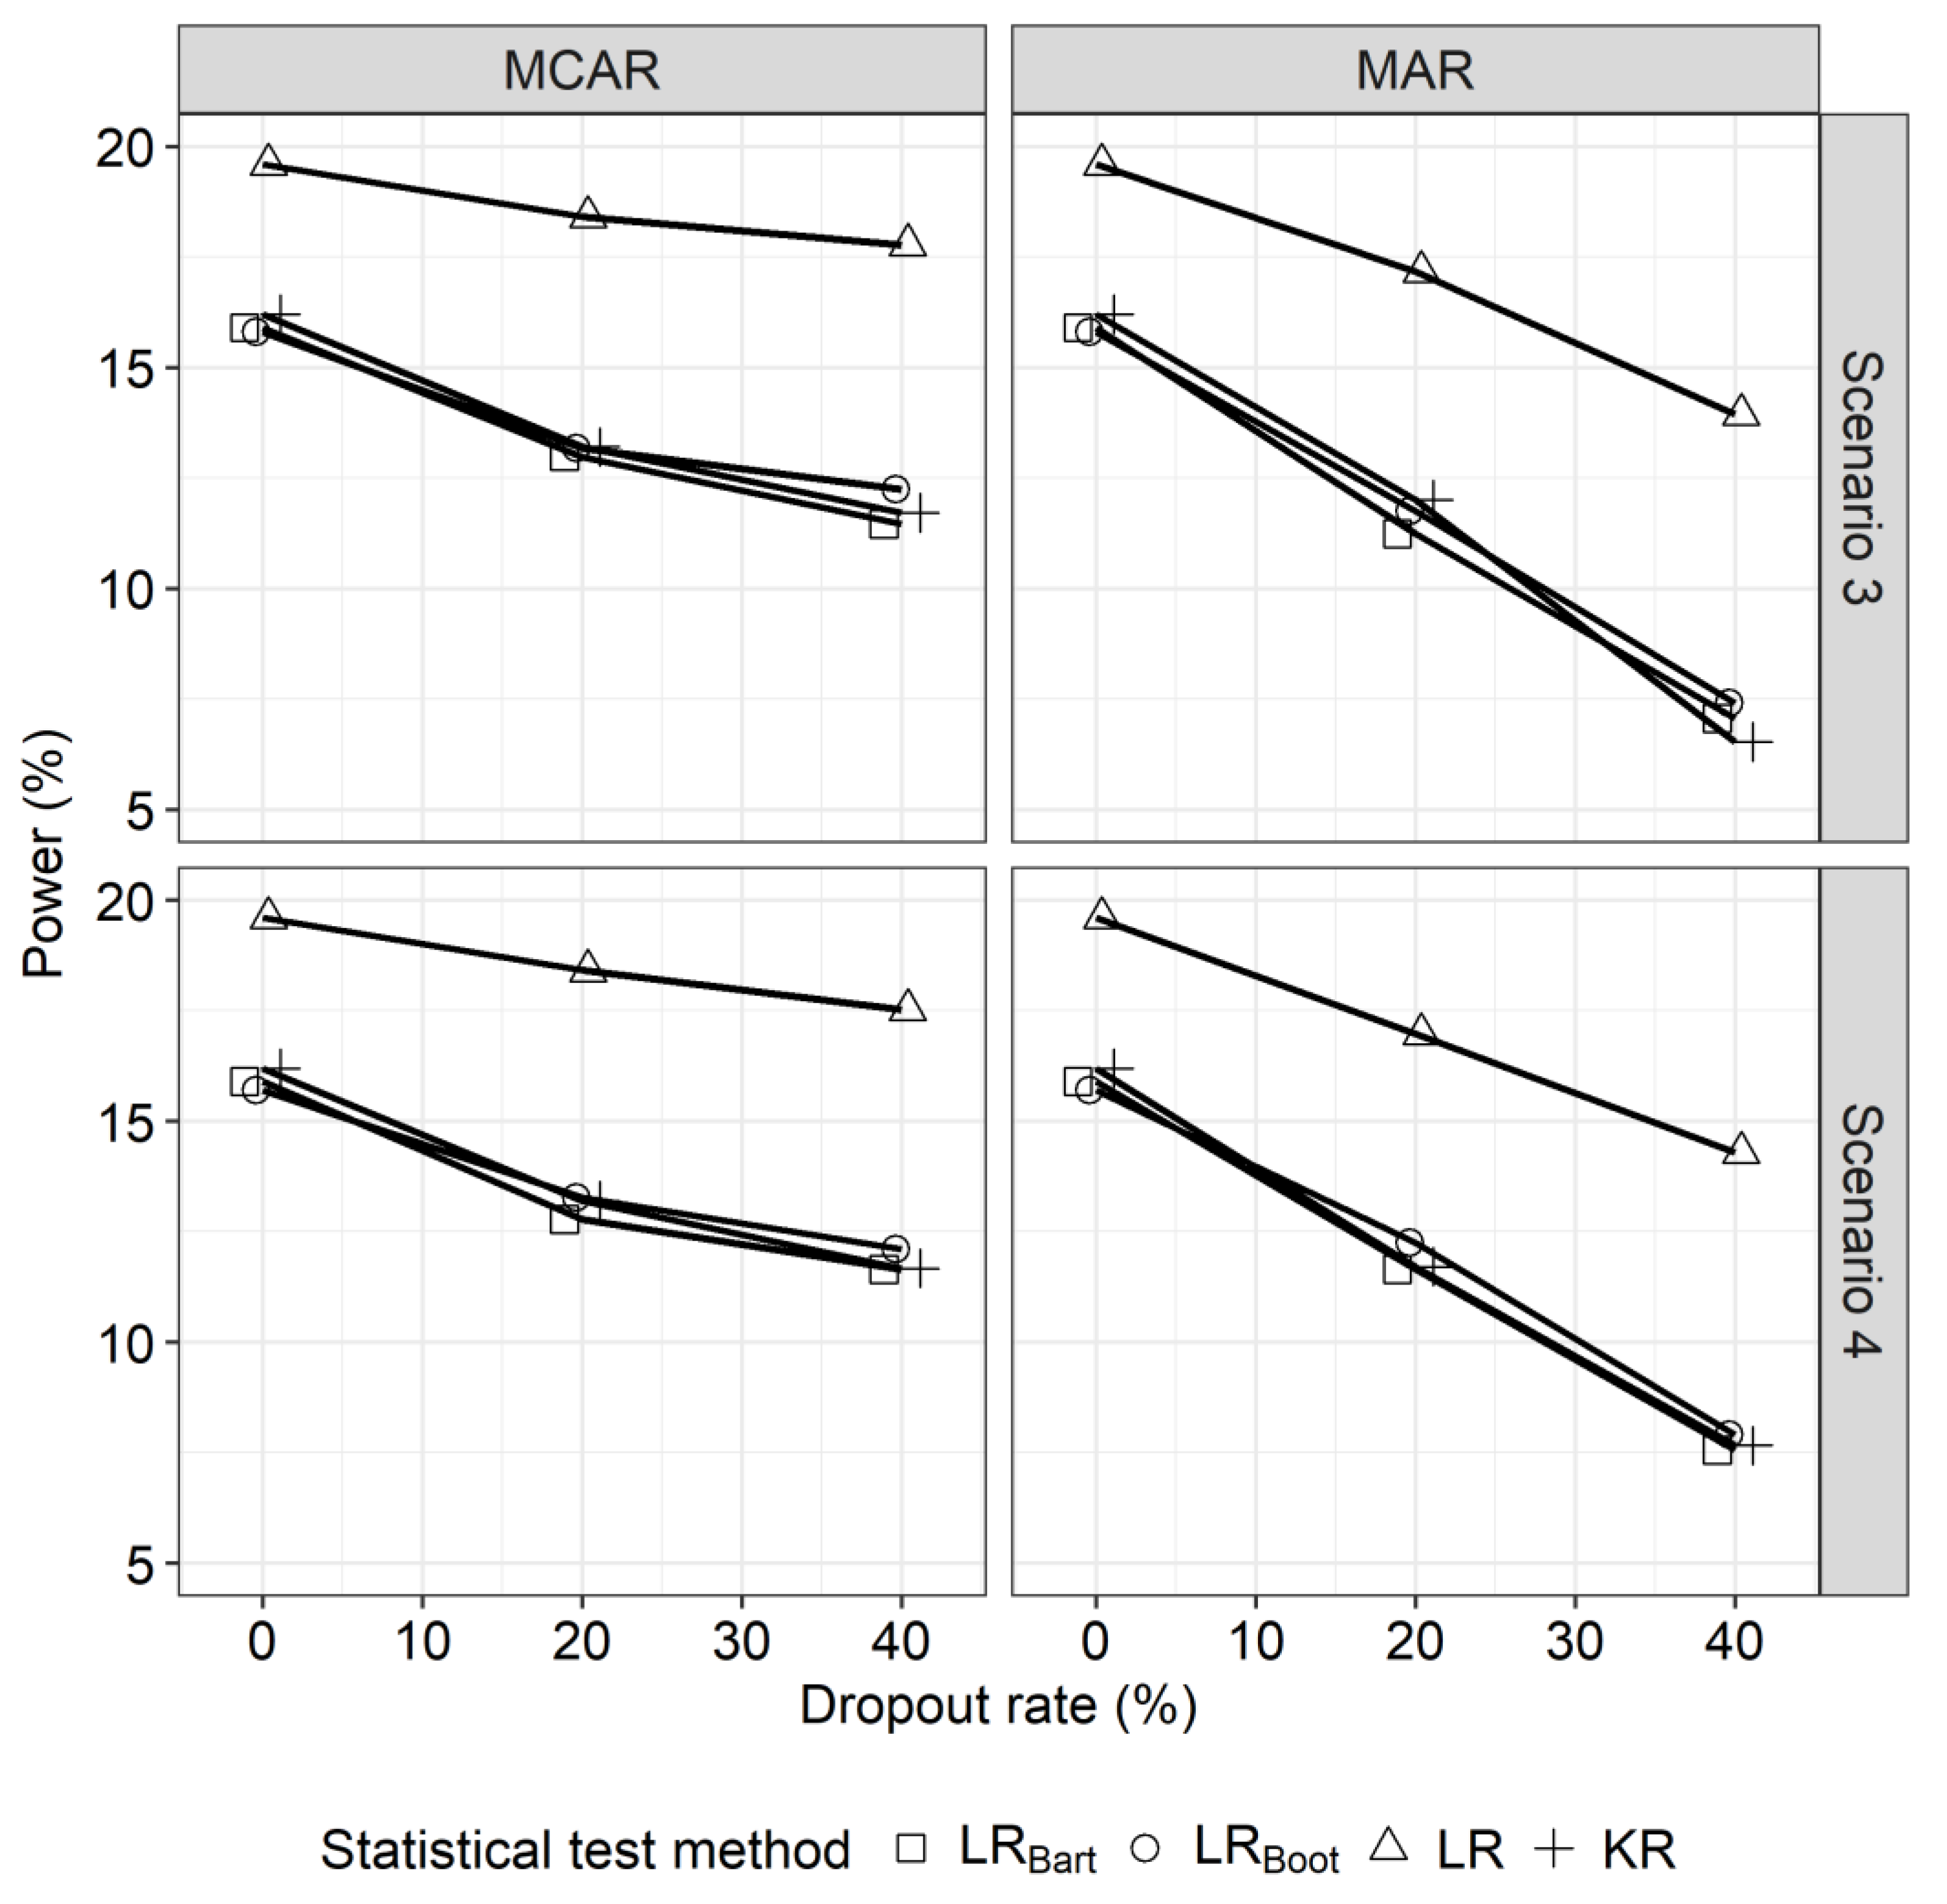
4.5. Results
5. Application: Postnatal Depression Trial
6. Discussion
Author Contributions
Funding
Conflicts of Interest
Appendix A
References
- European Medicines Agency. Guideline on Missing Data in Confirmatory Clinical Trials. 2010. Available online: https://www.ema.europa.eu/documents/scientific-guideline/guideline-missing-data-confirmatory-clinical-trials_en.pdf (accessed on 11 January 2019).
- National Research Council. The Prevention and Treatment of Missing Data in Clinical Trials; National Academies Press: Washington, DC, USA, 2010. [Google Scholar]
- Ratitch, B.; O’Kelly, M.; Tosiello, R. Missing data in clinical trials: From clinical assumptions to statistical analysis using pattern mixture models. Pharm. Stat. 2013, 12, 337–347. [Google Scholar] [CrossRef]
- Mallinckrodt, C.H.; Sanger, T.M.; Dubé, S.; DeBrota, D.J.; Molenberghs, G.; Carroll, R.J.; Potter, W.Z.; Tollefson, G.D. Assessing and interpreting treatment effects in longitudinal clinical trials with missing data. Biol. Psychiatry 2003, 53, 754–760. [Google Scholar] [CrossRef]
- Mallinckrodt, C.H.; Lane, P.W.; Schnell, D.; Peng, Y.; Mancuso, J.P. Recommendations for the primary analysis of continuous endpoints in longitudinal clinical trials. Drug Inf. J. 2008, 42, 303–319. [Google Scholar] [CrossRef]
- Mallinckrodt, C.H.; Watkin, J.G.; Molenberghs, G.; Carroll, R.J. Choice of the primary analysis in longitudinal clinical trials. Pharm. Stat. 2004, 3, 161–169. [Google Scholar] [CrossRef]
- Laird, N.M.; Ware, J.H. Random-effects models for longitudinal data. Biometrics 1982, 38, 963–974. [Google Scholar] [CrossRef]
- Fitzmaurice, G.M.; Laird, N.M.; Ware, J.H. Applied Longitudinal Analysis; John Wiley & Sons: New York, NY, USA, 2012. [Google Scholar]
- Diggle, P.J.; Heagerty, P.J.; Liang, K.-Y.; Zeger, S. Analysis of Longitudinal Data; Oxford University Press: Oxford, UK, 2002. [Google Scholar]
- Patterson, H.D.; Thompson, R. Recovery of inter-block information when block sizes are unequal. Biometrika 1971, 58, 545–554. [Google Scholar] [CrossRef]
- Kenward, M.G.; Roger, J.H. Small sample inference for fixed effects from restricted maximum likelihood. Biometrics 1997, 53, 983–997. [Google Scholar] [CrossRef]
- Schluchter, M.D.; Elashoff, J.T. Small-sample adjustments to tests with unbalanced repeated measures assuming several covariance structures. J. Stat. Comput. Simul. 1990, 37, 69–87. [Google Scholar] [CrossRef]
- Gosho, M.; Hirakawa, A.; Noma, H.; Maruo, K.; Sato, Y. Comparison of bias-corrected covariance estimators for MMRM analysis in longitudinal data with dropouts. Stat. Methods Med. Res. 2017, 26, 2389–2406. [Google Scholar] [CrossRef] [PubMed]
- Zucker, D.M.; Lieberman, O.; Manor, O. Improved small sample inference in the mixed linear model: Bartlett correction and adjusted likelihood. J. R. Stat. Soc. B 2000, 62, 827–838. [Google Scholar] [CrossRef]
- Bartlett, M.S. Properties of sufficiency and statistical tests. Proc. R. Soc. Lond. A 1937, 160, 268–282. [Google Scholar] [Green Version]
- Cox, D.R.; Reid, N. Parameter orthogonality and approximate conditional Inference. J. R. Stat. Soc. B 1987, 49, 1–39. [Google Scholar] [CrossRef]
- Lyons, B.; Peters, D. Applying skovgaard’s modified directed likelihood statistic to mixed linear models. J. Stat. Comput. Simul. 2000, 65, 225–242. [Google Scholar] [CrossRef]
- Guolo, A.; Brazzale, A.R.; Salvan, A. Improved inference on a scalar fixed effect of interest in nonlinear mixed-effects models. Comput. Stat. Data Anal. 2006, 51, 1602–1613. [Google Scholar] [CrossRef]
- Skovgaard, I.M. An explicit large-deviation approximation to one-parameter tests. Bernoulli 1996, 2, 145–165. [Google Scholar] [CrossRef]
- Barndorff-Nielsen, O. On a formula for the distribution of the maximum likelihood estimator. Biometrika 1983, 70, 343–365. [Google Scholar] [CrossRef]
- Stein, M.C.; da Silva, M.F.; Duczmal, L.H. Alternatives to the usual likelihood ratio test in mixed linear models. Comput. Stat. Data Anal. 2014, 69, 184–197. [Google Scholar] [CrossRef]
- Severini, T.A. An approximation to the modified profile likelihood function. Biometrika 1998, 85, 403–411. [Google Scholar] [CrossRef]
- Cordeiro, G.M.; Cribari-Neto, F. An Introduction to Bartlett Correction and Bias Reduction; Springer: New York, NY, USA, 2014. [Google Scholar]
- Davison, A.C.; Hinkley, D.V. Bootstrap Methods and Their Application; Cambridge University Press: Cambridge, UK, 1997. [Google Scholar]
- Efron, B.; Tibshirani, R.J. An Introduction to the Bootstrap; CRC Press: New York, NY, USA, 1994. [Google Scholar]
- Gregoire, A.J.; Kumar, R.; Everitt, B.; Henderson, A.F.; Studd, J.W. Transdermal oestrogen for treatment of severe postnatal depression. Lancet 1996, 347, 930–933. [Google Scholar] [CrossRef]
- Verbeke, G.; Molenberghs, G. Linear Mixed Models for Longitudinal Data; Springer: New York, NY, USA, 2000. [Google Scholar]
- Cox, D.R.; Hinkley, D.V. Theoretical Statistics; Chapman & Hall: London, UK, 1974. [Google Scholar]
- Barndorff-Nielsen, O.E.; Hall, P. On the level-error after Bartlett adjustment of the likelihood ratio statistic. Biometrika 1988, 75, 374–378. [Google Scholar] [CrossRef]
- Lawley, D.N. A general method for approximating to the distribution of likelihood ratio criteria. Biometrika 1956, 43, 295–303. [Google Scholar] [CrossRef]
- Melo, T.F.N.; Ferrari, S.L.P.; Cribari-Neto, F. Improved testing inference in mixed linear models. Comput. Stat. Data Anal. 2009, 53, 2573–2582. [Google Scholar] [CrossRef] [Green Version]
- Rocke, D.M. Bootstrap Bartlett adjustment in seemingly unrelated regression. J. Am. Stat. Assoc. 1989, 84, 598–601. [Google Scholar] [CrossRef]
- Noma, H.; Nagashima, K.; Maruo, K.; Gosho, M.; Furukawa, T.A. Bartlett-type corrections and bootstrap adjustments of likelihood-based inference methods for network meta-analysis. Stat. Med. 2018, 37, 1178–1190. [Google Scholar] [CrossRef] [PubMed]
- Wehrens, R.; Putter, H.; Buydens, L.M.C. The bootstrap: A tutorial. Chemometr. Intell. Lab. 2000, 54, 35–52. [Google Scholar] [CrossRef]
- Efron, B. Bootstrap Methods: Another Look at the Jackknife; Springer: New York, NY, USA, 1992. [Google Scholar]
- Zeng, Q.; Davidian, M. Bootstrap-adjusted calibration confidence intervals for immunoassay. J. Am. Stat. Assoc. 1997, 92, 278–290. [Google Scholar] [CrossRef]
- Everitt, B.S. A Handbook of Statistical Analyses Using S-Plus; CRC Press: New York, NY, USA, 2001. [Google Scholar]
- McCabe-Beane, J.E.; Segre, L.S.; Perkhounkova, Y.; Stuart, S.; O’Hara, M.W. The identification of severity ranges for the Edinburgh Postnatal Depression Scale. J. Reprod. Infant Psychol. 2016, 34, 293–303. [Google Scholar] [CrossRef]
- Ashbeck, E.L.; Bell, M.L. Single time point comparisons in longitudinal randomized controlled trials: Power and bias in the presence of missing data. BMC Med. Res. Methodol. 2016, 16, 43. [Google Scholar] [CrossRef] [PubMed]
- Van De Schoot, R.; Broere, J.J.; Perryck, K.H.; Zondervan-Zwijnenburg, M.; Van Loey, N.E. Analyzing small data sets using Bayesian estimation: The case of posttraumatic stress symptoms following mechanical ventilation in burn survivors. Eur. J. Psychotraumatol. 2015, 6, 25216. [Google Scholar] [CrossRef] [PubMed]


| Scenario | Missing Mechanism | Overall Dropout (%) | Dropout (%) | |||
|---|---|---|---|---|---|---|
| Placebo | Active | Placebo | Active | |||
| 1 | MCAR | 20 | 20 | 20 | 3.2 | 3.2 |
| 40 | 40 | 40 | 2.4 | 2.4 | ||
| MAR | 20 | 20 | 20 | 7.1 | 7.1 | |
| 40 | 40 | 40 | 4.2 | 4.2 | ||
| 2 | MCAR | 20 | 22 | 18 | 3.1 | 3.4 |
| 40 | 44 | 36 | 2.3 | 2.6 | ||
| MAR | 20 | 22 | 18 | 6.6 | 6.6 | |
| 40 | 44 | 36 | 3.7 | 3.7 | ||
| 3 | MCAR | 20 | 24 | 16 | 3.0 | 3.5 |
| 40 | 46 | 34 | 2.2 | 2.6 | ||
| MAR | 20 | 24 | 16 | 7.8 | 7.8 | |
| 40 | 46 | 34 | 4.8 | 4.8 | ||
| 4 | MCAR | 20 | 24 | 16 | 3.0 | 3.5 |
| 40 | 46 | 34 | 2.2 | 2.6 | ||
| MAR | 20 | 24 | 16 | 7.2 | 7.2 | |
| 40 | 46 | 34 | 4.2 | 4.2 | ||
| Whole Population (N = 61) | Subgroup (N = 30) | |||
|---|---|---|---|---|
| Estimate [95% CI] | p-Value | Estimate [95% CI] | p-Value | |
| LRBart | 4.34 [1.67, 7.66] | 0.0031 | 3.93 [−0.19, 10.24] | 0.0586 |
| LRBoot | 4.34 [1.70, 7.64] | 0.0050 | 3.93 [−0.16, 10.21] | 0.0583 |
| LR | 4.34 [1.81, 7.52] | 0.0019 | 3.93 [0.29, 9.74] | 0.0383 |
| KR | 4.34 [1.45, 7.23] | 0.0040 | 3.93 [−1.23, 9.09] | 0.1288 |
| -test | 4.36 [1.43, 7.29] | 0.0045 | 3.17 [−2.24, 8.57] | 0.2349 |
© 2019 by the authors. Licensee MDPI, Basel, Switzerland. This article is an open access article distributed under the terms and conditions of the Creative Commons Attribution (CC BY) license (http://creativecommons.org/licenses/by/4.0/).
Share and Cite
Ukyo, Y.; Noma, H.; Maruo, K.; Gosho, M. Improved Small Sample Inference Methods for a Mixed-Effects Model for Repeated Measures Approach in Incomplete Longitudinal Data Analysis. Stats 2019, 2, 174-188. https://doi.org/10.3390/stats2020013
Ukyo Y, Noma H, Maruo K, Gosho M. Improved Small Sample Inference Methods for a Mixed-Effects Model for Repeated Measures Approach in Incomplete Longitudinal Data Analysis. Stats. 2019; 2(2):174-188. https://doi.org/10.3390/stats2020013
Chicago/Turabian StyleUkyo, Yoshifumi, Hisashi Noma, Kazushi Maruo, and Masahiko Gosho. 2019. "Improved Small Sample Inference Methods for a Mixed-Effects Model for Repeated Measures Approach in Incomplete Longitudinal Data Analysis" Stats 2, no. 2: 174-188. https://doi.org/10.3390/stats2020013
APA StyleUkyo, Y., Noma, H., Maruo, K., & Gosho, M. (2019). Improved Small Sample Inference Methods for a Mixed-Effects Model for Repeated Measures Approach in Incomplete Longitudinal Data Analysis. Stats, 2(2), 174-188. https://doi.org/10.3390/stats2020013