Abstract
The Birnbaum-Saunders (BS) distribution, with its generalizations, has been successfully applied in a wide variety of fields. One generalization, type-II generalized BS (denoted as GBS-II), has been developed and attracted considerable attention in recent years. In this article, we propose a new simple and convenient procedure of inference approach for GBS-II distribution. An extensive simulation study is carried out to assess performance of the methods under various settings of parameter values with different sample sizes. Real data are analyzed for illustrative purposes to display the efficiency of the proposed method.
1. Introduction
Over the past decades, numerous researches of flexible distributions have been developed and studied to model fatigue failure (or life) time of products for reliability/survival analysis in engineering and other fields, see [1,2,3,4], just to name a few. As a result of the Birnbaum-Saunders (BS) distribution [5] being successful in modeling fatigue failure times, this model and its extensions have been attracted considerable attention in recent years. The distribution was developed to model failures due to fatigue under cyclical stress on materials. The failure follows from the development and growth of a dominant crack in the product. The BS distribution can be widely applied for describing fatigue life in general, and its application has been extended to other fields where an accumulation forces a quantity to exceed a critical threshold. Thus, the model becomes the most versatile within the popular distributions for failure times due to fatigue and cumulative damage phenomena. The distribution function of the failure time T is expressed
where are shape and scale parameters, is the distribution function of standard normal variate. The BS distribution can be widely applied to describe fatigue life and lifetimes in general. Its field of application has been extended beyond the original context of material fatigue, and the model becomes a fairly versatile within the popular distributions for failure times. Over the years, various approaches of parameter inference, generalizations, and applications of the distribution have been introduced and developed by many authors (see, for example, [6,7,8]). A comprehensive review of the statistical theory, methodology, and applications of BS distribution can be revised in [9].
In the past decade, numerous researches have been dedicated to generalizations of the distribution and their applications. Using elliptical distributions to replace the normal function , Ref. [10] extended the BS to a very broad family of spherical distributions. This generalized BS (GBS) is a highly flexible life distribution that admits different degrees of kurtosis and asymmetry, and possesses unimodality and bimodality. As the BS distribution, the GBS distribution can be widely applied in problems involving cumulative damage, which occurs commonly in engineering, environmental, and medical studies. Various researches of the GBS have been studied on the theory and applications in [10,11,12,13], and others. Based on a multivariate elliptically symmetric distribution, a generalized multivariate BS distribution was introduced in [14], who discussed its general properties and presented the statistical inference of parameters. Most recently, Ref. [15] presented moment-type estimation methods for the parameters of the generalized bivariate BS distribution and showed the asymptotic normality of the estimators. However, the use of symmetric distributions as a generalization of the normal model is not based on empirical argument neither on physical laws. One reasonable generalization was first proposed in [16] by allowing the exponent (presently set 1/2 on the BS) to take on other values. Recently, considering the original BS distribution obtained from a homogeneous Poisson process, Ref. [17] derived the same generalized BS depending on a non-homogeneous Poisson process. To distinguish from the GBS developed in [18], this GBS is referred to as Type-II GBS, denoted by GBS-II , whose distribution and density functions are given by
where and are both shape-type parameters, is a scale parameter, is the density function of standard normal distribution. As the BS distribution, the transformation leads to a standard normal variate, and it is useful for random value generation, integer moments derivation as well as the development of the estimation procedure presented in this article.
So far, little research has been seen on the analysis for the GBS-II distribution in Equation (2). Ref. [19] discussed the likelihood-based estimation of parameters and provided interval estimation based on “observed” Fisher’s information. In this article, to contribute to the relatively neoteric body of research, we propose a new inference method for the parameter estimation and hypothesis testing for the GBS-II model. Our method provides explicit expressions and easier computations for the estimates. The rest of the article is arranged as follows. Section 2 presents some interesting properties of GBS-II distribution. The methodology is presented for inference procedure in Section 3. Subsequently, we carry out simulation studies to investigate the performance of proposed methods in Section 4. For illustrative purposes, one real data set is analyzed in Section 5, followed by some concluding remarks in Section 6.
2. Properties of GBS-II
The three-parameter GBS-II distribution in Equation (2) is a flexible family of distribution, and the shape of the density widely varies with different values of the parameters. Specifically (a detailed proof is provided in Appendix A), (i) when , the density is unimodal or upside-down bathtub; (ii) when and , the density is also unimodal (upside-down); (iii) if and , then the density is either unimodal or bimodal. Figure 1 shows various graphs of the density function for different values of m and with the scale parameter fixed at unity. Additionally, Figure 2 presents the failure rate function given by with various values of m and , showing that it could have increasing, decreasing, bathtub, and upside-down bathtub-shapes. Hence, it seems that the distribution is flexible enough to model various situations of product life.
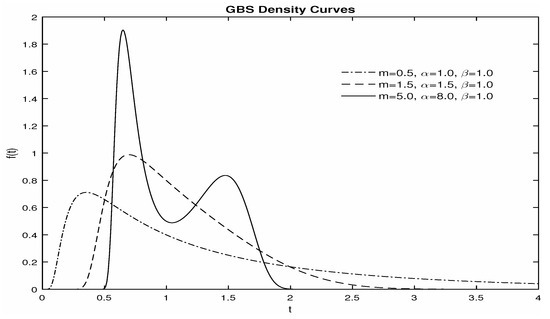
Figure 1.
Type-II generalized Birnbaum-Saunders (GBS-II) density curves for various parameter values.
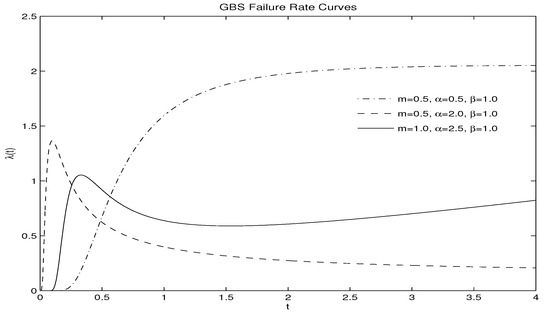
Figure 2.
GBS-II failure rate curves for various parameter values.
The GBS-II has some interesting properties as BS distribution. For example, remains the median for the distribution. The reciprocal property is also preserved by that if GBS-II , then GBS-II . In fact, the GBS-II generally describes the distribution family of power transformations for BS random variable from the following: if BS , then for any nonzero real-valued constant GBS-II , where represents the absolute value function. Conversely, given GBS-II , then BS . In addition, similar to the BS distribution which can be written as an equal mixture of an inverse normal distribution and distribution of the reciprocal of an inverse normal random variable [20], the GBS-II distribution can be also expressed as a mixture of power inverse normal-type distributions [19].
In respect of numeric characteristics for the GBS-II, generally, there is no analytic form of moments except for some special cases. For example, from the fact that with a standard normal variate Z, one may easily obtain the expressions of the moments E with an even number k, such as E, E, etc. One general moment expression was obtained in [21], who used the relationship between the GBS-II and three-parameter sinh-normal distribution described in [22]
where is the third kind modified Bessel function of order , which can be expressed in an integral form as with the hyperbolic cosine function . Numerous software packages can be used to evaluate for specific values of and x for calculating the moments such as the mean and variance. The finite moments guarantee the rationality of the moment-based type estimation methods provided in the following section.
3. Inference Approach
Throughout this section, we denote as the random observational data of size n from the GBS-II distribution. To make notation simple, let and . Then the log-likelihood function based on the density function in Equation (3) is given by
and the score functions for each parameter are the followings
Due to the complexity of the expression above, there are no tractable forms of maximum likelihood estimates (MLEs). Some powerful computational techniques, such as the general-purpose optimization method, EM algorithm, or its extensions, can be applied to obtain MLEs by solving the equations , and simultaneously. Since there is no analytic form of Fisher’s information matrix, Ref. [19] used the “observed” one to obtain a large-sample based interval estimation for the parameters. We propose an alternative and comparatively simple procedure for applicable inference in the following.
3.1. New Estimation Method
First, since the scale parameter is also the median of the GBS-II, one simple estimate of is the sample median below
Secondly, for GBS-II , the transformed random variable with and has a sinh-normal distribution (see, for example, [22]), whose distribution and density functions are given by
The distribution has the expression of moments below
By the fact that from , we set up the equation by the first moment to the sample mean with the transformed samples , and obtain the method of moment estimate of , which is the geometric mean of the data, given by
Further, and result in the same kurtosis for W and Y, that is, . By equating sample kurtosis to the theoretical one, the moment estimate can be obtained numerically from the following equation
where the sample kurtosis of Y is with . Although there is no analytic form, the uniqueness of is justified in Appendix A. Finally, the estimate of m is
Additionally, by the following Taylor expansions
the transformed random variable has the approximate distribution function given by
where
It is easily seen that (i) the value of is close to zero if y is close to ; (ii) if y is away from , is also close to zero since the decay rate of exponentiation with power is much faster than the growth rate of the polynomials of . Hence, N with . By this distribution approximation, a moment estimate of m is given by
with the sample variance . The estimate, indeed, is an approximation of the estimate in Equation (14) where the function is approximated by the first term of its Taylor series and replaced by .
Finally, from the well-known fact that and , the approximate confidence intervals (CI) of and are respectively given by
where are the upper -th percentile of the and t distributions with degrees of freedom . Accordingly, the approximate CIs of m and , from the relation , are in the following
It is worthwhile to point out that the presented method can be extended to the censored observations which is a usual scenario for real life data in engineering. As an illustrative example, we briefly describe the estimation procedure for right-censored data. Suppose that the failure time T is a right-censored variable at c, with c being a pre-specified censored value. Then the transformed time may be regarded as a mixture of a binary and approximated right-truncated at . The moment-type estimates of the parameters can be obtained numerically in the moment equations, where the theoretical moments provided in [23] are given below,
where . Additionally, the interval estimation can be constructed by the method in [24] who provide formulas for confidence intervals around the truncated moments. Thus, for the censoring case, the computational complexity will increase due to no explicit forms.
3.2. Hypothesis Tests
Here we specifically consider the gradient test [25], and for comparison purposes, the likelihood ratio test is also presented. Generally, let and be the log-likelihood and score functions with the p-vector parameter . Consider a partition , where are the q and parameter vector, respectively. Suppose the interest lies in testing the composite null hypothesis versus , where is a specified q-dimensional vector, and is a -vector nuisance parameter. The partition for induces the corresponding partition of score function with . The likelihood ratio and gradient statistics for versus are given by
where and denote the MLEs of under and , respectively. Both limiting distributions of and are , i.e., chi-square with q degrees of freedom. In practice, the simplicity for the gradient statistic is always an attraction since the score function is quite bit simpler than the log-likelihood itself in many cases. Also, it does not require one to obtain, estimate, or invert an information matrix as the Wald and score statistics [26]. Hence, the gradient statistic makes the testing quiet convenient, especially for the GBS-II distribution, which possesses a complicated likelihood function and an intractable information matrix.
For the GBS-II distribution, the log-likelihood function and the score function are given in Equations (5)–(7), respectively, with the parameter vector and the MLEs . The interest lies in testing the three null hypotheses:
against , respectively, where are the specified positive scalars. Let , and be the restricted MLEs under each null hypothesis, then the likelihood ratio and gradient statistics, respectively, are given by
The asymptotic distribution of these statistics is under the respective null hypotheses and the test is significant if the test statistic exceeds the upper percentile . In the following section, we conduct an extensive simulation study to evaluate and compare the performance of the proposed estimation and the test statistics.
4. Simulation Study
First, we carry out a simulation study to investigate the performance of two estimates of in Equation (8) and Equation (12). We fix the scale parameter and set . Under each combination of the parameter values, we generate 10,000 data sets of GBS-II random observations for each sample size to calculate the two estimates, as well as their mean square error (MSE). The comparison plot of two estimates is shown in Figure 3, where, from top to bottom, two plots correspond to the estimation results under the parameter settings , and the left and right panels demonstrate the averaged estimates and their MSEs, respectively. From these plots, one may see that the geometric mean is the better estimate since it has both smaller bias and MSE than these by the sample median , especially when sample size is small.
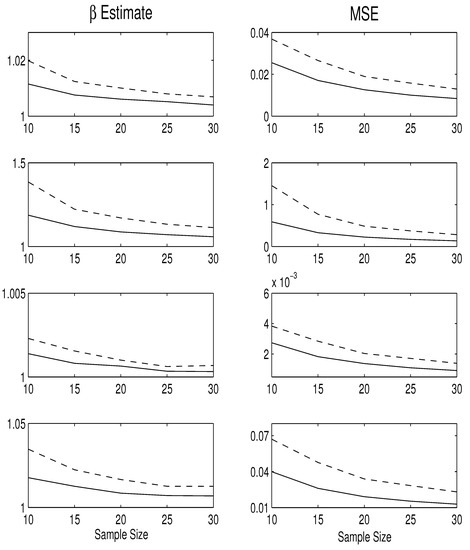
Figure 3.
Comparisons of estimates for various sample sizes: geometric mean (solid line), sample median (dashed line).
Next, we conduct another simulation study to assess performance of parameter estimation by the new method, where is estimated by , in Equation (14) and in Equation (13). With fixing the scale parameter , we take five settings of other two parameters as . For each of these parameter settings with three sample sizes , we generate 10,000 data sets to compute the averaged biases and MSEs of the estimates, as well as average lengths (AL) of the 95% confidence intervals (CI), and coverage probability (CP) for the parameters. The results are summarized in Table 1, along with these estimates from the ML method for comparison purposes. The main features are summarized as follows: (i) As expected, the bias, MSE, and length of 95% CI decrease, and CP is closer to the nominal level as the sample size n increases for all cases; (ii) the estimation of all parameters from the new method is much better than from the ML approach in terms of smaller biases and MSEs, narrow CIs, and higher CPs; (iii) comparatively, for both methods, much more accurate estimation of are obtained (especially for the new method), whereas a less precise for the estimation of m and least accurate for the estimation of . Particularly, the MLE does not perform well for the small to moderate sample sizes (). With the larger sample size (), the performances of the estimates are similar for both methods; (iv) it seems that the estimate of has a smaller MSE when the true value of is small, whereas the estimate of m has a smaller MSE when the true value of m is large. Overall, the numerical results favor the new inference method for the estimation on the parameters, especially when the sample size is small.

Table 1.
Type-II generalized Birnbaum-Saunders (GBS-II) Estimation Results for Simulated Data.
Finally, we evaluate and compare the performance of the likelihood ratio and gradient tests for the hypotheses on the parameters. With 10,000 Monte Carlo replications, Table 2 presents the null rejection rates of the two statistics and under various parameter settings, sample sizes, and the nominal levels and 5%. Table 3 contains the powers obtained under the significance level and the alternative hypotheses: , and for various values of and . Our main findings are as follows. First, the test is less size distorted than the test. In fact, the gradient test produces null rejection rates close to the nominal levels in all cases. For example, for with , and , the null rejection rates are 6.28 ( and 5.39 (). In the test of for the values of , the likelihood ratio test is oversize whereas the gradient test becomes undersized. All the tests become less size distortion as the sample size increases, as expected. Additionally, the is more powerful than for all the cases. For example, when in the hypothesis vs. , the powers are 61.76% () and 64.16% (). It is also clear that the powers of the two tests increase with the sample size and alternative values , and . In summary, the simulation studies imply that the new estimation method and the gradient test perform better than ML approach and the likelihood ratio test, respectively, for all parameter settings, particularly in the small and moderate sample sizes.

Table 2.
Null rejection rates (%) for various parameter settings.

Table 3.
Power (%) under two parameter settings at significance level .
5. Real Data Analysis
To further demonstrate the usefulness of our method in parameter inference for the GBS-II, we consider a real data presented in [27] on active repair times (in hours) for an airborne communications transceiver. To illustrate the estimation performance on a small sample size, we randomly select 20 repair times out of the total 46 observations to have following data: 0.2, 0.5, 0.5, 0.6, 0.7, 0.7, 0.8, 1.0, 1.0, 1.1, 1.5, 2.0, 2.2, 3.0, 4.0, 4.5, 5.4, 7.5, 8.8, 10.3. Modeling the data by the GBS-II distribution by ML and the new methods, the estimation results are summarized in Table 4, where the produced standard errors (SE) and 95% CIs by the new approach are much smaller and narrower for the parameters, especially for the intervals of m and . In addition, one interest of hypothesis test lies in testing since GBS-II reduces to BS under the null. The likelihood ratio and gradient tests yield the statistics and , showing a highly insignificant from the gradient test, which is consistent with the outcome of CIs for m. Finally, the chi-squared goodness of fit statistic and BIC values of model fitting by the new method are smaller than these by ML method, indicating the greater accuracy of the proposed new method. Figure 4 shows that the fitted GBS-II density curve estimated by the new method is closer to the histogram than the one by the ML approach. These outcomes demonstrate that the proposed new method produces more accurate inference under the small sample size.

Table 4.
Repair Time: Estimation Results.
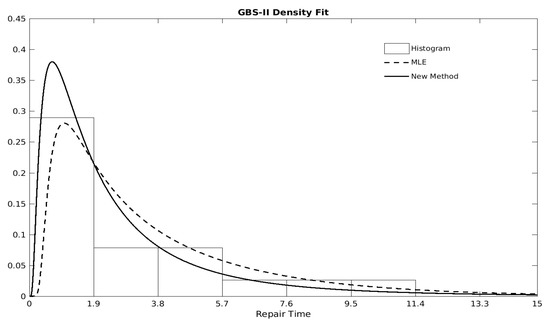
Figure 4.
Repair Data: Histogram and fitted density curves by maximum likelihood estimate (MLE) and new estimation method.
6. Conclusions Remarks
We presented the parameter inference for a generalized three-parameter Birnbaum-Saunders (GBS-II) distribution, which exhibits a very flexible characteristic in modeling various life behavior of products. To circumvent the arduous expressions of likelihood function, a new method of analysis was proposed to make inference more applicable and convenient. Simulation studies suggest that, compared with the likelihood-based approach, the new method produces a reasonable estimation result and provides a feasible inference procedure for the GBS-II distribution. We have also illustrated, with one real dataset, that our method can be readily applied for convenient, practical, and reliable inference.
Funding
This research was funded by NSF CMMI-0654417 and NIMHD-2G12MD007592.
Conflicts of Interest
The author declares no conflict of interest.
Appendix A
1. A detail presentation of the shape for GBS-II density curve is provided here. Without loss of generality and making notations simple, we fix and let . Then the derivative of density function can be written as
where . Since the sign of only depends on the sign of , we consider the behavior of . First, we have and . Let , then . Further, let , and then . Now we consider three cases below.
- (1)
- .In this case, for . (i) if , then . With , we know that in . Thus, there exists a root of to have , and when ; when . Therefore is a unimodal. (ii) if , then . Thus there is a unique root of the quadratic function with , and when , ; when . Therefore there is one root of such that , and when ; when . It results in is unimodal.
- (2)
- and .(i) if , then . Also , and so in . Hence there is a root of with , and when ; when . It indicates that is unimodal. (ii) if , then . Hence there is a unique root of with , and when ; when . Thus there exists a root of with , and when ; when . Therefore is unimodal.
- (3)
- and .Thus , and so there is a unique root of satisfying that: when and when . In addition, , and so two cases need to be discussed. (i) if there is only one root for , then for . Hence there is a unique root of the cubic function . Thus , and when , when . So is unimodal. (ii) if there are two distinct roots for , then we know that: when , when , and when . There could be two cases: (a) If the cubic function has one or two distinct roots, then one root, say , leads to , and in ; in . Hence is unimodal; (b) If has three distinct real roots , then we have that , and that: when , when , when , when . It indicates is bimodal.
2. We provide the proof of uniqueness of the root in the Equation (13). Let , and so it is an odd function for z, that is, . We denote
In the following, we show that the function is a monotone decreasing for . Since ,
where, by switching the role of y and z, the function above can be written as
Let , and then . Further, let , then . Hence is increasing in . Also , thus , and so , that is, is increasing of z in . In addition, is also an increasing function of z and in since and . Thus both functions and have the same sign for any values of in , and it leads to . Hence the function
resulting in
Additionally, by Taylor expansion, we have
along with
Figure A1 shows the plot of the function .
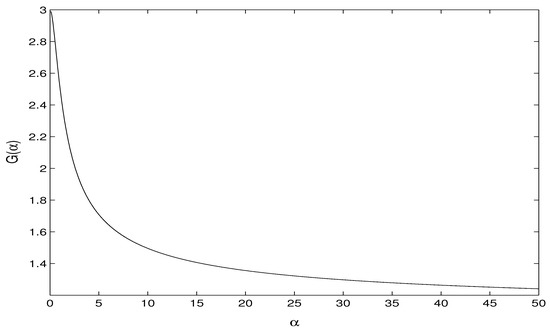
Figure A1.
Kurtosis Function .
Finally, with , it is well known that for any samples , the sample kurtosis . Hence the equation has a unique root for .
References
- Stacy, E.W. A Generalization of the Gamma Distribution. Ann. Math. Stat. 1962, 33, 1187–1192. [Google Scholar] [CrossRef]
- Mudholkar, G.S.; Srivastava, D.K. Exponentiated Weibull family for analyzing bathtub failure-ratedata. IEEE Trans. Reliab. 1993, 42, 299–302. [Google Scholar] [CrossRef]
- Marshall, A.W.; Olkin, I. A new method for adding a parameter to a family of distributions with application to the exponential and Weibull families. Biometrika 1997, 84, 641–652. [Google Scholar] [CrossRef]
- Rubio, F.J.; Hong, Y. Survival and lifetime data analysis with a flexible class of distributions. J. Appl. Stat. 2016, 43, 1794–1813. [Google Scholar] [CrossRef]
- Birnbaum, Z.W.; Saunders, S.C. A new family of life distributions. J. Appl. Probab. 1969, 6, 319–327. [Google Scholar] [CrossRef]
- Ng, H.K.T.; Kundub, D.; Balakrishnan, N. Modified moment estimation for the two-parameter Birnbaum–Saunders distribution. Comput. Stat. Data Anal. 2003, 43, 283–298. [Google Scholar] [CrossRef]
- Lemonte, A.J.; Cribari-Neto, F.; Vasconcellos, K.L.P. Improved statistical inference for the two-parameter Birnbaum-Saunders distribution. Comput. Stat. Data Anal. 2007, 51, 4656–4681. [Google Scholar] [CrossRef]
- Balakrishnan, N.; Zhu, X. An improved method of estimation for the parameters of the Birnbaum-Saunders distribution. J. Stat. Comput. Simul. 2014, 84, 2285–2294. [Google Scholar] [CrossRef]
- Leiva, V. The Birnbaum-Saunders Distribution; Academic Press: New York, NY, USA, 2016. [Google Scholar]
- Díaz-García, J.A.; Leiva, V. A new family of life distributions based on elliptically contoured distributions. J. Stat. Plan. Inference 2005, 128, 445–457, Erratum in 2007, 137, 1512–1513. [Google Scholar] [CrossRef]
- Leiva, V.; Riquelme, M.; Balakrishnan, N.; Sanhueza, A. Lifetime analysis based on the generalized Birnbaum-Saunders distribution. Comput. Stat. Data Anal. 2008, 52, 2079–2097. [Google Scholar] [CrossRef]
- Leiva, V.; Vilca-Labra, F.; Balakrishnan, N.; Sanhueza, A. A skewed sinh-normal distribution and its properties and application to air pollution. Commun. Stat. Theory Methods 2010, 39, 426–443. [Google Scholar] [CrossRef]
- Sanhueza, A.; Leiva, V.; Balakrishnan, N. The generalized Birnbaum-Saunders and its theory, methodology, and application. Commun. Stat. Theory Methods 2008, 37, 645–670. [Google Scholar] [CrossRef]
- Kundu, D.; Balakrishnan, N.; Jamalizadeh, A. Generalized multivariate Birnbaum-Saunders distributions and related inferential issues. J. Multivar. Anal. 2013, 116, 230–244. [Google Scholar] [CrossRef]
- Saulo, H.; Balakrishnan, N.; Zhu, X.; Gonzales, J.F.B.; Leao, J. Estimation in generalized bivariate Birnbaum-Saunders models. Metrika 2017, 80, 427–453. [Google Scholar] [CrossRef]
- Díaz-García, J.A.; Domínguez-Molina, J.R. Some generalizations of Birnbaum-Saunders and sinh-normal distributions. Int. Math. Forum 2006, 1, 1709–1727. [Google Scholar] [CrossRef]
- Fierro, R.; Leiva, V.; Ruggeri, F.; Sanhuezad, A. On a Birnbaum–Saunders distribution arising from a non-homogeneous Poisson process. Stat. Probab. Lett. 2013, 83, 1233–1239. [Google Scholar] [CrossRef]
- Owen, W.J. A new three-parameter extension to the Birnbaum-Saunders distribution. IEEE Trans. Reliab. 2006, 55, 475–479. [Google Scholar] [CrossRef]
- Owen, W.J.; Ng, H.K.T. Revisit of relationships and models for the Birnbaum-Saunders and inverse-Gaussian distribution. J. Stat. Distrib. Appl. 2015, 2. [Google Scholar] [CrossRef]
- Desmond, A.F. On the relationship between two fatigue-life models. IEEE Trans. Reliab. 1986, 35, 167–169. [Google Scholar] [CrossRef]
- Rieck, J.R. A moment-generating function with application to the Birnbaum-Saunders distribution. Commun. Stat. Theory Methods 1999, 28, 2213–2222. [Google Scholar] [CrossRef]
- Johnson, N.L.; Kotz, S.; Balakrishnan, N. Continuous Univariate Distributions; John Wiley & Sons: New York, NY, USA, 1995. [Google Scholar]
- Greene, W.H. Econometric Analysis, 5th ed.; Prentice Hall: New York, NY, USA, 2003. [Google Scholar]
- Bebu, I.; Mathew, T. Confidence intervals for limited moments and truncated moments in normal and lognormal models. Stat. Probab. Lett. 2009, 79, 375–380. [Google Scholar] [CrossRef]
- Terrell, G.R. The gradient statistic. Comput. Sci. Stat. 2002, 34, 206–215. [Google Scholar]
- Sen, P.; Singer, J. Large Sample Methods in Statistics: An Introduction with Applications; Chapman & Hall: New York, NY, USA, 1993. [Google Scholar]
- Balakrishnan, N.; Leiva, V.; Sanhueza, A.; Cabrera, E. Mixture inverse Gaussian distribution and its transformations, moments and applications. Statistics 2009, 43, 91–104. [Google Scholar] [CrossRef]
© 2019 by the author. Licensee MDPI, Basel, Switzerland. This article is an open access article distributed under the terms and conditions of the Creative Commons Attribution (CC BY) license (http://creativecommons.org/licenses/by/4.0/).