Abstract
Accelerated water erosion is a major soil degradation process that affects soil and water quality. In Cuba, specifically, more than 40% of agricultural lands are affected by severe erosion problems. Estimating accurate erodibility values is a crucial step for the calibration and proper application of erosion models. Several equations have been developed to estimate erodibility from soil properties; however, these are often soil- or site-specific, limiting their application. This study aims to (1) identify soil properties governing the erodibility of tropical soils from western Cuba, (2) find suitable regression models to estimate erodibility from these properties, and (3) test widely applied erodibility equations. To achieve these goals, rainfall simulation experiments were conducted on runoff plots, and erosion-related physical, chemical, and mechanical soil properties were determined for 19 different soils. The main results indicated that good correlations between erodibility and certain soil properties were achieved after clustering soils based on their cation exchange capacity (CEC) values and clay content. Soils characterized by more than 30% of clay and 40 cmol+ kg−1 of CEC were excluded from the main analysis. Generally, clay content controls the erodibility of these tropical soils, exhibiting an inverse relationship. However, in the excluded soils, the clay fraction showed a positive relationship with erodibility. Soil water retention at the lowest matric potentials demonstrated the strongest correlation with soil erodibility, as this variable encompasses compound information related to clay, mineralogy, and organic matter. A new regression model to estimate erodibility based solely on the volumetric water content at 1500 kPa is presented. The optimal fitted logarithmic model accounts for 64% of the predictand variability in the studied soils. When testing known erodibility models, the nomograph was found to best mimic the erodibility trend of these soils, although it exhibited marked uncertainty and underestimation biases.
1. Introduction
Accelerated water erosion is a major soil degradation process that affects soil and water quality, particularly in Cuba where over 40% of agricultural lands are impacted by severe erosion [1]. This equates to 2.5 million hectares affected by soil and land degradation [2]. Facing this reality, models are key tools for studying and predicting erosion, and designing conservation plans, even for long periods under climate change scenarios. The most commonly used erosion model is the Universal Soil Loss Equation (USLE) and its revised version (RUSLE), which estimates long-term average annual soil loss by sheet and rill erosion [3].
Erodibility, or the K factor, is related to soil characteristics in the USLE family models, but it also constitutes a basic parameter for many other empirical and process-based erosion models developed worldwide [4]. K is a measure of the total effect of a particular combination of soil properties; some influencing the soil’s capacity to infiltrate rain and some influencing its capacity to resist detachment and transport by the erosive forces. The interrelations of these variables are highly complex [5,6].
Due to the complex influence of soil properties on erodibility, contrasting findings have been reported in the literature, particularly when comparing clayey tropical soils with temperate soils. Organic matter generally reduces soil erodibility through its role in binding soil aggregates [7]. However, this effect tends to be limited in clayey soils [8]. In contrast to temperate regions, Six et al. [9] found a weak correlation between aggregate stability and carbon content in tropical soils, suggesting that the higher aggregate stability observed in these soils is likely related to their specific mineralogical compositions. Soil mineralogy strongly influences clay dispersion and, consequently, aggregate stability, runoff, and soil loss [10]. Among clay minerals, smectitic soils are the most dispersive, whereas kaolinitic soils exhibit the least dispersion [11]. Soils with high CEC values (>40–50 cmol+ kg−1 clay) are typically dominated by smectitic or vermiculitic clays, which have high layer charge and strong swelling potential [12,13]. Despite the accumulated knowledge, the understanding of the effects of soil properties on interrill erodibility in clayey soils with different mineralogies remains limited [14].
Estimating accurate K values is crucial for the calibration and proper application of erosion models. While rainfall simulation studies are less precise than natural plots in estimating erodibility, and predictive relationships are the least reliable [15], the establishment of long-term runoff plots has been constrained by time and economic factors. This has consequently promoted research using simulated rainfall [6] and the development of methods to predict K from soil properties for broader extrapolation [5,16].
One of the earliest and most widely applied equations to estimate erodibility from soil properties is the nomograph, with its algebraic approximation developed by Wischmeier and Smith [3,17]. This nomograph is well-suited for less aggregated, medium-textured soils of the central USA [6,17]. Renard et al. [6] reported another relationship, based on textural characteristics, derived from global data of measured K values (225 soils). This latter relationship is offered as a useful alternative for predicting K values of soil classes other than those on which the nomograph was based, particularly when soil data is limited. Other equations for estimating erodibility have been formulated for different regions and conditions, including those for volcanic soils in Hawaii [18], for Australian conditions [19], and a correction of the nomograph-based equation [4]. These, and many other relationships, are soil- or site-specific with limited application. Therefore, when extrapolating to other regions (different soil characteristic, climate, landscape) they must be tested, calibrated, or, at best, appropriate relationships should be found.
In Cuba, there is a lack of information regarding erodibility–soil property relationships and equations to estimate soil erodibility. Consequently, this study aims to (1) identify the soil properties governing the erodibility of tropical soils from western Cuba, (2) find suitable regression models to estimate erodibility from soil properties, and (3) test widely applied erodibility equations. To achieve these goals, rainfall simulation experiments were conducted on runoff plots, and erosion-related physical, chemical, and mechanical soil properties were determined. The study included 19 soils, exhibiting a wide range of properties, from the Cuyaguateje River basin in Pinar del Río province.
2. Materials and Methods
2.1. Study Area
This study focused on 19 soils from V Aniversario subwatershed, Cuyaguateje River, Pinar del Río Province, Cuba (Figure 1). The basin is extended over 157 km2 between 22°24′6″–22°35′40″ longitude and 83°47′55″–83°56′9″ latitude. The region is subjected to a tropical climate with an annual mean temperature of 25.1 °C, evaporation of 1860 mm, precipitation of 1766 mm, and a defined rainy season between May and October [20]. Agricultural production is the main economic activity in the basin which includes forestry, tobacco, rice, etc. Its tobacco production constitutes the major source for the national industry [21,22].
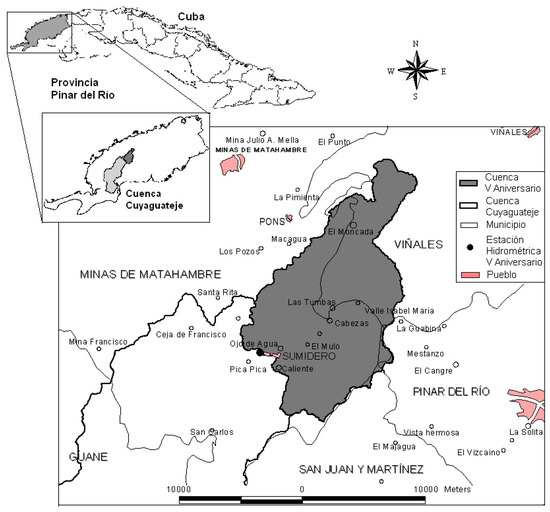
Figure 1.
Geographical location of V Aniversario watershed.
2.2. Soil Analysis
Table 1 summarizes analyzed soil properties. Disturbed air-dried soil samples (three replicates) and core samples (six replicates, 100 cm3 cylinder) of the 19 soils were collected and analyzed in the Ghent University Department of Soil Management laboratory and the Agrarian University of Havana Soil laboratory to obtain erosion-related soil properties. Soil selection was guided by differences in type, subtype, and texture, according to the soil map (scale 1:25,000). Representative soil profiles were used for sampling and rainfall simulations.

Table 1.
Summary of the soil property determined in the current study, including the methodology for their measurement and the units employed.
The method used to determine texture quantifies particle size distribution of dispersed soil aggregates through dry sieving the sand fraction and differential sedimentation of the clay and loam fraction in a stand still liquid (pipette). To determine the particle size distribution, organic matter and CaCO3 were removed. Table 2 shows the soil texture of the 19 soils. In the granulometric analysis, some commonly erodibility-related textural fractions were depicted: modified silt (0.002–0.1 mm), fine sand (0.05–0.1 mm), and coarse sand (0.1–2 mm).

Table 2.
Determined soil texture fractions and USDA textural class of the studied soils.
The dichromate oxidation technique was applied to determine organic carbon content (OC). Water-saturated soil pH was determined using a glass electrode in a 1:5 soil–to–water mixture. The same mixture was used to measure the apparent electro-conductivity (EC). Cation exchange capacity (CEC) was measured using the Ammonium Replacement method. In this method, the colloidal soil complex was saturated with ammonium ions, which were then replaced by potassium cations and quantified through steam distillation.
Bulk density (ρb) was measured using the gravimetric method in core samples. Retention–water content Ψm [kPa]—θv [cm3 cm−3] pairs were determined by the use of the Hanging Water Column (sand-box) [27] for the lower pressures and the Pressure Plate [28]. Volumetric water content (θv) was measured at 1 kPa, 5 kPa, 9 kPa, 33 kPa, 100 kPa, 300 kPa, 1500 kPa potentials. A mean profile penetration resistance (PR) was computed out of 19 points in depth (total 47.5 cm, each 2.5 cm) and 10 spatially distributed replicates. Measures were performed using a penetrometer with a conic point. Table 3 shows the rest of determined soil properties for the 19 soils.

Table 3.
Determined soil properties for the 19 studied soils.
Infiltration (Inf) was computed averaging the differences between rain and runoff from the rainfall experiment steady-state period.
Following the USDA textural classification [29], the studied site comprised 7 clayey, 1 sandy clay, 4 clay loam, 5 sandy loam, 1 loam, and 1 loamy sand soils (Table 2). The soils covered a wide range of granulometric composition; however, clay- and medium-textured soils were predominant. Clay fraction oscillated between 6.8 and 75.7%, with a mean value of 33.26%. Values over the 75th percentile of the variable distribution corresponded to clay and clay loam soils. The highest silt content is 38.1%, which indicated non-presence of silt soils in this soil set. Sand content reached 74.13% and a mean of 40.6%.
Table 3 showed that organic carbon is high in most of the soils with a mean value of 3% and varying between 1.35 and 5.85%. These high values can be associated with the fact that many of these soils have been under reduced or no-tillage conditions for a long period. pH is neutral or slightly alkaline, oscillating between 6.25 and 8.14, and has a low variability (Coef. of Variation = 0.06). The other measured properties had a wide range of variation.
2.3. Soil Erodibility
Soil erodibility was assessed through rainfall simulation experiments and estimated using established regression models.
2.3.1. Erodibility from Rainfall Simulation Plots
Rainfall simulation experiments were conducted on field plots using a rainulator, a copy of the device described by Cornelis et al. [30]. This device features six U-shaped supporting bases and a central pipe equipped with up to eight pressurized nozzles (TeeJet TG SS 14w), each spaced one meter apart (for more details, see Erpul et al. [31]). During the experiments, nozzle settings varied, but the height remained fixed at 1.8 m.
Rainfall simulation experiments were designed to evaluate in situ the hydrological and erosion behaviors of the soils under investigation. Large plots (10 m2) were delimited with rubber plates, partially dug into the soil to prevent water flow into or out of the plots. Plants were carefully removed, ensuring the soil surface remained as undisturbed as possible. Figure 2 illustrates the experimental setup.
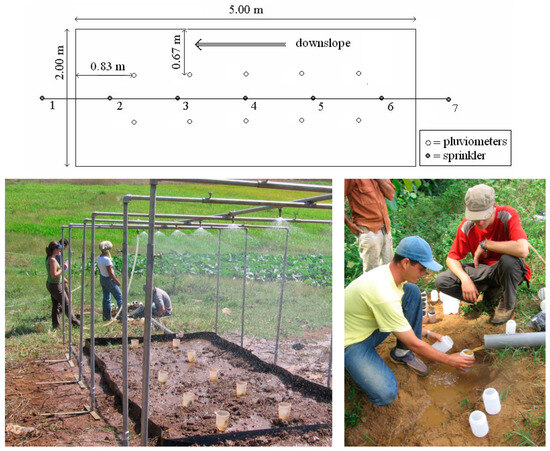
Figure 2.
Several features of the experimental setup for simulating rainfall in erosion plots. Top: experimental setup. Bottom: plot and gauging system.
Two rainfall simulation experiments were conducted per soil type, varying the supplied water configuration and associated rainfall intensity. This aims to reproduce the natural rainfall intensities of the region and to account for different rainfall characteristics. The first experiment (dry run) utilized all nozzles with a water pressure of 1 bar, resulting in a rainfall intensity of approximately 120 mm h−1. The second experiment (wet run) employed only the odd nozzles at a pressure of 0.5 bar, producing a rainfall intensity of around 60 mm h−1. The experiments were carried out during the dry season period. Each experiment concluded after ten minutes of constant runoff (steady-state), with a 30 min rest period between the dry and wet trials (hereafter also referred to as dry and wet run). The dry and wet experiments lasted on average 26 and 18 min, respectively. Runoff was manually gauged at the plot outlet, and samples (250 mL) for sediment concentration analysis were collected every minute.
The interril soil erodibility was computed following the Universal Soil Loss Equation procedure, as indicated by Wischmeier and Smith [32]:
where Ksim is erodibility from simulation [t ha h ha−1 MJ−1 mm−1]; A is event total soil loss [t ha−1]; LSplot is slope length and steepness factor, and it was calculated according to Foster et al. [33] and McCool et al. [34]; and EI is the combination of rainfall energy and intensity in the rainfall–runoff erosivity factor. In this research, E is computed as a function of I using the following relations for the dry and wet runs, respectively [35]:
where e is rainfall kinetic energy per unit area and per unit time [J m−2 h−1]; I is rainfall intensity [mm h−1]. The total rainstorm kinetic energy E was then computed converting e to [MJ ha−1 h−1] and multiplying it by the duration of the simulation in hours. E times rainfall intensity I described the rainfall erosive parameter in [MJ mm ha−1 h−1].
2.3.2. Erodibility from Major Regression Model
Several studies have attempted to correlate erodibility with soil’s physical, chemical and mineralogical properties. However, one of the most widely applied relationship is the nomograph developed by Wischmeier et al. [36], and its algebraic approximation [32]:
where OM is percent organic matter; M is the product of the primary particle size fraction: (% modified silt, 20–100 μm) · (% silt + % sand, 20–2000 μm); s and p represent structure and permeability classes from USDA [21], respectively.
Another well-established pedo-transfer function is that of Renard et al. [6], which relate the textural class mean erodibility with the geometric mean particle diameter of that class (Dg), expressed in [mm]:
The geometric mean particle diameter is computed as follows:
where f is percentage primary particle fraction; m is the arithmetic mean of the primary particle sizes.
2.4. Statistical Analysis
Data analysis was conducted using R software version 4.1.2. Relationships between soil properties and erodibility values were evaluated through Spearman’s rank correlation. The model was fit using linear regression approach on log-transformed variables. The goodness of fit measurements used to test obtained erodibility model performance were coefficient of variation (Equation (7)) and Root Mean Square Error (Equation (8)), respectively:
where n is the number of paired observations, and are individual data values, and and are their respective means.
3. Results and Discussion
3.1. Erodibility–Soil Property Relationship
Soil erodibility is a complex characteristic influenced by both hydraulic and structural soil properties. Wischmeier and Mannering [5] noted that identifying a single soil property to explain erodibility is challenging because of its varied impact on the soil’s hydraulic and structural characteristics. Consequently, finding an “easily measured” soil property that could explain a significant variability of erodibility remains an interesting research topic.
Figure 3 displays the Spearman rank correlation coefficients (r) between soil erodibility and various physical, chemical, and mechanical soil properties, including textural fraction, organic carbon, acidity, electrical conductivity, cation exchange capacity, plastic limit, bulk density, volumetric water retention at different matric potentials, penetration resistance, and infiltration. Rank correlation values are provided for the entire soil domain and also excluding soils 2, 14, and 15.
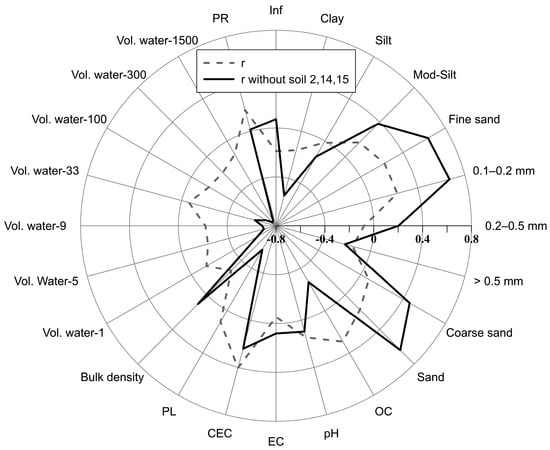
Figure 3.
Spearman’s correlation (r) between soil properties and erodibility (Ksim) in 19 Cuban soils.
Similarly to findings from other researchers (e.g., [5]), low correlation values (r < 0.4) were observed when analyzing the entire soil dataset (the highest one was that between Ksim and CEC). However, correlations increased considerably after clustering the soils by CEC values and clay content, indicating that the clay mineralogy of the studied soils is a suitable criterion for grouping their erosion behavior and better understanding soil property–erodibility relationships. Soils with very high CEC (over 40 cmol+ kg−1) values are typically associated with dispersive and swelling 2:1 smectite minerals [12,13], which negatively impact soil permeability and aggregation [37,38]. In addition to clay type, clay representation (content) in the soil matrix also regulates the macro effects of mineralogy.
Soils 2, 14, and 15 had a CEC exceeding the threshold and a clay fraction over 30%. Simultaneously, these soils presented outlier erosion behaviors and erodibility–soil property relationships compared to the other studied soils. With only three soils, it is infeasible to perform quantitative analysis in this group, such as pedo-transfer functions. Therefore, this study focused on the other 16 soils and presented qualitative conclusions from these three. After this subsetting, the strongest correlations were found between erodibility and certain textural fractions, the plastic limit, and the water retention variables (see Figure 3). Figure 4, Figure 5 and Figure 6 present scatter plots illustrating the most significant correlations between variables and erodibility.
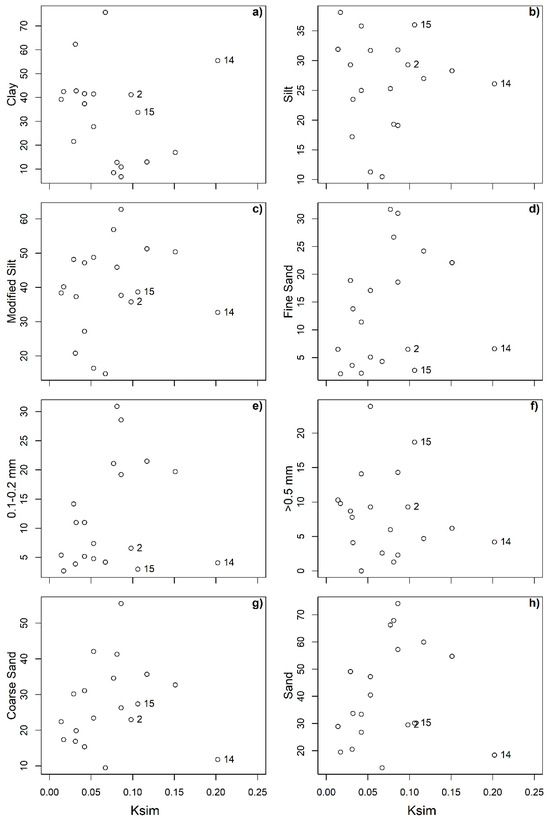
Figure 4.
Scatter plots showing relationships between soil textural fractions and erodibility.
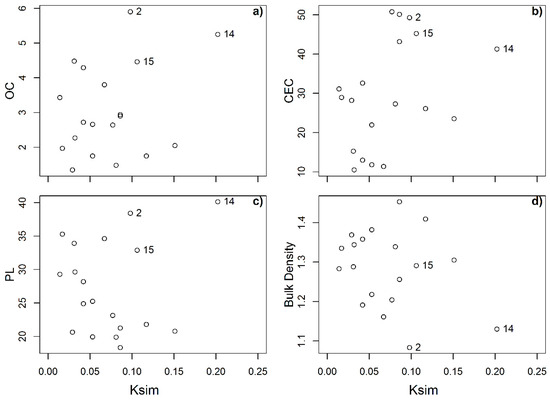
Figure 5.
Scatter plots showing relationships between other usually erosion-related soil properties ((a) organic carbon OC, (b) cation exchange capacity CEC, (c) plastic limit PL, and (d) bulk density) and erodibility.
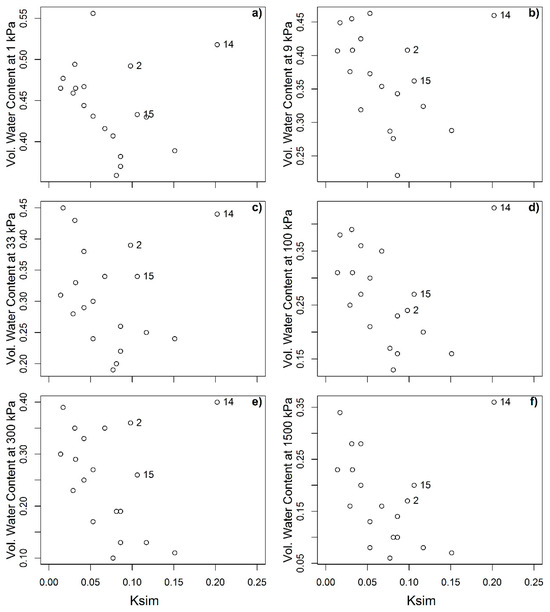
Figure 6.
Scatter plots showing relationships between water retention at different pressure levels and erodibility.
Moving clockwise in Figure 3, and referring to correlations without soils 2, 14, and 15, the ranked correlation coefficient between Ksim and Clay is r = −0.54. Clay content is found to reduce soil erodibility through its cementing structural effects, though the r value and cloud of points in Figure 4a show uncertainty around this relationship. On the other hand, the highest correlation values (from all textural fractions) appeared between erodibility-fine sand and erodibility-(0.1–0.2 mm) fraction, with coefficients of 0.64 and 0.67, respectively. Positive correlations with these soil particle fractions are well-recognized due to their low influence in aggregation, limitation of infiltration by clogging soil matrix pores, and easily transportable particle sizes (e.g., [5,6,39]).
The studied dataset makes it infeasible to test silt content effects on erodibility due to its low variability among soils (mean = 26.1% and standard deviation = 7.8%). This lack of variability increased collinearity between clay and sand materials, which seems to condition (without a physical sense) the significant positive correlation with coarse sand and general sand fractions. Heavier and larger coarser particles are more difficult to suspend in water flow and tend to improve porosity and water infiltrability, helping to reduce soil loss by erosion.
Plastic limit showed a significantly negative relationship with erodibility (r = −0.58), which can also be observed in Figure 5c. Similarly to findings by Rienks et al. [40], plasticity increases with the clay content in the current study, and the uncertainty between both variables is associated with mineralogy. Therefore, in general, clay content controls the erodibility of these tropical soils with an inverse relationship. In the excluded soils, clay fraction showed a direct relationship with erodibility.
Clay is also behind the next set of variables to be discussed, but these also possess compound information from organic matter, mineralogy (e.g., specific surface) and porosity in general. The latter made the soil water retention, more specifically at higher potentials, show the strongest correlation against erodibility. Particularly, the correlation coefficient between the volumetric water content at 1500 kPa (θv-1500 kPa) and erodibility was r = −0.75. The reduction in uncertainty can also be observed in the scatter plot (Figure 6f), where a clearer (compared to clay vs. Ksim) inverse and nonlinear relationship between both variables is appreciated. The erodibility of soils 2, 14, and 15 align in a linear and positive dependency with θv-1500 kPa.
Water content at all potentials has correlation coefficients over −0.60, but uncertainty seems to increase when matric potential decreases. This can be associated with the measurement uncertainty at lower potentials and the increasing role of other soil properties more linked to macroporosity. The rest of the tested soil properties played a secondary role in the erodibility of the studied soils.
3.2. New Erodibility Equation
Figure 7 presents a scatter plot and the best fitted model between Ksim and θv-1500 kPa for the cluster of 16 soils containing non-swelling clays. Similarly to the findings of Voznesensky and Artsruui [41], the water retention characteristic was identified as a crucial variable in predicting soil erodibility and erosion rates. Observing the plot, one can discern the nonlinear and inverse relationship between Ksim and θv-1500 kPa. The optimal fit was achieved with a logarithmic (Euler base) model, which is depicted in Figure 7, with model parameters detailed in Table 4. This fitted model accounts for 64% of the variability in soil erodibility, with an RMSE of 0.02 erodibility units.
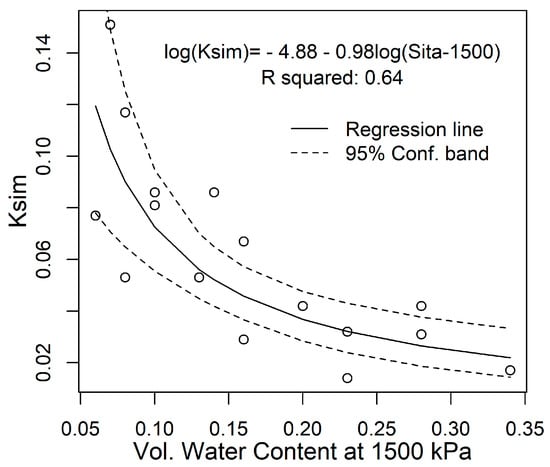
Figure 7.
Erodibility as a function of the volumetric water content at 1500 kPa in the studied soils.

Table 4.
Fitted parameters for the nonlinear erodibility model shown in Figure 7.
The model can also be expressed in exponential form as follows:
where Ksim represents soil erodibility in [t ha h ha−1 MJ−1 mm−1], and θv-1500 denotes the volumetric water content at 1500 kPa in [cm3 cm−3].
Student’s t-test on the model fit confirmed the significance of all fitted parameters being different from 0, and the standard errors (in log-space) align with the actual residuals between the model and observations. We adhered to the parsimonious paradigm, striving to keep the model as simple as possible. However, further exploration of multivariate models could be considered, bearing in mind that due to the high collinearity among the more significant predictors, the potential gains may not be worthwhile.
Despite the reliability of the reported model for the studied soils, it needs to be tested for other soils and conditions. The model was obtained from a limited soil dataset with low variation in silt content and low presence of swelling 2:1 clays (excluded soils). Extrapolation of these results must take into account the remaining unexplained variance and sources of uncertainty, including those introduced by assuming a single realization plot per soil. Despite its limitations, the model constitutes a valuable first approximation for estimating Cuban soil erodibility and contributes to the broader understanding of tropical clayey soils in general.
3.3. Testing Well-Known Erodibility Equations
Figure 8 presents a plot of the measured erodibility (Ksim) against the estimated erodibility using (a) the nomograph (Knom) and (b) the geometric mean particle diameter (KDg) function. Examining both scatter plots, excluding soils 2, 14, and 15, it is evident that the nomograph reflected more accurately the trend of soil erodibility compared to KDg. The ranked correlation coefficient, RMSE, and concordance correlation coefficient between Ksim and Knom were 0.55, 0.047, and 0.20, respectively, indicating moderate association and limited agreement. In contrast, the corresponding values between Ksim and KDg were −0.73, 0.052, and −0.23, suggesting a strong negative correlation and poor concordance. KDg significantly misrepresents the actual erodibility behavior of these soils, whereas Knom captures the trend, albeit with considerable uncertainty and a tendency to underestimate, particularly for the highest erodibility values. The significant influence of the clay fraction in these soils is diluted by averaging textural characteristics in the KDg model. Recalibrating the nomograph equation could potentially approximate the erodibility of these soils.
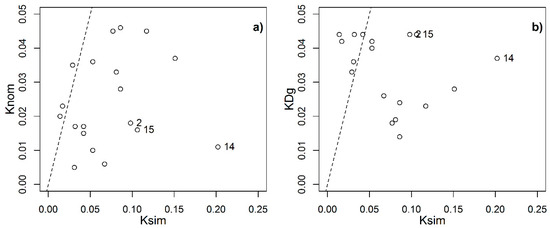
Figure 8.
Comparison between plot-based measured and estimated erodibilities. Regression model: (a) nomograph and (b) function of the geometric mean particle diameter.
4. Conclusions
In this study, rainfall simulations were performed on runoff plots to determine soil erodibility across 19 Cuban soils. The physical, chemical, and mechanical properties of the soils were also examined to explore their relationship with soil erodibility, and a pedo-transfer function was developed for its calculation.
Despite the complexity of erodibility and its connection to soil properties, strong correlations were found after clustering the soils by CEC values and clay content. Soils with more than 30% clay fraction and 40 cmol+ kg−1 of cation exchange capacity were excluded. This exclusion enhanced the correlation between several soil properties and erodibility. Generally, clay content inversely affected the erodibility of these tropical soils, while in the excluded soils, clay fraction directly correlated with erodibility.
Soil water retention at the lowest matric potentials showed the strongest correlation with soil erodibility. The volumetric water content at 1500 kPa has a ranked correlation coefficient of r = −0.75 against erodibility, and the scatter plot revealed a clear inverse and nonlinear relationship between the two variables for the clustered soils.
A regression model to estimate erodibility as a function of the soil volumetric water content at 1500 kPa was developed. The best-fit model between these variables was a logarithmic (Euler base) model, explaining 64% of the soil erodibility variability and with an RMSE of 0.02 erodibility units in the studied soils. The model was obtained from a soil dataset with low or non-presence of smectite minerals. Although soils with these minerals appear to show a direct link between water retention and erosion, this relationship requires confirmation with a larger dataset.
In testing erodibility models, the nomograph was found to better mimic the erodibility of these soils (non-excluded) compared to the KDg model. In the studied soils, clay fraction and type, rather than mean particle distribution, governs erodibility and soil aggregation. The KDg model completely misrepresented the actual erodibility behavior of the studied soils, whereas the nomograph roughly captures the trend. In general, the low performance of both models provides insights into the inherent error associated with using foreign functions to estimate erodibility. Moreover, the nomograph completely failed to reproduce the erodibility of the excluded soils. The estimation of accurate erodibility values is fundamental to erosion studies. As a key parameter in most erosion models, erodibility is basic for simulating scenarios and control practices, helping to develop soil and water conservation plans in the region.
Attending the limitations of the study, including the relatively small soil dataset, particular soil characteristics, and remaining uncertainty associated with the complexity of erosion processes, it would be beneficial to recommend extending the experimentation to other sites and conditions and including more and different soils.
Author Contributions
Conceptualization, G.R.A. and J.D.; methodology, G.R.A.; investigation, G.R.A., J.C., M.Á.C.-B. and J.D.; data curation, G.R.A.; writing—original draft preparation, G.R.A., J.C. and M.Á.C.-B.; writing—review and editing, G.R.A., J.C. and M.Á.C.-B.; visualization, G.R.A., J.C. and M.Á.C.-B.; supervision, J.C. and M.Á.C.-B. All authors have read and agreed to the published version of the manuscript.
Funding
Field experiments and soil properties determinations were conducted within the framework of the research project: ¨Capacity Building of UNAH and CENHICA in view of a Soil and Water Conservation Program in the Cuyaguateje River watershed in western Cuba¨, which was funded by the Flemish Interuniversity Council (VLIR), Belgium. Publication fees were funded by the Public University of Navarra.
Data Availability Statement
Data available on request from the authors.
Acknowledgments
We express our gratitude to all colleagues who participated in the field and laboratory experiments as part of the Cuba–Belgium research project and all the graduate and postgraduate students who contributed through their thesis work.
Conflicts of Interest
The authors declare no conflicts of interest.
References
- Instituto de Suelos. Programa Nacional de Mejoramiento y Conservación de Suelos; Ministerio de la Agricultura. Agrinfor: Havana, Cuba, 2001; p. 38. [Google Scholar]
- Republic of Cuba. Second National Communication to the United Nations Framework Convention on Climate Change; Government of Cuba: La Habana, Cuba, 2015; p. 228.
- Panagos, P.; Borrelli, P.; Poesen, J.; Ballabio, C.; Lugato, E.; Meusburger, K.; Montanarella, L.; Alewell, C. The new assessment of soil los by water erosion in Europe. Environ. Sci. Policy 2015, 54, 438–447. [Google Scholar] [CrossRef]
- Auerswald, K.; Fiener, P.; Martin, W.; Elhaus, D. Use and misuse of the K factor equation in soil erosion modeling: An alternative equation for determining USLE nomograph soil erodibility values. Catena 2014, 118, 220–225. [Google Scholar] [CrossRef]
- Wischmeier, W.H.; Mannering, J.V. Relation of Soil Properties to its Erodibility. Soil Sci. Soc. Am. J. 1969, 33, 131–137. [Google Scholar] [CrossRef]
- Renard, K.G.; Foster, G.R.; Weesies, G.A.; Mccool, D.K.; Yoder, D.C. Predicting Soil Erosion by Water: A Guide to Conservation Planning with the Revised Universal Soil Loss Equation (RUSLE); USDA Agriculture Handbook No. 703; U.S. Department of Agriculture: Washington, DC, USA, 1997; Volume 537.
- Le Bissonnais, Y. Soil characteristics and aggregate stability. In Soil Erosion, Conservation and Rehabilitation; Agassi, M., Ed.; CRC Press: Boca Raton, FL, USA, 1995; pp. 41–60. [Google Scholar]
- Dimoyiannis, D.G.; Tsadilas, C.D.; Valmis, S. Factors affecting aggregate instability of Greek agricultural soils. Commun. Soil Sci. Plant Anal. 1998, 29, 1239–1251. [Google Scholar] [CrossRef]
- Six, J.; Feller, C.; Denef, K.; Ogle, S.M.; De Moraes Sá, J.C.; Albrecht, A. Soil organic matter, biota and aggregation in temperate and tropical soils—Effect of no-tillage. Agronomie 2002, 22, 755–775. [Google Scholar] [CrossRef]
- Lado, M.; Ben-Hur, M. Soil mineralogy effects on seal formation, runoff and soil loss. Appl. Clay Sci. 2004, 24, 209–224. [Google Scholar] [CrossRef]
- Singer, A. Clay mineralogy as affecting dispersivity and crust formation in Aridisols. In Proceedings of the Transactions of 15th World Congress of Soil Science, Acapulco, Mexico, 10–16 July 1994; Etchevers, J.D., Ed.; Society of Soil Science: Sydney, Australia, 1994; Volume 8a, pp. 37–46. [Google Scholar]
- Sposito, G. The Chemistry of Soils; Oxford University Press: New York, NY, USA, 1989. [Google Scholar]
- Sumner, M.E.; Miller, W.P. Cation Exchange Capacity and Exchange Coefficients. In Methods of Soil Analysis, Part 3—Chemical Methods; Sparks, D.L., Ed.; Soil Science Society of America: Madison, WI, USA, 1996; pp. 1201–1229. [Google Scholar]
- Reichert, J.M.; Norton, L.D.; Favaretto, N.; Huang, C.; Blume, E. Settling velocity, aggregate stability, and interrill erodibility of soils varying in clay mineralogy. Soil Sci. Soc. Am. J. 2009, 73, 1369–1377. [Google Scholar] [CrossRef]
- Römkens, M.J.M. The soil erodibility factor: A perspective. In Soil Erosion and Conservation; El-Swaify, S.A., Moldenhauer, W.C., Lo, A., Eds.; Soil Conservation Society of America: Ankeny, IA, USA, 1985; pp. 445–461. ISBN 978-0-935734-11-9. [Google Scholar]
- Kinnel, P.I.A. A Review of the Science and Logic Associated with Approach Used in the Universal Soil Loss Equation Family of Models. Soil Syst. 2019, 3, 62. [Google Scholar] [CrossRef]
- Kinnel, P.I.A. Event soil loss, runoff and the Universal Soil Loss Equation family of models: A review. J. Hydrol. 2010, 385, 384–397. [Google Scholar] [CrossRef]
- El-Swaify, S.A.; Dangler, E.W. Erodibilities of selected tropical soils in relation to structural and hydrologic parameters. In Soil Erosion: Prediction and Control; Soil Conservation Society of America: Ankeny, IA, USA, 1976; pp. 105–114. [Google Scholar]
- Loch, R.; Slater, B.; Devoil, C. Soil erodibility (Km) values for some Australian soils. Soil Res. 1998, 36, 1045–1056. [Google Scholar] [CrossRef]
- Schiettecatte, W.; D’hondt, L.; Cornelis, W.M.; Acosta, M.L.; Leal, Z.; Lauwers, N.; Almoza, Y.; Alonso, G.R.; Díaz, J.; Ruíz, M.; et al. Influence of landuse on soil erosion risk in the Cuyaguateje watershed (Cuba). Catena 2008, 74, 1–12. [Google Scholar] [CrossRef]
- INRH. Catálogo de Cuencas Hidrográficas (Río Cuyaguateje); Instituto Nacional de Recursos Hidráulicos: Pinar del Río, Cuba, 2000.
- CTCH. Diagnóstico Ambiental de la Cuenca Cuyaguateje; Consejo Territorial de Cuencas Hidrográficas: Pinar del Río, Cuba, 2003. [Google Scholar]
- De Leenheer, L. Soil texture. In Handbuch der Planzenernährung und-Düngung; Band ii: Boden und Düngemittel; Linser, H., Ed.; Springer: New York, NY, USA, 1966; p. 91. [Google Scholar]
- Walkley, A.; Black, I.A. An Examination of Degtjareff Method for Determining Soil Organic Matter and a Proposed Modification of the Chromic Acid Titration Method. Soil Sci. 1934, 37, 29–37. [Google Scholar] [CrossRef]
- Gavlak, R.; Horneck, D.; Miller, R.O.; Kotuby-Amacher, J. Plant, Soil, and Water Reference Methods for the Western Region, WREP 125, 2nd ed.; Oregon State University Corvallis: Corvallis, OR, USA, 2003. [Google Scholar]
- ASFTM D4318; Standard Test Methods for Liquid Limit, Plastic Limit and Plasticity Index of Soil. Annual Book of ASTM Standards; ASTM International: West Conshohocken, PA, USA, 2000; pp. 546–558.
- Eijkelkamp. Equipment for Determining Moisture Characteristic Curves of Soil Samples [pF-Equipment] pF 0-4,2 [0-15,5 Bar]; Eijkelkamp: Giesbeek, The Netherlands, 1983. [Google Scholar]
- Richards, L. Methods of measuring soil moisture tension. Soil Sci. 1949, 68, 95–112. [Google Scholar] [CrossRef]
- USDA. Soil Survey Manual. U.S. Department of Agriculture Handbook; No. 18; U.S. Government Printing Office: Washington, DC, USA, 1951.
- Cornelis, W.M.; Erpul, G.; Gabriels, D. The I.C.E. wind tunnel for water and wind interaction research. In Wind and Rain Interaction in Erosion; Visser, S., Cornelis, W.M., Eds.; Tropical Resource Management Paper; Wageningen University and Research Centre: Wageningen, The Netherlands, 2004; Volume 50, pp. 195–224. [Google Scholar]
- Erpul, G.; Gabriels, D.; Janssens, D. Assessing the drop size distribution of simulated rainfall in a wind tunnel. Soil Tillage Res. 1998, 45, 455–463. [Google Scholar] [CrossRef]
- Wischmeier, W.H.; Smith, D.D. Predicting rainfall-erosion losses: A guide to conservation planning. In Agriculture Handbook; USDA. Government Printing Office: Washington, DC, USA, 1978; p. 537. [Google Scholar]
- Foster, G.R.; Meyer, L.D.; Onstad, C.A. A runoff erosivity factor and variable slope length exponents for soil loss estimates. Trans. Am. Soc. Agric. Eng. ASAE 1977, 20, 683–687. [Google Scholar] [CrossRef]
- McCool, D.K.; Foster, G.R.; Mutchler, C.K.; Meyer, L.D. Revised slope length factor for the Universal Soil Loss Equation. Trans. ASAE 1989, 32, 1571–1576. [Google Scholar] [CrossRef]
- Deschuttere, B. Assessment of Soil Infiltration Characteristics Under Laboratory and Field Conditions in the Río Cuyaguateje Watershed (Cuba). Master’s Thesis, Faculty of Bioscience Engineering, Ghent University, Ghent, Belgium, 2007. [Google Scholar]
- Wischmeier, W.H.; Jhonson, C.B.; Cross, B.V. A soil erodibility nomograph for farmland and construction sites. J. Soil Water Conserv. 1971, 26, 189–193. [Google Scholar]
- Young, R.A.; Mutchler, C.K. Erodibility of some Minnesota soils. J. Soil Water Conserv. 1977, 32, 180–182. [Google Scholar]
- Lado, M.; Ben-Hur, M.; Shainberg, I. Soil wetting and texture effects on aggregate stability, seal formation, and erosion. Soil Sci. Soc. Am. J. 2004, 68, 1992–1999. [Google Scholar] [CrossRef]
- Morgan, R.P.C. Soil Erosion and Conservation; Addison Wesley Longman Limited: London, UK, 2005; p. 384. [Google Scholar]
- Rienks, S.M.; Botha, G.A.; Hughes, J.C. Some physical and chemical properties of sediments exposed in a gully (donga) in northern KwaZulu-Natal, South Africa and their relationship to the erodibility of the colluvial layers. Catena 2000, 39, 11–31. [Google Scholar] [CrossRef]
- Voznesensky, A.S.; Artsruui, A.B. A laboratory method for determining the anti-erosion stability of soils. Soils Fertil. Commonw. Bur. Soil 1940, 10, 289. [Google Scholar]
Disclaimer/Publisher’s Note: The statements, opinions and data contained in all publications are solely those of the individual author(s) and contributor(s) and not of MDPI and/or the editor(s). MDPI and/or the editor(s) disclaim responsibility for any injury to people or property resulting from any ideas, methods, instructions or products referred to in the content. |
© 2025 by the authors. Licensee MDPI, Basel, Switzerland. This article is an open access article distributed under the terms and conditions of the Creative Commons Attribution (CC BY) license (https://creativecommons.org/licenses/by/4.0/).