Article

Impact of Saline Water Irrigation on Soil Salinity, Growth, and Productivity of Triticale in Sandy Soil

by
Hassan M. Abd El Baki
1,*,
Haruyuki Fujimaki
2,
Kristina Toderich
3,4,
Jean Bosco Nana
5 and
Asad S. Qureshi
1
1
International Center for Biosaline Agriculture (ICBA), Dubai P.O. Box 14660, United Arab Emirates
2
Arid Land Research Center (ALRC), Tottori University, Tottori 680-0001, Japan
3
Graduate School of Bioresources, Mie University, 1577 Kurimamachiya, Tsu 514-8507, Japan
4
Institute of Agrobiotechnology and Food Security, Samarkand State University, Universitet Bulvar 15, Samarkand 140104, Uzbekistan
5
Institute of Environment and Agricultural Research (INERA), 1973 Boulevard Tansoba Wam-Godi, Ouagadougou 04 BP 8645, Burkina Faso
*
Author to whom correspondence should be addressed.
Soil Syst. 2025, 9(2), 28; https://doi.org/10.3390/soilsystems9020028
Submission received: 19 January 2025 / Revised: 6 March 2025 / Accepted: 21 March 2025 / Published: 24 March 2025
(This article belongs to the Topic Soil Health and Nutrient Management for Crop Productivity)

Abstract

:
Salinity and water scarcity are among the major environmental challenges requiring the use of non-conventional water sources and the adoption of salt-tolerant crops. We assessed the impact of irrigation with different concentrations of NaCl: 50 mM and 150 mM on the growth parameters and yield of triticale, soil salinity, distribution of active root density, and concentrations of Na+ and NO3 ions at harvest compared to freshwater under zero leaching conditions. Irrigation was applied on a daily basis based on weight measurements of micro-lysimeter pots. Growth parameters, including plant height, LAI, number of leaves, number of tillers, and soil salinity, were observed across the growing season. Spatial distributions of soil salinity, normalized root length density (NRLD), concentrations of Na+ and NO3 in soil profile were measured in two dimensions. The results indicate that irrigating with 150 mM of NaCl H2O significantly affected the crop growth, causing salts, particularly Na+, to reside in the topsoil, reducing NRLD with soil depth, crop water demand, and NO3 uptake. The application of 150 mM and 50 mM of NaCl H2O reduced crop water use by 4 and 2.6 times as well as grain yield by 97% and 42%, respectively, compared to freshwater. This shows that irrigation with concentration equal to or higher than 150 mM NaCl will result in very low production. To achieve higher yield and crop water productivity, irrigation with NaCl concentration of 50 mM or less is recommended to grow triticale in marginal regions with limited freshwater resources.

1. Introduction

Soil salinization and water scarcity are two major challenges for global agricultural production. The adverse impacts of these two constraints on crop productivity, in addition to land degradation, are expected to exacerbate further with climate change, particularly in marginal regions [1]. Irrigated arable land accounts for more than 20% of overall salt-affected lands [2] and due to scarce water resources, it has significantly increased. To achieve sustainability goals in terms of food security, all agricultural production components should be integrated, and all available conventional and non-conventional water resources should be wisely utilized [3].
In irrigated soils with poor-quality water, the adoption of salt-tolerant crops is highly recommended for sustainable crop production [4]. Triticale is a cross between wheat and rye [5,6] and can successfully grow in marginal lands due to its tolerance to drought and salinity stresses [7,8]. The average content of proteins, carbohydrates, fibers, free sugars, and ash in triticale is reported as 10%, 56%, 2.8%, 4%, and 1.6%, respectively [3]. This highlights the economic importance of triticale as a substitute crop for rye and wheat. Despite its high economic value, only a few studies have evaluated the impact of saline water irrigation on seasonal crop water use, soil salinity, and yield. Most studies have focused on evaluating the impact of saline water irrigation on seed germination or early growth stage of triticale [9] and combined water and salt stresses on qualitative, biochemical, and morpho-physiological traits of triticale [10,11,12,13,14]. Studies have also been performed on quantifying the impact of salinity on crop evapotranspiration ( E T c ) , while leaching is applied [15]. These studies have concluded that triticale growth during the flowering stage is more sensitive to salinity than other stages, and despite the reduced biological yield, it is tolerant to different salinity levels depending on the genotype [16]. Grieve et al. [17] reported that triticale is moderately salt tolerant with a threshold value of 6.1 dS m−1. Therefore, salinity tolerance needs to be quantified to select suitable varieties for specific soil and climatic conditions [18]. Crop response to salinity stress is influenced by various factors, including genotype, growth rate, irrigation water quality, and stress duration [19,20]. Application of saline water causes salt to reside and accumulate in the root zone, which may surpass plant salt tolerance, resulting in detrimental effects on plant growth [21]. Excessive sodium chloride (NaCl) in soil water restricts root growth, reduces transpiration rates, and reduces nutrient uptake, leading to nutritional imbalance in plants [4,22,23]. Under dry conditions, it also creates a salt crust layer on the soil surface, which causes resistance to water vapor flux to the atmosphere [24,25]. On the other hand, fertigation with subsequent application of saline water results in a high soluble sodium content in the crop root zone, reducing soil permeability [26]. Guo et al. [27] investigated the long-term effects of saline water application on soil physicochemical properties and nitrogen transformations. Che et al. [28] modeled different scenarios for balancing salt leaching and nitrogen loss for drip irrigation when saline water irrigation is applied. They concluded that when using saline water, irrigation with 100% ETc is suggested. Several studies have evaluated the impact of brackish groundwater on chemical, thermal, and mineralogical properties of soil [29,30], but only a few have evaluated such impact on the soil–plant system of triticale. To reduce irrigation water losses from evaporation and deep percolation, crop water requirements need to be determined.
In salt-affected soils, irrigation water requirements (IWR) are determined by estimating E T c and leaching requirements (LR) to maintain favorable salt balance in the root zone. The E T c can be measured using different approaches, including empirical methods such as Blaney and Criddle [31]), physical-based methods such as FAO-56 Penman-Monteith [32]), or direct methods using lysimeters [33]. Lysimeter techniques provide reliable measurements, but owing to the high costs associated with their acquisition, installation, and maintenance, their use is very limited. Alternatively, cost-effective pot micro-lysimeters (PMLs) can be used [34,35]. Kankarla et al. [15] used the water balance equation to estimate E T c for triticale grown in 4 L pots, which was not enough to accommodate root growth, especially when the duration of experiments is long.
This study aimed at evaluating the impact of different salinity irrigation water on crop growth, yield components, both Na+ and NO3 concentrations in soil, and root zone salinity development when no additional water is applied for salt leaching.

2. Materials and Methods

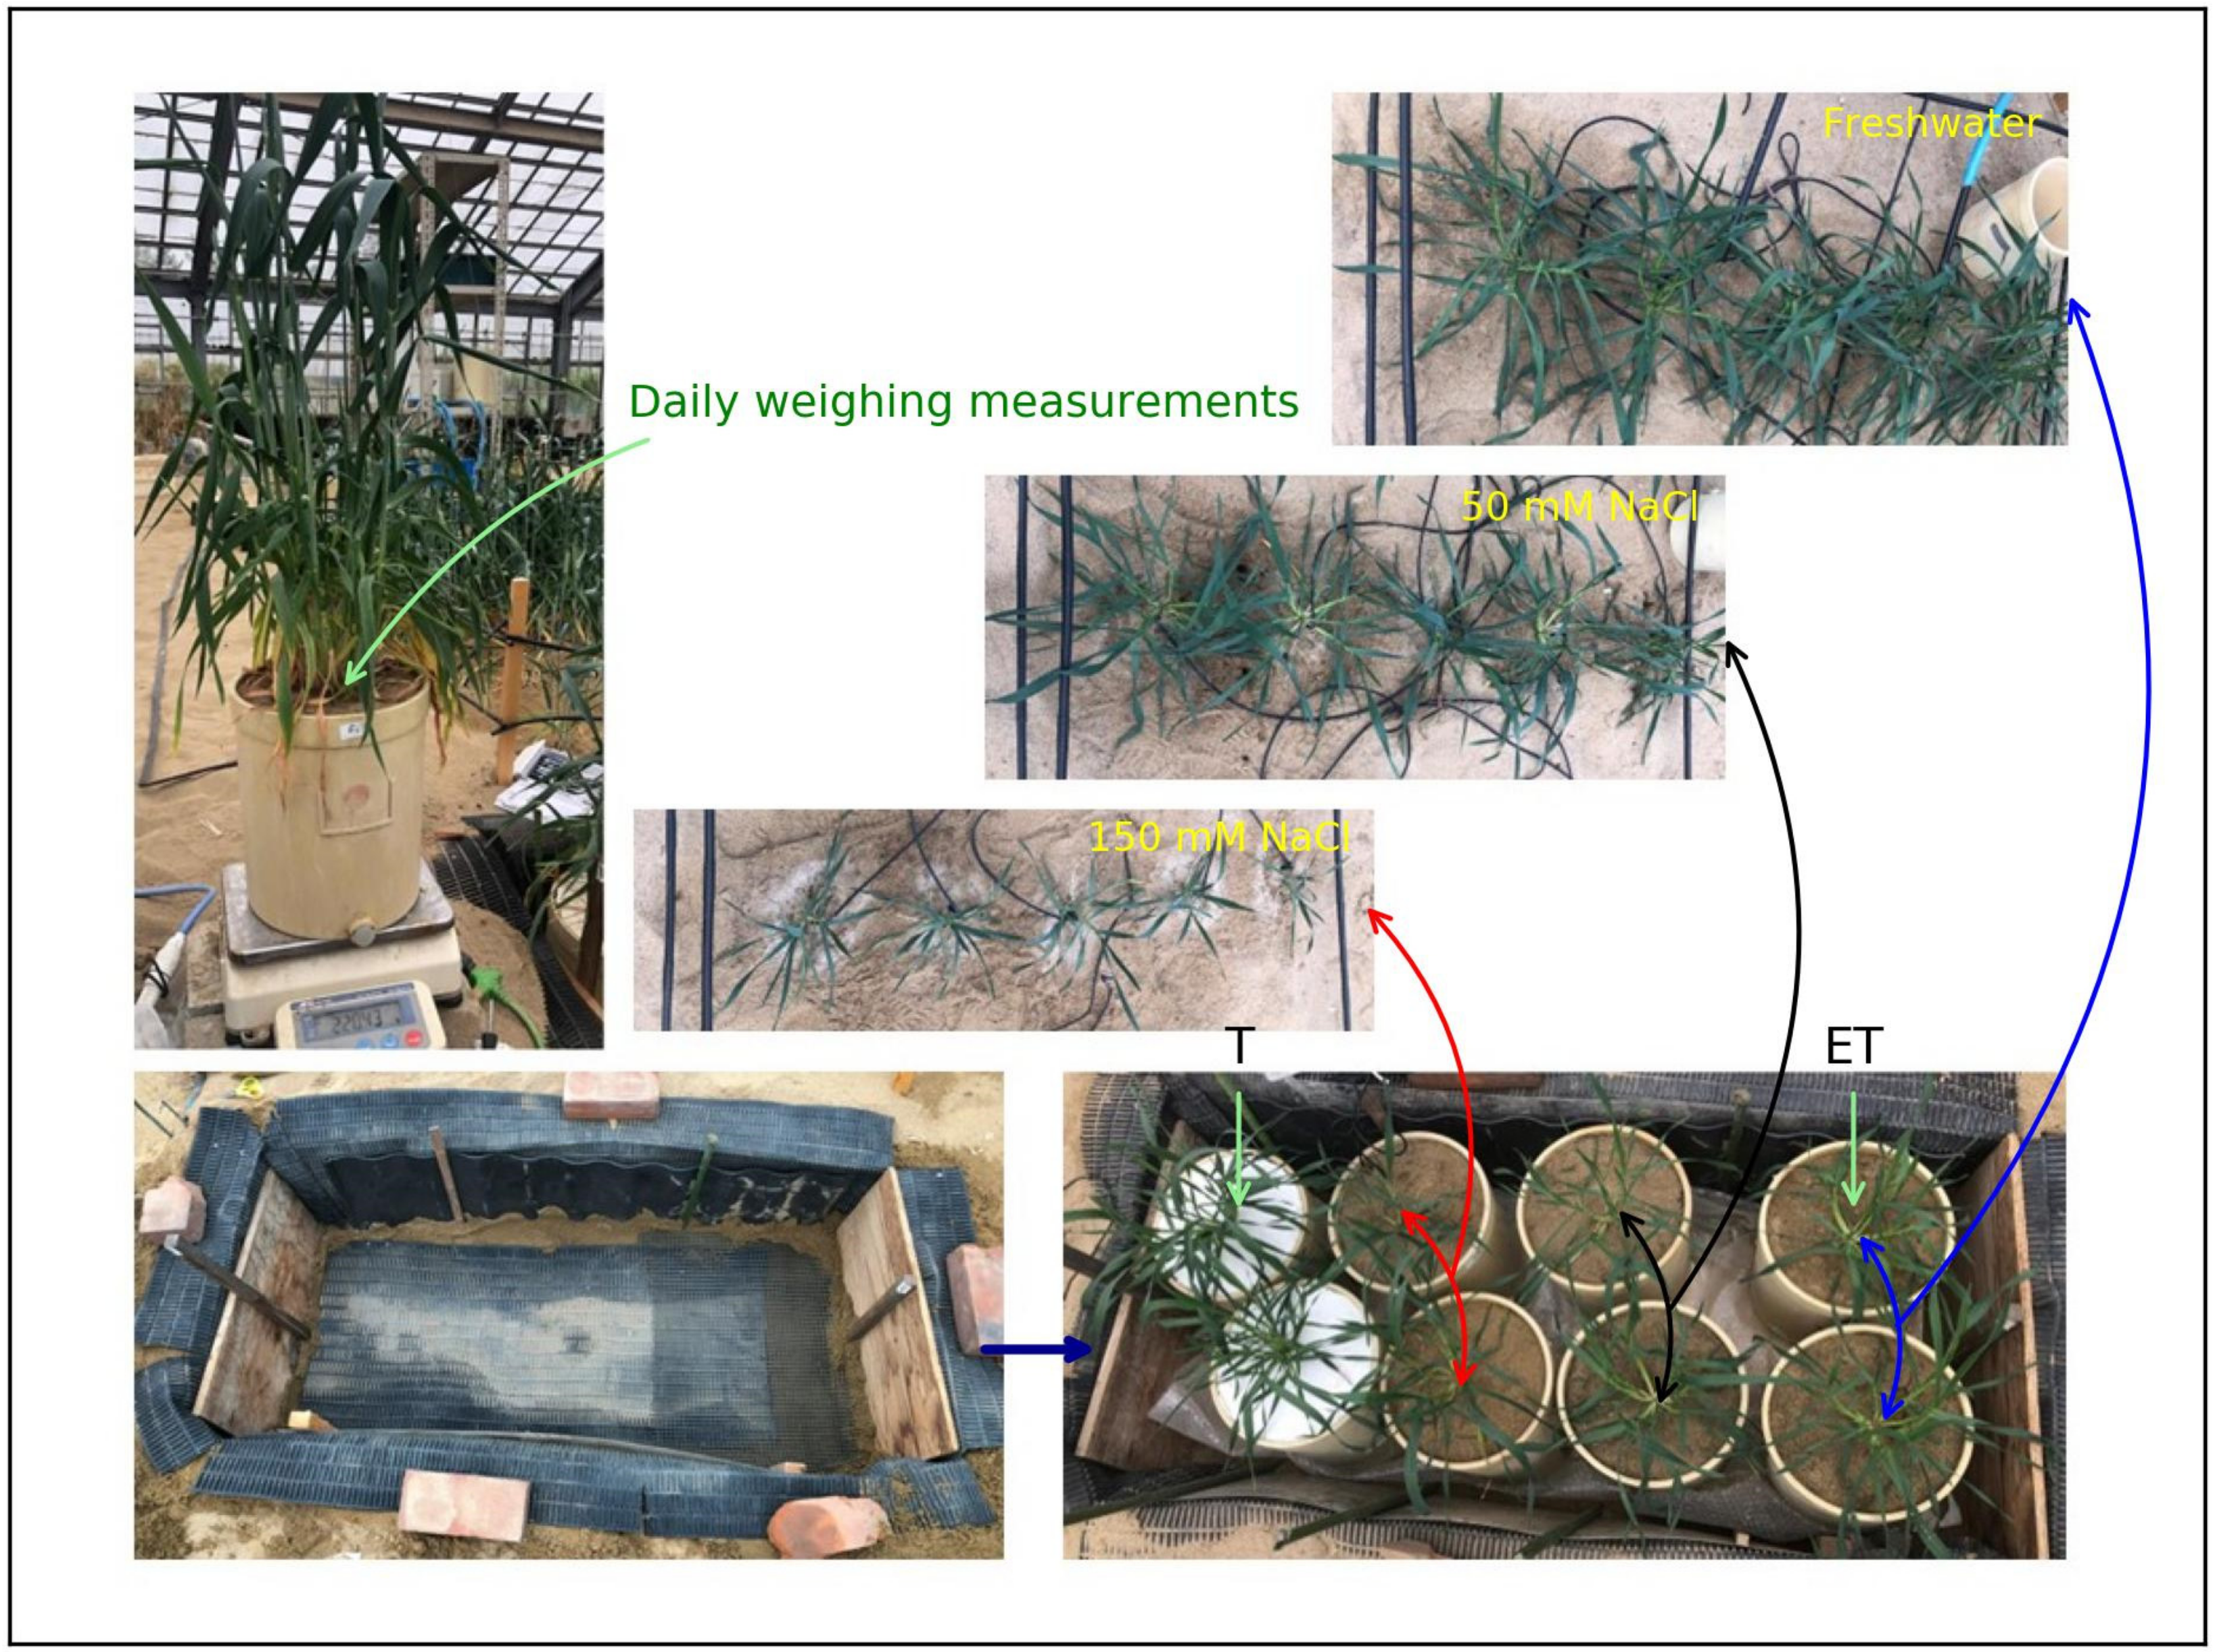
2.1. Experiment Design
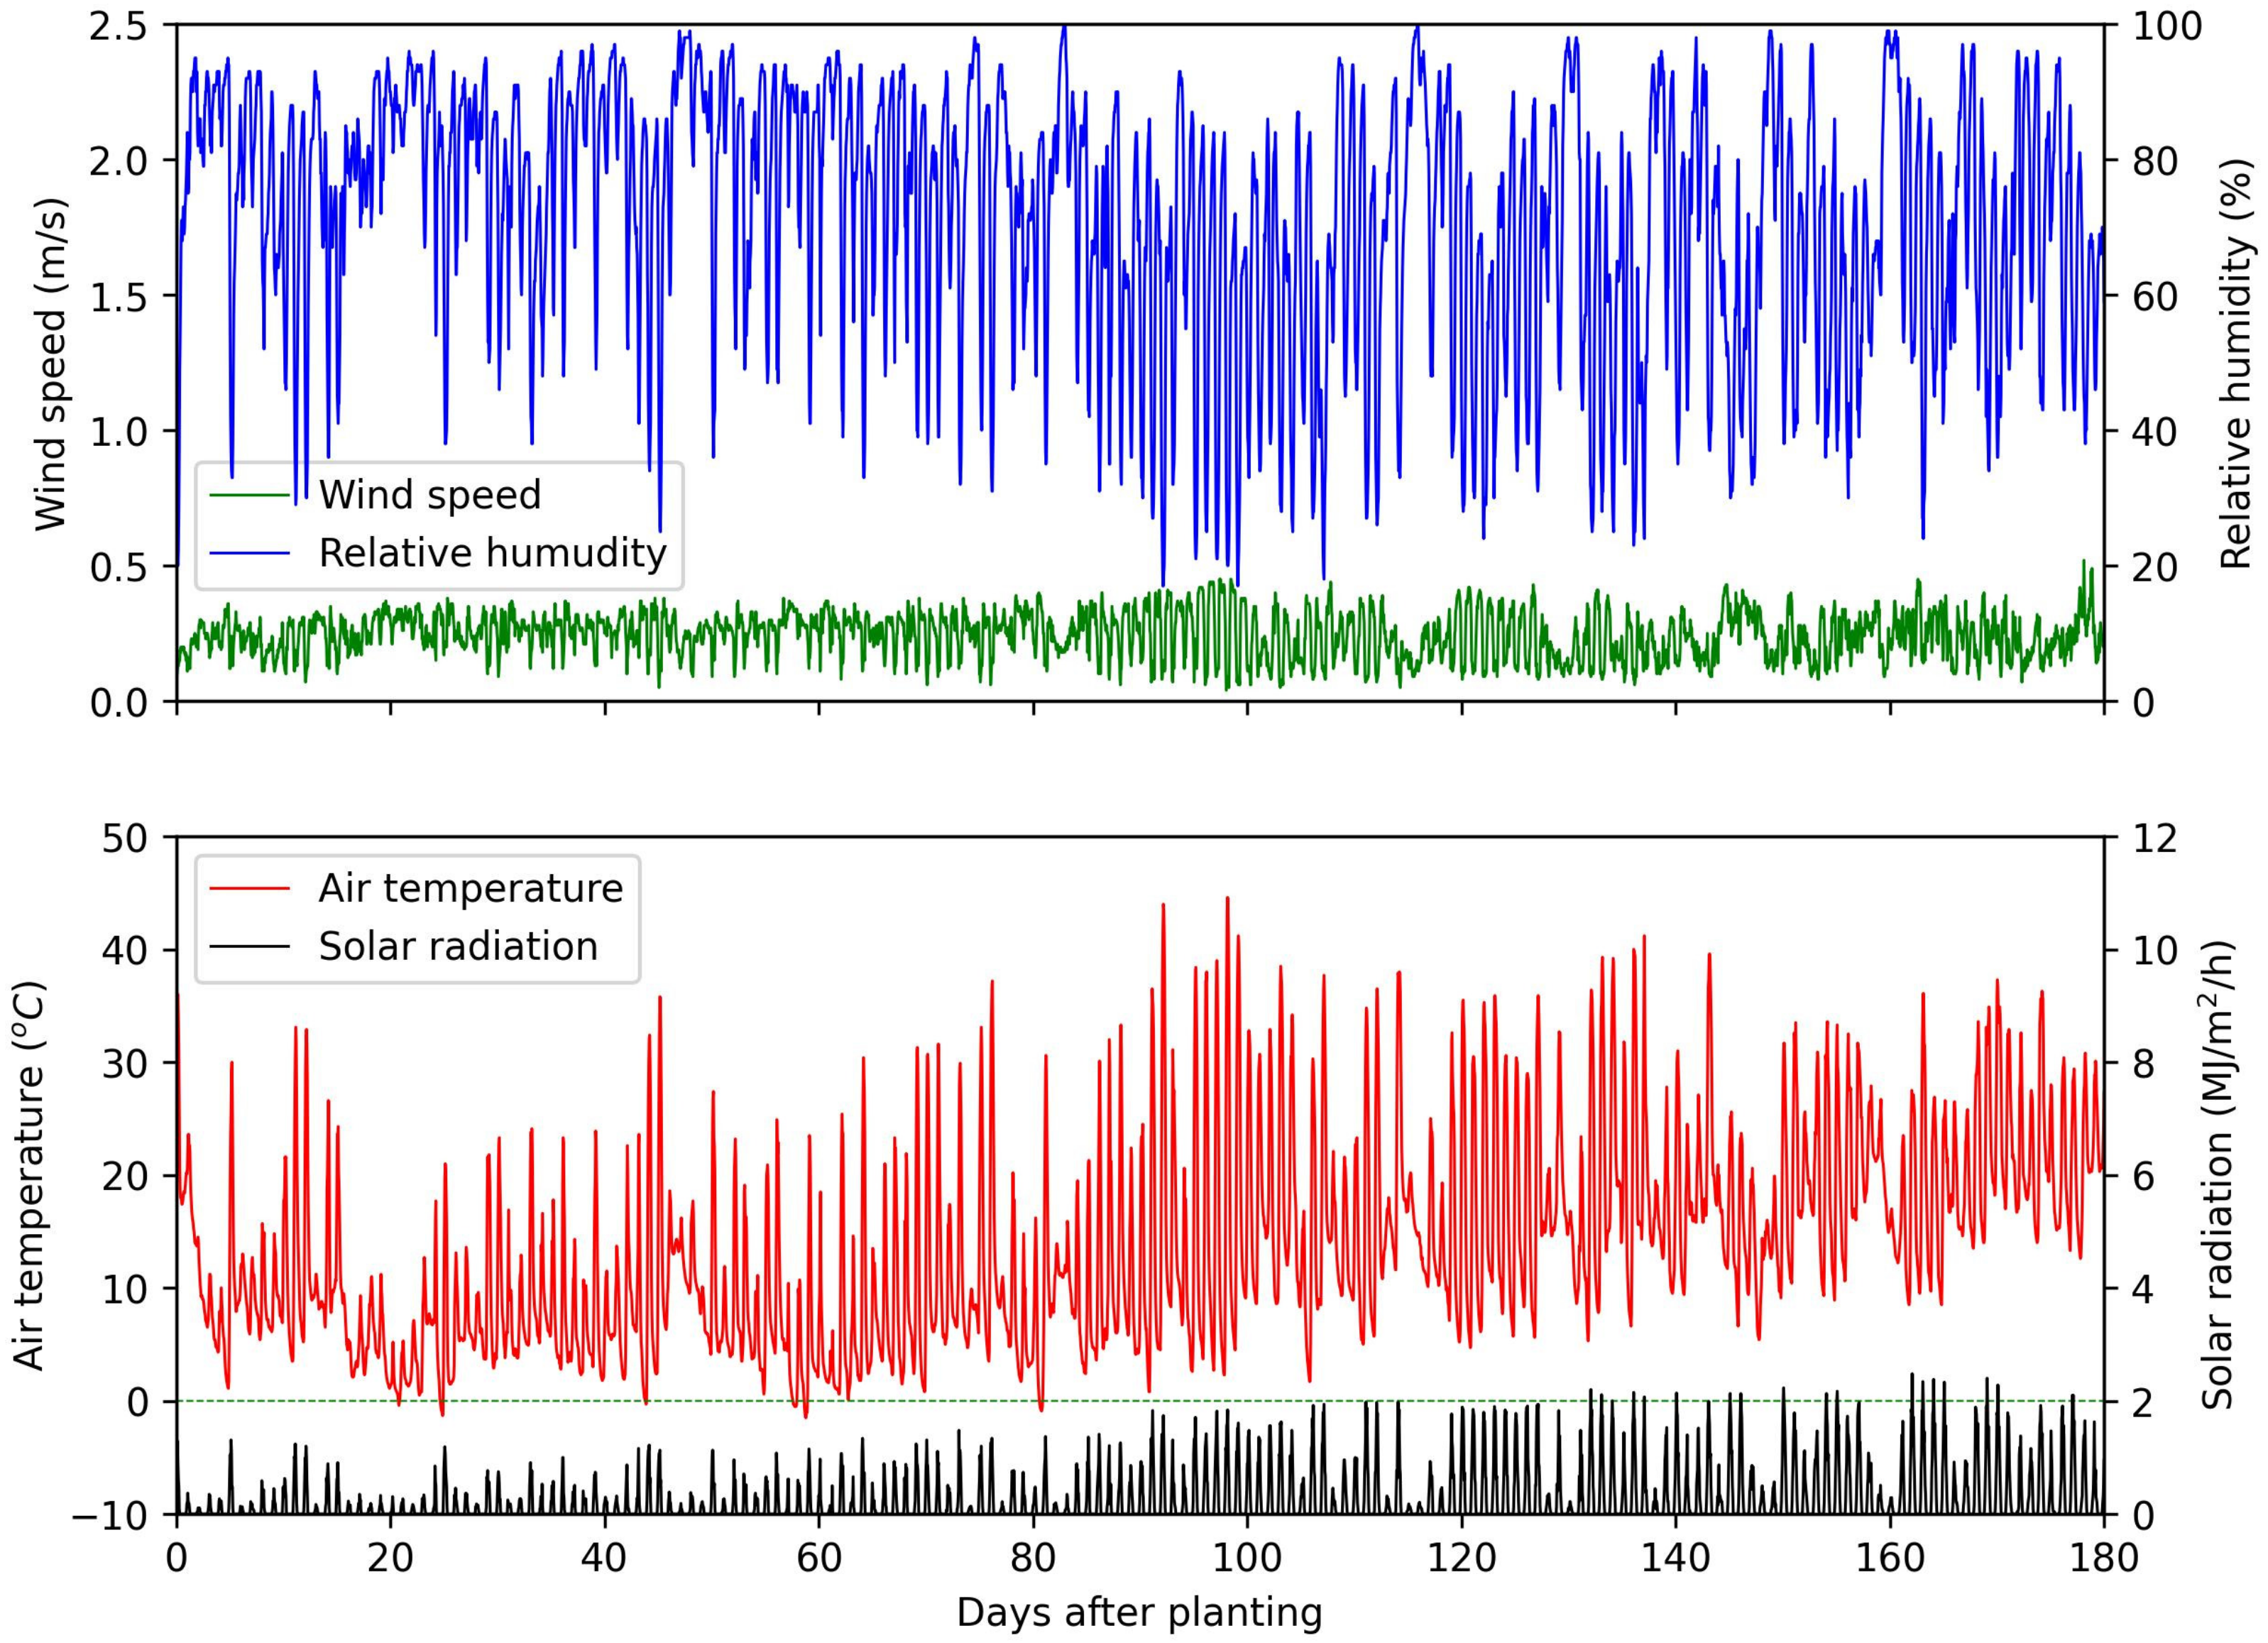
An experiment for triticale (a winter Wheat × Secale L., cv. Kender crop) was carried out in a glasshouse in the Arid Land Research Center (35°32′05.7″ N, 134°12′41.3″ E) during 2022/23. The newly released triticale variety “Kender” was used for this experiment. This variety is considered suitable for the hyper-dry climate of the Aral Sea Basin. Initially, two triticale seeds were sown in each vinyl poly pot with 350 g of soil on 15 November 2022 and irrigated with freshwater until they were transplanted into the experiment on 28 November 2022. The experiment comprised two distinct sections: triticale seedlings were transplanted in glasshouse soil (main section), while in the other section, the plants were grown in Wagner pots as shown in Figure 1.
The main section of the experiment was designed in a randomized complete block design with three treatments and five replicates. The treatments were: (a) irrigation with freshwater (control), (b) irrigation with 50 mM of NaCl H2O, and (c) irrigation with 150 mM of NaCl H2O. The NaCl concentrations in irrigation water were set in terms of the classification of water quality, where 50 mM and 150 mM were classified as moderately saline and saline, respectively [36]. Irrigation was applied through a drip irrigation system with an emitter discharge set at 1 L h−1. The spacings between laterals and emitters were 50 cm and 25 cm, with one emitter for each plant. In the second section, two Wagner pots served as micro-lysimeters to measure daily E T c for each treatment, and they were irrigated with the corresponding water quality. Two more pots were used to provide potential transpiration ( T p ), which was achieved by covering the soil surface of the pots. The potential transpiration pots were irrigated with freshwater as with the control pots. Each pot had a height of 29.5 cm, an upper diameter of 25.2 cm, and a lower diameter of 23.8 cm. The surface of the pots were set up to be at the same level as the soil surface. The soil was sand with hydraulic properties as shown in Figure 2.
Soil was packed into each pot at a bulk density of 1.5 g cm−3 to imitate the soil structure in the main phase. Each pot was well-irrigated according to the designed treatment to retain soil water content around the field capacity (FC: upper boundary of total available soil water). This was adjusted to prevent the plant from experiencing drought stress, and the effect will be solely limited to salinity stress. The drainage orifice at the bottom of each pot was entirely sealed to prevent any solutes from seeping through drainage. The reasoning for this was to assess the accumulation of salt in the soil profile and its influence on plant growth. Liquid NPK fertilizer (6-10-5) was applied to each treatment at a rate of 1 g L−1 day−1. Irrigation was applied on a daily basis according to the E T c measured by pots allocated to each treatment from 6 December to 25 May 2023. The daily soil water depletion in each pot was replenished to return the soil water content to FC. The crop was harvested on 1 June 2023.

2.2. Measurements

Daily E T c and T p (mm) were measured by weighing the PMLs every morning using a 30 kg weighing balance (EK-30KL, AND, San Jose, CA, USA) as:
E T c   o r   T p = W j W j 1 0.1   A s
where W j is the pot weight at day j (g); W i 1 is the pot weight at the previous day (g); A s is the surface area of the pot (cm2). The daily irrigation was applied to the main section based on daily E T c observed by the PMLs. The meteorological data (Figure 3) was measured using a weather station (ATOMS 41, Meter, Pullman, DC, USA) to estimate the daily E T 0 using the FAO Penman Monteith method [13].
Soil samples were collected at 10, 37, 58, 93, and 134 days after planting (DAP) to estimate moisture content and electrical conductivity (EC). EC was measured in soil:water extract of 1:2. The observation of EC was carried out in two dimensions: lateral distance apart of drip tube (0 cm, 10 cm, and 20 cm) and soil depth (0 cm, 5 cm, 10 cm, 20 cm, and 30 cm). A soil moisture, bulk EC, and temperature sensor (TEROS12, Meter, Pullman, USA) was located at a depth of 10 cm for 50 and 150 mM NaCl treatments.
The sensors were calibrated in terms of volumetric water content, θ (cm3 cm−3) and electrical conductivity of soil water, E C s w (dS m−1) in order to estimate the solute concentration in soil, C s j as:
θ = 0.99   x 0.0026
E C s w = E C b 1.21   θ 1.78
C s j = 0.5 E C s w 1.038
where x is the sensor output for θ (cm3 cm−3), E C b is the bulk EC measured by sensor (dS m−1), and j is the time in hours. Average daily volumetric water content, θ ¯ i , and solute concentration in soil, C ¯ i (g L−1), were calculated using the forward difference method as [37]:
θ ¯ i = θ i b + θ i a 2
θ i ( b , a ) =   W i ( b , a ) W 0 V p ρ w + θ r
C ¯ i = C i b + C ( i + 1 ) a 2
M i =   W i a W i b ρ w C i w + M i 1
C i ( b , a ) = M i ( b , a ) θ i ( b , a ) V p
where W 0 is the initial weight of the pot at the beginning of the experiment (g); W is a daily weight of the pot (g), V p is the total volume of the pot (cm3); θ r is the volumetric water content at airdry condition; ρ w is the density of water (g cm−3); C i w is the concentration of irrigation water (g m−3); M is the mass of added salt (g); the subscripts: i , a , and b refer to irrigation day, after irrigation, and before irrigation, respectively. The concentration of nitrate (NO3) and sodium (Na+) in the soil samples (mg L−1) were measured using LAQUAtwin NO3-11C and Na-11 probes (Horiba, Miyanonishi-cho, Kisshoin Minami-ku, Kyoto, Japan) after performing multi-point calibration with the relevant standard buffer.
Growth parameters of triticale were recorded on the same date of soil sample collection, including plant height (cm), leaf area index (LAI), number of leaves, and number of tillers. LAI was calculated as:
  L A I = k = 1 n L w k × L l k A p
where L w k and L w k r e p r e s e n t the width and length of each leaf, k (cm); A p is the projected area of plant (cm2); n is total number of leaves; is the leaf shape factor, which was calculated by establishing the relationship between the digitized images of collected sample of leaves (using Simple Digitizer software 3.2 [38]) and the calculated rectangle area of the samples. It was about 0.78.
At harvest time, the two-dimensional spatial distribution of normalized root density (NRLD), θ, solute concentration, NO3, and Na+ along the soil profile were carried out on the quarter of A p . The soil profile was divided into 50 grids. A soil sample from each grid (5 cm × 5 cm) was collected to measure such data, while bulk soil of each grid was collected and wet-sieved to extract all existing roots. The extracted roots of each grid were scanned on an A4 flatbed scanner at 600 dpi, where the total length was quantified using the Newman method [39].
The crop water productivity (CWP) was calculated as:
C W P = Y I
where Y is the crop yield (kg ha−1) and I is total applied irrigation (mm). Grain yield and yield components including plant height (cm), number of tillers per plant, number of spikes per plant, spike length (cm), spike width (cm), weight of 100-grain weight (g), total fresh biomass (g), and total dry biomass (g) were estimated and statistically analyzed with a randomized complete block design using R (version 4.0.2, R Foundation for Statistical Computing, Vienna, Austria).

3. Results and Discussions

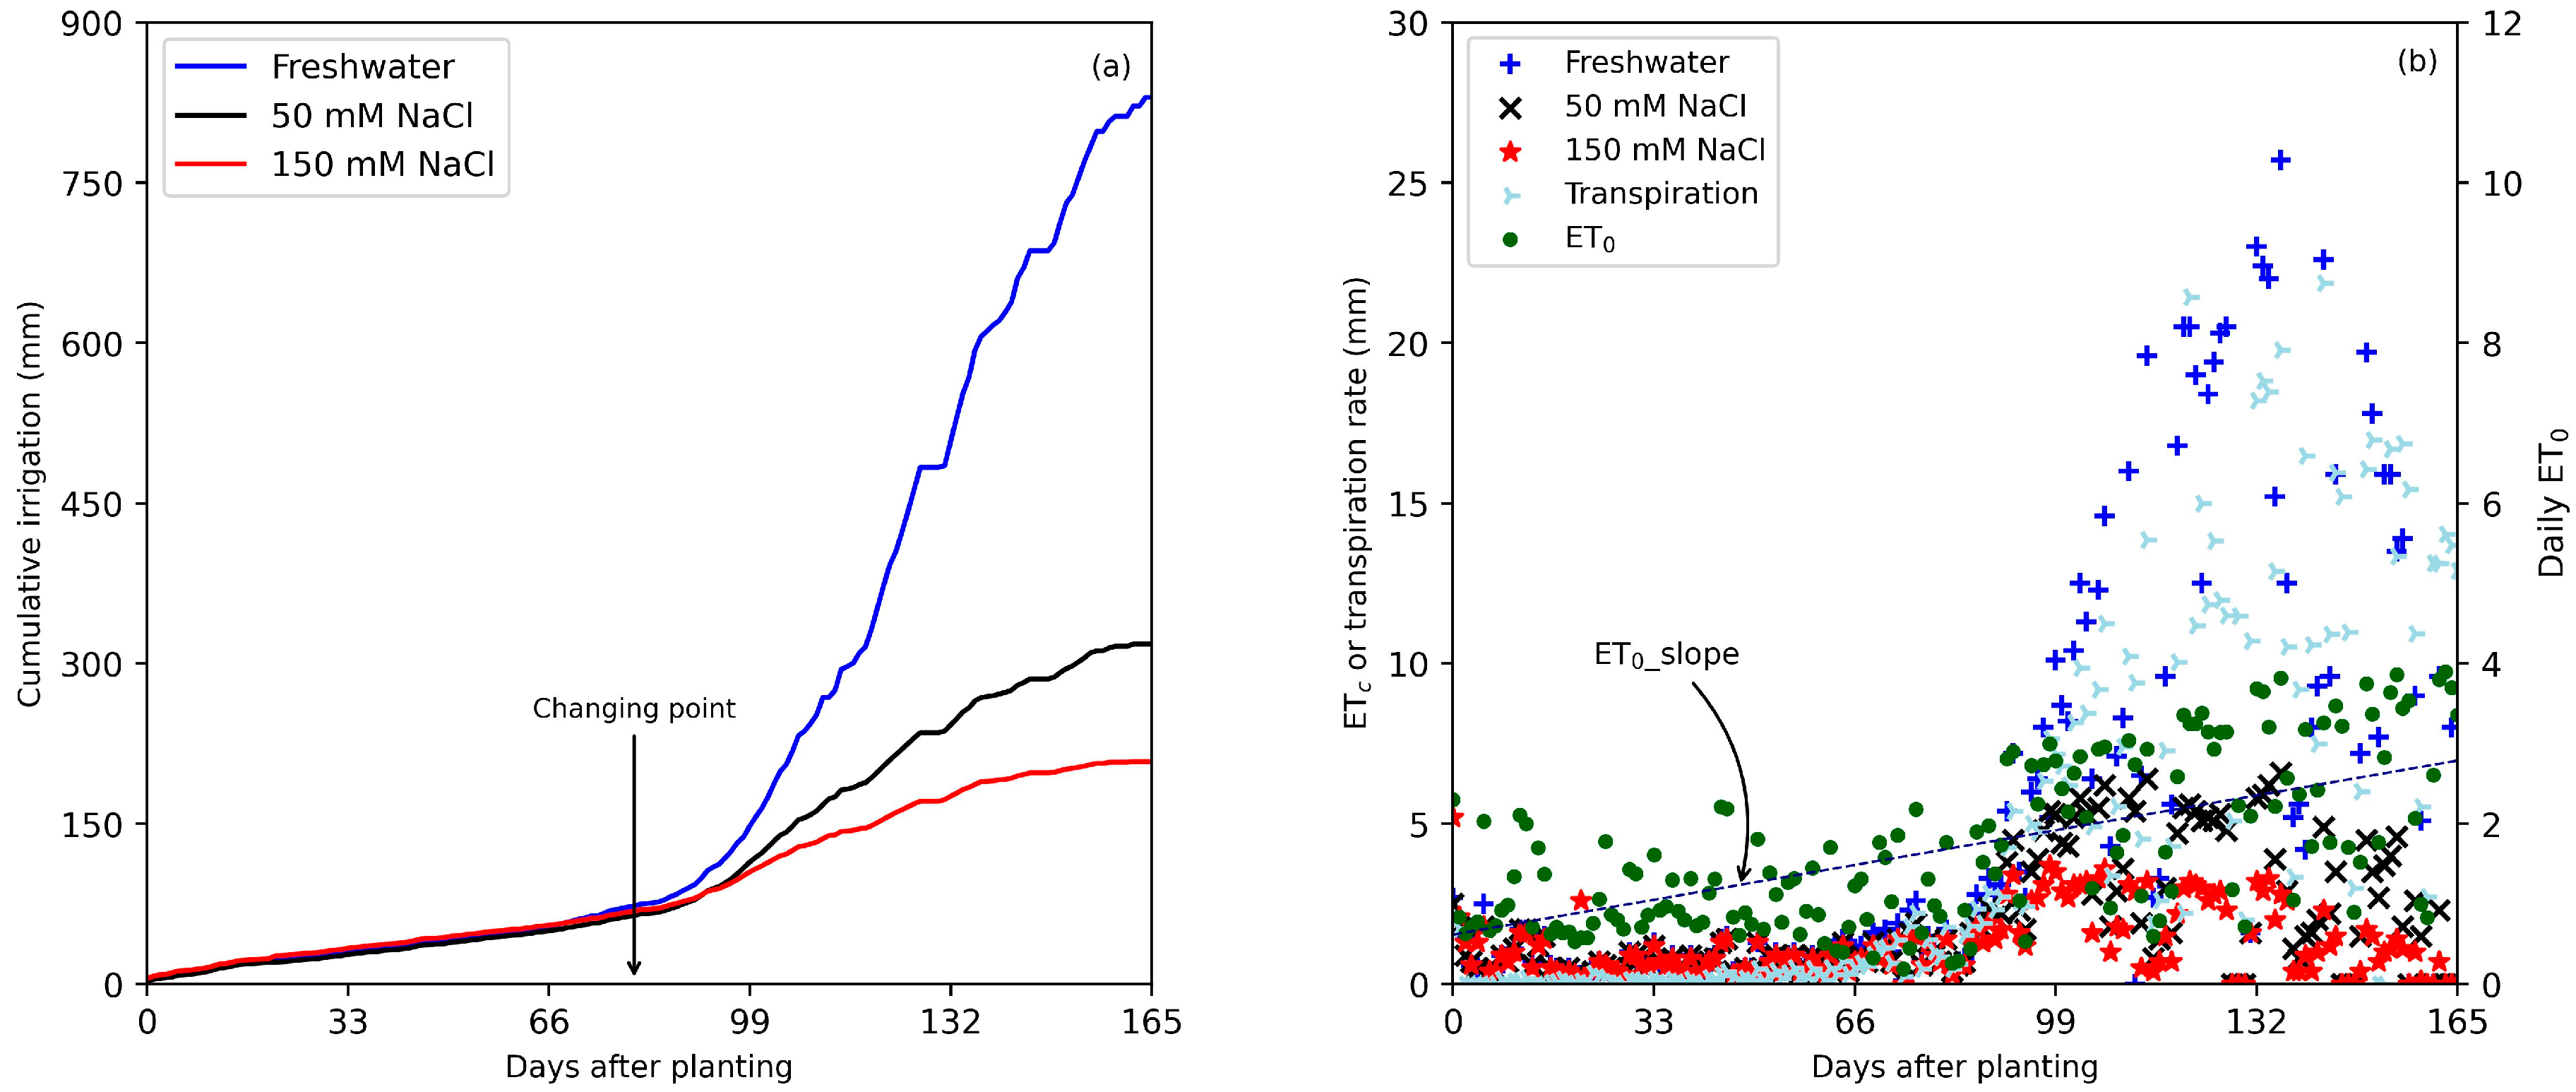
3.1. Impact of Saline Water Irrigation on Crop Water Demand

Irrigation was applied for each treatment based on actual daily E T c as shown in Figure 4 (a: freshwater, b: 50 NaCl H2O and c: 150 NaCl H2O). The PMLs were initially saturated with freshwater until 21 DAP. At 21 DAP, irrigation with freshwater, 50 mM and 150 mM of NaCl H2O were applied to each corresponding pot. The daily application of NaCl H2O began after 75 DAP when the soil moisture content dropped below FC.
The delay in daily irrigation application between 21 and 75 DAP owed to lower soil water losses driven by lower E T 0 . Since the drainage ceased from the bottom of each PML, which was required to prevent salt and nutrient leaching, water loss was directly related to crop evapotranspiration. The irrigation was managed in PMLs to retain soil moisture around FC, hence preventing drought stress from occurring. The cumulative applied irrigation with different NaCl concentrations as well as fluctuation of E T 0 , as illustrated in Figure 5a. The cumulative irrigation of each treatment was almost the same until the changing point (76 DAP). After this point, the crop instantly developed as the E T 0 began to rapidly increase due to decreasing relative humidity and increasing air temperature and solar radiation (Figure 3). Higher NaCl concentrations have significantly affected the E T c due to the occurrence of salinity stress. For example, the total applied irrigation for 150 mM NaCl treatment was four times less than the control treatment. Kankarla et al. [15] reported that ETc was significantly higher when triticale was irrigated with freshwater compared to saline irrigation at 8 dS m1. Ben Ali et al. [30,40] observed that frequent irrigation with saline water caused significant reduction in cumulative ETc rate. In 50 mM NaCl treatment, irrigation was applied equivalent to the calculated E T c -based FAO, but 2.6 times less than the control. These results were consistent with Goet et al. [41], who reported that increased salt concentrations in irrigation water reduced plant root water uptake, inhibited plant growth, and decreased soil moisture content. Ben Ali et al. [38] reported that fluctuation of soil water content under the application of saline water with 8.6 g L1, which is almost the equivalent of 150 mM NaCl, was low. This was due to increased osmotic potential, which reduced root water uptake and thus ET rate. The reasoning for the significant irrigation application to the control was the significant increase of crop canopy and root density, which resulted in potential water and nutrient uptake. By recording total irrigation applied to transpiration PMLs, we observed that the crop in control PMLs utilized 85% of applied irrigation during transpiration as shown in Figure 5b. The maximum water consumption occurred in the mid-growth stage which ranged between 105 and 135 DAP for both 50 mM NaCl and 150 mM NaCl treatments, and between 110 DAP and 145 DAP for freshwater treatment. The crop thereafter began to gradually mature (Figure 5b).

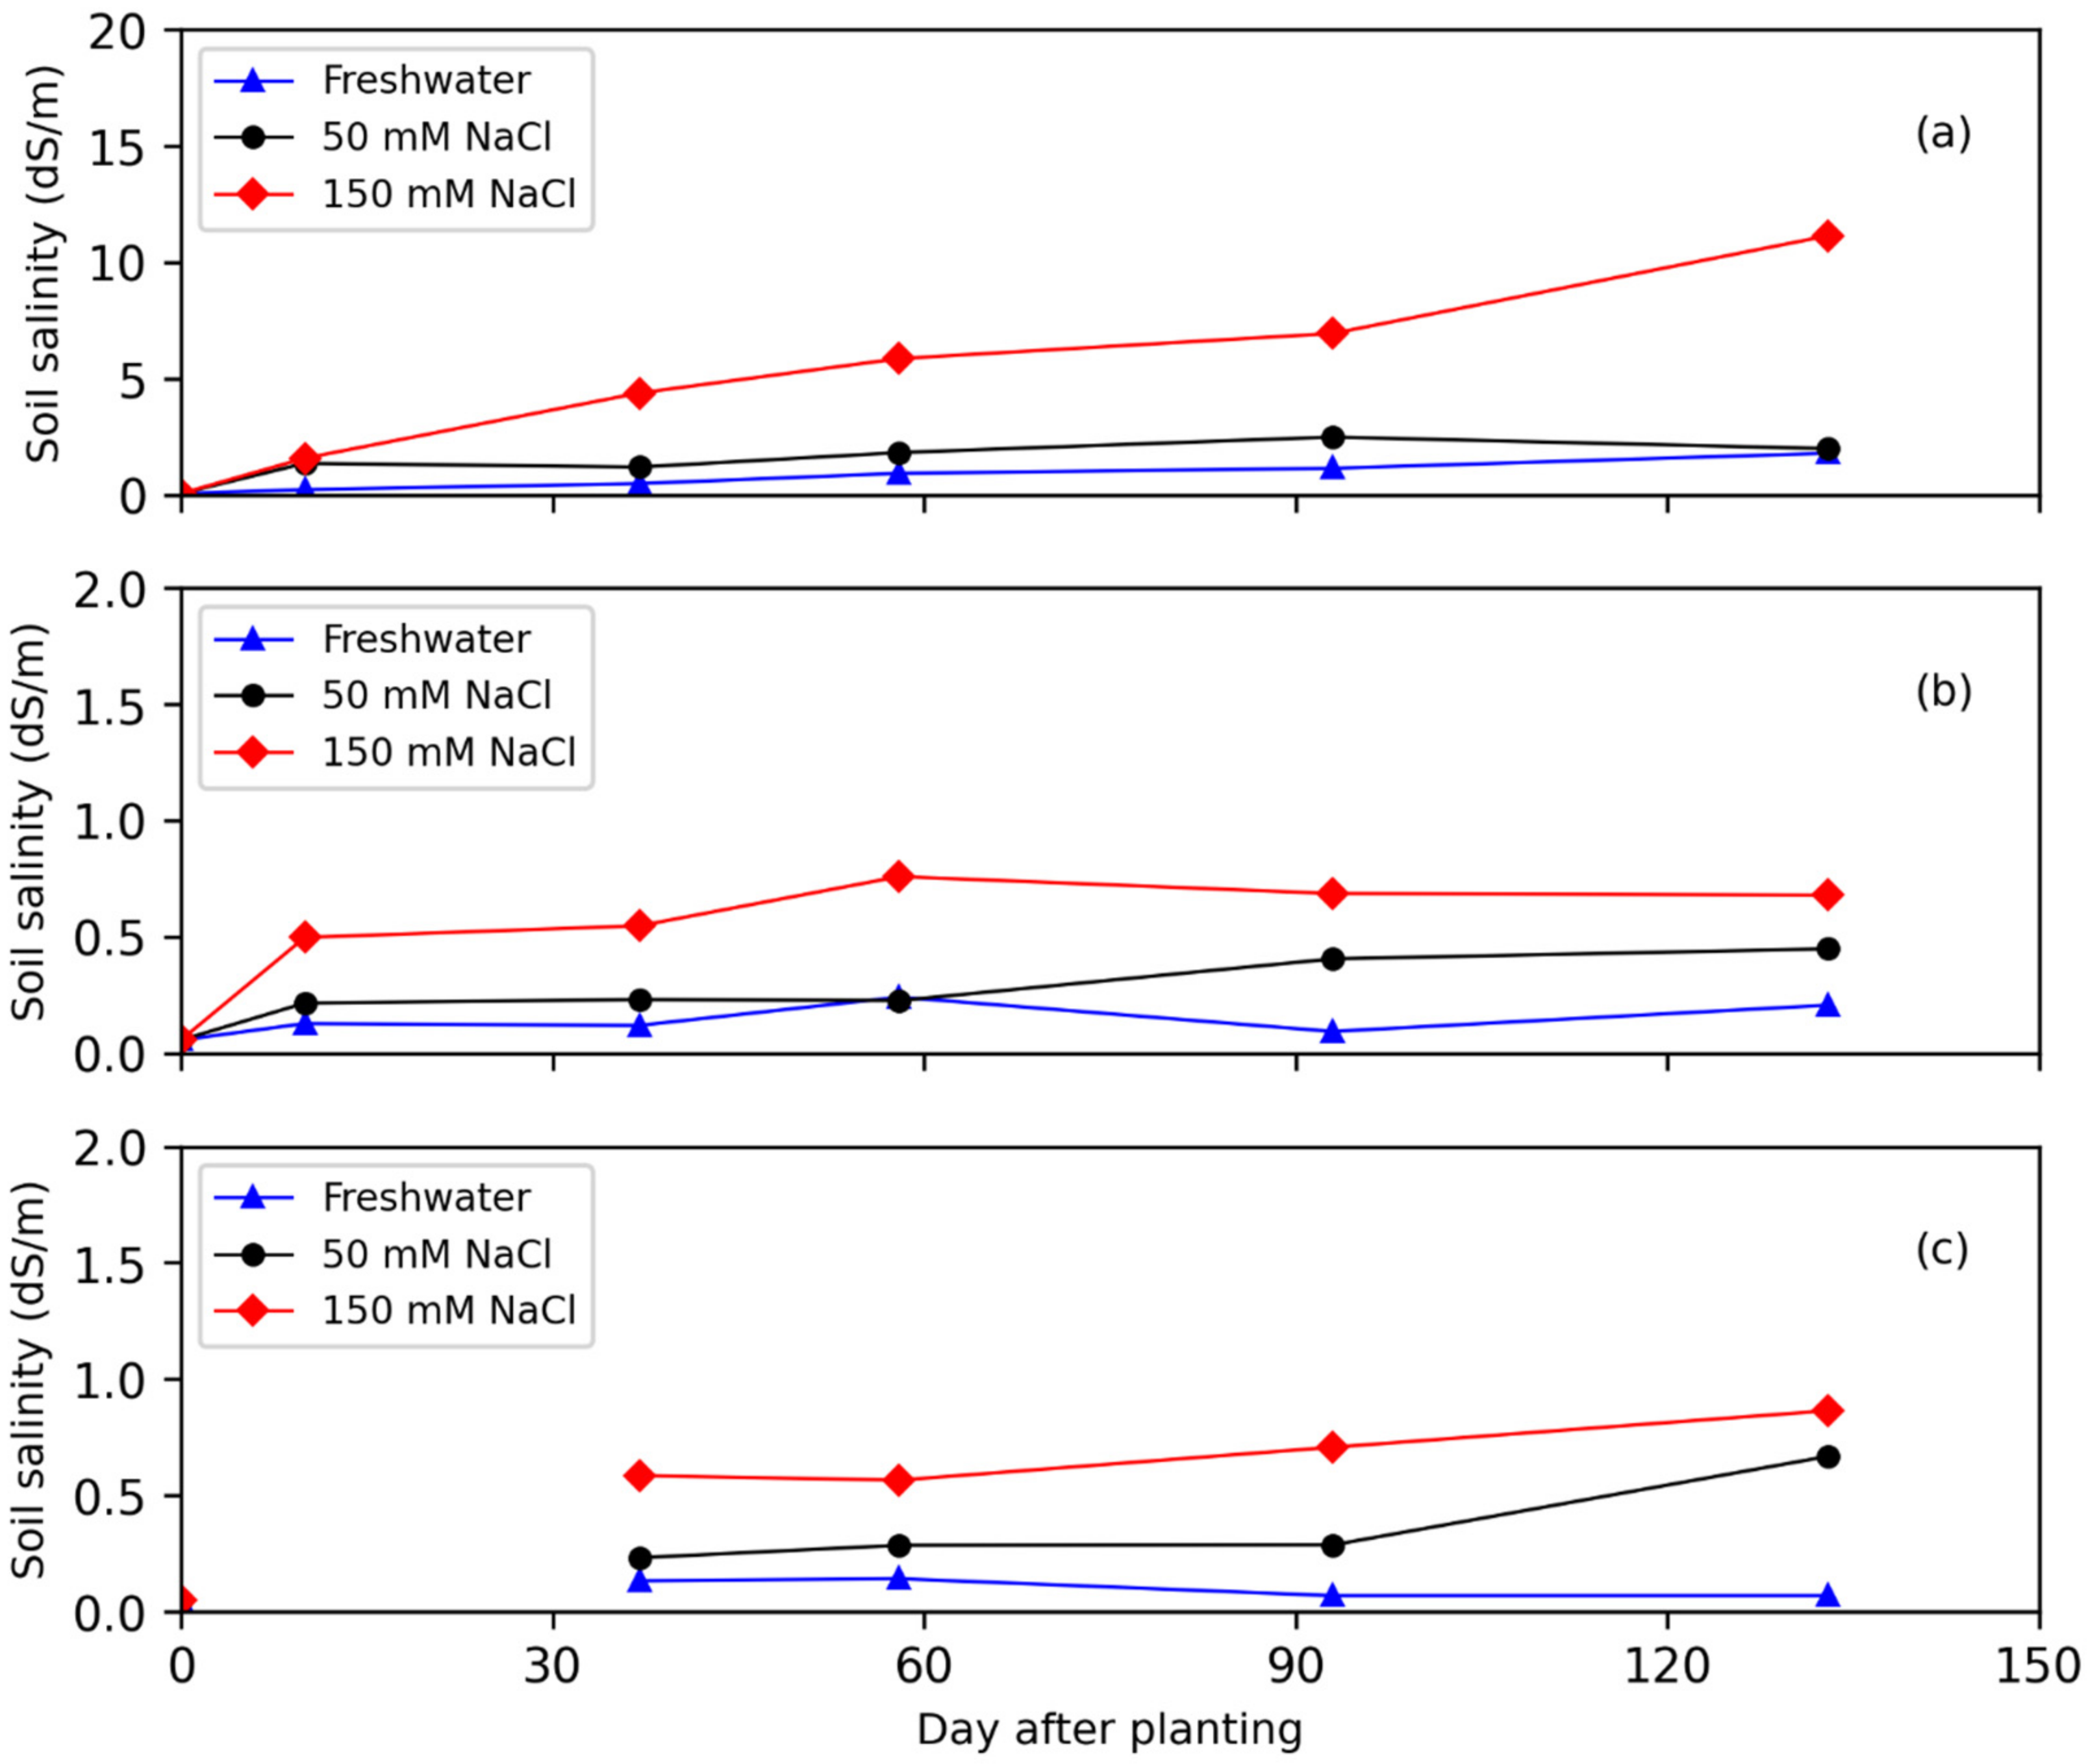
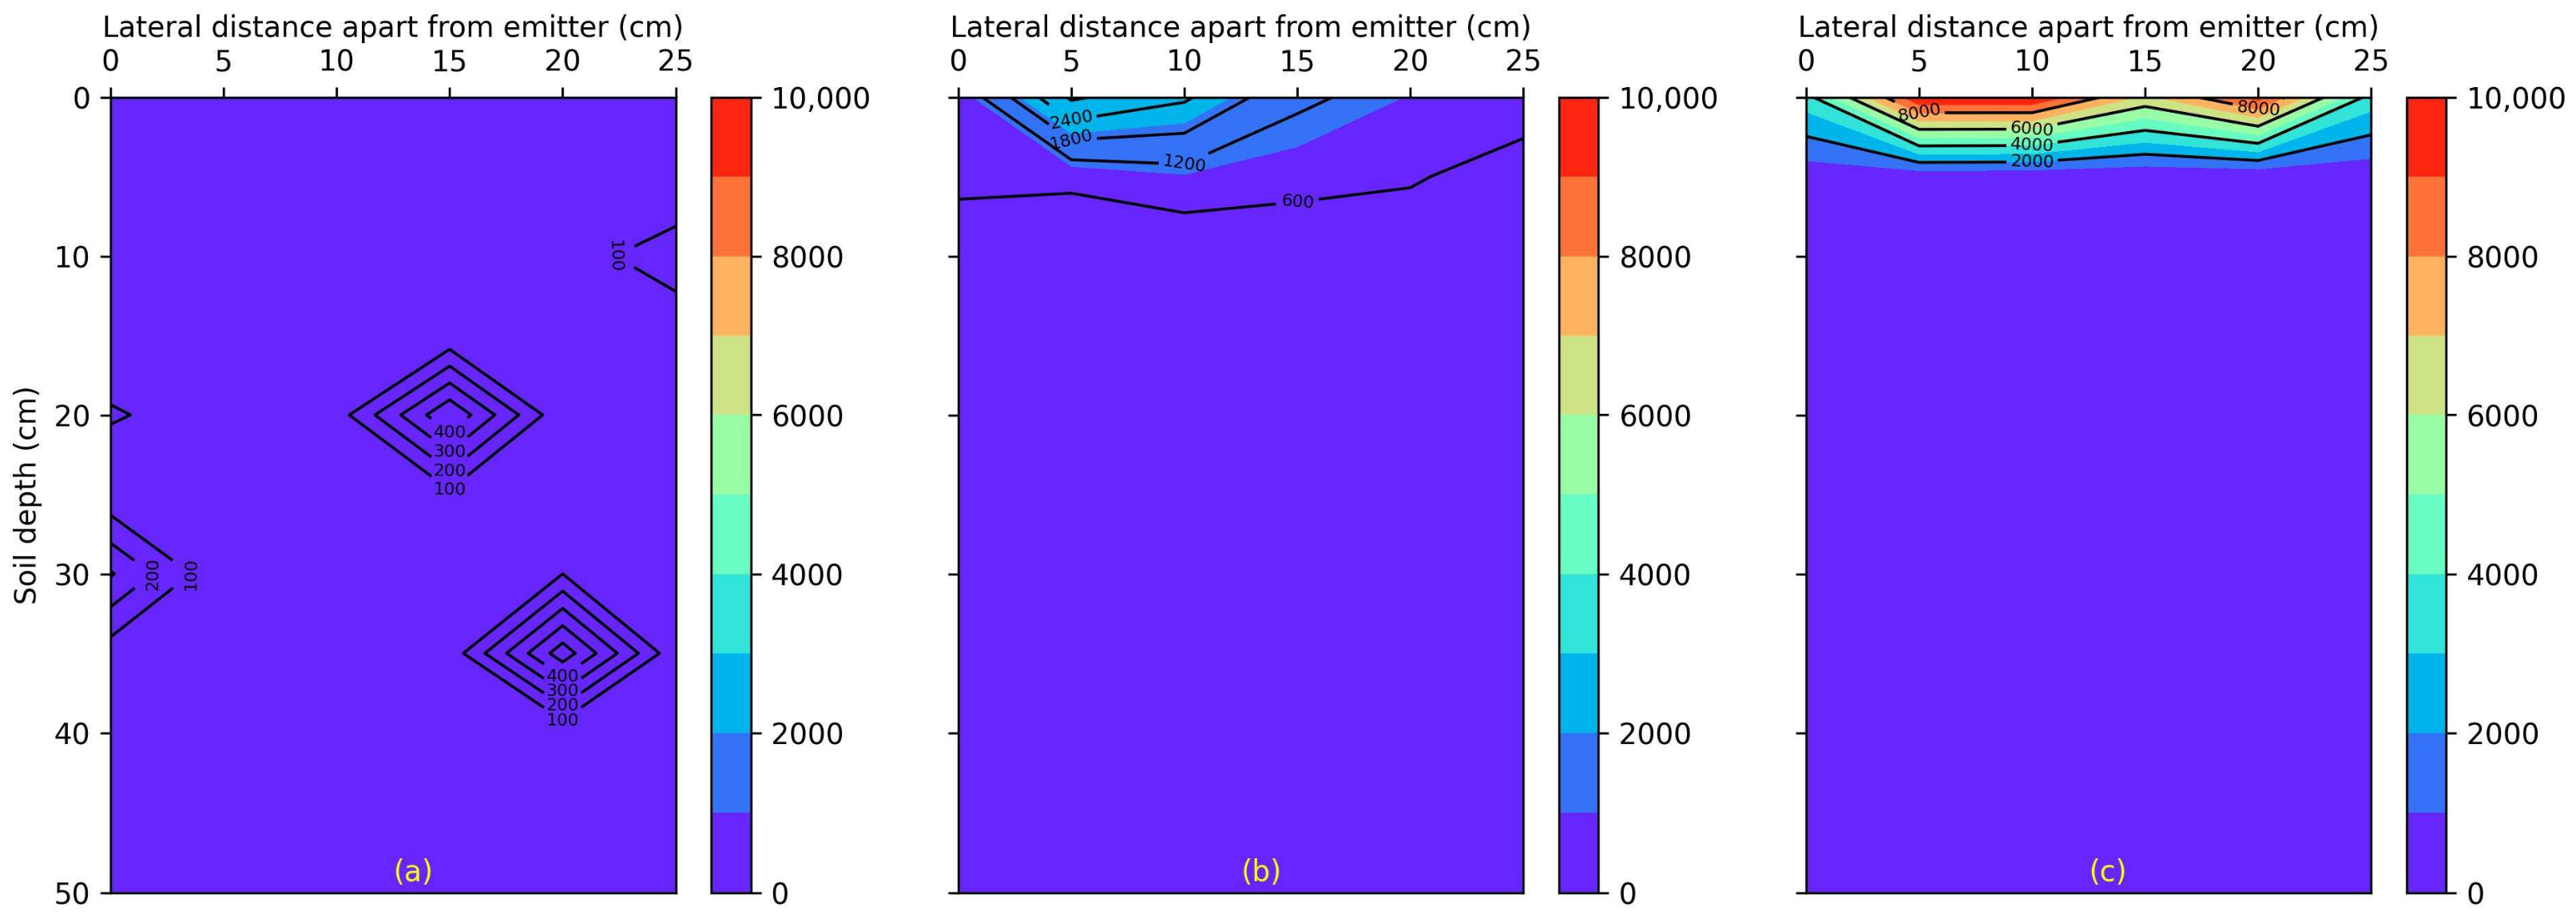
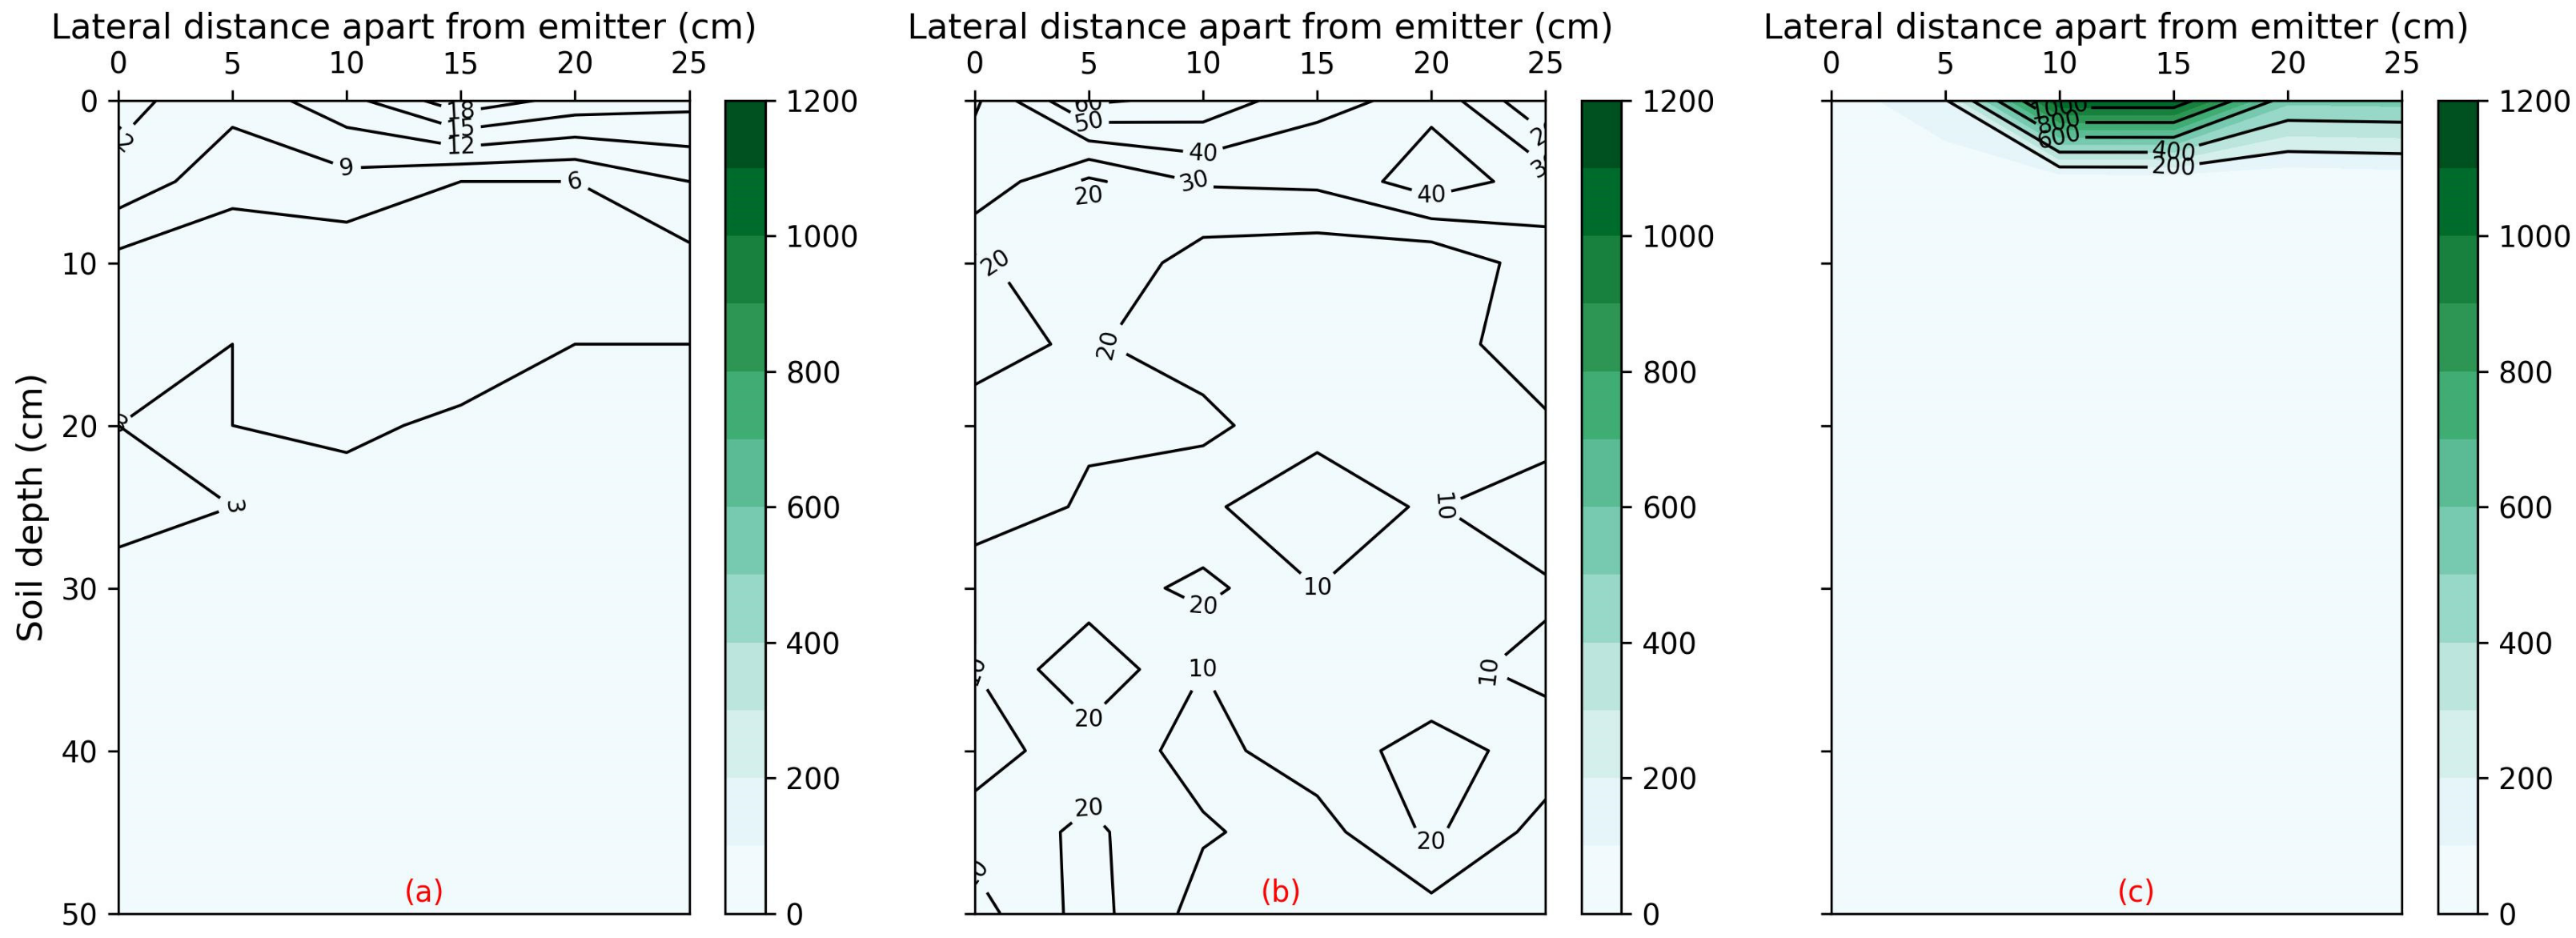
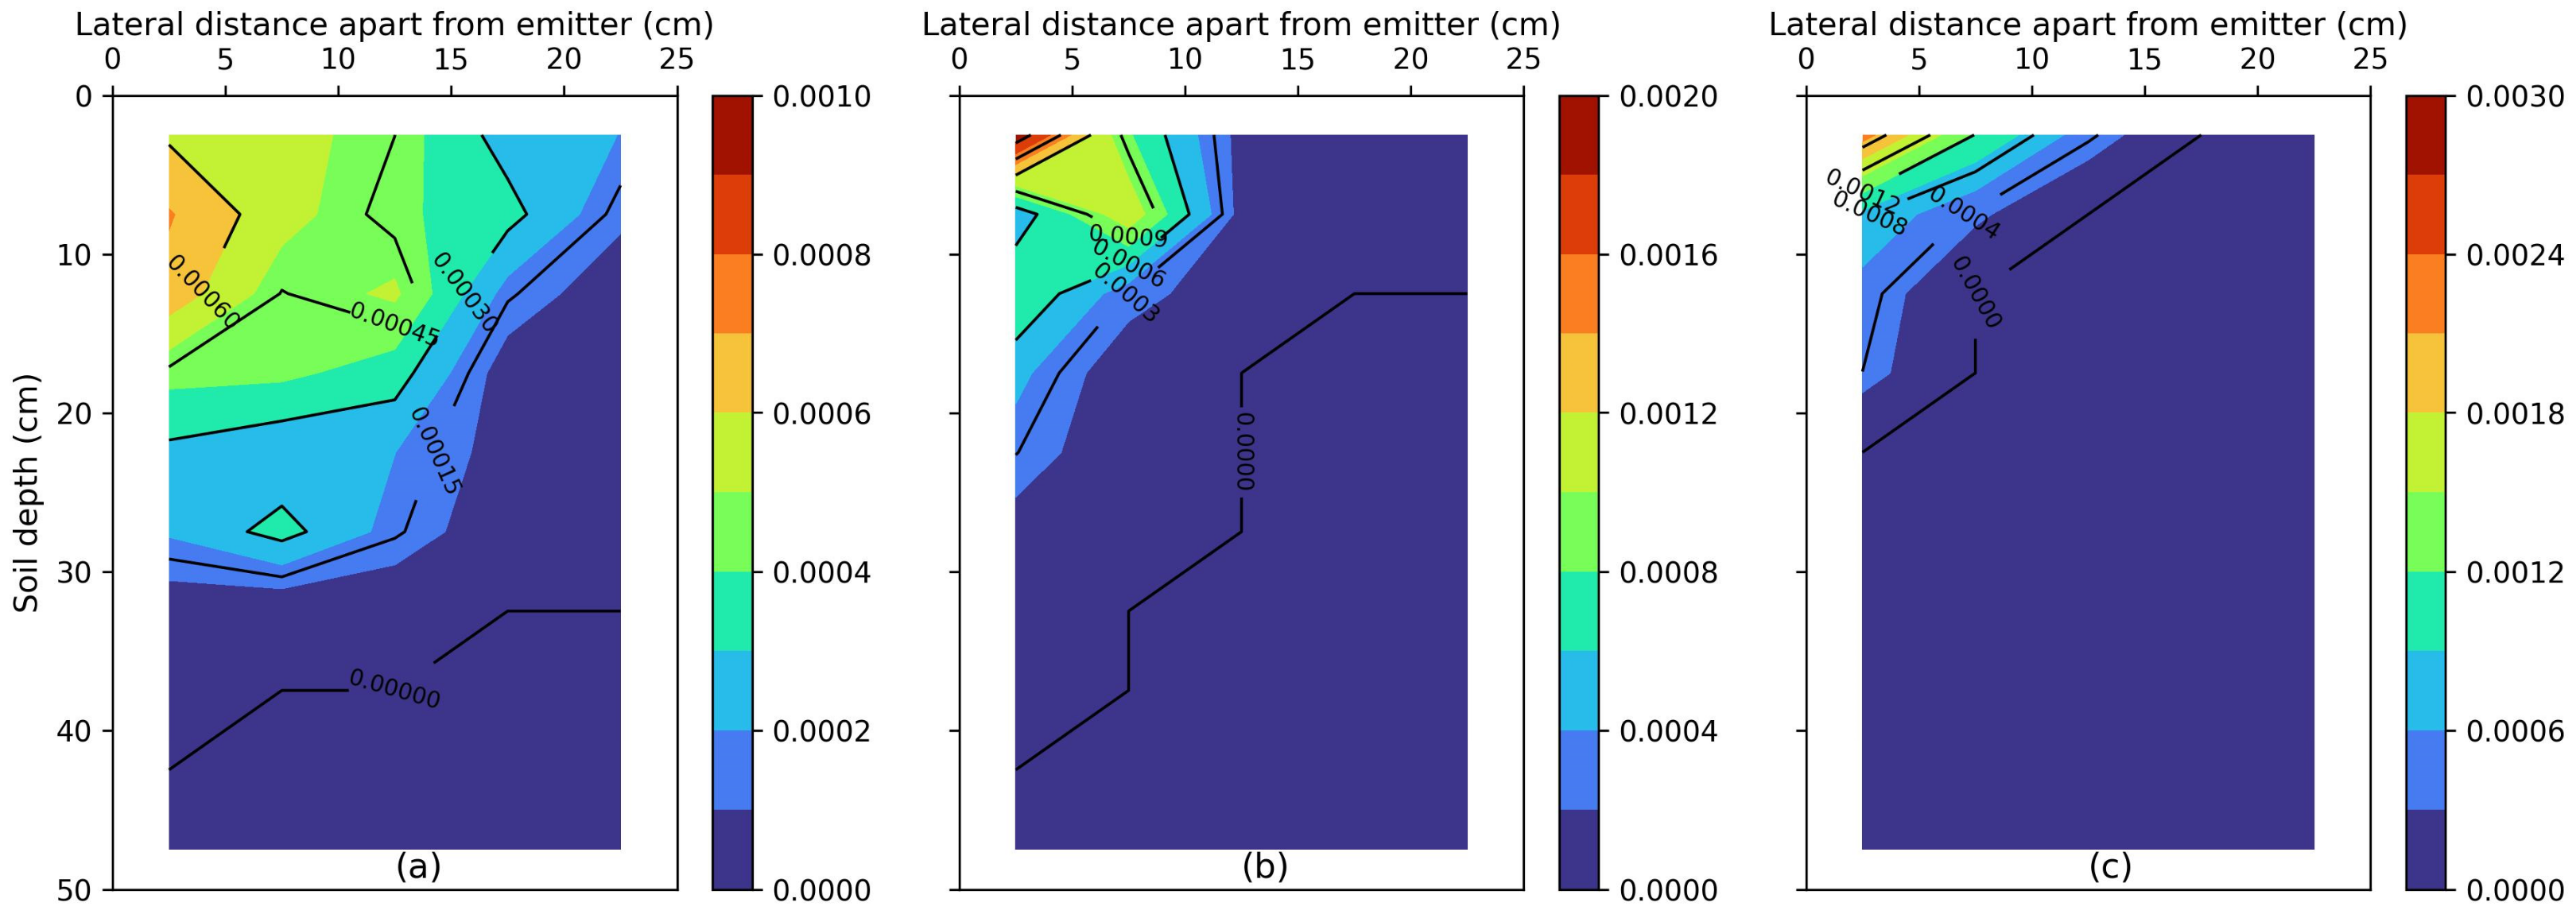
3.2. Impact of Saline Water Irrigation on Soil Salinity and Nutrients Fate

The effect of frequent application of NaCl H2O on the evolution of soil salinity below the dripper at three soil profile depths: 0 cm (surface), 5 cm, and 10 cm are illustrated in Figure 6. The application of NaCl H2O has significantly resulted in the build-up of salts in the soil profile, particularly on the topsoil layer (0–5 cm). This was due to a significant decrease in the evaporation rate as observed in Figure 5. Salt accumulation on the soil surface causes reduction in evaporation rate owing to three mechanisms: (i) reduced osmotic potential [42], (ii) resistance to water vapor movement to atmosphere owing to salt crust [24], and (iii) reduced temperature caused by enhanced albedo of salt crust [25]. Li and Shi [43] also reported that elevated salt crust caused by salt precipitation could reduce the evaporation rate by more than 60%. The dynamic effects of NaCl concentrations on soil and plant system were investigated using hourly data of calibrated θ and salt concentration values observed by the sensors after December 25, as shown in Figure 7. The fluctuation of θ in 50 mM NaCl treatment was higher than 150 mM NaCl. In contrast, the solutes concentration under 150 mM NaCl was relatively higher compared to 50 mM NaCl. This can be attributed to the large irrigation amounts applied to 50 mM NaCl, which resulted in less solutes application compared to 150 mM NaCl. The two-dimensional spatial distribution of soil salinity at the harvest is demonstrated in Figure 8. Irrigation with 50 mM and 150 mM of NaCl H2O over the growing season resulted in building up of salt, particularly in the top 5 cm of the soil profile. The contour maps presented in Figure 8c and Figure 8b show the significant effect of saline water irrigation with 150 mM NaCl and 50 mM NaCl, respectively, on the accumulation of salts in soil profile compared to irrigation with freshwater (Figure 8a). Burkhardt et al. [44] reported that irrigating with poor-quality water increased soil salinity and negatively affected the structure and hydraulic properties of soils. Soil salinity causes three different types of stress, including osmotic, ionic, and secondary stress [45]. Osmotic stress decreased the capability of the plant to absorb water from soil solution, resulting in water deficit in the plant itself. Ionic stress is induced by high concentrations of Na+ and Cl ions that eventually affect the enzymatic activities [46]. The Na+ ion has a detrimental impact on plant growth, water uptake, nutrient imbalance, permeability, and microbial activity [4]. Therefore, we presented the two-dimensional spatial distribution of Na+ ions in the soil profile in Figure 9. Application of 150 mM NaCl has severely caused accumulation of Na+ in the plant active rootzone compared to 50 mM NaCl and freshwater, respectively. Similarly, Atak et al. [47] observed that increasing NaCl application levels could increase the accumulation of Na+ ions. The accumulation of Na+ ions in soil or plant organs negatively reduces the net photosynthetic assimilation rate of CO2, reducing crop productivity [23]. Excessive build-up of Na+ ions resulted in nutrient imbalance due to the secondary stress caused by osmotic and ionic stresses [48], particularly in NO3 concentrations as shown in Figure 10. The NO3 concentrations in 150 mM NaCl treatment were higher in the topsoil layer, particularly at 5 cm apart from the plant. This was because, in localized irrigation, solutes including nutrients are radially leached from the emission point (drippers) where the moisture level is high; therefore, the concentrations steadily increased until they reached their peak at the edge of the wetting perimeter. In contrast, the application of 50 mM NaCl H2O has no significant effect on NO3 uptake (Figure 10b), where the uniform distribution was achieved along the soil profile as crop water use was equivalent to crop ET estimated by the FAO method. The plants irrigated by freshwater consumed a significant amount of water that caused the application of more NO3 compared to the other treatments. Thus, most of the applied NO3 was absorbed by the dense plant roots, leading to increased biomass accumulation, whereas the rest was leached deeper beyond the root zone (Figure 10a). The results are comparable with those reported by Rasouli et al. [49], whereby excessive salt levels can impair hormonal balance, hinder photosynthesis, and reduce protein synthesis due to decreased both root water and nitrate uptake. Akgün et al. [50] found that nitrogen uptake was highest in the control and lowest when the salt content was high.

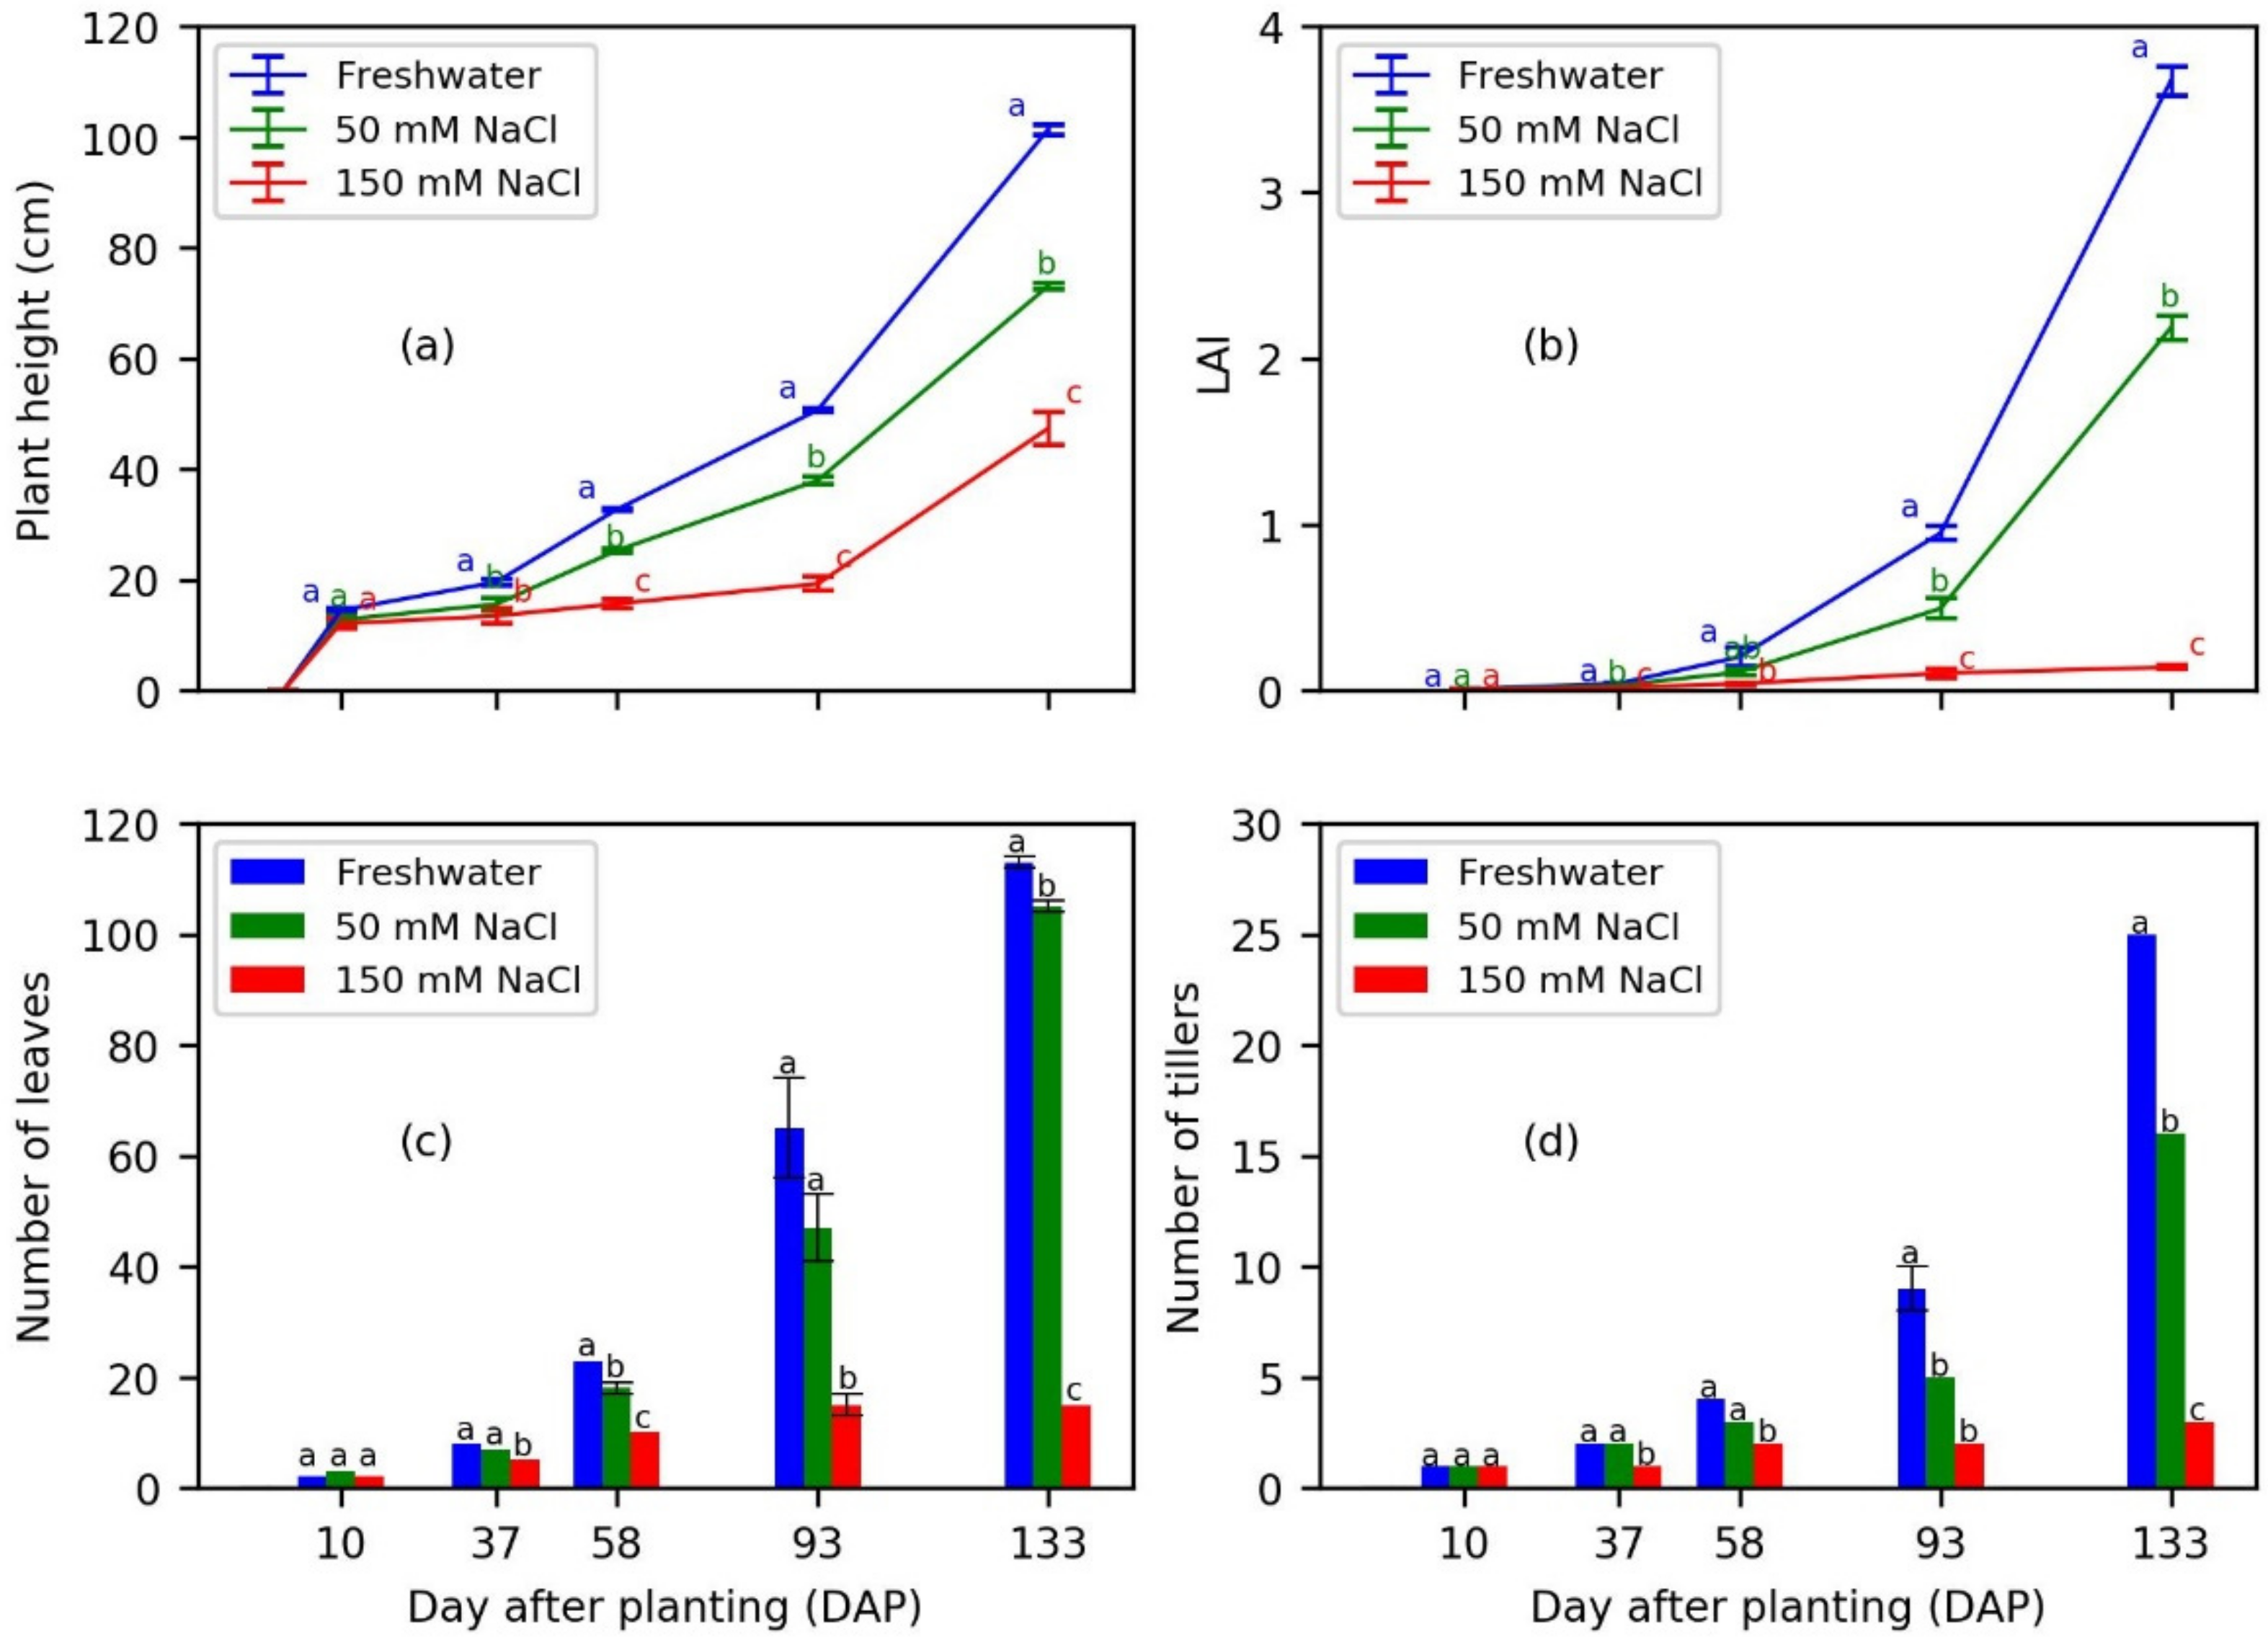
3.3. Impact of Saline Water Irrigation on Plant Growth

The application of saline irrigation in the form of NaCl solution may have detrimental impacts on crop growth depending on the concentration level used and crop tolerance to salinity. We have investigated the effect of NaCl solution on four growth parameters of triticale as illustrated in Figure 11. These parameters include plant height, which is an indicator for overall plant health (Figure 11a), LAI, number of produced leaves, which are the most crucial parameters influencing photosynthesis, water and nutrient uptake, as well as crop productivity (Figure 11b,c), and number of tillers, which are directly related to vegetative biomass accumulation and has a significant effect on final crop productivity (Figure 11d). The growth parameters of triticale during tillering and vegetative growth stages were influenced by lower values of E T c as shown in Figure 5b. The frequent application of NaCl H2O has significantly reduced the crop height, particularly after 58 DAP. In general, the application of 150 mM NaCl H2O significantly reduced the plant height, LAI, number of leaves and number of tillers compared to 50 mM NaCl H2O and freshwater, respectively. This was due to decreasing the osmotic potential caused by build-up of salts in the soil profile, which significantly reduced root water and nutrient uptake. These results matched with those published by Miao et al. [51], Kumar et al. [52], and Ullah et al. [53] on the effects of salinity on the plant growth, particularly the toxic effect of Na+ and Cl on the presented parameters. Another reason is the effect of NaCl concentration on root development as shown in Figure 12. The observed NRLD and plant rooting depth was highly affected by irrigation with 150 mM NaCl, where the maximum horizontal root growth was almost 15 cm with a maximal vertical growth of 10 cm. The active root density increased as the concentration of NaCl decreased. Similarly, Kankarla et al. [22] observed that high concentrations of NaCl in irrigation water significantly decreased fresh and dry root biomass. Atak et al. [47] found that root length decreased with increased NaCl concentration. Ion imbalance induced by excessive concentration of NaCl retards root growth, resulting in a smaller root system, lower soil water content and nutrient uptake, and subsequently decreased plant growth [54].

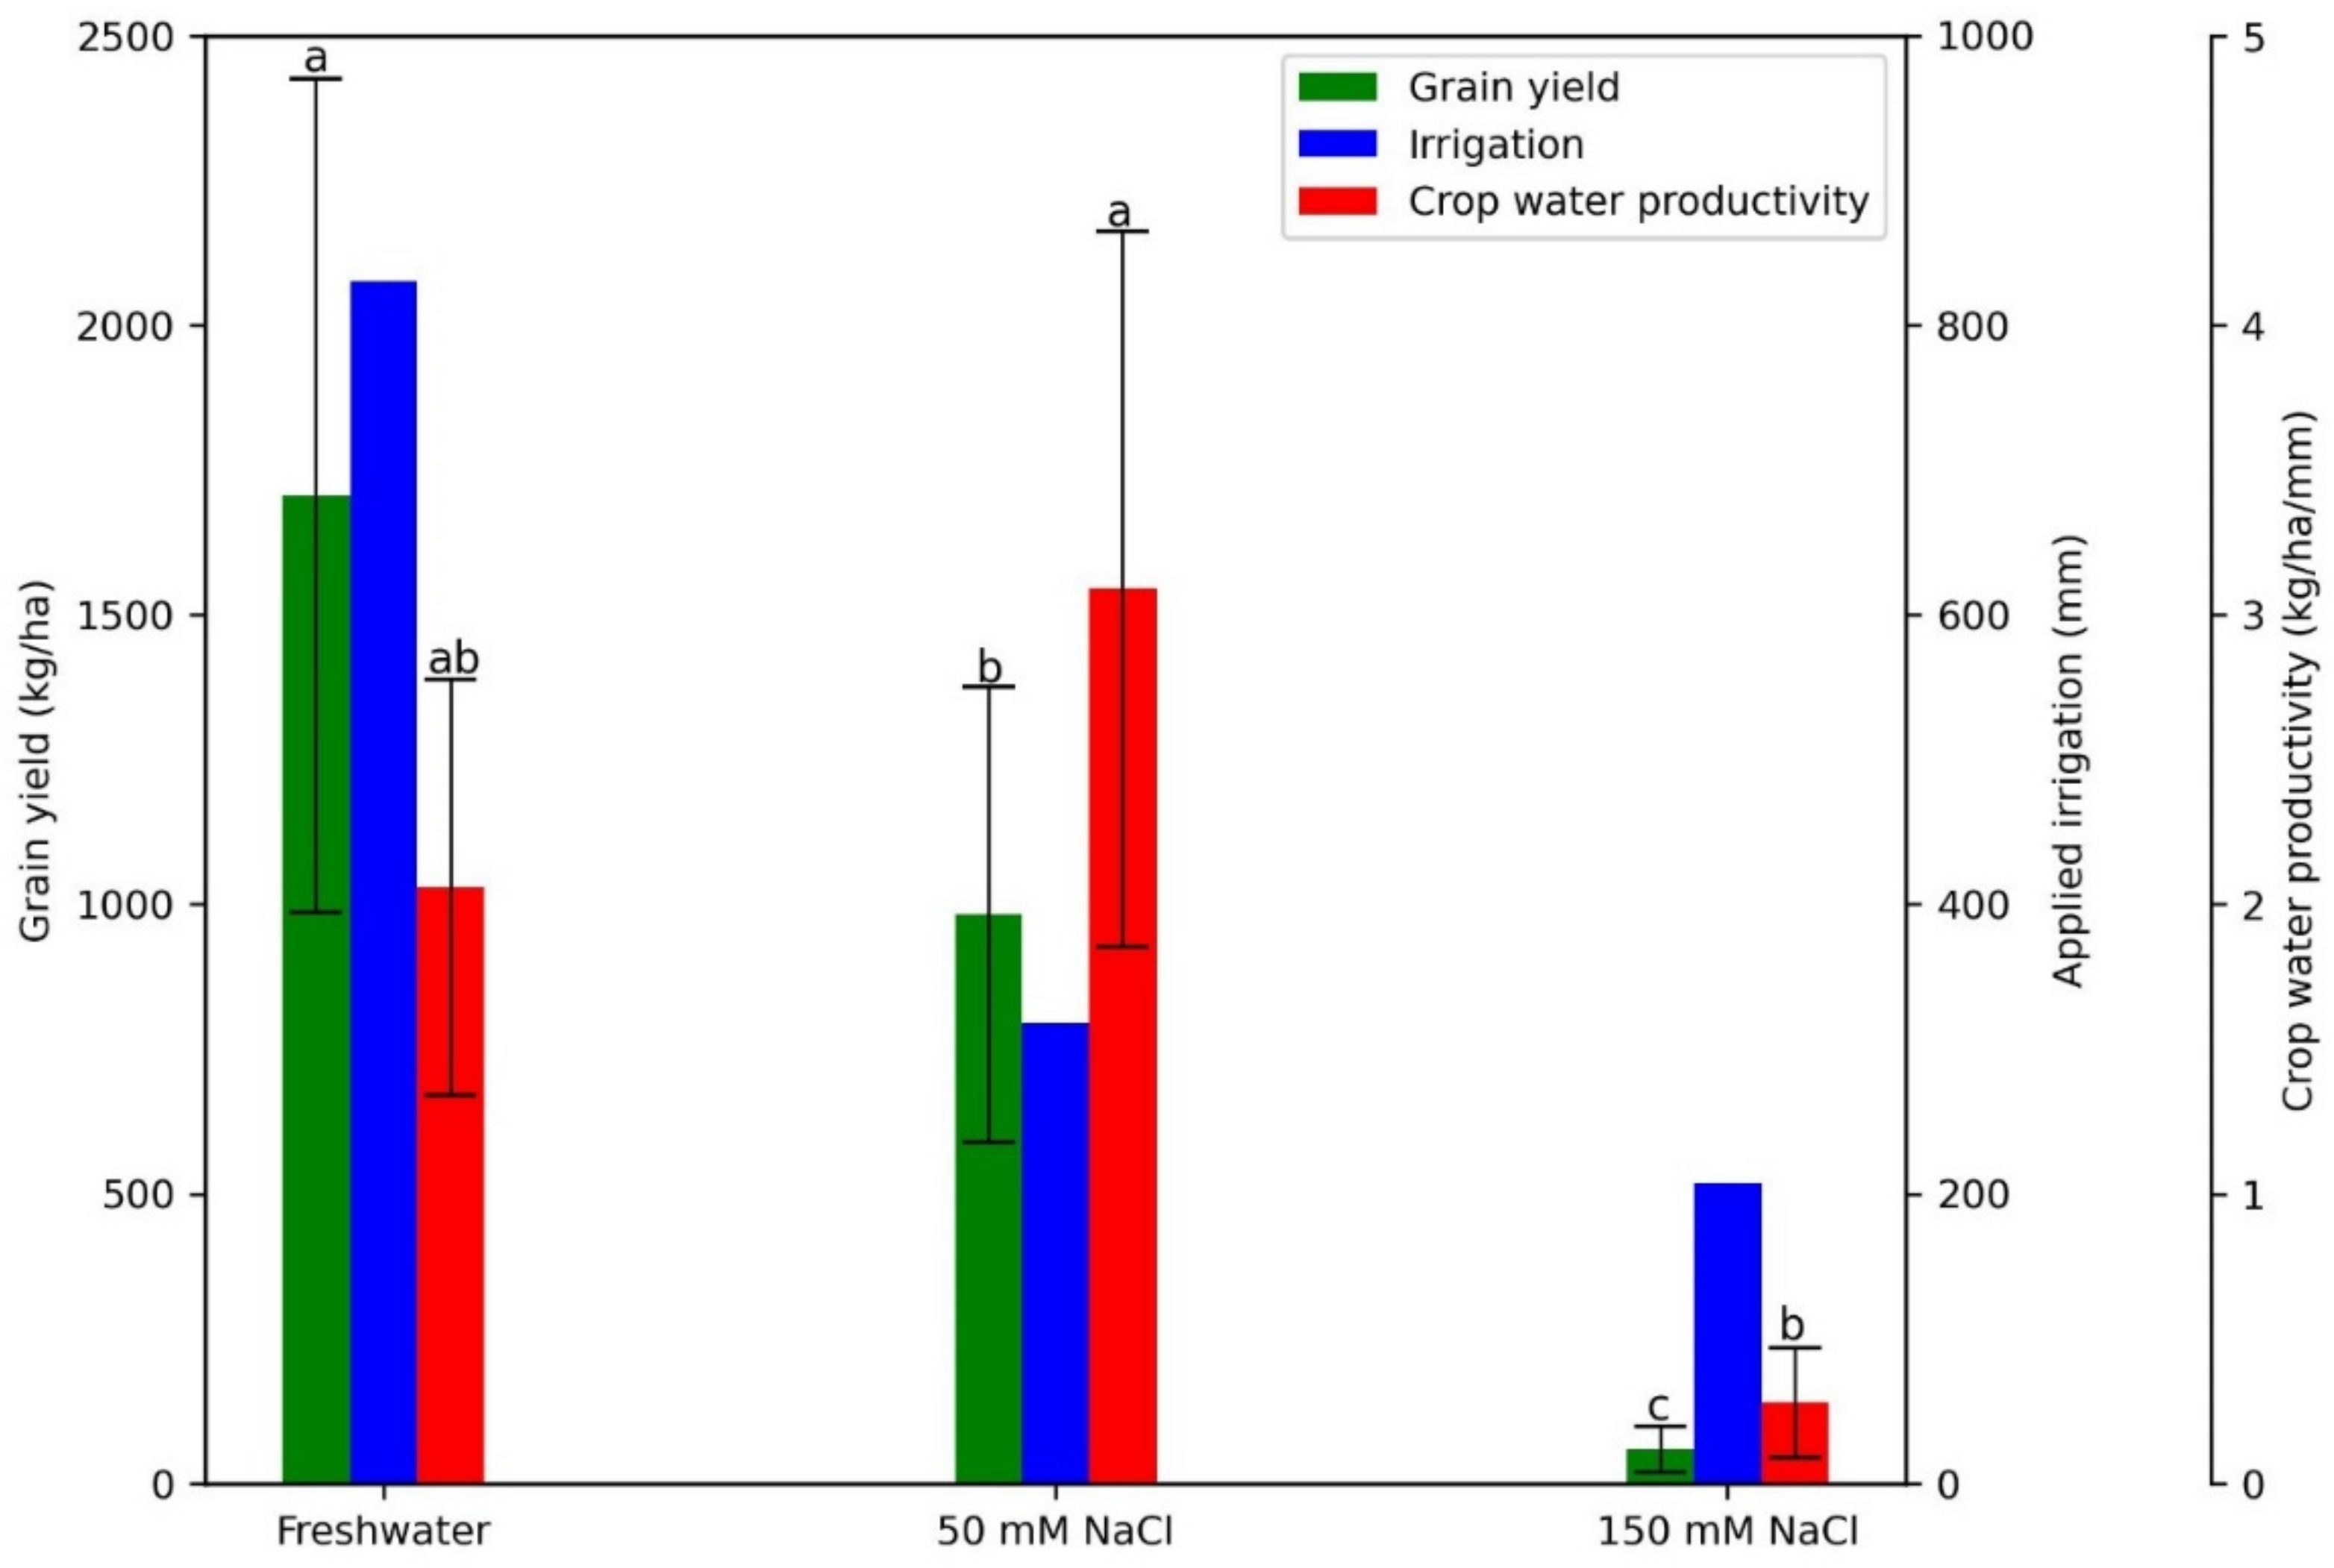
3.4. Impact of Saline Water Irrigation on Yield, Yield Components, and Crop Productivity

The impact of NaCl H2O application on yield attributes is illustrated in Table 1. Irrigation with 150 mM NaCl has most significantly affected plant height, number of tillers, number of spikes, total fresh biomass, and total dry biomass, followed by 50 mM NaCl and freshwater, respectively. There were no significant differences among all treatments in spike width. The application of 150 mM NaCl H2O had a significant effect on both spike length and weight of 100 grains, while no difference was found between 50 NaCl H2O and freshwater. These results were expected as the distribution of roots within the soil profile directly affects the crop water use and hence crop yield and yield components [55]. Goet et al. [41] also reported that increased salinity levels in irrigation water reduce LAI, root depth, and consequently crop yield [56]. Despite equal application of NPK fertilizer to all treatments, the control resulted in higher NPK inputs due to higher water use. This might have increased the number of spikes and the weight of 1000 grains as reported by Rzążewskaand Gąsiorowska [57]. The maximum reported weight of 1000 grains ranged between 35 and 40 g [58], which is consistent with our observations. Figure 13 shows the comparison of grain yield, total applied irrigation, and crop productivity among the treatments. Saline irrigation with concentrations of 150 mM and 50 mM NaCl significantly decreased grain yield by 97% and 42%, respectively, compared to freshwater. The treatments of 150 mM NaCl and 50 mM NaCl consumed 75% and 62% less water than the freshwater treatment, respectively. As a result, the crop water productivity was significantly affected by higher NaCl concentration (150 mM). The highest CWP was obtained under 50 mM NaCl treatment followed by freshwater treatment (Figure 13). This was owed to excess water demand by the plants grown under freshwater treatment.
For sustainable agriculture, salt accumulated in the root zone must be leached out. Therefore, if we consider leaching requirement, CWP of 50 mM treatment may not be higher than that of fresh water. In addition, higher NO3 uptake in freshwater treatment increased vegetative biomass and number of tillers per plant (Table 1), which had a competitive effect on the number of produced spikes [59]. The results imply that irrigation with more than 150 mM NaCl H2O will result in zero yield. According to Hillel [36], water quality ranging between 34 and 86 mM NaCl is classified as moderately saline, while saline water ranged between 86 and 171 mM NaCl. This means that when freshwater resources are scarce, moderate saline water irrigation may be used to grow triticale by adopting appropriate practices for salt management.

4. Conclusions

This study evaluated the impact of irrigation water with different quality on crop growth and soil salinity build-up of the triticale when no leaching is applied. To evaluate the effect of water salinity on the soil–plant system, NaCl was used as the primary source of salinity. The results indicate that frequent applications of NaCl H2O resulted in accumulation of salts in the soil profile, resulting in reduced water and NO3 uptake by plants. The application of 150 mM and 50 mM NaCl reduced grain yield by 97% and 42%. The highest crop water productivity was found for 50 mM NaCl treatment, followed by freshwater and 150 mM NaCl treatments, respectively. This shows that moderately saline water resources can be used to grow triticale in water scarce environments by adopting proper water and salt management approaches.

Author Contributions

The work included in the manuscript is made by the contributions of the article’s authors as follows: Conceptualization, H.M.A.E.B. and H.F.; methodology, H.M.A.E.B. and H.F.; formal analysis, H.M.A.E.B.; investigation, H.M.A.E.B. and J.B.N.; resources, K.T.; data curation, H.M.A.E.B. and K.T.; writing—original draft preparation, H.M.A.E.B.; writing—review and editing, H.M.A.E.B., H.F., A.S.Q., K.T. and J.B.N.; visualization, H.M.A.E.B., H.F., K.T. and A.S.Q.; supervision, H.F.; project administration, K.T.; funding acquisition, K.T. All authors have read and agreed to the published version of the manuscript.

Funding

This research was supported by the Science and Technology Research Partnership for Sustainable Development (SATREPS_Uzbekistan) in collaboration between the Japan Science and Technology Agency (JST, JPMJSA2001) and the Japan International Cooperation Agency (JICA).

Institutional Review Board Statement

Not applicable.

Informed Consent Statement

Not applicable.

Data Availability Statement

The data presented in this study are available upon request from the corresponding author.

Acknowledgments

We appreciate the technical assistance and support of the team of the Irrigation and Drainage Lab, Arid Land Research Center, Tottori University, including Atarashi (Technician), Daiki Komatsu (student), and Shota (student).

Conflicts of Interest

The authors declare no conflicts of interest.

References

  1. Hassani, A.; Azapagic, A.; Shokri, N. Global Predictions of Primary Soil Salinization under Changing Climate in the 21st Century. Nat. Commun. 2021, 12, 6663. [Google Scholar] [CrossRef] [PubMed]
  2. Qadir, M.; Quillérou, E.; Nangia, V.; Murtaza, G.; Singh, M.; Thomas, R.J.; Drechsel, P.; Noble, A.D. Economics of Salt-Induced Land Degradation and Restoration. Nat Resour Forum 2014, 38, 282–295. [Google Scholar] [CrossRef]
  3. Hussain, M.I.; Farooq, M.; Muscolo, A.; Rehman, A. Crop Diversification and Saline Water Irrigation as Potential Strategies to Save Freshwater Resources and Reclamation of Marginal Soils—A Review. Environ. Sci. Pollut. Res. 2020, 27, 28695–28729. [Google Scholar]
  4. Erkan, I.E.; Aras, Ö.E. Effects of Salicylic Acid on Triticale under Salt Stress. Bilge Int. J. Sci. Technol. Res. 2021, 5, 80–85. [Google Scholar] [CrossRef]
  5. Lelley, T. Triticale: A low-Input Cereal with Untapped Potential. In Genetic Resources, Chromosome Engineering, and Crop Improvement: Cereals; Singh, R.J., Jauhar, P.P., Eds.; Taylor & Francis Group: London, UK, 2006; Volume 2, pp. 395–430. [Google Scholar]
  6. Zhu, F. Triticale: Nutritional Composition and Food Uses. Food Chem. 2017, 241, 468–479. [Google Scholar] [CrossRef]
  7. Cantale, C.; Petrazzuolo, F.; Correnti, A.; Farneti, A.; Felici, F.; Latini, A.; Galeffi, P. Triticale for Bioenergy Production. Agric. Agric. Sci. Procedia 2016, 8, 609–616. [Google Scholar] [CrossRef]
  8. Kankarla, V.; Shukla, M.K.; Picchioni, G.A.; VanLeeuwen, D.; Schutte, B.J. Germination and Emergence Responses of Alfalfa, Triticale and Quinoa Irrigated with Brackish Groundwater and Desalination Concentrate. Agronomy 2020, 10, 549. [Google Scholar] [CrossRef]
  9. Uluışık, S.; Oney-Birol, S. Physiological and Biochemical Responses of 13 Cultivars of Triticale (× Triticosecale Wittmack) to Salt Stress. Gesunde Pflanz. 2021, 73, 565–574. [Google Scholar] [CrossRef]
  10. Stoyanov, H.; Doneva, S. Analysis on some qualitative traits of Bulgarian triticale cultivars. Bulg. J. Agric. Sci. 2022, 59, 13–27. [Google Scholar]
  11. Gołębiowska, G.; Dyda, M.; Wajdzik, K. Quantitative Trait Loci and Candidate Genes Associated with Cold-Acclimation and Microdochium Nivale Tolerance/Susceptibility in Winter Triticale (× Triticosecale). Plants 2021, 10, 2678. [Google Scholar] [CrossRef]
  12. Lonbani, M.; Arzani, A. Morpho-Physiological Traits Associated with Terminal Drought—Stress Tolerance in Triticale and Wheat. Agron. Res. 2011, 9, 315–329. [Google Scholar]
  13. Yang, D.; Zhang, S.; Tian, X.; Du, W. Morphological and Physiological Traits of Triticale as Affected by Drought Stress. Chil J. Agric. Res. 2023, 83, 203–216. [Google Scholar] [CrossRef]
  14. Shanazari, M.; Golkar, P.; Mirmohammady Maibody, A.M. Effects of Drought Stress on Some Agronomic and Bio-Physiological Traits of Trititicum Aestivum, Triticale, and Tritipyrum Genotypes. Arch. Agron. Soil. Sci. 2018, 64, 2005–2018. [Google Scholar] [CrossRef]
  15. Kankarla, V.; Shukla, M.K.; VanLeeuwen, D.; Schutte, B.J.; Picchioni, G.A. Growth, Evapotranspiration, and Ion Uptake Characteristics of Alfalfa and Triticale Irrigated with Brackish Groundwater and Desalination Concentrate. Agronomy 2019, 9, 789. [Google Scholar] [CrossRef]
  16. Ozturk, O.F.; Shukla, M.K.; Stringam, B.; Picchioni, G.A.; Gard, C. Irrigation with brackish water changes evapotranspiration, growth and ion uptake of halophytes. Agric. Water Manag. 2018, 195, 142–153. [Google Scholar]
  17. Grieve, C.M.; Grattan, S.R.; Maas, E.V. Chapter 13 Plant salt tolerance. Agric. Ultural Salin. Assess. Manag. 2012, 71, 405–459. [Google Scholar]
  18. Singh, A.; Sharma, A. Assessment of Genetic Parameters for Yield and Yield Attributes of Triticale and Wheat Genotype under Salt Affected Condition. J. Pharm. Innov. 2021, 10, 337–339. [Google Scholar]
  19. Ma, Y.; Dias, M.C.; Freitas, H. Drought and Salinity Stress Responses and Microbe-Induced Tolerance in Plants. Front. Plant Sci. 2020, 11, 591911. [Google Scholar] [CrossRef]
  20. Ayers, R.S.; Westcot, D.W. Water Quality for Agriculture; Irrigation and Drainage Paper No. 29; FAO: Rome, Italy, 1976. [Google Scholar]
  21. Ayub, Q. Effect of Salinity on Physiological and Biochemical Attributes of Different Brinjal (Solanum melongena L.) Cultivars. Pure Appl. Biol. 2020, 9, 2190–2198. [Google Scholar] [CrossRef]
  22. Kankarla, V.; Shukla, M.K.; Picchioni, G.A. Root Growth, Architecture, and Ion Uptake of Alfalfa and Triticale Irrigated with Brackish Groundwater and Reverse Osmosis Concentrate. Agrosystems Geosci. Environ. 2021, 4, e20180. [Google Scholar] [CrossRef]
  23. Munns, R.; Day, D.A.; Fricke, W.; Watt, M.; Arsova, B.; Barkla, B.J.; Bose, J.; Byrt, C.S.; Chen, Z.; Foster, K.J.; et al. Energy Costs of Salt Tolerance in Crop Plants. New Phytol. 2020, 225, 1072–1090. [Google Scholar] [CrossRef] [PubMed]
  24. Fujimaki, H.; Shimano, T.; Inoue, M.; Nakane, K. Effect of a Salt Crust on Evaporation from a Bare Saline Soil. Vadose Zone J. 2006, 5, 1246–1256. [Google Scholar] [CrossRef]
  25. Fujimaki, H.; Shiozawa, S.; Inoue, M. Effect of Salty Crust on Soil Albedo. Agric. For. Meteorol. 2003, 118, 125–135. [Google Scholar] [CrossRef]
  26. Kumar, C.; Verma, S.B.; Singh, A.K. Sustainable Management of Soil Salinity with Special Reference to Smart Fertigation Systems. Proc. Natl. Acad. Sci. India Sect. B Biol. Sci. 2024, 94, 705–718. [Google Scholar]
  27. Guo, X.; Du, S.; Guo, H.; Min, W. Long-Term Saline Water Drip Irrigation Alters Soil Physicochemical Properties, Bacterial Community Structure, and Nitrogen Transformations in Cotton. Appl. Soil Ecol. 2022, 182, 104719. [Google Scholar] [CrossRef]
  28. Che, Z.; Wang, J.; Li, J. Modeling Strategies to Balance Salt Leaching and Nitrogen Loss for Drip Irrigation with Saline Water in Arid Regions. Agric. Water Manag. 2022, 274, 107943. [Google Scholar] [CrossRef]
  29. Tahtouh, J.; Mohtar, R.; Assi, A.; Schwab, P.; Jantrania, A.; Deng, Y.; Munster, C. Impact of Brackish Groundwater and Treated Wastewater on Soil Chemical and Mineralogical Properties. Sci. Total Environ. 2018, 647, 99–109. [Google Scholar] [CrossRef]
  30. Ben Ali, A.R.; Yang, H.; Shukla, M. Brackish Groundwater and Reverse Osmosis Concentrate Influence Soil Physical and Thermal Properties and Pecan Evapotranspiration. Soil Sci. Soc. Am. J. 2021, 85, 1519–1533. [Google Scholar] [CrossRef]
  31. Blaney, H.F.; Criddle, W.D. Determining Water Requirements in Irrigated Areas from Climatological and Irrigation Data; Soil conservation service technical paper 96; Soil Conservation Service: Washington, DC, USA, 1950. [Google Scholar]
  32. Allen, R.G.; Pereire, L.S.; Rase, D.; Smith, M. Crop Evapotranspiration. In Guidelines for Computing Crop Water Requirements; FAO Irrigation and Drainage paper number 56; FAO: Rome, Italy, 1998. [Google Scholar]
  33. Pütz, T.; Kiese, R.; Wollschläger, U.; Groh, J.; Rupp, H.; Zacharias, S.; Priesack, E.; Gerke, H.H.; Gasche, R.; Bens, O.; et al. TERENO-SOILCan: A Lysimeter-Network in Germany Observing Soil Processes and Plant Diversity Influenced by Climate Change. Environ. Earth Sci. 2016, 75, 1242. [Google Scholar] [CrossRef]
  34. Lu, Y.; Ma, D.; Chen, X.; Zhang, J. A Simple Method for Estimating Field Crop Evapotranspiration from Pot Experiments. Water 2018, 10, 1823. [Google Scholar] [CrossRef]
  35. Octura, J.E.; Gadiaware, P.; Octura, E. Estimating Evapotranspiration and Crop Coefficient of Vegetable Crops Using Pot Micro-Lysimeters. Philipp J. Sci. 2020, 149, 1107–1118. [Google Scholar] [CrossRef]
  36. Hillel, D. Salinity; Management. In Encyclopedia of Soils in the Environment; Hillel, D., Hatfield, J.H., Powlson, D.S., Rosenzweig, C., Scow, K.M., Singer, M.J., Sparks, D.L., Eds.; Academic Press: New York, NY, USA, 2005; Volume 3, pp. 435–442. [Google Scholar]
  37. Nana, J.B.; Abd El Baki, H.M.; Fujimaki, H. Determining Drought and Salinity Stress Response Function for Garlic. Soil Syst. 2024, 8, 59. [Google Scholar] [CrossRef]
  38. Fujimaki, H. SimpleDigitizer Software; Version 3.2; Arid Land Research Center: Tottori, Japan, 2011; Available online: https://www.alrc.tottori-u.ac.jp/fujimaki/ (accessed on 1 September 2023).
  39. Newman, E. A Method of Estimating the Total Length of Root in a Sample. J. Appl. Ecol. 1996, 3, 139. [Google Scholar] [CrossRef]
  40. Ben Ali, A.R.; Shukla, M.K.; Marsalis, M.; Khan, N. Irrigation with Desalinated and Raw Produced Waters: Effects on Soil Properties, and Germination and Growth of Five Forages. Agric. Water Manag. 2022, 274, 107966. [Google Scholar] [CrossRef]
  41. Goet, G.; Sonkar, I.; Kumar, S.; Prasad, K.S.H.; Ojha, C.S.P. Effect of Salinity on Crop Growth and Soil Moisture Dynamics: A Study with Root Water Uptake Model. J. Hazard. Toxic Radioact. Waste 2024, 28, 04024009. [Google Scholar] [CrossRef]
  42. Mahdavi, S.M.; Fujimaki, H. Soil Salinity Resistance Effect on Evaporation. Eurasian Soil Sci. 2019, 52, 526–534. [Google Scholar] [CrossRef]
  43. Li, X.; Shi, F. Effects of Evolving Salt Precipitation on the Evaporation and Temperature of Sandy Soil with a Fixed Groundwater Table. Vadose Zone J. 2021, 20, e20122. [Google Scholar] [CrossRef]
  44. Burkhardt, A.; Gawde, A.; Cantrell, C.L.; Baxter, H.L.; Joyce, B.L.; Stewart, C.N.; Zheljazkov, V.D. Effects of Produced Water on Soil Characteristics, Plant Biomass, and Secondary Metabolites. J. Environ. Qual. 2015, 44, 1938–1947. [Google Scholar] [CrossRef]
  45. Pan, J.; Li, Z.; Dai, S.; Ding, H.; Wang, Q.; Li, X.; Ding, G.; Wang, P.; Guan, Y.; Liu, W. Integrative analyses of transcriptomics and metabolomics upon seed germination of foxtail millet in response to salinity. Sci. Rep. 2020, 10, 13660. [Google Scholar]
  46. Alkharabsheh, H.M.; Seleiman, M.F.; Hewedy, O.A.; Battaglia, M.L.; Jalal, R.S.; Alhammad, B.A.; Schillaci, C.; Ali, N.; Al-Doss, A. Field Crop Responses and Management Strategies to Mitigate Soil Salinity in Modern Agriculture: A Review. Agronomy 2021, 11, 2299. [Google Scholar] [CrossRef]
  47. Atak, M.; Kaya, M.D.; Kaya, G.; Çikili, Y.; Çiftçi, C.Y. Effects of NACL on the Germination, Seedling Growth and Water Uptake of Triticale. Turk. J. Agric. For. 2006, 30, 39–47. [Google Scholar]
  48. Alagoz, S.M.; Hadi, H.; Toorchi, M.; Pawłowski, T.A.; Shishavan, M.T. Effects of Water Deficiency at Different Phenological Stages on Oxidative Defense, Ionic Content, and Yield of Triticale (× Triticosecale Wittmack) Irrigated with Saline Water. J. Soil Sci. Plant Nutr. 2021, 22, 99–111. [Google Scholar] [CrossRef]
  49. Rasouli, F.; Yun, P.; Kiani-Pouya, A.; Movahedi, A.; Rasouli, M.; Salehi, M.; Shabala, S. One Size Does Not Fit All: Different Strategies Employed by Triticale and Barley Plants to Deal with Soil Salinity. Environ. Exp. Bot. 2024, 218, 105585. [Google Scholar] [CrossRef]
  50. Akgün, İ.; Kara, B.; Altindal, D. Effect of Salinity (NaCl) on Germination, Seedling Growth and Nutrient Uptake of Different Triticale Genotypes. Turk. J. Field Crops 2011, 16, 225–232. Available online: https://www.field-crops.org/assets/pdf/product51338591945e6.pdf (accessed on 1 January 2025).
  51. Miao, L.; Wang, X.; Yu, C.; Ye, C.; Yan, Y.; Wang, H. What Factors Control Plant Height? J. Integr. Agric. 2024, 23, 1803–1824. [Google Scholar] [CrossRef]
  52. Kumar, S.; Li, G.; Yang, J.; Huang, X.; Ji, Q.; Liu, Z.; Ke, W.; Hou, H. Effect of Salt Stress on Growth, Physiological Parameters, and Ionic Concentration of Water Dropwort (Oenanthe javanica) Cultivars. Front. Plant Sci. 2021, 12, 660409. [Google Scholar] [CrossRef]
  53. Ullah, A.; Bano, A.; Khan, N. Climate Change and Salinity Effects on Crops and Chemical Communication Between Plants and Plant Growth-Promoting Microorganisms Under Stress. Front. Sustain Food Syst. 2021, 5, 618092. [Google Scholar] [CrossRef]
  54. Bernstein, N.; Kafkafi, U. Root Growth Under Salinity Stress; CRC Press: Boca Raton, FL, USA, 2002; pp. 787–805. [Google Scholar]
  55. Jackson, R.B.; Sperry, J.S.; Dawson, T.E. Root Water Uptake and Transport: Using Physiological Processes in Global Predictions. Trends Plant Sci. 2000, 5, 482–488. [Google Scholar] [CrossRef]
  56. Karim, M.A.; Nawata, E.; Shigenaga, S. Effects of Salinity and Water Stress on the Growth, Yield and Physiological Characteristics in Hexaploid Triticale. Nettai Nogyo/Nettai Nougyou 1993, 37, 46–52. [Google Scholar] [CrossRef]
  57. Rzążewska, E.; Gąsiorowska, B. Yield components of spring triticale as affected by cultivar and multi-nutrient fertiliser type and rate. Folia Pomeranae Univ. Technol. Stetin. Agric. Aliment. Piscaria Zootech. 2023, 369, 52–63. [Google Scholar] [CrossRef]
  58. Blum, A. The Abiotic Stress Response and Adaptation of Triticale-A Review. Cereal. Res. Commun. 2014, 42, 359–375. [Google Scholar] [CrossRef]
  59. Furman, B.J. Triticale: Overview. In Encyclopedia of Food Grains; Wrigley, C.W., Corke, H., Seetharaman, K., Faubion, J., Eds.; Elsevier: Amsterdam, The Netherlands, 2016; Volume 1, pp. 168–172. [Google Scholar]
Figure 1. Schematic diagram of experimental design.
Soilsystems 09 00028 g001
Figure 2. Soil hydraulic properties of Tottori’s sand, Tottori, Japan.
Soilsystems 09 00028 g002
Figure 3. Meteorological data observed inside the glasshouse throughout the growing season.
Soilsystems 09 00028 g003
Figure 4. The dynamic changes in VWC and solute concentration under different irrigation water qualities: (a) freshwater, (b) 50 mM NaCl, and (c) 150 mM NaCl.
Soilsystems 09 00028 g004
Figure 5. Impact of saline irrigation on crop water use: (a) cumulative irrigation; (b) fluctuation of daily actual crop water demand, transpiration, and E T 0 .
Soilsystems 09 00028 g005
Figure 6. Development of soil salinity at (a) soil surface, (b) 5 cm, and (c) 10 cm below the dripper for different irrigation water quality (freshwater, 50 mM NaCl, and 150 mM NaCl).
Soilsystems 09 00028 g006
Figure 7. Dynamic changes of VWC (a) and solute concentration (b) measured by TEROS 12 sensors at 10 cm for 50 mM and 150 mM NaCl H2O.
Soilsystems 09 00028 g007
Figure 8. Two-dimensional distribution of soil EC at harvest: (a) freshwater, (b) 50 mM NaCl, and (c) 150 mM NaCl.
Soilsystems 09 00028 g008
Figure 9. Two-dimensional distribution of Na+ ions at harvest: (a) freshwater, (b) 50 mM NaCl, and (c) 150 mM NaCl.
Soilsystems 09 00028 g009
Figure 10. Two-dimensional distribution of NO3 ions at harvest: (a) freshwater, (b) 50 mM NaCl, and (c) 150 mM NaCl.
Soilsystems 09 00028 g010
Figure 11. Impact of different water quality on growth parameters of triticale: (a) plant height, (b) LAI, (c) number of leaves, and (d) number of tillers. The error bars with the same lowercase letter(s) are not significantly different at a 5% level of probability, according to the LSD test.
Soilsystems 09 00028 g011
Figure 12. Spatial distribution of NRLD in two-dimensions at harvest: (a) freshwater, (b) 50 mM NaCl, and (c) 150 mM NaCl.
Soilsystems 09 00028 g012
Figure 13. Comparison of grain yield, total applied irrigation, and crop water productivity among the experimental treatments (freshwater, 50 mM NaCl, and 150 mM NaCl). The error bars with the same lowercase letter(s) are not significantly different at a 5% level of probability, according to the LSD test.
Soilsystems 09 00028 g013
Table 1. The effect of different irrigation water quality on yield components of triticale.
Yield AttributeUnitTreatments
Freshwater50 mM NaCl150 mM NaCl
Plant heightcm109 ± 1.9 a83 ± 2.3 b59 ± 9.3 c
Num. tillers-47 ± 5 a14 ± 1 b2 ± 0 c
Number of spikes-14 ± 2 a6 ± 0 b1 ± 0 c
Spike lengthcm15.9 ± 0.5 a14.8 ± 0.4 a9.5 ± 0.4 b
Spike widthcm1.1 ± 0.1 a0.9 ± 0 a0.8 ± 0.3 a
100 grain weightg3 ± 0.3 a2.7 ± 0.1 a1.8 ± 0.1 b
Total fresh biomassg189.8 ± 18.1 a64.6 ± 6.9 b7.3 ± 1.8 c
Total dry biomassg133.3 ± 14.2 a59.1 ± 6.1 b4 ± 0.9 c
The values presented by mean ± standard error followed by the same lowercase letter(s) are not significantly different at a 5% level of probability, according to the LSD test.
Disclaimer/Publisher’s Note: The statements, opinions and data contained in all publications are solely those of the individual author(s) and contributor(s) and not of MDPI and/or the editor(s). MDPI and/or the editor(s) disclaim responsibility for any injury to people or property resulting from any ideas, methods, instructions or products referred to in the content.

