Article

Shifts in Soil Bacterial Communities under Three-Year Fertilization Management and Multiple Cropping Systems

by
Mohammad Yaghoubi Khanghahi
,
Maddalena Curci
,
Eugenio Cazzato
,
Cesare Lasorella
,
Andreina Traversa
,
Carmine Crecchio
and
Matteo Spagnuolo
*
Department of Soil, Plant and Food Sciences, University of Bari Aldo Moro, Via Amendola 165/A, 70126 Bari, Italy
*
Author to whom correspondence should be addressed.
Soil Syst. 2024, 8(1), 5; https://doi.org/10.3390/soilsystems8010005
Submission received: 6 November 2023 / Revised: 24 December 2023 / Accepted: 29 December 2023 / Published: 3 January 2024

Abstract

:
The current study was undertaken to investigate how organic and inorganic fertilizers shape soil bacterial communities and soil nitrogen and carbon status and to find their relationships with plant production. Soils were collected from fields under a three-year application of green manures (vetch (GMV), field bean (GMB), and wheat (GMW)), livestock manure (MF), inorganic mineral fertilizer (IF), and control (no nitrogen fertilization). The plants cultivated during the three years were tomato, watermelon, and pepper, respectively. The findings showed an increase in crop yields under both organic and inorganic fertilizers, in which the effects of leguminous green manures (GMV and GMB) were more pronounced, equal to +65–81% in tomato, +32–40% in watermelon, and +51–57% in pepper. An extensive modification in the bacterial communities was observed under organic fertilization. These changes were associated with a higher ratio of Proteobacteria (a copiotrophic phylum) to Acidobacteria (an oligotrophic phylum) in GMV and GMB, due to higher soil N content compared to IF and control treatments. Therefore, the data indicated an increase in soil N and organic C levels, as well as higher plant production by replacing IF with GMV, GMB, and MF, suggesting a promising movement to preserve the soil ecosystem. Such changes were more pronounced in MF-treated soils, where bacterial diversity improved and the heterogeneity of bacterial communities was preserved.

1. Introduction

The current state of agricultural soil deterioration and land degradation has arisen over recent centuries in the Mediterranean basin because of land conversion and intensive agricultural management practices [1]. Among these practices, extensive application of synthetic agrochemicals (e.g., chemical mineral fertilization) made it crucial to discover alternative approaches that can assure competitive plant production, maintain soil quality, and guarantee environmental safety while preserving the long-term ecological balance in the agro-ecosystem [2]. In this regard, organic inputs, such as green manure and livestock manure, have received considerable attention to be utilized in sustainable agriculture, especially because of their great potential for improving soil nutrients and organic carbon content [3]. This type of fertilizer is considered for its potential to alleviate desertification and soil erosion concerns, mainly through enhancing the physical, chemical, and biological properties of depleted soils by providing organic matter [4].
The availability of nitrogen in soil, as one of the main nutrients involving soil fertility, relies mainly on the processes of immobilization and organic matter mineralization and ranges from 1 to 5% of total nitrogen in soil [5]. The application of organic nitrogen fertilizers is considered a typical farming management strategy to improve nitrogen and organic matter content in the soil [6]. Organic fertilizers are generally divided into two major categories, including animal-based (e.g., fish meal, leather meals, slaughterhouse by-products, and manure) and plant-based (e.g., plant residues and seaweed extracts) fertilizers [4]. Organic nitrogen fertilizers are generally composed of two diverse pools of nitrogen, including inorganic (ammonium and nitrate) and organic forms [7]. The organic nitrogen fraction can be found as recalcitrant and slowly mineralizable components (e.g., polypeptides and heterocyclic N compounds) or immediately available or speedily mineralizable substances by soil microorganisms (e.g., amino acids and small peptides) [4]. Far less attention has been paid to understanding how these organic-based fertilizers impact soils’ biochemical processes, soil quality, and microbial activity. This indicates a need to understand the various perceptions of the application of organic inputs to better contribute to enhancing bacterial abundance and biodiversity, improving soil chemical and biochemical properties, and consequently to the long-term sustainability of agro-ecosystems [8]. Hatfield and Walthall [9] proposed soil biological properties as a vital feature of soil fertility and the basis of a prospective agricultural revolution. It has also been reported that the soil microbial community and activity are affected by the fertilization regime [3,10]. In this regard, Ma et al. [11] believed that it is important to assess the shifting of soil microorganisms when plant production in agroecosystems is the main goal, since plant yield is associated with soil microbial activities and diversity. In the research field, significant changes in bacterial diversity and richness in soils were found when the soil was treated with farmyard manure compared to an inorganic fertilization regime [12,13]. An increase in the abundances of some bacterial phyla (e.g., Proteobacteria and Firmicutes) was also reported in response to organic inputs, suggesting such phyla favor nutrient-rich environments and can degrade complex organic compounds [11,12].
The present research aims to link one of the main parts of the United Nations’ Sustainable Development Goal 15, regarding the halt of land degradation and biodiversity loss, to sustainable plant production. In this regard, much uncertainty still exists about how organic fertilization management can conserve and sustainably use soil biodiversity in agroecosystems while improving plant production. To achieve this aim, the current study aims to investigate the changes in soil bacterial communities in an agroecosystem through an examination of the potential of different green and livestock manure fertilization plans for preserving soil biodiversity. These changes were specifically compared to conventional fertility management with chemical nitrogen fertilizer. The attempts were also made to provide more details on how different plant production and soil carbon and nitrogen status during a three-year experiment can be affected by organic nitrogen fertilizers. It was hypothesized that the soil bacterial community structure and the yield components of three different crop plants can be significantly affected in response to different organic nitrogen fertilization management strategies as compared to plants treated with inorganic fertilizers.

2. Materials and Methods

2.1. Experimental Setup

The three-year field experiment was carried out in the semiarid Mediterranean basin at Noicattaro (Puglia region—Southern Italy, located at 41°02′ N, 16°59′ E, at an altitude of 100 m above sea level; hot and dry summers; cold and windy winters; and an average of long-term annual rainfall and temperature equal to 689 mm and 16.1 °C, respectively). The soil’s physicochemical characteristics are given in Table 1.
The research was based on a randomized block design with three replicates and six different soil fertilization managements, including green manure vetch (GMV), green manure field bean (GMB), inorganic fertilization (IF), green manure wheat (GMW), livestock manure fertilization (MF), and control treatment (without nitrogen fertilization). The details of fertilization treatments and crop cultivation are presented in Table 2.
Each plot area was 35 m2 (5 m × 7 m), and a micro-flow irrigation system was used for all crops. The number of days from planting green manure to turning it back to the soil were 167, 183, and 173 in the first, second, and third years, respectively. The growing season for the crops from transplanting to harvest was 89, 96, and 140 days with a plant density of 3.1, 0.8, and 2.5 plant m−2 for tomato, watermelon, and pepper, respectively (Supplementary Table S1). Crop yield, fruit weight, and the number of fruits per plant were determined. Prevention, detection, and control of pests, weeds, and diseases were carried out with an integrated pest management strategy.

2.2. Soil Sampling and Measuring

Eighteen soil samples, each made by mixing five sub-samples, were collected randomly by hand auger from the soil depth of 0–20 cm from all experimental plots after pepper harvesting in the third year of the experiment. The carbon and nitrogen contents were determined with a soil TOC® cube analyzer (Elementar Italia s.r.l., Lomazzo, Italy), previously calibrated by a soil standard Ah (C: 7.44 ± 0.10 g kg−1; H: 1.10 ± 0.02 g kg−1; N: 0.43 ± 0.02 g kg−1; S: 0.049 ± 0.005 g kg−1). C and N concentrations were determined on triplicate samples by weighing about 100–150 mg of soil; the C:N ratio was calculated as TOC:N.
Soil samples were stored at 4 °C until DNA extraction from 0.5 g of soil using the FastDNATM Spin Kit (MP BiomedicalsTM). DNA quality and concentration were verified using the NanoDrop spectrophotometer (ND-1000, EuroClone, Pero, Italy). The DNA samples were concentrated up to 20 ng μL−1 and stored at −20 °C prior to the sequencing procedure. Universal primers: 341F (5′-CCTACGGGNBGCASCAG-3′) and 805R (5′-GACTACNVGGGTATCTAATCC-3′) for V3-V4 hypervariable regions of the 16S rRNA were used for PCR and sequencing procedures by the IGA Technology service (Udine, Italy, https://igatechnology.com/, accessed on 1 September 2023) using an Illumina MiSeq next-generation sequencer (Illumina, San Diego, CA, USA) with 300 bp paired-end mode.
Raw reads produced by Illumina sequencing were imported into Microbial Ecology 2 software (QIIME2 2022.2 distribution, https://qiime2.org/, accessed on 22 September 2023). Forward and reverse reads were uploaded as FASTQ files, and quality-filtered, denoised, and paired-end reads were merged using the DADA2 pipeline, which includes the removal of chimeric reads. Further analyses were performed by Qiime2 at a sampling depth of 26,602 sequences per sample to normalize all samples to the size of the less abundant.
Alpha diversity analyses were carried out on ASVs (amplicons sequence variants) data using the script “qiime diversity group significance” to test different alpha diversity metrics (observed ASVs, Faith’s Phylogenetic Diversity, Shannon diversity index, and Pielou’s evenness index). Beta diversity was analyzed by “beta-group-significance” scripts using a weighted and unweighted UniFrac distance matrix to compare diversity in the community composition between treatments.
Taxonomic classification against the SILVA database (https://www.arb-silva.de/, accessed on 5 October 2023) was carried out by the Naïve Bayesian classifier using the script “qiime feature-classifier classify-sklearn”. The α-diversity statistical analysis was performed in Qiime2 using the Kruskal–Wallis test. The β-diversity statistical analysis was conducted in Qiime2 using the PERMANOVA test with 999 permutations and visualized by a three-dimensional PCoA plot. Canonical Correspondence Analysis (CCA) was performed using the Past 4.12 software (https://past.en.lo4d.com/windows, accessed on 11 October 2023) to relate the bacterial community composition at the phylum level to soil C and N content.
Other statistical analyses, including a one-way analysis of variance (ANOVA), Tukey’s HSD (honestly significant difference) test, Ward’s clustering algorithm, as well as drawing the graphs, were performed using R (ver. 3.5.1) and SigmaPlot (SigmaPlot® v11.0, Systat Software Inc., London, UK).

3. Results

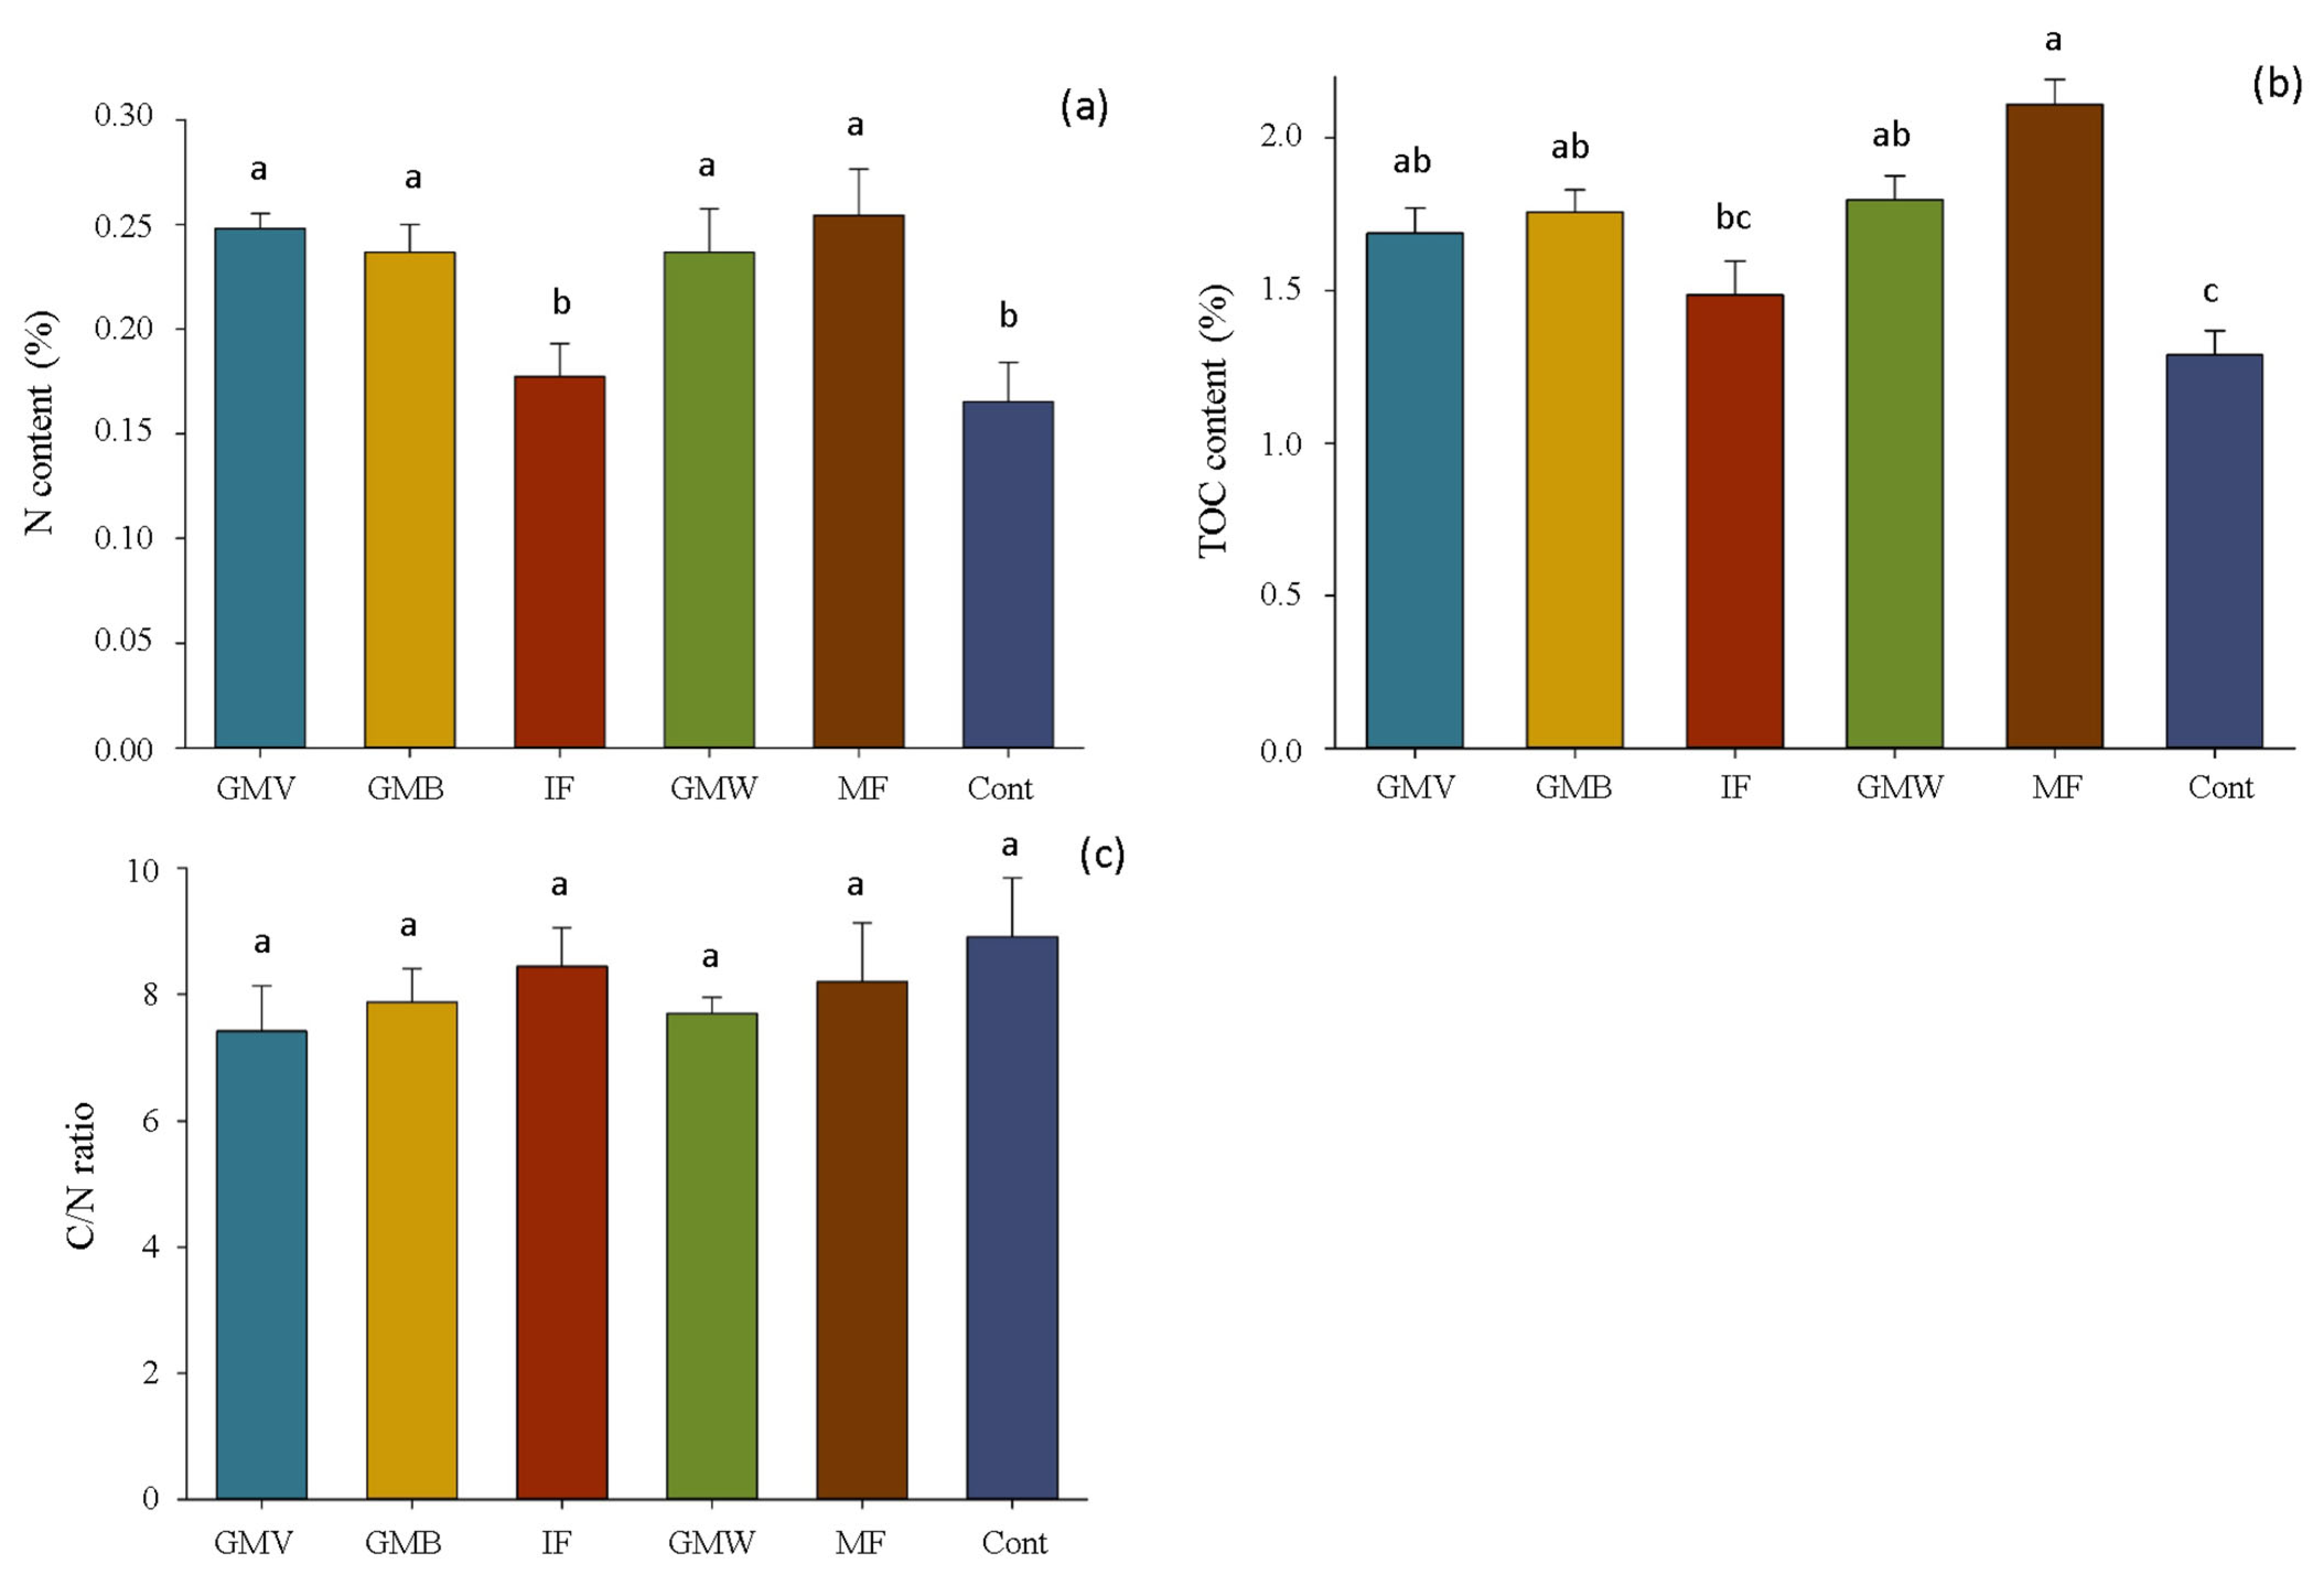
3.1. Soil Carbon and Nitrogen Content

The analysis of soil nitrogen and carbon status after three years of cultivation is given in Figure 1. Accordingly, three years of soil management with MF, GMV, GMW, and GMB resulted in higher N content, which was significantly (p < 0.05) higher than that in IF (+43%, +40%, +35%, and +33%, respectively) and control (+74%, +69%, +64%, and +62%, respectively) treatments (Figure 1a). Similarly, the organic inputs significantly (p < 0.05) improved the level of soil organic C compared to the control treatment, so that the organic C in soils treated with MF, GMW, GMB, and GMV was +55%, +37%, +36%, and +31% higher than control soil (Figure 1b). Nevertheless, such changes in soil N and organic C contents did not lead to a shift in the C/N ratio in treated soils compared to the control soil and, accordingly, were placed in the same statistical group (p > 0.05) (Figure 1c).
Dry biomass and nitrogen supplied by green manure and livestock manure were measured during the three-year experiment (Table 3). Accordingly, leguminous (GMV and GMB) green manure showed a higher efficiency in supplying nitrogen for the crops during the experiment, as shown by greater dry biomass and nitrogen content. It was followed by livestock manure and wheat green manure with a range of nitrogen content from 1.34% to 1.54% and supplied nitrogen in the soil from 50 kg ha−1 to 122 kg ha−1 over the three-year experiment (Table 3).

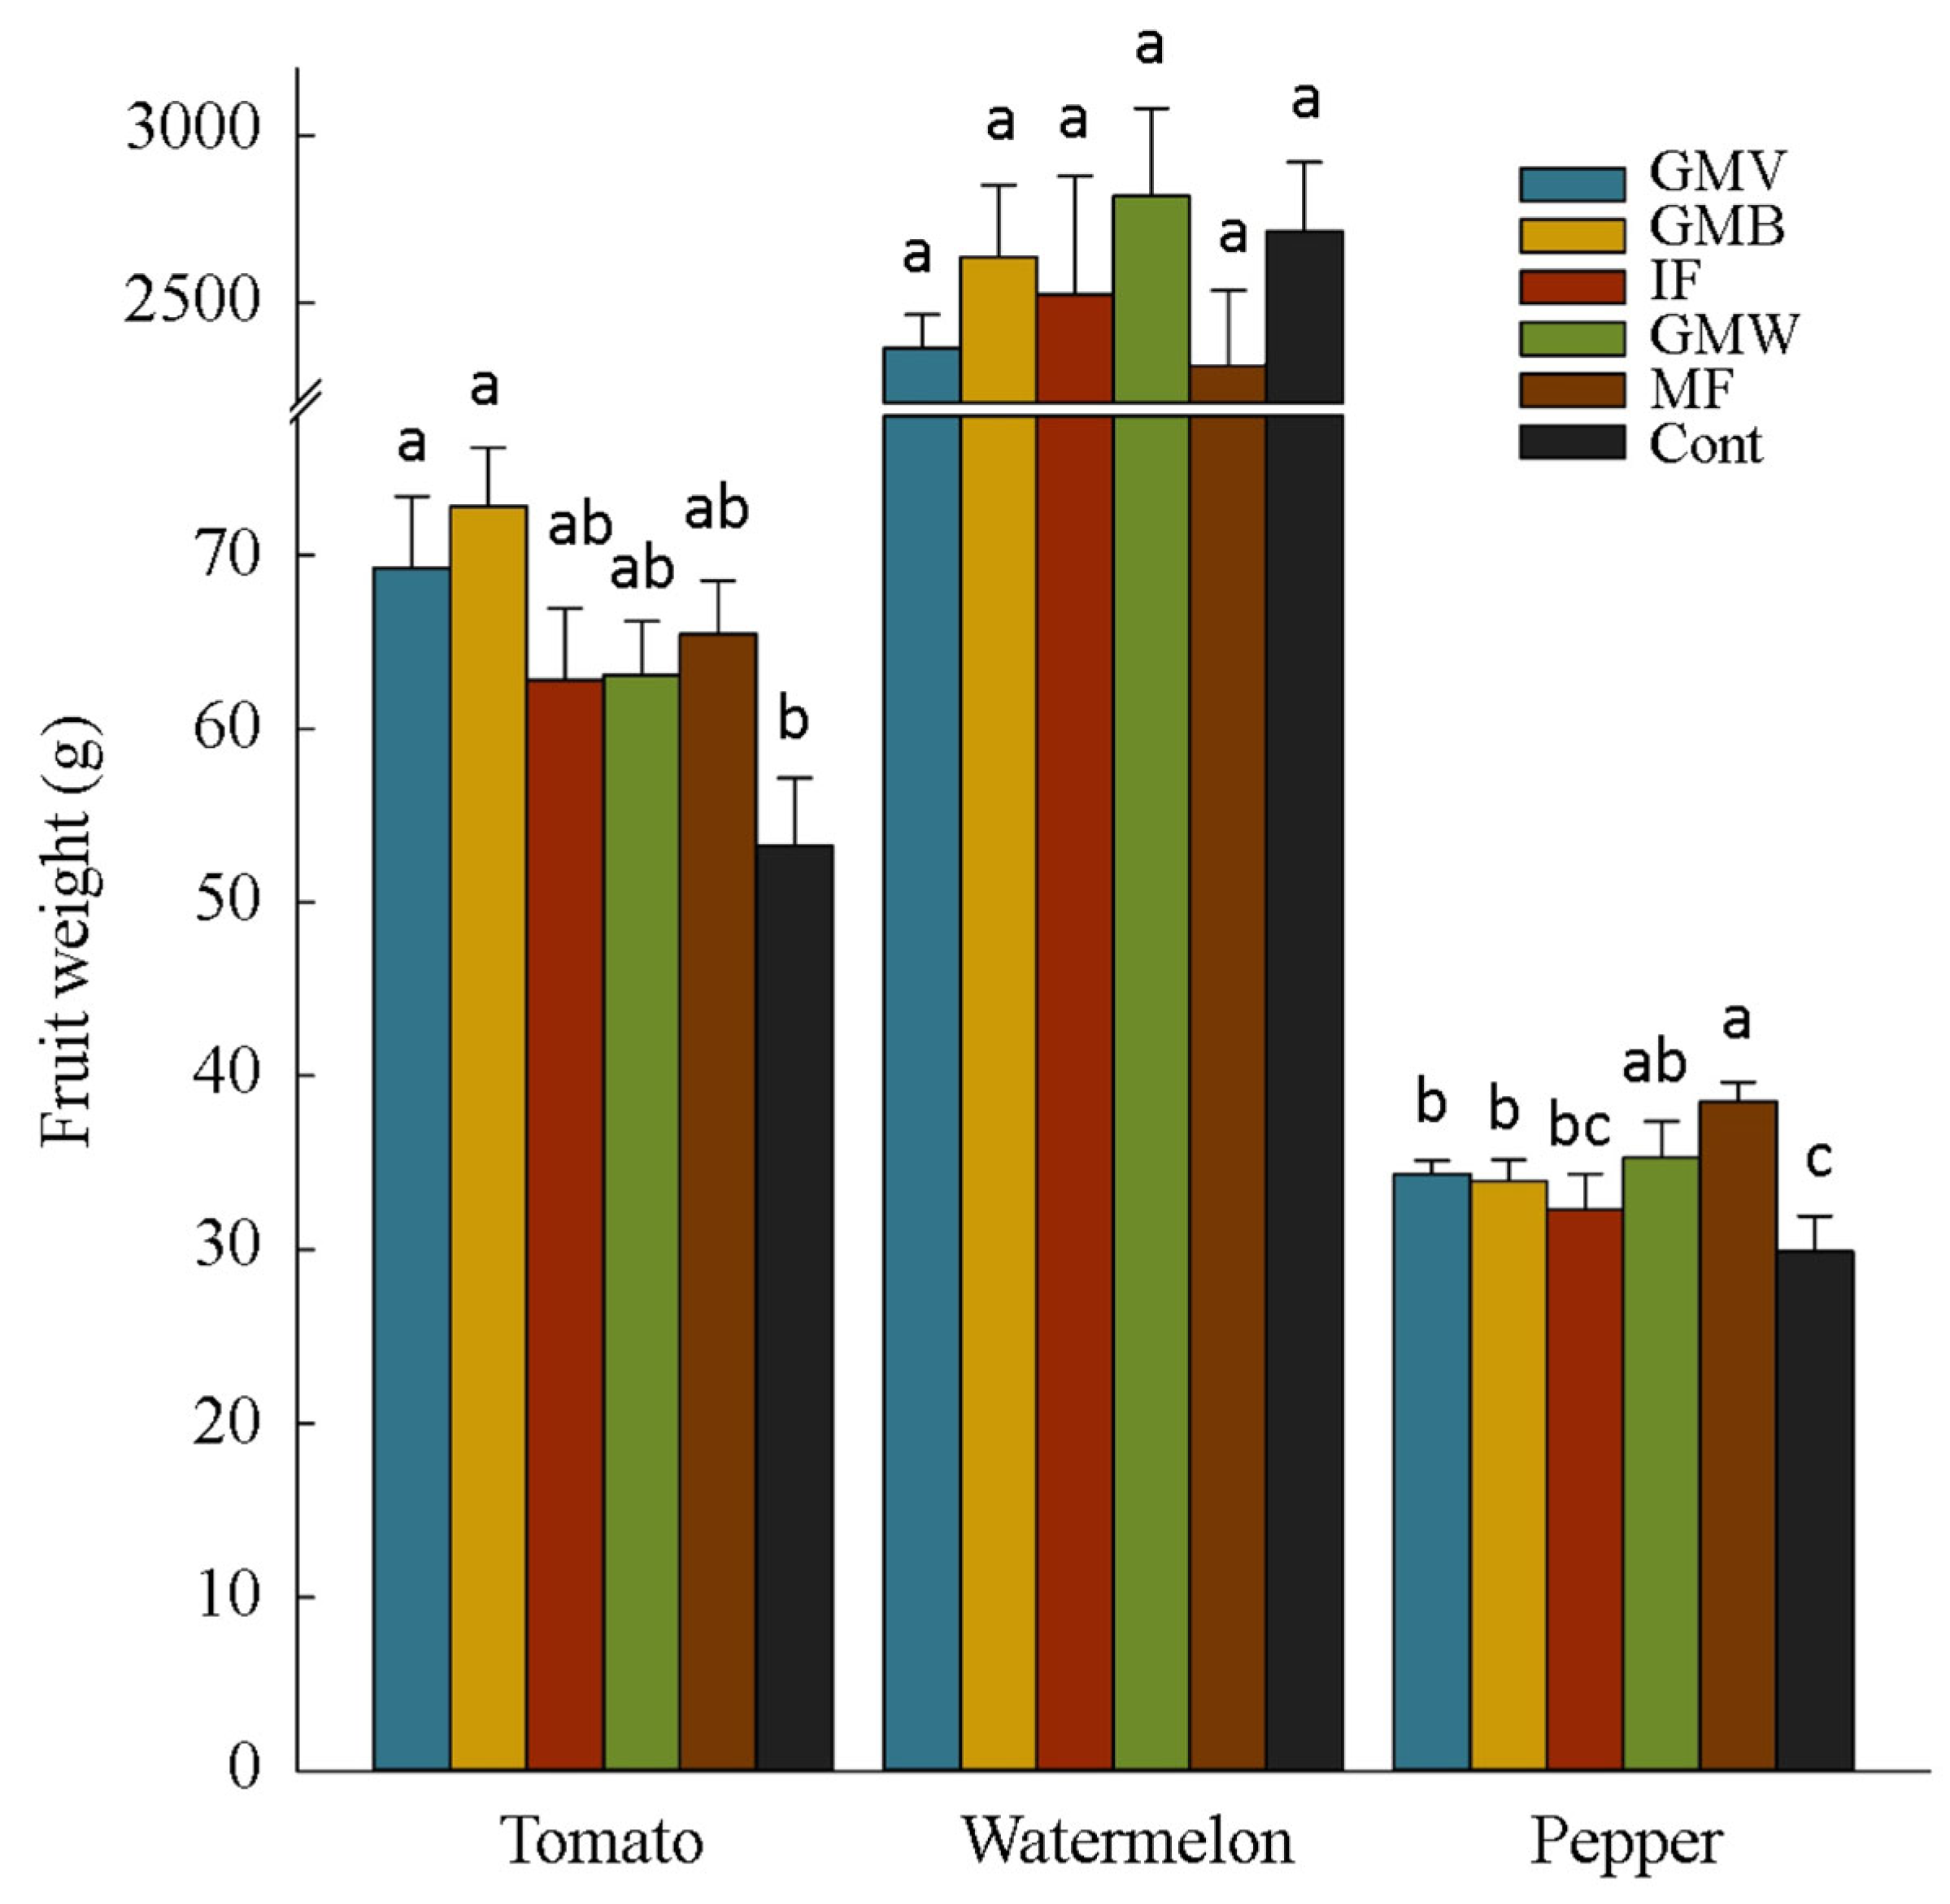
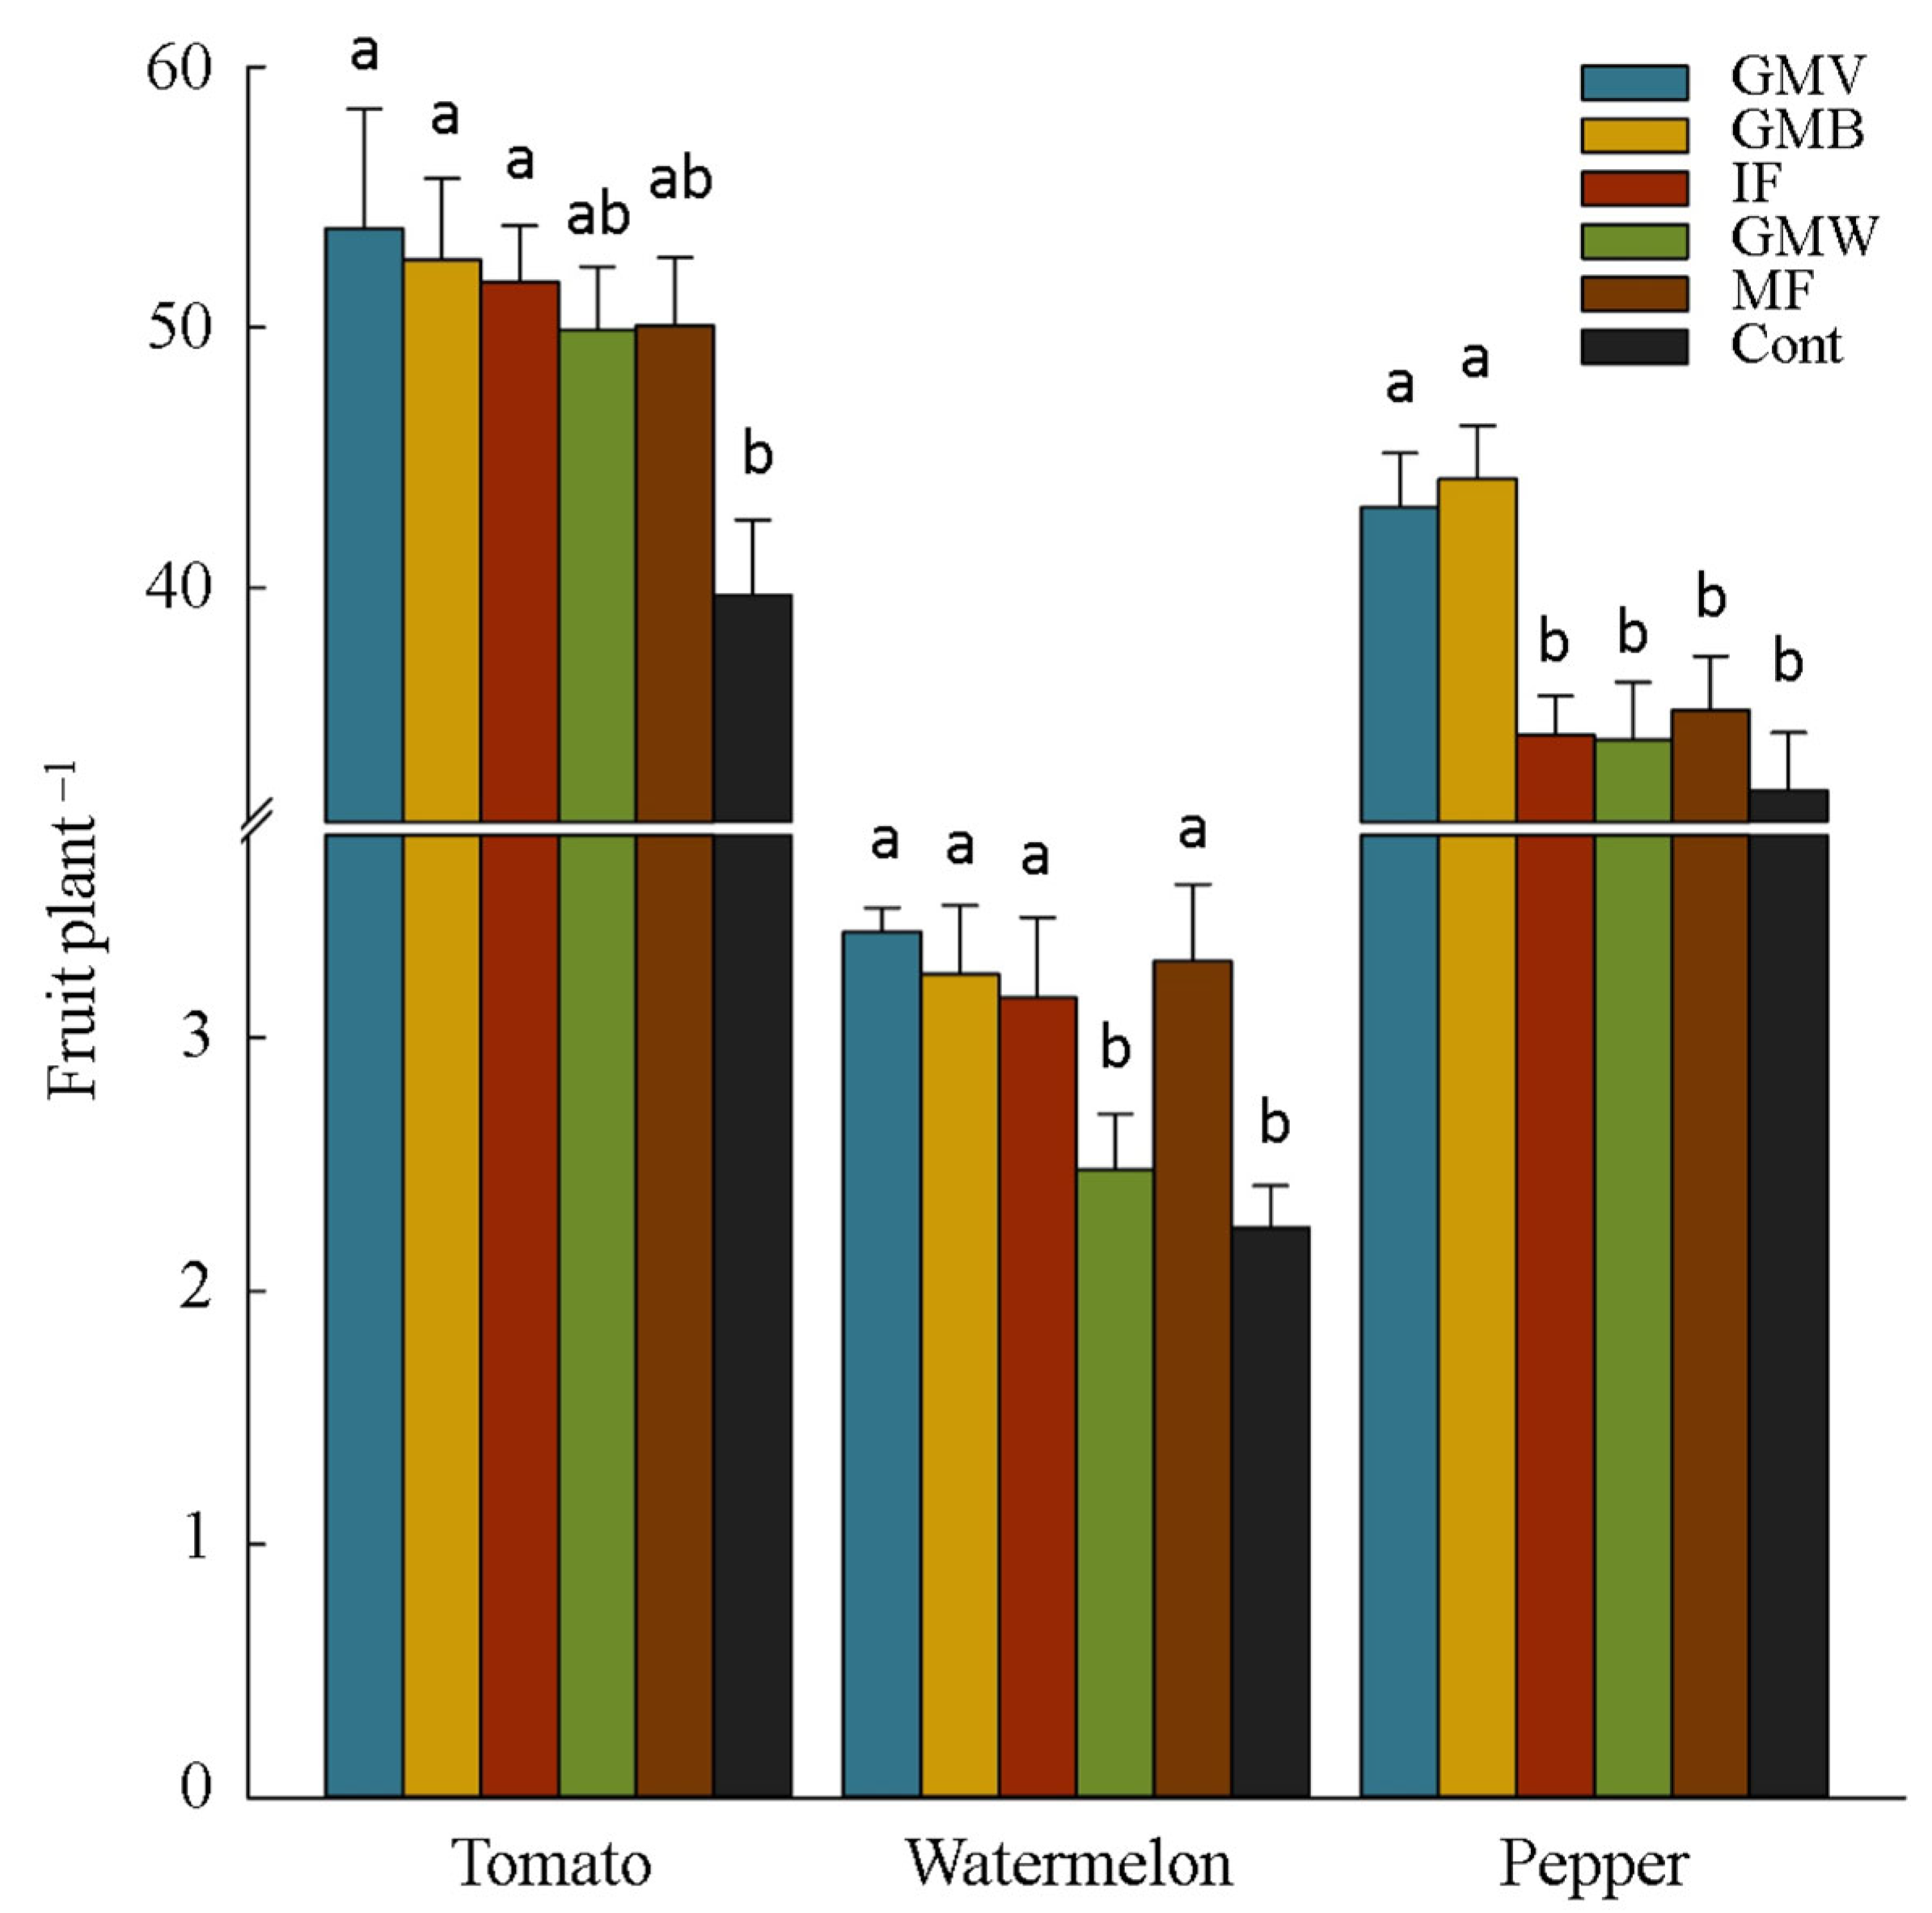
3.2. Plants Yield and Yield Components

To explore the effects of fertilization regimes on the crops, we focused on yield and yield components of tomato, watermelon, and pepper during the three years (Figure 2, Figure 3 and Figure 4). In this regard, the highest yield of tomato in the first year was obtained from the GMB treatments, which was equal to 119.9 t ha−1, which was statistically similar to GMV while significantly (p < 0.05) higher than other treatments. It is also found that all fertilization regimes significantly improved the tomato yield compared to the control, from +48% in GMW to +81% in GMB treatments (Figure 2). Two primary yield parameters of tomatoes, including average fruit weight and fruit number per plant, were also affected by the fertilization treatments. Accordingly, the highest fruit weight was observed in GMB (72.8 g) and GMV (62.3 g) treatments, and the greatest number of fruits were recorded in GMB, GMV, and IF (equal to 53.8, 52.6, and 51.7 per plant, respectively) (Figure 3 and Figure 4).
In the second year, no significant differences were found in watermelon fruits’ weight among the fertilization treatments (Figure 2). Nevertheless, four treatments, including GMV, GMB, IF, and MF, significantly increased the number of fruits per plant compared to those in control (40–52%). Such improvement resulted in higher watermelon yields in the GMV, GMB, IF, and MF treatments, equal to 32%, 40%, 30%, and 25% greater than those plants grown in the control treatment (p < 0.05) (Figure 3 and Figure 4).
In the third year of the experiment, the number of pepper fruits was significantly enhanced in plants treated with GMV (+34%) and GMB (+37%) compared to control plants (Figure 4). The highest pepper fruit weight was recorded in MF-treated plants (38.5 g), followed by GMW (35.3 g), GMV (34.4 g), and GMB (34 g), all significantly greater than control plants (Figure 3). Improvements in pepper yield mirrored such responses of pepper yield components to fertilization management, in which the plant yield under GMB, GMV, MF, and GMW treatment were +57%, +51%, +39%, and +29% higher than that in the control plants (p < 0.05), respectively (Figure 2).

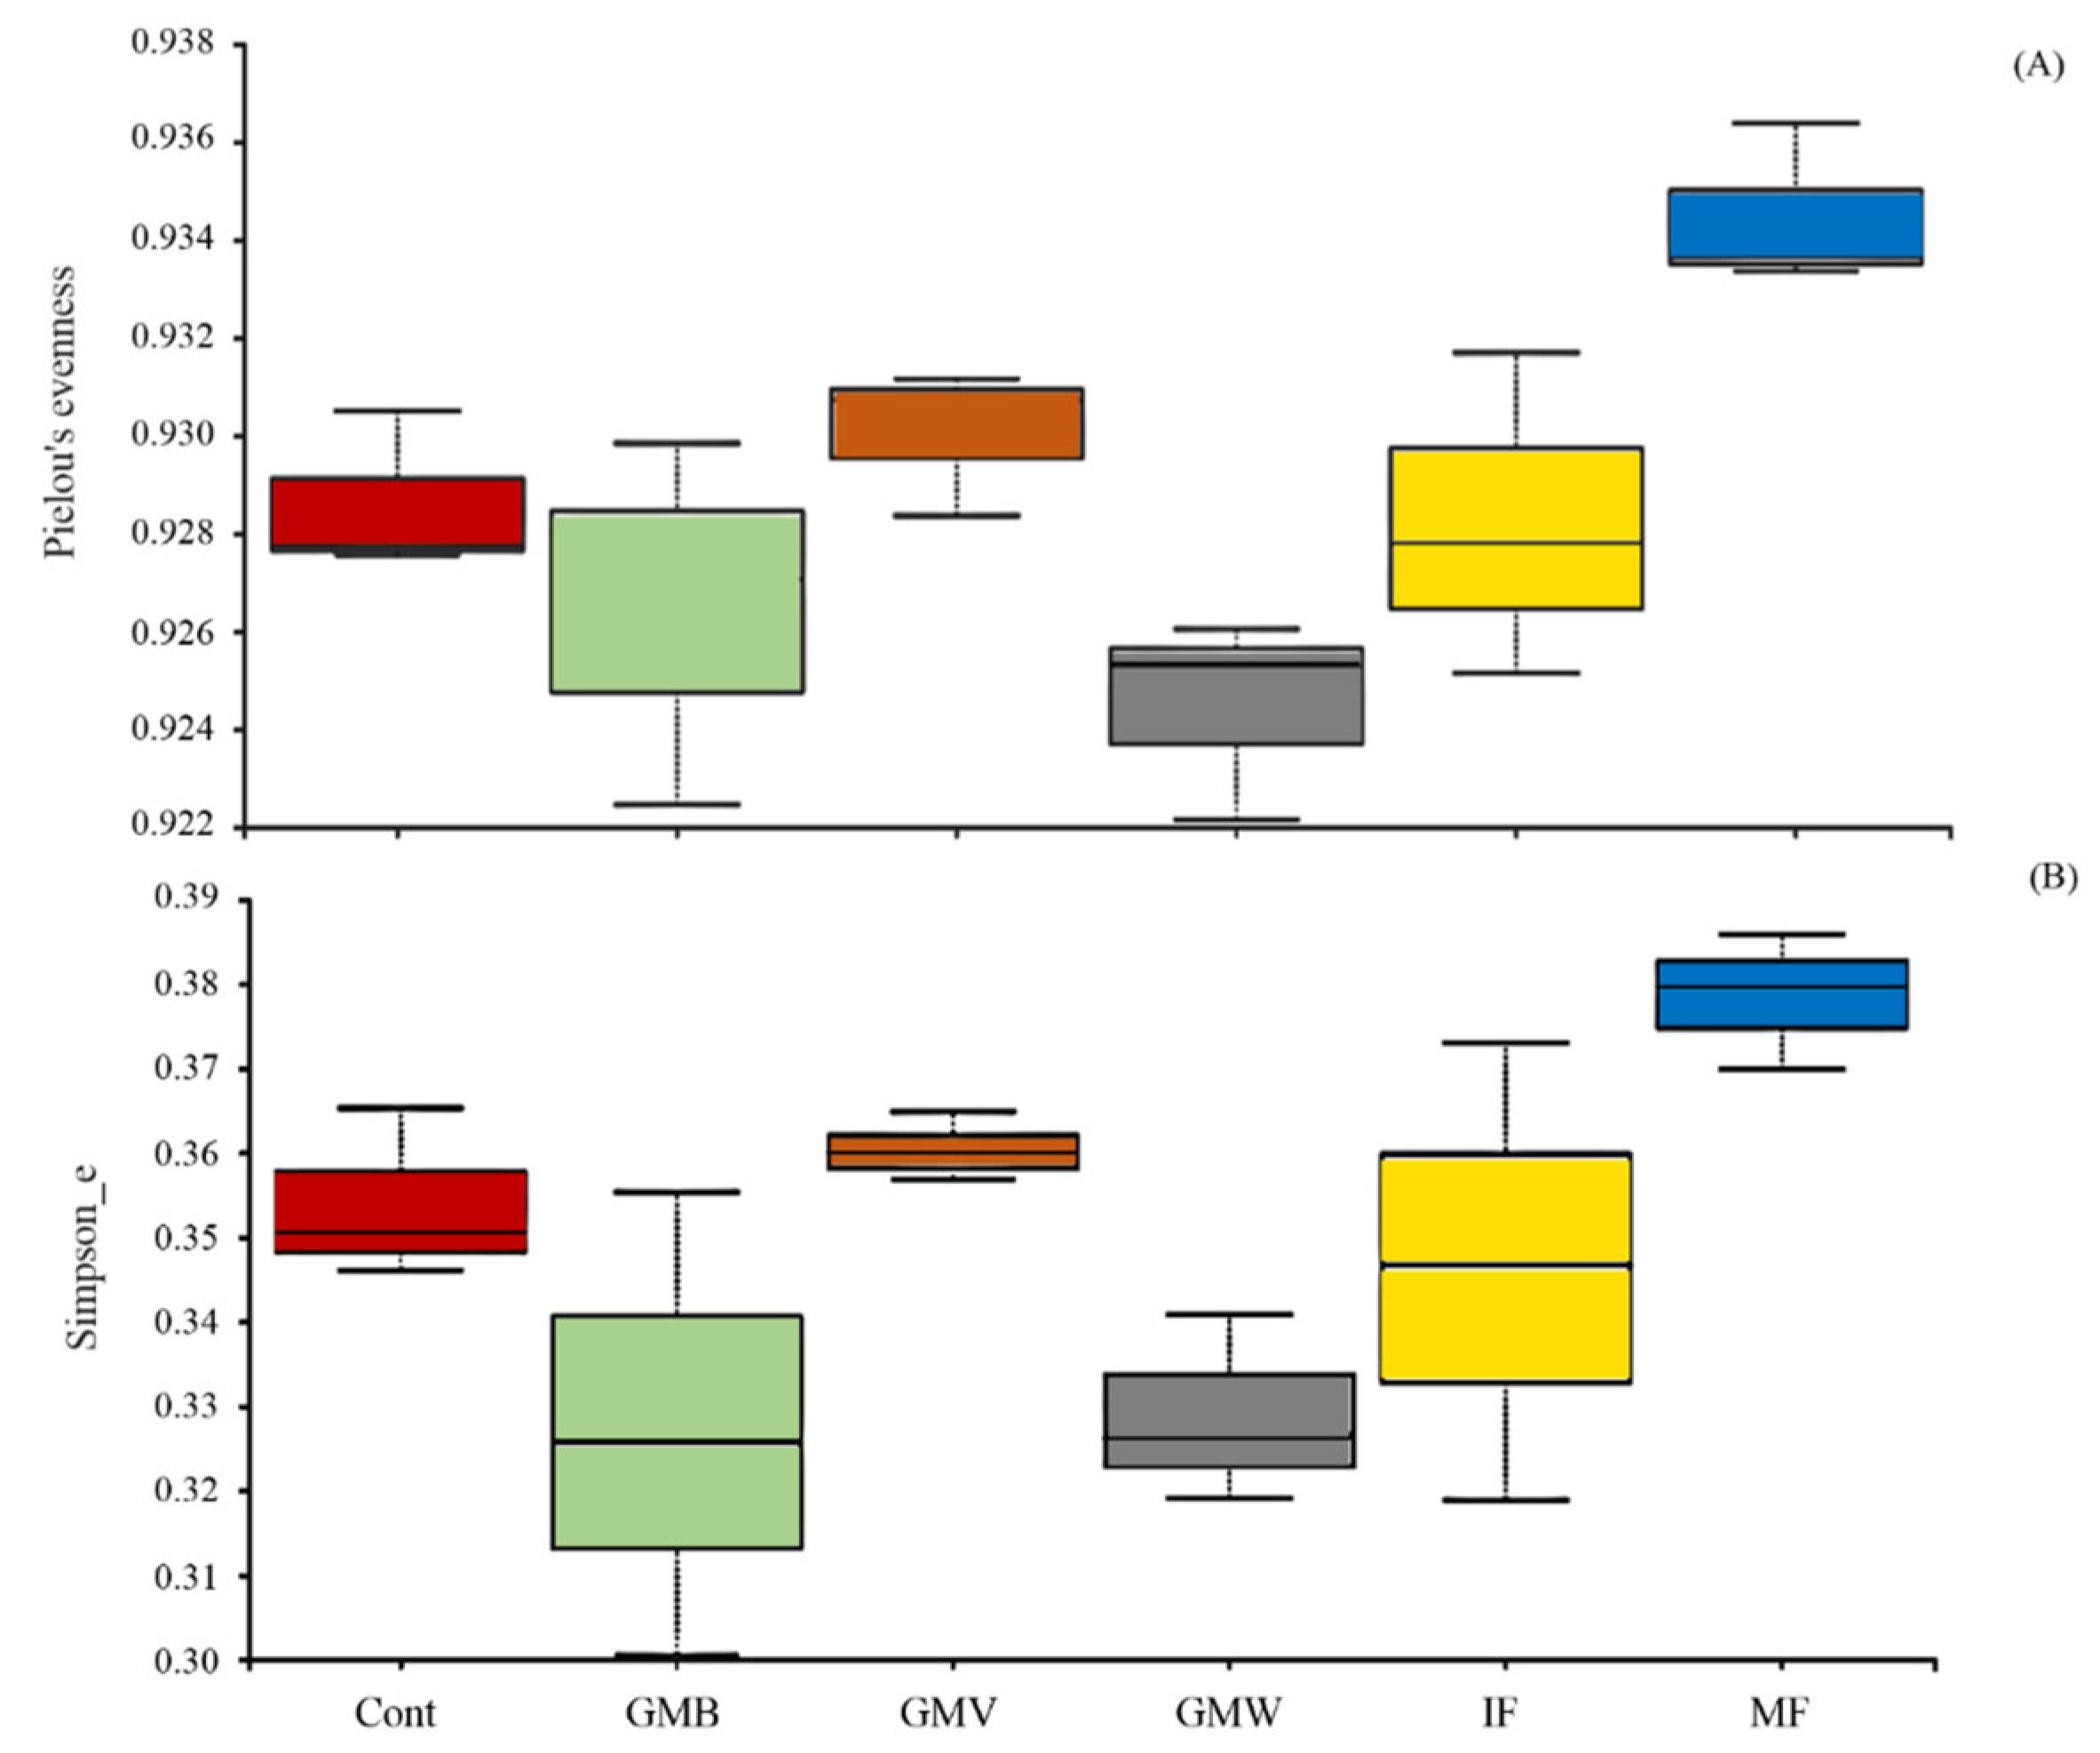
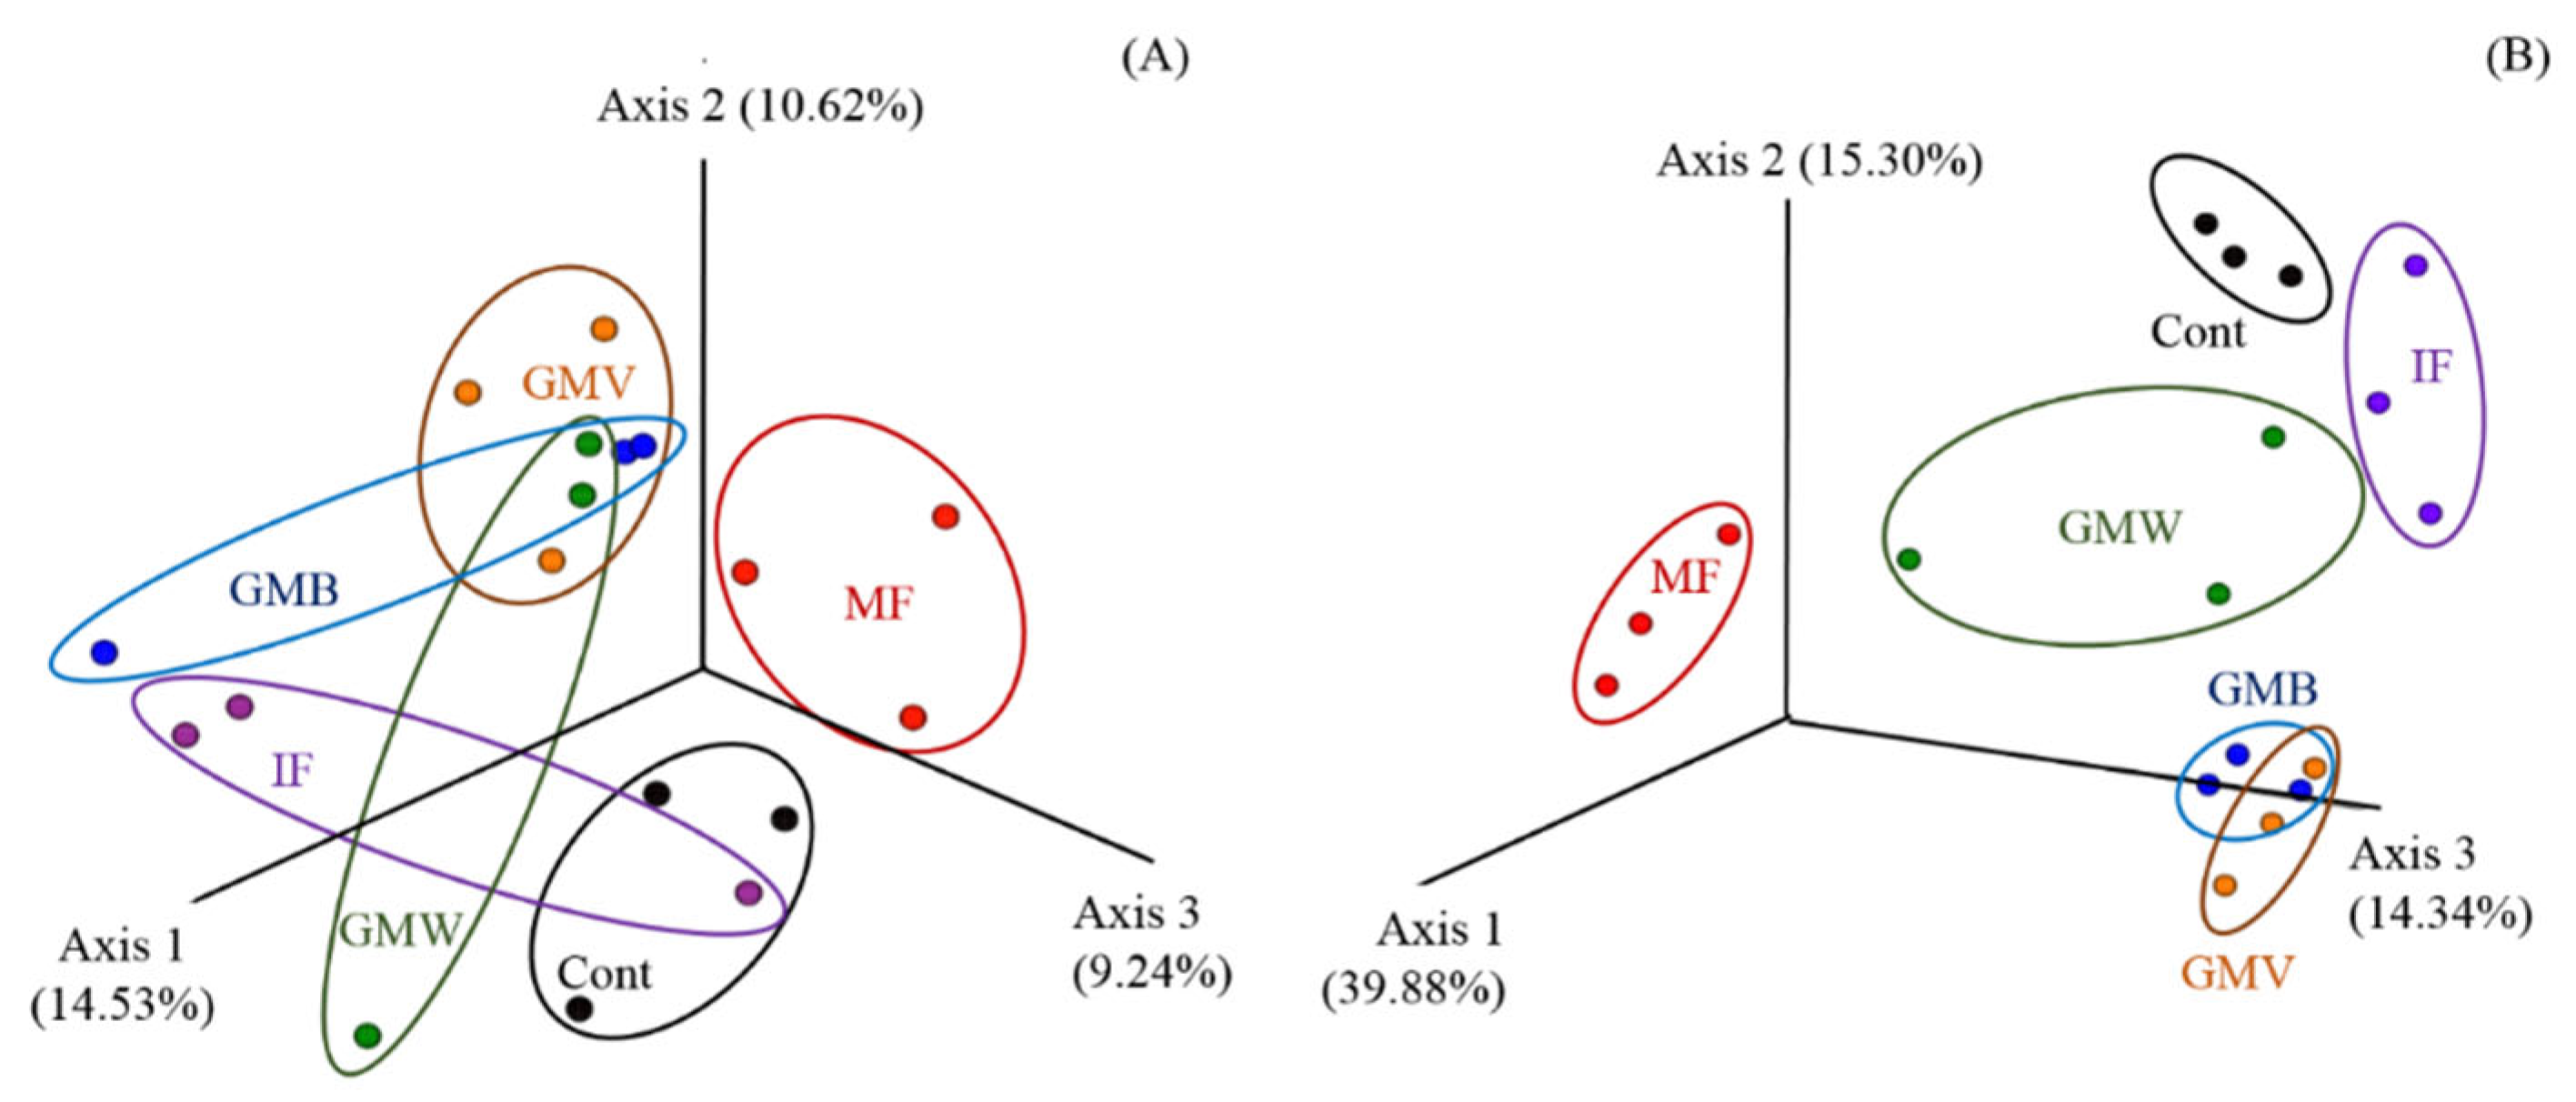
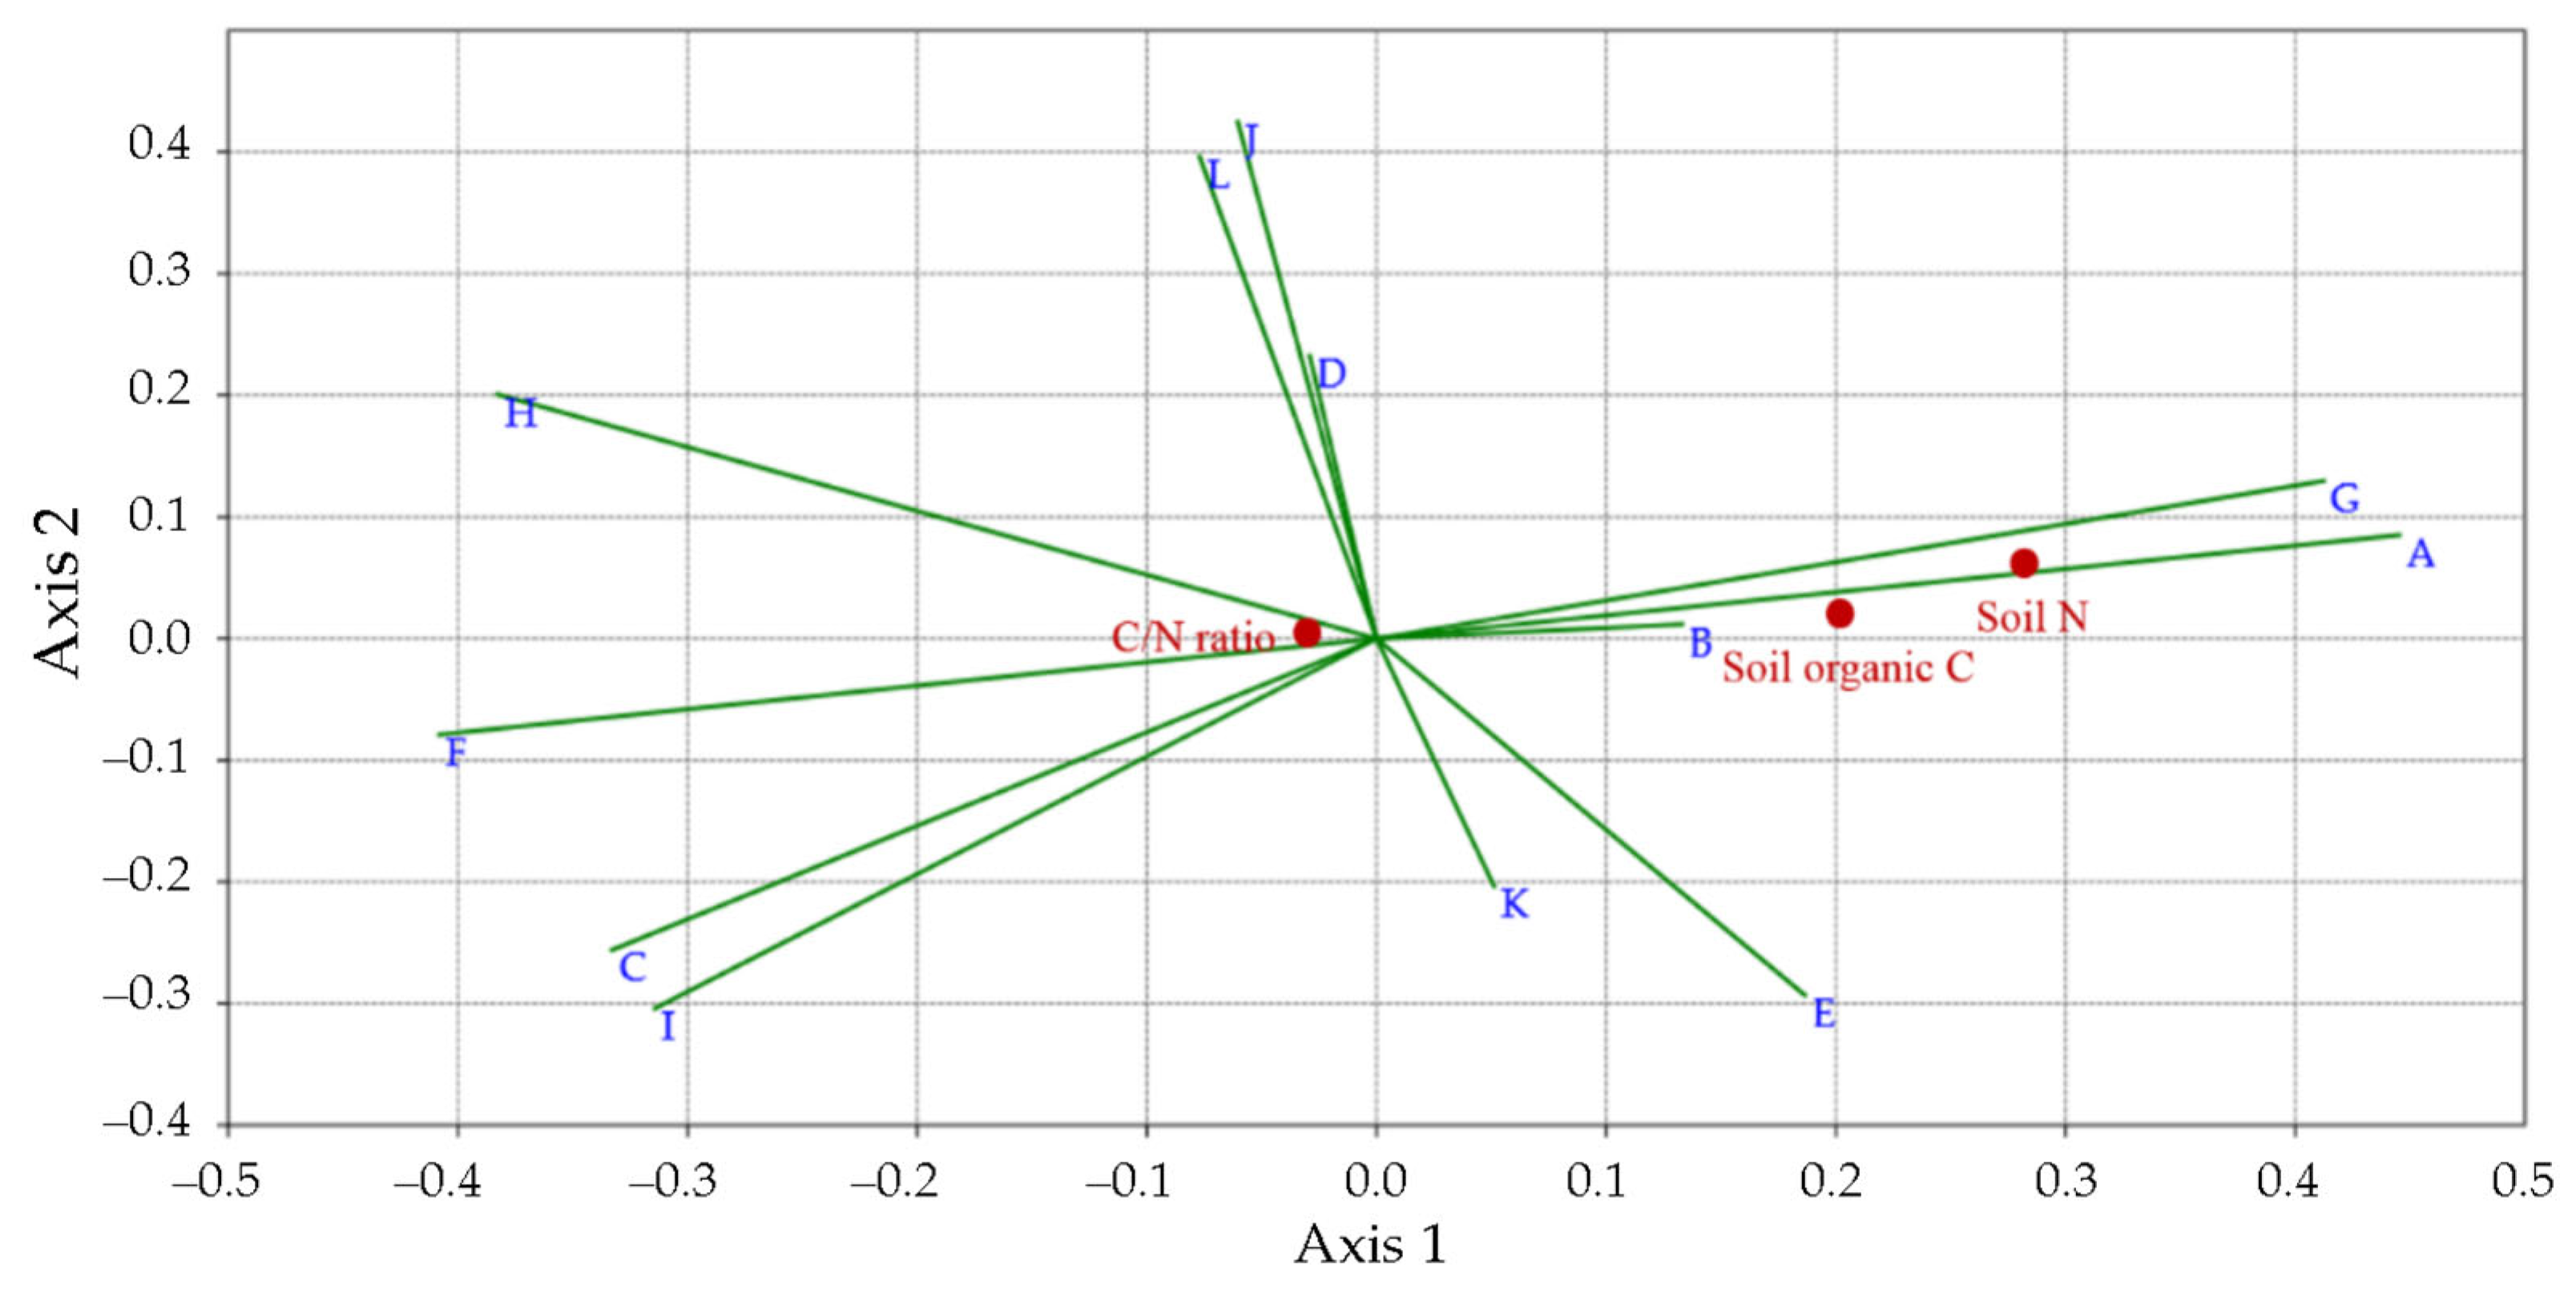
3.3. 16S rDNA Metabarcoding Analysis

The Kruskal–Wallis test showed a significant difference in bacterial communities among the fertilization regimes regarding Pielou’s evenness (p-value = 0.036) and Simpson_e (p-value = 0.049) indices (Figure 5). Accordingly, higher bacterial diversity and richness were observed in soil treated with livestock manure fertilization. Good’s coverage index was high in all treatments (=0.99), revealing a number of sequence reads that were adequate to assess bacterial diversity. The three-dimensional plots of principal coordinate analysis (PCoA) disclosed the visualizing patterns of differences in β-diversity among the bacterial communities in the different treatments according to the weighted UniFrac (Figure 6A) and unweighted UniFrac (Figure 6B) distances. Accordingly, the β-diversity of the bacterial communities was significantly affected by treatments, based on the PERMANOVA method (pseudo-F test; p-value = 0.002), confirming the significant distance among treatments regarding the relative abundance of taxa (Weighted UniFrac) and the presence/absence of taxa (Unweighted UniFrac).
As shown in Table 4, twelve phyla were detected in soil samples with a relative abundance higher than 1%, in which the most abundant phylum was Proteobacteria, ranging from 20.7% (Cont) to 24.2% (GMB), followed by Actinobacteriota (from 19.7% in Cont to 21.7% in IF), and Acidobacteriota (from 9.7% in GMB and GMV to 13.1 in Cont). Although the relative abundances of some phyla, mainly Actinobacteriota, Gemmatimonadota, Verrucomicrobiota, Entotheonellaeota, and Nitrospirota, were not affected by the treatments based on the analysis of Tukey’s HSD test, the abundances of other phyla, namely Proteobacteria, Acidobacteriota, Bacteroidota, Chloroflexi, Firmicutes, Planctomycetota, and Myxococcota, were significantly affected by fertilization regimes (Table 4). The ratio of Proteobacteria to Acidobacteria was significantly higher in GMV and GMB compared to other organic fertilizers (GMW and MF; +16–31%), inorganic fertilizer (+23% and +25%, respectively), and control treatment (+55% and +58%, respectively) (Table 4).
The most abundant families with a relative abundance higher than 1% are presented in Figure 7. Our results show that 293 bacterial families were detected in soil samples. Among these families, Microscillaceae (from 4.3% in Cont to 6.2% in GMW), Rubrobacteriaceae (from 3.6% in GMW to 4.9% in MF), Pirellulaceae (from 2.3% in Cont to 3.7% in GMV), Vicinamibacteraceae (from 3.7% in GMV to 5.2% in MF), Chitinophagaceae (from 2.4% in MF to 5% in GMW), and Bacillaceae (from 2.3% in MF to 6.2% in IF) were the most abundant, which together accounted for about 25% of the bacterial community (Figure 7). Based on Ward’s clustering analysis, expressed as Euclidean distance, the bacterial communities at the family level clustered into several groups, in which IF and control treatments were clearly placed in the same group, with a long distance from other treatments such as MF, GMW, GMB, and GMV (Figure 7).
The relationship between the predominant bacterial phyla (relative abundance ≥ 1%) and soil N and organic C status is presented in Figure 8, based on the canonical correspondence analysis (CCA). Accordingly, a close relationship was found between some phyla, including Proteobacteria, Actinobacteriota, and Planctomycetota, and soil N content. On the other hand, the C/N ratio did not show a strong relationship with bacterial taxa in the soil (Figure 8).

4. Discussion

The objectives of the present study were the assessment of changes in plant production, soil bacterial community, and diversity in response to different fertilization regimes. One of the main parameters affecting the production and soil microbial community is the status of nitrogen and organic carbon in the soil. Accordingly, MF, GMV, GMW, and GMB treatments significantly improved both organic C and N content in the soil compared to the control. Organic manure (e.g., livestock manure and green manure crops) has already been suggested as a biological source of N and organic C in the soil, which can also furnish a higher level of macro- and micronutrients in the soil [14,15]. The promising efficiency of leguminous (GMV and GMB) green manure in enhancing soil N content also confirms the previous results of Liu et al. [16], who reported the capability of leguminous green manures to enrich the biologically fixed N in soils and provide an achievable pathway for crops to utilize the soil-fixed N effectively, an ability that was not observed at least in inorganic fertilization treatment in the present research.
What is interesting in this study is the lack of significant differences among organic inputs and control treatments regarding the C/N ratio. This finding can be clearly explained by the increase in organic C and N content in response to the treatments in a certain proportion, apart from the differences in quantities. The findings of the current study do not support previous research reporting a higher C/N ratio in soils treated with organic and inorganic fertilization compared to non-treated soils [17,18]. Increasing the soil organic C and N content to an almost similar proportion and the unchanged C/N ratio might somehow reveal the effect of fertilizers, in the present research, on the balancing between C and N content. In this regard, it was reported that the appropriate dose of N fertilization could prevent N leaching and deterioration in soil, improve N use efficiency, and consequently cause a positive effect on organic C content and C sequestration [19]. The same C/N ratio in unfertilized soils might be explained in this way, so that the low N fertilization rates affect plants by exuding fewer organic substances from the root into the soil and therefore causing a reduction in organic C content [20].
All fertilization management significantly increased the tomato yield. Almost the same results were observed for the yield of watermelon (except for GMW) and pepper (except for IF) compared to the control treatment. It has been proposed that the growth and production of tomatoes, watermelons, and peppers are significantly affected by the application of green manure, livestock manure, and mineral fertilizers, mainly because of the higher content of soil organic matter and nitrogen [21,22,23,24]. It has also been stated that manure fertilization not only positively affects soil physicochemical properties but also stimulates the root exudates in plants, which can consequently improve the availability of nutrients in soil [25] and enhance nutrient use efficiency by plants [14]. The finding of the current study is also consistent with Fracchiolla et al. [23], who found no significant changes in watermelon fruit weight in response to manure and inorganic fertilization.
The results clearly showed that the combination of green and livestock manures with 75 kg of organic N fertilizer in the first two years has been able to increase the N content in the soil (Table 3). Despite the lack of supplementation with organic N fertilizer in the third year, the yield of pepper was significantly higher in legume green manure treatments (GMV and GMB) and insignificantly higher in green manure wheat and livestock manure than inorganic N fertilizer (Figure 2). It can be explained by the slow mineralization of N compounds in soils treated with organic N fertilizer [4] over a three-year experiment, despite the lower values of nitrogen partial productivity, nitrogen agronomic efficiency, and nitrogen fertilizer recovery rate compared to inorganic fertilizer [26].
Soil microbial activity and community structures have a crucial role in agroecosystems because of their involvement in multiple soil biochemical processes, one of which is the decomposing, mineralizing, and recycling of organic matter in the soil [14]. The role of soil microorganisms in the modification of the efficiency of organic fertilization was already reported through their influence on the fertilizers’ mineralization and inorganic C precipitation by balancing between soil CO2, HCO3, and CaCO3 content [27,28,29]. The changes in the bacterial community in the present study can be one of the reasons for the difference in the effectiveness of different organic and inorganic fertilizers in terms of the availability of C and N in the soil as well as plant yield.
While the application of livestock manure (MF) resulted in higher Pielou’s evenness and Simpson_e indices, there were no differences among all other organic, inorganic, or control treatments (Figure 5). Similarly, greater bacterial α-diversity and richness were reported by Francioli et al. [12] in soils treated with farmyard manure compared to inorganic treatments. On the other hand, other research has shown no changes in bacterial biodiversity in response to green manure and organic fertilization [25,30], suggesting its modification by several critical factors, including climate conditions, soil type, cultivated plant, and even sampling time period throughout the year [25]. Therefore, it has been suggested to focus more on bacterial community compositions and relative abundances of taxa than on biodiversity indices as a trustworthy strategy for evaluating the consequences of agricultural management on bacterial communities [31]. By focusing on bacterial phyla, it was found that some phyla responded to fertilizers differently (Table 4). Ward’s clustering analysis also revealed that the bacterial families clustered into several groups, in which inorganic fertilization and control treatment were placed in the same group at a long distance from other organic fertilizers (Figure 7). These findings further support the changes in soil organic C content in organically fertilized soils, especially under manure fertilization (MF) treatment, since it has been proven that the raised abundance of some bacterial taxa usually accompanies an accumulation in soil organic matter and vice versa [32]. Accordingly, a scientifically accepted classification for bacterial taxa has already been proposed, which divides them into two categories based on their reaction to resource availability and lifestyles, including copiotrophic (r-strategies) and oligotrophic (k-strategies) [33], which is also utilized for comprehending how bacterial taxa respond to soil management differentially [34].
In the present research, Proteobacteria (with the most abundant families of Steroidobacteraceae, Beijerinckiaceae, Azospirillaceae, and Xanthobacteraceae), as a known copiotrophic phyla, was significantly more abundant in soils treated with organic fertilization, the soils that showed higher accumulation of organic C and total N. Similarly, it was reported that such copiotrophic taxa were most abundant in soils with high C and N availability [32,35], indicating their function as decomposers and metabolizers of labile organic C inputs [29]. This classification may also explain the relatively high abundances of the oligotroph K-strategists’ phyla of Acidobacteriota (with the most abundant families of Vicinamibacteraceae, Bryobacteraceae, Pyrinomonadaceae, and Blastocatellaceae), detected in the present study in the control treatment (+8–35%; Table 4), where the level of organic C was at its lowest level compared to other treatments (−22–42%; Figure 1). It is also interesting to compare the higher abundance of Firmicutes in soil treated with inorganic fertilization with that found by Xun et al. [36] and Ma et al. [11], who found that the application of inorganic fertilizers can improve the relative abundances of these K-strategist oligotrophs. Nevertheless, these results need to be interpreted with caution since some phyla (e.g., Planctomycetota) were identified to show both copiotrophic and oligotrophic genomic properties [37] and/or all their members may not be distinctly copiotrophic or oligotrophic [33]. This could be a reason for the close relationship of Planctomycetota (moderate oligotroph) with soil organic C and N, based on the canonical correspondence analysis (Figure 8).
Moreover, the ratio of the abundance of Proteobacteria (a copiotrophic phylum) to Acidobacteria (an oligotrophic phylum) is considered an indicator of soil nutrient status [38]. Accordingly, the ratio of Proteobacteria to Acidobacteria was significantly higher in soils treated with leguminous green manures (GMV and GMB) compared to other organic, inorganic, and control treatments, signifying a higher level of soil nutrients. This finding might be an explanation for the higher yield of tomato, watermelon, and pepper plants in response to GMV and GMB treatments.
The soil bacterial community is increasingly recognized as an important factor correlated with agroecosystem function, as it has been reported that soil community simplification and low levels of soil biodiversity resulted in an overall decrease in ecosystem multifunctionality, especially plant productivity and soil nutrient retention capacity [39]. Similarly, it has been stated that nitrogen [39,40] and phosphorus [41] losses declined in response to changes in the microbial community and an increase in microbial diversity. Moreover, bacterial community and richness have been proven to link with soil biochemical processes (e.g., ammonia oxidization) and could affect fertilizer efficiency and consequently change plant growth and productivity [42]. Although the study has successfully demonstrated the changes in bacterial community compositions in response to organic and inorganic fertilization, the generalizability of these results is subject to certain limitations. For instance, the bacterial community was reported to respond differentially to the three-year fertilization management as compared to the short-term application [43], and the accumulated effect of repeated annual applications may gradually alter the community structure [44]. Therefore, since the bacterial community and diversity in the present study were investigated after three years of application, more broadly, research is needed to confirm the association of these biological factors and fertilization treatments in future studies during several years of cultivation.

5. Conclusions

The findings of the present study will doubtless be scrutinized, but there are some immediately dependable general conclusions for improving the production of tomato, watermelon, and pepper under both organic and inorganic fertilization management, in which the effects of leguminous green manures (GMV and GMB) were more pronounced. Although our results highlighted a significant change in bacterial diversity and species richness only in soil treated with livestock manure (MF), a more extensive alteration in the bacterial community was observed under organic fertilization treatments, as shown by cluster analysis. These changes were associated with a higher ratio of Proteobacteria (a copiotrophic phylum) to Acidobacteria (an oligotrophic phylum) in leguminous green manure treatments, indicating higher soil nutrient content compared to inorganic fertilizer, as shown by soil total nitrogen and organic carbon content. Therefore, by replacing inorganic mineral fertilization with vetch and field bean green manures in the same field and semiarid climatic conditions, the soil ecosystem can be preserved, showing significantly greater soil N and organic C levels and higher plant production. Despite the increase in plant yield to a lesser extent than that of leguminous green manures, livestock manure can be used alternatively to improve the bacterial biodiversity and preserve the heterogeneity of the bacterial communities.

Supplementary Materials

The following supporting information can be downloaded at: https://www.mdpi.com/article/10.3390/soilsystems8010005/s1, Table S1: The timeline of the experiment.

Author Contributions

Conceptualization, M.S. and E.C.; methodology, C.L. and A.T.; software, M.Y.K. and M.C.; validation, C.C. and M.S.; formal analysis, M.Y.K. and M.C.; investigation, M.Y.K., C.L. and A.T.; resources, M.S. and E.C.; data curation, M.Y.K., M.C. and C.C.; writing—original draft preparation, M.Y.K. and M.C.; writing—review and editing, M.Y.K., C.C. and M.S.; visualization, M.S., C.C. and E.C.; supervision, M.S.; project administration, M.S.; funding acquisition, M.S. All authors have read and agreed to the published version of the manuscript.

Funding

This research was funded by the Agritech National Research Center and received funding from the European Union Next-Generation EU (PIANO NAZIONALE DI RIPRESA E RESILIENZA (PNRR)—MISSIONE 4 COMPONENTE 2, INVESTIMENTO 1.4—D.D. 1032 17 June 2022, CN00000022).

Institutional Review Board Statement

Not applicable.

Informed Consent Statement

Not applicable.

Data Availability Statement

The data that support the findings of this study are available on request from the corresponding author.

Acknowledgments

This study was carried out within the Agritech National Research Center and received funding from the European Union Next-Generation EU (PIANO NAZIONALE DI RIPRESA E RESILIENZA (PNRR)—MISSIONE 4 COMPONENTE 2, INVESTIMENTO 1.4—D.D. 1032 17 June 2022, CN00000022). This manuscript reflects only the authors’ views and opinions; neither the European Union nor the European Commission can be considered responsible for them.

Conflicts of Interest

The authors declare no conflicts of interest.

References

  1. Kelly, C.; Ferrara, A.; Wilson, G.A.; Ripullone, F.; Nole, A.; Harmer, N.; Salvati, L. Community resilience and land degradation in forest and shrubland socio-ecological systems: Evidence from Gorgoglione, Basilicata, Italy. Land Use Policy 2015, 46, 11–20. [Google Scholar] [CrossRef]
  2. Yaghoubi Khanghahi, M.; Cucci, G.; Lacolla, G.; Lanzellotti, L.; Crecchio, C. Soil fertility and bacterial community composition in a semiarid Mediterranean agricultural soil under long-term tillage management. Soil Use Manag. 2020, 36, 604–615. [Google Scholar] [CrossRef]
  3. Van der Bom, F.; Nunes, I.; Raymond, N.S.; Hansen, V.; Bonnichsen, L.; Magid, J.; Nybroe, O.; Jensen, L.S. Long-term fertilisation form, level and duration affect the diversity, structure and functioning of soil microbial communities in the field. Soil Biol. Biochem. 2018, 122, 91–103. [Google Scholar] [CrossRef]
  4. Rapisarda, S.; Di Biase, G.; Mazzon, M.; Ciavatta, C.; Cavani, L. Nitrogen Availability in Organic Fertilizers from Tannery and Slaughterhouse By-Products. Sustainability 2022, 14, 12921. [Google Scholar] [CrossRef]
  5. Sądej, W.; Przekwas, K. Fluctuations of nitrogen levels in soil profile under conditions of a long-term fertilization experiment. Plant Soil Environ. 2008, 54, 197–203. [Google Scholar] [CrossRef]
  6. Luo, G.; Li, L.; Friman, V.-P.; Guo, J.; Guo, S.; Shen, Q.; Ling, N. Organic Amendments Increase Crop Yields by Improving Microbe-Mediated Soil Functioning of Agroecosystems: A Meta-Analysis. Soil Biol. Biochem. 2018, 124, 105–115. [Google Scholar] [CrossRef]
  7. Whalen, J.K.; Thomas, B.W.; Sharifi, M. Novel Practices and Smart Technologies to Maximize the Nitrogen Fertilizer Value of Manure for Crop Production in Cold Humid Temperate Regions. In Advances in Agronomy; Elsevier: Amsterdam, The Netherlands, 2019; Volume 153, pp. 1–85. ISBN 978-0-12-817404-3. [Google Scholar]
  8. Luján Soto, R.; Martínez-Mena, M.; Cuéllar Padilla, M.; de Vente, J. Restoring soil quality of woody agroecosystems in Mediterranean drylands through regenerative agriculture. Agric. Ecosyst. Environ. 2021, 306, 107191. [Google Scholar] [CrossRef]
  9. Hatfield, J.L.; Walthall, C.L. Soil biological fertility: Foundation for the next revolution in agriculture? Commun. Soil Sci. Plant Anal. 2015, 46, 753–762. [Google Scholar] [CrossRef]
  10. Bünemann, E.K.; Schwenke, G.D.; Van Zwieten, L. Impact of agricultural inputs on soil organisms: A review. Soil Res. 2006, 44, 379–406. [Google Scholar] [CrossRef]
  11. Ma, T.; He, X.; Chen, S.; Li, Y.; Huang, Q.; Xue, C.; Shen, Q. Long-term organic–inorganic fertilization regimes alter bacterial and fungal communities and rice yields in paddy soil. Front. Microbiol. 2022, 13, 890712. [Google Scholar] [CrossRef]
  12. Francioli, D.; Schulz, E.; Lentendu, G.; Wubet, T.; Buscot, F.; Reitz, T. Mineral vs. organic amendments: Microbial community structure, activity and abundance of agriculturally relevant microbes are driven by long-term fertilization strategies. Front. Microbiol. 2016, 7, 1446. [Google Scholar] [CrossRef] [PubMed]
  13. Li, R.; Khafipour, E.; Krause, D.O.; Entz, M.H.; De Kievit, T.R.; Fernando, W.G.D. Pyrosequencing reveals the influence of organic and conventional farming systems on bacterial communities. PLoS ONE 2012, 7, e51897. [Google Scholar] [CrossRef]
  14. Khaitov, B.; Yun, H.J.; Lee, Y.; Ruziev, F.; Le, T.H.; Umurzokov, M.; Bo, A.; Cho, K.M.; Park, K.W. Impact of organic manure on growth, nutrient content and yield of chilli pepper under various temperature environments. Int. J. Environ. Res. Public Health 2019, 16, 3031. [Google Scholar] [CrossRef] [PubMed]
  15. Wang, X.; Zheng, H.; Wu, L. Responses of soil organic and inorganic carbon to organic and phosphorus fertilization in a saline–alkaline paddy field. Geosci. Lett. 2023, 10, 15. [Google Scholar] [CrossRef]
  16. Liu, R.; Zhou, G.-P.; Chang, D.-N.; Gao, S.-J.; Han, M.; Zhang, J.-D.; Sun, X.-F.; Cao, W.-D. Transfer characteristics of nitrogen fixed by leguminous green manure crops when intercropped with maize in northwestern China. J. Integr. Agric. 2022, 21, 1177–1187. [Google Scholar] [CrossRef]
  17. Ge, S.; Zhu, Z.; Jiang, Y. Long-term impact of fertilization on soil pH and fertility in an apple production system. J. Soil Sci. Plant Nutr. 2018, 18, 282–293. [Google Scholar] [CrossRef]
  18. Li, C.; Aluko, O.O.; Yuan, G.; Li, J.; Liu, H. The responses of soil organic carbon and total nitrogen to chemical nitrogen fertilizers reduction base on a meta-analysis. Sci. Rep. 2022, 29, 16326. [Google Scholar] [CrossRef]
  19. Liu, Y.; Li, C.; Cai, G.; Sauheitl, L.; Xiao, M.; Shibistova, O.; Ge, T.; Guggenberger, G. Meta-analysis on the effects of types and levels of N, P, and K fertilization on organic carbon in cropland soils. Geoderma 2023, 437, 116580. [Google Scholar] [CrossRef]
  20. Zhao, Z.; Gunina, T.G.A.; Li, Y.; Zhu, Z.; Peng, P.; Wu, J.; Kuzyakov, Y. Carbon and nitrogen availability in paddy soil affects rice photosynthate allocation, microbial community composition, and priming: Combining continuous 13C labeling with PLFA analysis. Plant Soil 2019, 445, 137–152. [Google Scholar] [CrossRef]
  21. Del Amor, F.M. Yield and fruit quality response of sweet pepper to organic and mineral fertilization. Renew. Agric. Food Syst. 2007, 22, 233–238. [Google Scholar] [CrossRef]
  22. Kim, Y.-S.; Yun, G.-S.; Jeon, Y.-M.; Kim, E.-J.; Noh, S.-J.; Park, S.-W.; Kim, T.-I.; Hong, S.T. Effects of winter cultivation of green manure crop and application of organic resources on watermelon yield and soil physico-chemical properties in greenhouse. Korean J. Soil Sci. Fertil. 2019, 52, 530–540. [Google Scholar] [CrossRef]
  23. Fracchiolla, M.; Lasorella, C.; Santamaria, P.; Renna, M.; Signore, A.; Cazzato, E. Response of organically grown mini watermelon (Citrullus lanatus (Thunb.) Matsum. & Nakai) to different green manure crops and nitrogen fertilization. Acta Hortic. 2020, 1294, 85–90. [Google Scholar] [CrossRef]
  24. Gao, F.; Li, H.; Mu, X.; Gao, H.; Zhang, Y.; Li, R.; Cao, K.; Ye, L. Effects of organic fertilizer application on tomato yield and quality: A meta-analysis. Appl. Sci. 2023, 13, 2184. [Google Scholar] [CrossRef]
  25. Özbolat, O.; Sánchez-Navarro, V.; Zornoza, R.; Egea-Cortines, M.; Cuartero, J.; Ros, M.; Pascual, J.A.; Boix-Fayos, C.; Almagro, M.; de Vente, J.; et al. Long-term adoption of reduced tillage and green manure improves soil physicochemical properties and increases the abundance of beneficial bacteria in a Mediterranean rainfed almond orchard. Geoderma 2023, 429, 116218. [Google Scholar] [CrossRef]
  26. Lin, S.; Pi, Y.; Long, D.; Duan, J.; Zhu, X.; Wang, X.; He, J.; Zhu, Y. Impact of Organic and Chemical Nitrogen Fertilizers on the Crop Yield and Fertilizer Use Efficiency of Soybean–Maize Intercropping Systems. Agriculture 2022, 12, 1428. [Google Scholar] [CrossRef]
  27. Zhao, X.; Zhao, C.; Stahr, K.; Kuzyakov, Y.; Wei, X. The effect of microorganisms on soil carbonate recrystallization and abiotic CO2 uptake of soil. Catena 2020, 192, 104592. [Google Scholar] [CrossRef]
  28. Tang, L.; Ren, F.; Li, Y.; Duan, Y.; Sun, N.; Zhao, P.; Li, Y.; Xu, M. The inorganic carbon fixation improved by long-term manure fertilization in kastanozems under rotation system of north China. Agronomy 2023, 13, 641. [Google Scholar] [CrossRef]
  29. Shanmugam, S.; Buehring, N.W.; Prevost, J.D.; Kingery, W.L. Soil bacterial community diversity and composition as affected by tillage intensity treatments in corn-soybean production systems. Microbiol. Res. 2021, 12, 157–172. [Google Scholar] [CrossRef]
  30. Zheng, W.; Gong, Q.; Zhao, Z.; Liu, J.; Zhai, B.; Wang, Z.; Li, Z. Changes in the soil bacterial community structure and enzyme activities after intercrop mulch with cover crop for eight years in an orchard. Eur. J. Soil Biol. 2018, 86, 34–41. [Google Scholar] [CrossRef]
  31. Hermans, S.M.; Buckley, H.L.; Case, B.S.; Curran-Cournane, F.; Taylor, M.; Lear, G. Using soil bacterial communities to predict physico-chemical variables and soil quality. Microbiome 2020, 8, 79. [Google Scholar] [CrossRef]
  32. Yaghoubi Khanghahi, M.; Murgese, P.; Strafella, S.; Crecchio, C. Soil biological fertility and bacterial community response to land use intensity: A case study in the mediterranean area. Diversity 2019, 11, 211. [Google Scholar] [CrossRef]
  33. Fierer, N.; Bradford, M.A.; Jackson, R.B. Toward an ecological classification of soil bacteria. Ecology 2007, 88, 1354–1364. [Google Scholar] [CrossRef] [PubMed]
  34. Lupwayi, N.Z.; Lafond, G.P.; Ziadi, N.; Grant, C.A. Soil microbial response to nitrogen fertilizer and tillage in barley and corn. Soil Tillage Res. 2012, 118, 139–146. [Google Scholar] [CrossRef]
  35. Fontaine, S.; Mariotti, A.; Abbadie, L. The priming effect of organic matter: A question of microbial competition? Soil Biol. Biochem. 2003, 35, 837–843. [Google Scholar] [CrossRef]
  36. Xun, W.; Zhao, J.; Xue, C.; Zhang, G.; Ran, W.; Wang, B. Significant alteration of soil bacterial communities and organic carbon decomposition by different long-term fertilization management conditions of extremely low-productivity arable soil in South China. Environ. Microbiol. 2016, 18, 1907–1917. [Google Scholar] [CrossRef]
  37. Ho, A.; Di Lonardo, D.P.; Bodelier, P.L.E. Revisiting life strategy concepts in environmental microbial ecology. FEMS Microbiol. Ecol. 2017, 93, fix006. [Google Scholar] [CrossRef]
  38. Torsvik, V.; Øvreås, L. Microbial diversity and function in soil: From genes to ecosystems. Curr. Opin. Microbiol. 2002, 5, 240–245. [Google Scholar] [CrossRef]
  39. Romero, F.; Hilfiker, S.; Edlinger, A.; Held, A.; Hartman, K.; Labouyrie, M.; van der Heijden, M.G.A. Soil microbial biodiversity promotes crop productivity and agro-ecosystem functioning in experimental microcosms. Sci. Total Environ. 2023, 885, 163683. [Google Scholar] [CrossRef]
  40. Bender, S.F.; van der Heijden, M.G.A. Soil biota enhance agricultural sustainability by improving crop yield, nutrient uptake and reducing nitrogen leaching losses. J. Appl. Ecol. 2015, 52, 228–239. [Google Scholar] [CrossRef]
  41. Wagg, C.; Bender, S.F.; Widmer, F.; van der Heijden, M.G.A. Soil biodiversity and soil community composition determine ecosystem multifunctionality. Proc. Natl. Acad. Sci. USA 2014, 111, 5266–5270. [Google Scholar] [CrossRef]
  42. Xiong, J.; Peng, S.; Liu, Y.; Yin, H.; Zhou, L.; Zhou, Z.; Tan, G.; Gu, Y.; Zhang, H.; Huang, J.; et al. Soil properties, rhizosphere bacterial community, and plant performance respond differently to fumigation and bioagent treatment in continuous cropping fields. Front. Microbiol. 2022, 13, 923405. [Google Scholar] [CrossRef] [PubMed]
  43. Allison, S.D.; Martiny, J.B.H. Resistance, resilience, and redundancy in microbial communities. Proc. Natl. Acad. Sci. USA 2008, 105, 11512–11519. [Google Scholar] [CrossRef] [PubMed]
  44. Geisseler, D.; Scow, K.M. Long-term effects of mineral fertilizers on soil microorganisms—A review. Soil Biol. Biochem. 2014, 75, 54–63. [Google Scholar] [CrossRef]
Figure 1. The effect of different fertilization management on soil nitrogen (a), total organic carbon (b), and the ratio of organic carbon to nitrogen (c). The means in each parameter followed by a similar letter(s) are not significantly different at the 5% probability level (Tukey test). GMV: green manure vetch; GMB: green manure field bean; IF: inorganic fertilization; GMW: green manure wheat; MF: manure fertilization; Cont: control treatment (without nitrogen fertilization).
Soilsystems 08 00005 g001
Figure 2. The effect of different fertilization management on the fruit yield of tomato, watermelon, and pepper (t ha−1) during the three years. The means in each parameter followed by a similar letter(s) are not significantly different at the 5% probability level (Tukey test). GMV: green manure vetch; GMB: green manure field bean; IF: inorganic fertilization; GMW: green manure wheat; MF: manure fertilization; Cont: control treatment (without nitrogen fertilization).
Soilsystems 08 00005 g002
Figure 3. The effect of different fertilization management on the fruit weight (g) of tomato, watermelon, and pepper during the three years. The means in each parameter followed by a similar letter(s) are not significantly different at the 5% probability level (Tukey test). GMV: green manure vetch; GMB: green manure field bean; IF: inorganic fertilization; GMW: green manure wheat; MF: manure fertilization; Cont: control treatment (without nitrogen fertilization).
Soilsystems 08 00005 g003
Figure 4. The effect of different fertilization management on the number of fruits per plant in tomato, watermelon, and pepper during the three years. The means in each parameter followed by a similar letter(s) are not significantly different at the 5% probability level (Tukey test). GMV: green manure vetch; GMB: green manure field bean; IF: inorganic fertilization; GMW: green manure wheat; MF: manure fertilization; Cont: control treatment (without nitrogen fertilization).
Soilsystems 08 00005 g004
Figure 5. Pielou’s evenness (A) and Simpson_e (B) indices of bacterial communities in soil samples under different fertilization management. Values, calculated on a normalized dataset, are the means ± standard deviation of three replicates for each sample. GMV: green manure vetch; GMB: green manure field bean; IF: inorganic fertilization; GMW: green manure wheat; MF: manure fertilization; Cont: control treatment (without nitrogen fertilization).
Soilsystems 08 00005 g005
Figure 6. Principal coordinate analysis (PCoA) of β-diversity, calculated using the unweighted UniFrac metric (A) and weighted UniFrac metric (B), for the bacterial community of soils under different fertilization management. The proportions of the data variation are displayed as axis percentages. The measures within each treatment are in triplicate. GMV: green manure vetch; GMB: green manure field bean; IF: inorganic fertilization; GMW: green manure wheat; MF: manure fertilization; Cont: control treatment (without nitrogen fertilization).
Soilsystems 08 00005 g006
Figure 7. Relative abundance (>1%) of bacterial families in soils under different fertilization management. Ward’s clustering method, using Euclidean distance, was used to estimate the distance among all bacterial families in response to the fertilization treatments. The measures within each treatment are in triplicate. GMV: green manure vetch; GMB: green manure field bean; IF: inorganic fertilization; GMW: green manure wheat; MF: manure fertilization; Cont: control treatment (without nitrogen fertilization).
Soilsystems 08 00005 g007
Figure 8. Canonical correspondence analysis (CCA) ordination of the soil bacterial community revealing the significant contribution of soil carbon and nitrogen content in illustrating variations in the bacterial community at the phylum level with relative abundances higher than 1%. A: Proteobacteria; B: Actinobacteriota; C: Acidobacteriota; D: Bacteroidota; E: Chloroflexi; F: Firmicutes; G: Planctomycetota; H: Myxococcota; I: Gemmatimonadota; J: Verrucomicrobiota; K: Entotheonellaeota; L: Nitrospirota. GMV: green manure vetch; GMB: green manure field bean; IF: inorganic fertilization; GMW: green manure wheat; MF: manure fertilization; Cont: control treatment (without nitrogen fertilization).
Soilsystems 08 00005 g008
Table 1. Soil physicochemical characteristics in the first year before starting the experiment.
Soil TextureClay Loam
pH (H2O)7.5
Electrical conductivity (EC)0.9 dS m−1
Organic carbon1.3%
Organic matter 2.2%
Nitrogen (N) 1.4 g kg−1
C/N ratio9.3
Calcium carbonate (CaCO3)223 g kg−1
Available phosphorus 18.5 mg kg−1
Table 2. Different fertilization management during three years of cultivation.
TreatmentFirst YearSecond Year Third Year
Tomato (Solanum lycopersicum L. cv. Dobler)Watermelon (Citrullus lanatus cv. Modellino)Pepper (Capsicum annuum L. cv. Senise)
GMVGreen manure vetch + 75 kg N ha−1 of organic N fertilizerGreen manure vetch + 75 kg N ha−1 of organic N fertilizer Green manure vetch
GMBGreen manure field bean + 75 kg N ha−1 of organic N fertilizerGreen manure field bean + 75 kg N ha−1 of organic N fertilizerGreen manure field bean
IF Calcium nitrate (150 kg N ha−1)Calcium nitrate (100 kg N ha−1)Calcium nitrate (150 kg N ha−1)
GMWGreen manure wheat + 75 kg N ha−1 of organic N fertilizerGreen manure wheat + 75 kg N ha−1 of organic N fertilizerGreen manure wheat
MFLivestock manure fertilization (40 t ha−1) + 75 kg N ha−1 of organic N fertilizerLivestock manure fertilization (40 t ha−1) + 75 kg N ha−1 of organic N fertilizerLivestock manure fertilization (40 t ha−1)
ContControl treatment (without nitrogen fertilization)
Note: 120 kg K2O ha−1 and 65 kg P2O5 ha−1 were applied to all treatments and crops before the transplantation stage each year. Furthermore, 75 kg N ha−1 of organic nitrogen fertilizer was applied by distributing 500 kg ha−1 of Regenor (7% organic N, 52% organic matter, and 5% P2O5; HAIFA group, Bologna, Italy) plus 500 kg ha−1 of BI.OTTO (8% organic N, 50% organic matter, 8% CaO, and 4% MgO; ILSA S.p.A group, Verona, Italy).
Table 3. Biomass and nitrogen supplied by green manure and livestock manure over the three-year experiment.
DB
(t ha −1)
N Content (% of DB)Supplied N (kg ha−1)DB
(t ha −1)
N Content (% of DB)Supplied N (kg ha−1)DB
(t ha −1)
N Content (% of DB)Supplied N (kg ha−1)
First YearSecond YearThird Year
GMV8.72.6423010.82.362557.12.52179
GMB9.32.592409.72.4924112.52.34292
GMW3.11.54509.11.341227.11.46104
MF8.01.501208.01.501208.01.50120
DB: dry biomass.
Table 4. Relative abundance of bacterial phyla (relative abundance > 1%) in soil (A) and the ratio of Proteobacteria to Acidobacteria (B) under different fertilization management.
AGMVGMBIFGMWMFCont
Phylum
Proteobacteria23.94 ± 0.60 a24.23 ± 0.47 a22.51 ± 1.12 ab23.18 ± 0.97 a23.12 ± 0.55 a20.76 ± 0.26 b
Actinobacteriota21.39 ± 0.55 a21.40 ± 2.08 a21.71 ± 0.99 a19.76 ± 3.22 a20.95 ± 3.48 a19.75 ± 0.70 a
Acidobacteriota9.72 ± 0.29 c9.71 ± 0.26 c11.28 ± 0.47 b 10.95 ± 0.93 bc12.14 ± 0.54 ab 13.11 ± 0.44 a
Bacteroidota10.56 ± 0.40 a11.51 ± 1.24 a10.45 ± 0.96 a12.90 ± 1.60 a8.59 ± 4.76 a11.10 ± 1.19 a
Chloroflexi8.16 ± 0.38 ab7.84 ± 0.25 ab7.49 ± 0.92 b7.49 ± 0.44 b10.32 ± 1.98 a7.91 ± 0.10 ab
Firmicutes4.29 ± 0.33 b4.23 ± 0.38 b7.38 ± 1.26 a5.53 ± 1.09 ab4.58 ± 0.18 b6.38 ± 0.55 ab
Planctomycetota7.24 ± 1.40 a6.35 ± 0.13 ab4.38 ± 1.12 b5.56 ± 1.32 ab6.59 ± 0.69 ab4.92 ± 0.33 b
Myxococcota3.42 ± 0.08 ab3.52 ± 0.22 a4.11 ± 0.17 a3.25 ± 0.42 ab2.62 ± 0.56 b3.91 ± 0.10 a
Gemmatimonadota2.47 ± 0.42 a2.68 ± 0.20 a2.75 ± 0.19 a2.43 ± 0.30 a2.79 ± 0.25 a2.83 ± 0.19 a
Verrucomicrobiota3.70 ± 0.13 a3.29 ± 0.20 a3.07 ± 0.17 a3.76 ± 1.02 a2.38 ± 1.19 a3.57 ± 0.26 a
Entotheonellaeota1.36 ± 0.12 a1.34 ± 0.04 a1.18 ± 0.27 a1.33 ± 0.04 a1.64 ± 0.31 a1.51 ± 0.12 a
Nitrospirota1.37 ± 0.03 a1.41 ± 0.29 a1.25 ± 0.12 a1.24 ± 0.10 a0.95 ± 0.15 a1.30 ± 0.14 a
B
Ratio of Proteobacteria to Acidobacteria2.46 ± 0.36 a2.50 ± 0.42 a2.00 ± 0.38 b2.12 ± 0.26 b1.90 ± 0.23 b1.58 ± 0.19 c
The means in each phylum followed by similar letter(s) are not significantly different at the 5% probability level (Tukey test). GMV: green manure vetch; GMB: green manure field bean; IF: inorganic fertilization; GMW: green manure wheat; MF: manure fertilization; Cont: control treatment (without nitrogen fertilization).
Disclaimer/Publisher’s Note: The statements, opinions and data contained in all publications are solely those of the individual author(s) and contributor(s) and not of MDPI and/or the editor(s). MDPI and/or the editor(s) disclaim responsibility for any injury to people or property resulting from any ideas, methods, instructions or products referred to in the content.

