Abstract
The input of fresh organic carbon into soils can stimulate organic carbon mineralization via priming effects (PEs). However, little is known about the characterization of PEs in coastal wetlands. We investigated the PEs of two salt marshes (Suaeda salsa and Phragmites australis) in the Yellow River Delta by adding 13C-labeled glucose to soils collected from the 0–10 cm and 20–30 cm layers of both salt marshes. The addition of glucose produced a significant positive PE in both soil layers for both vegetation types. There were no differences in the PE of the topsoil layer between the two vegetation types (p > 0.05), whereas the PE of S. salsa was 19.5% higher than that of P. australis in the subsoil layer (p < 0.05). In addition, the topsoil layer showed a higher average PE of 29.1% compared to that of the subsoil layer for both vegetation types (p < 0.05). The differences in the PEs between the two vegetation types and the two layers could be associated with a differential soil salinity, substrate availability, and microbial community structure. Our findings highlight the important role of PEs in regulating the soil carbon storage of coastal salt marshes, which should be considered when assessing and modeling the soil carbon cycling of coastal wetlands.
1. Introduction
Soil is the largest reservoir of carbon (C) in the terrestrial biosphere and stores approximately 1550 Pg of soil organic carbon (SOC) in the upper 1 m, which is 2–3 times larger than the atmospheric C pool [1,2]. Even a small change in the SOC pool can have a substantial impact on the atmospheric CO2 budget and contribute to global warming. Based on system models of Earth and satellite observations [3], increasing climate warming is expected to increase the terrestrial net primary production (NPP), leading to an increase in soil C inputs through root-derived C input and litter [4,5]. However, increased below-ground C inputs associated with climate warming are not always expected to favor SOC accumulation because the change in the SOC pool is a net balance between C inputs and losses [6]. SOC mineralization is the process by which SOC is converted to CO2 by soil microorganisms, representing the main pathway of C loss from the soil to the atmosphere [7]. Changes in the quality and quantity of litterfall and root-exudate C substrates entering soils are likely to modify the soil microbial activity and community structure, directly affecting soil mineralization rates and potentially influencing SOC stocks [8,9].
Priming effects (PEs) can be described as the incorporation of fresh organic matter (FOM) that changes the soil mineralization rate of native SOC [10]. In different studies, the input of FOM can either increase or decrease the mineralization rate of native SOC, resulting in positive or negative PEs, respectively, and the internal mechanism leading to this change is different [10,11,12]. Negative PEs are typically attributed to microorganisms that preferentially utilize fresh organic substrates over native SOC, thus slowing down turnover and the mineralization losses of native SOC [13]. Positive PEs are often divided into apparent positive PEs and real positive PEs. An apparent positive PE occurs when exogenous C replaces microbial cellular C [14], while a real positive PE is the case where the increase in microbial extracellular enzymes associated with FOM accelerates the mineralization rate of the native SOC [15].
A considerable number of studies have investigated the patterns of PEs worldwide by adding chemically distinct plant litter or isotopically (13C or 14C) labeled substrates to soils in the laboratory or under field conditions. Because the isotopically labeled method requires a relatively simple pretreatment and has a high identification precision, it is currently widely used in the identification of different carbon sources and the quantitative analysis of PEs. Previous studies have revealed that the direction and magnitude of PEs change greatly in response to FOM inputs [8,16,17], which could be attributed to the fact that PEs are influenced by a variety of abiotic and biotic factors, including exogenous substrate properties (e.g., substrate addition and substrate quality), soil properties (e.g., SOC content, C:N, and pH), and microbial properties (e.g., microbial biomass, community structure, and activity) [14,18]. For example, Liu et al. [19] observed that a glucose input switched microbial processes from energy to nutrient limitations, triggering an increase in PEs from negative or no priming to strong positive priming in four different ecosystems in northern Arizona. Sawada et al. [20] found that the addition of glucose accelerated enzyme synthesis for SOC mineralization in cedar soils, but increased the microbial immobilization of existing SOC in cypress soils, resulting in positive and negative PEs, respectively. Furthermore, the response of soil microorganisms to the input of FOM is an internal driving force for the formation of PEs [21]. Generally, FOM inputs can change the secretion of extracellular enzymes and the metabolic processes of microorganisms, thus exerting a great influence on the PEs [22]. For example, Zhang et al. [23] added different exogenous glucose to subtropical mixed forest soils and found that adding glucose resulted in a positive PE due to the increase in r-strategy microorganisms. However, there is no general consensus on the different roles of microorganisms in PEs and which microorganisms are dominant in PEs.
Coastal salt marshes, located in the transitional zone between land and sea, are one of the most productive ecosystems on Earth [24,25]. Unique tidal and salt characteristics have shaped distinct vegetation communities and habitats in these ecosystems [26]. The different productivities of salt marsh plants indicate variations in FOM inputs through litter and root exudates, which may generate differential characteristics in terms of the PEs of different species [27]. In addition, with the intensity of global climate change, previous studies have suggested that climate change factors such as an increasing temperature have greatly affected the net primary production of salt marsh plants [28], indicating changes in FOM inputs and the potential PEs of different species, which will have a great consequence on the C storage of salt marshes. Therefore, it is necessary to quantify the PEs of different vegetation in salt marshes, which will be helpful when accurately predicting and modeling the soil carbon dynamics of coastal wetlands under the effects of climate change. In addition, the different soil layers of salt marshes often have a differential content of SOC and FOM inputs [19,29], suggesting possible differences in the source of SOC for the PEs of different species. Therefore, studying the differences between different soil layers provides an opportunity to explore how FOM inputs and soil properties interact to affect PEs in coastal salt marshes. Until now, there has been a lack of comparative studies on the PEs of different soil layers and vegetation types in coastal wetlands, which hinders our in-depth understanding of the C sink function of coastal wetlands.
We conducted an incubation experiment using 13C-labeled glucose as a substrate to quantify the PE patterns of the different soil layers of two salt marshes dominated by S. salsa and P. australis in the Yellow River Delta. We measured the soil carbon mineralization rate, microbial community structure, and soil physicochemical properties of the two soil layers for the two types of vegetation. We hypothesized that (1) FOM inputs lead to a positive PE because microbial activity is often restricted by the stresses of the soil environment of salt marshes [30]; (2) P. australis produces a higher PE than S. salsa because the soil of P. australis stores a larger amount of substrate; and (3) there is a difference in the PEs of the two soil layers, considering the differences in soil physicochemical properties and microbial biomass.
2. Materials and Methods
2.1. Field Sites and Soil Sampling
This study was carried out in coastal salt marsh ecosystems in the Yellow River Delta (37°36′ N, 118°57′ E). The local climate is a warm temperate and continental monsoon climate, with an average annual precipitation of 560 mm and an average annual temperature of 12.9 °C [31]. The dominant native species are Phragmites australis, Suaeda salsa, and Tamarix chinensis. The dominant soil types are solonchaks and fluvisols based on the World Reference Base for Soil Resources (WRB) [32].
In this study, we selected salt marshes dominated by P. australis and S. salsa as targets to understand the response of PEs to FOM inputs because these two species are herbaceous plants with shallow (mainly concentrated in 0–30 cm) root systems and they have distinct soil characteristics, such as salinity [33]. Soil samples were collected in November 2020. First, four plots (10 m × 10 m) were chosen randomly within each vegetation ecosystem. Second, in each plot, we collected five soil cores (one in each corner and one in the center of each plot) at two soil depths (0–10 cm and 20–30 cm) using a soil core sampler (20 cm depth with a diameter of 5 cm). Finally, the soil samples originating from the same depth in each plot were pooled into a representative sample. Therefore, there were four replicate samples for each soil depth under each vegetation type. After removing visible gravel and roots, each soil sample was divided into four subsamples using the quartering method. One subsample was air-dried to measure basic physical and chemical properties, one subsample was stored at 4 °C for the analysis of microbial biomass, one subsample was stored at −80 °C for microbiological sequencing, and the last subsample was used for an incubation experiment.
2.2. Laboratory Incubation
We conducted the incubation experiment by adding 13C-labeled glucose to the soils from each layer and each vegetation type. The experimental design had two treatments, a control (CK) and a glucose treatment (+G), and each treatment had four replications. First, 100 g of soil was put into a 1000 mL airtight amber jar and preincubated at a 60% water-holding capacity (WHC) and 25 °C for 10 days. Then, we conducted a pre-experiment with five glucose addition gradients to evaluate the appropriate amount of glucose to be added to the soil. After the preincubation, each jar of the +G treatment was sprayed with 6.25 mL of glucose solution, which was a mixture of 3 g of 13C-labeled glucose (99 atom% 13C) mixed with 100 mL of deionized water. This solution was thoroughly mixed with the soil. An equivalent amount of deionized water was added to the jars of the CK. The soil moisture was maintained at a constant level by daily weighing during the entire period.
2.3. Gas Sampling and CO2 Concentration Measurements
Gas sampling was carried out 1, 2, 3, 4, 6, 8, 11, 14, 18, 22, 29, and 39 days after the glucose addition. A 50 mL volume of gas was sampled from each jar with a syringe through a three-way stopcock and then injected into an evacuated aluminum foil airbag (200 mL). After each gas-sampling event, the caps were opened to ensure that the CO2 inside the bottles was at the same level as the outside air. The CO2 concentration was measured using gas chromatography (Agilent 7890A, Santa Clara, CA, USA), and the 13C abundance of CO2 in the gas samples was measured within 1 week using a gas stable isotope mass spectrometer (Thermo Fisher MAT253, Waltham, MA, USA). The δ13C values were reported in ‰ relative to the IAEA 13C standards, and the analytic precision was ±0.2‰.
2.4. Soil CO2 Mineralization Rate Calculation
The soil CO2 mineralization rate was calculated as follows:
where F is the soil CO2 emission rate, is the change in the CO2 concentration per unit time, M is the molar mass of carbon atoms, V is the space volume of the airtight amber jars, W is the weight of dried soil in the culture bottle, and M is the incubation temperature.
where is the cumulative amount of CO2 emissions, is the average emission flux of CO2 gas during two consecutive samplings, refers to the number of days between sampling, and refers to the number of sampling times.
2.5. Quantification of PEs
The proportion of CO2-C derived from the soil and the added glucose was calculated using the following equation:
where and are the δ13C values of the total CO2-C emissions from the glucose addition and CK treatments, respectively; is the δ13C value of the added glucose; is the amount of CO2-C emissions from the glucose source; is the amount of CO2-C emissions from soil sources; and represents the total amount of CO2-C emissions.
A PE was defined as the difference between the CO2 sourced from the soil with a glucose addition and that sourced from the soil without a glucose addition:
where represents the amount of CO2 emitted from the +G treatment and represents the amount of CO2 released from the CK.
2.6. Soil Physicochemical Analysis
The soil pH and salinity (electrical conductivity, EC) were determined for a soil:water ratio of 1:5 (m:v). The soil particle size was measured using a laser particle size analyzer (Malvern Master Sizer, London, UK) with a measurement accuracy of 3%. The soil total carbon (TC), total nitrogen (TN), and total organic carbon (TOC) were determined using an elemental analyzer (Vario MACRO cube Elementar Analysensysteme GmbH, Langenselbold, Germany) with a measurement accuracy of 0.5%. The soil dissolved organic carbon (DOC) was extracted with 0.5 M K2SO4;. The soil microbial biomass carbon (MBC) was measured using the fumigation–extraction method [34]. The DOC and MBC were measured using the TOC analyzer (Shimadzu, TOC-VCPH, Kyoto, Japan) with a measurement accuracy of 0.5%.
2.7. Analysis of the Microbial Community
Soil DNA was extracted from 0.5 g of soil using a QIAmp PowerFecal DNA kit (Qiagen, #12830–50, Hilden, Germany). The DNA quality and quantity were verified using electrophoresis on 1% agarose gels. We amplified soil-derived cDNA and DNA using the primers 515F (GTGCCAGCMGCCGCGGTAA) and 806R (GGACTACHVGGGTWTCTAAT), targeting the hypervariable V4 region of the 16S ribosomal RNA gene. The purified PCR product of each sample was then pooled in equimolar concentrations in a single tube, and the purified amplicons were sequenced on an Illumina HiSeq2500 (Illumina, San Diego, CA, USA) platform that generated 250 bp paired-end reads.
2.8. Statistical Analyses
A one-way analysis of variance (ANOVA) was applied to detect the differences in the measurements between treatments, and the significance level was set to p < 0.05. The statistical significance between the two treatments was based on an independent sample t-test. The response ratio (r), which was computed as r = Ln (+G:CK), where +G and CK are the values under the glucose addition and control conditions, respectively, was used to quantify the extent of the effect of the glucose addition treatment on the soil physicochemical properties and the microbial community abundance. A correlation analysis was performed using Pearson’s correlation analysis to explore the relationships between PEs and the soil physicochemical properties. Nonmetric multidimensional scaling (NMDS) based on Bray—Curtis distances was used to test the differences in the microbial communities between the glucose addition and CK treatments. Bootstrapping and statistical analyses were performed in R (version 3.3.0 with the stats, nlme, ggplot2, and plyr packages).
3. Results
3.1. Initial Soil Physical and Chemical Properties
Table 1 shows the initial soil physical and chemical properties. S. salsa was observed as having a higher salinity than P. australis, regardless of soil depth (p < 0.05), and the topsoil layer had a higher salinity than the subsoil layer, regardless of vegetation type (p < 0.05), while the pH of S. salsa was greater than that of P. australis (p < 0.05). S. salsa showed a higher TC, but a lower TOC than P. australis, regardless of soil depth (p < 0.05). However, there were no differences in the TOC and DOC between the topsoil and subsoil layers under each vegetation type (p > 0.05). There was no difference in the MBC between the two soil layers of S. salsa (p > 0.05), whereas the topsoil had a higher MBC than the subsoil in P. australis (p < 0.05). The major composition of the soil for both vegetation types was silt, and its proportion was as high as 80%. In addition, the soil from S. salsa had a higher clay content than that from P. australis (p < 0.05).

Table 1.
The initial values of the soil physicochemical properties of topsoil (0–10 cm) and subsoil (20–30 cm) in S. salsa- and P. australis-dominated salt marshes.
3.2. Cumulative Soil CO2 Emissions
In this study, we added 18.75 mg of glucose to each soil sample, resulting in an increase of 46.58% and 63.56% in the TOC content of the topsoil of S. salsa and P. australis, respectively, and an increase of 48.70% and 68.37% in the TOC content of the subsoil of S. salsa and P. australis, respectively. We stopped the experiment after 39 days of incubation because we found that there was no significant difference in the rate of soil CO2 emissions between the two treatments under a given soil layer for both vegetation types and assumed that the added glucose might have been consumed completely. During the experimental period, the rate of soil CO2 emissions did not show obvious changes with time in the soil layer of either S. salsa or P. australis in the control samples (Figure S1). With the addition of glucose, the rate of soil CO2 emissions increased rapidly and reached a maximum on the third day of incubation, and then gradually decreased with time. For the control treatment, the cumulative soil CO2 emissions of S. salsa and P. australis were 13.96 ± 1.53 and 16.00 ± 1.30 mg C kg−1, respectively, in the topsoil and 8.09 ± 0.48 and 8.00 ± 0.72 mg C kg−1, respectively, in the subsoil (Figure 1). The addition of glucose significantly increased the cumulative soil CO2 emissions compared to the control for both soil layers of the two vegetation types (p < 0.05, Figure 1). The cumulative soil CO2 emissions from the topsoil were significantly higher than those from the subsoil for both vegetation types (p < 0.05). Furthermore, there were no significant differences in the cumulative soil CO2 emissions between the two vegetation types for either of the soil layers in the control, while under the glucose addition condition, the cumulative soil CO2 emissions of the two vegetation types showed significant differences in the subsoil, but not the topsoil (Figure 1).
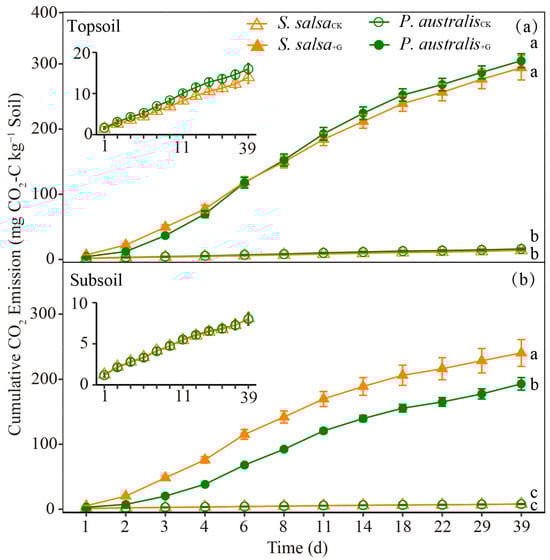
Figure 1.
Cumulative CO2 emissions in the control (CK) and glucose addition treatment (+G) from the topsoil (a) and subsoil (b) layers of the two salt marshes. The inset shows the cumulative CO2 emissions from the CK. The mean values ± SD are shown (n = 4). Different lowercase letters denote significant differences in the cumulative CO2 emissions at the end of the incubation experiment under each soil layer (one-way ANOVA, p < 0.05, Duncan’s multiple range test).
3.3. PEs of Different Soil Layers under Different Vegetation Types
We observed that, under the glucose addition treatment, the mineralization of glucose contributed 65–67% of the total CO2 emissions from the two soil layers of both vegetation types (Figure 2a, Table S1). In the topsoil, there was no difference in CO2 emissions from the glucose sources between the two vegetation types, while the CO2 emissions from the glucose sources were higher in S. salsa than in P. australis in the subsoil (p < 0.05). The addition of glucose significantly increased the mineralization of SOC, resulting in a positive PE for both soil layers of the two vegetation types (Figure 2b). However, the effect of the addition of glucose on the intensity of PEs varied with the vegetation type and soil layer. There was no difference in the PE value of the topsoil between the two vegetation types, while the PE value of S. salsa was significantly higher than that of P. australis in the subsoil (p < 0.05, Figure 2b). Furthermore, we found that the PE value in the topsoil was significantly higher than in the subsoil for both vegetation types (p < 0.05).
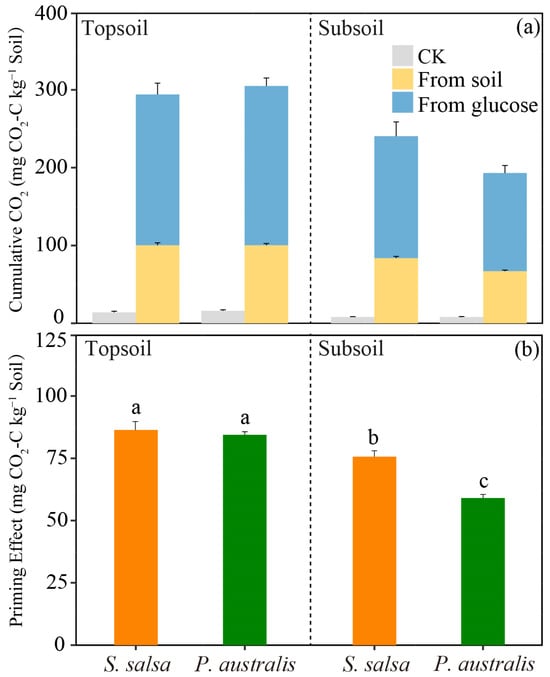
Figure 2.
The cumulative CO2 emissions derived from glucose and soil (a) and the PE intensity in the two soil layers for S. salsa and P. australis (b). The mean values ± SD are shown (n = 4). Different lowercase letters represent significant differences between treatments (one-way ANOVA, p < 0.05, Duncan’s multiple range test).
3.4. Soil Physical and Chemical Properties
S. salsa was observed as having a higher salinity than P. australis in both soil layers (p < 0.05, Table 1); the addition of glucose significantly reduced the soil salinity (EC) of the topsoil, but had no effect on the subsoil of both types of vegetation (Figure 3a). The glucose addition group showed a higher TN than the control in S. salsa, but not in P. australis (Figure 3b), and there was no difference in the TN between the two types of vegetation for a given soil layer under the glucose addition treatment (p > 0.05, Figure 3b). We found that the TC and TOC of S. salsa were significantly lower than those of P. australis in both soil layers (p < 0.05, Figure 3c,d). The addition of glucose increased the content of DOC in the two soil layers of P. australis (p < 0.05), but only increased the DOC of the topsoil for S. salsa (Figure 3e). In addition, the addition of glucose significantly increased the MBC of S. salsa, but had no effect on P. australis. Meanwhile, there was no difference in the MBC between the two vegetation types for a given soil layer under the glucose addition treatment (p > 0.05, Figure 3f). When pooling all the data together, we found that the PE was positively correlated with the initial EC, DOC, and MBC (p < 0.05, Figure 4).
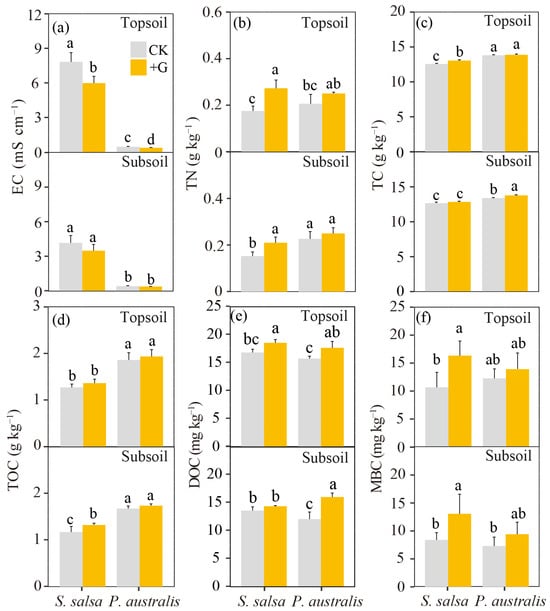
Figure 3.
The final values of soil physicochemical properties in the control (CK) and glucose addition treatment (+G) after the incubation. The mean values ± SD are shown (n = 4). Different letters indicate significant differences between treatments in the same soil layer. (a): electrical conductivity (EC), (b): soil total nitrogen (TN), (c): soil total carbon (TC), (d): soil total organic carbon (TOC), (e): soil dissolved organic carbon (DOC), (f): soil microbial biomass carbon (MBC).
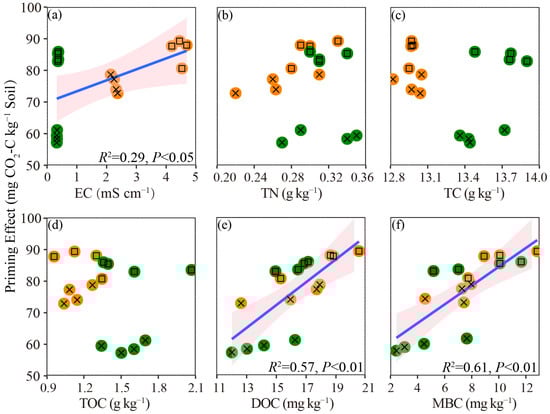
Figure 4.
Relationships between the PEs and the initial soil physiochemical properties (a–f). The blue line represents the fitted ordinary least squares model, with the pink area corresponding to 95% confidence intervals. A yellow circle with a square represents the topsoil of S. salsa, a green circle with a square represents the topsoil of P. australis, a yellow circle with a cross represents the subsoil of S. salsa, and a green circle with a cross represents the topsoil of P. australis.
3.5. Structure of Microbial Community
The soil bacterial α-diversity was measured using two indices: species richness (the observed OTU numbers) and the Shannon diversity (Table 2). Glucose addition cultivation significantly increased the species richness and Shannon diversity of the subsoil of S. salsa and significantly reduced the two soil layers of P. australis (p < 0.05). Additionally, the response ratio of richness and the Shannon index in P. australis after adding glucose were much higher than those of S. salsa (p < 0.05).
Table 2.
Species richness and Shannon diversity of microbial community as well as their response ratio in glucose addition treatment (+G) relative to control (CK) at the end of experiment.
Nine phyla of bacteria were detected by filtering out fewer than 1% of the OTU sequences in this study (Figure S3). For S. salsa, the addition of glucose did not affect the relative abundance of these nine phyla of bacteria in the topsoil (p > 0.05), but it did significantly increase Bacteroidetes in the subsoil (p < 0.05, Figure S4). However, the addition of glucose significantly increased Proteobacteria and Firmicutes, but decreased the others in both soil layers of P. australis (p < 0.05). We classified the soil bacteria into r-strategy and K-strategy taxa according to the reaction speed of the microorganisms [35,36,37] (Figure S4). We found that the relative abundance of r-strategists was higher than that of K-strategists in the two soil layers of both vegetation types. The addition of glucose had no effect on the relative abundance of either type of strategist in S. salsa, while it significantly increased the relative abundance of r-strategists and reduced the relative abundance of K-strategists in P. australis (Figure 5a,b). In addition, S. salsa showed a higher and lower relative abundance of r- and K-strategists than P. australis in the topsoil. However, there was no difference between the two types of vegetation in the relative abundance of either type of strategist in the subsoil. The addition of glucose had no effect on the ratio of r-strategists:K-strategists (r:K) except in the subsoil of P. australis. Furthermore, S. salsa showed a higher r:K ratio than P. australis in both soil layers (Figure 5c).
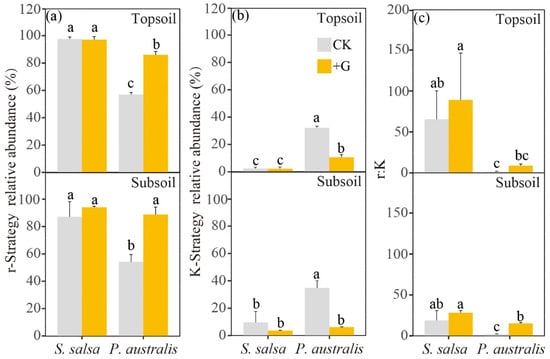
Figure 5.
The relative abundance of r-strategists (a) and K-strategists (b), and their ratio (r/K ratio) (c), in the topsoil and subsoil layers for the two vegetation types. Different lowercase letters represent significant differences between treatments in the same soil layer (one-way ANOVA, p < 0.05, Duncan‘s multiple range test).
4. Discussion
The salt marshes in the Yellow River Delta are a young land that was formed less than 150 years ago [38]. With the influence of tidal currents and river flow, there is a clear gradient distribution of salt marsh species along the coastal zone in the Yellow River Delta [39]. The soils of the salt marshes in this region are often characterized by a low SOC content, but the high productivity of salt marshes indicates a large input of fresh organic carbon via litterfall and root exudates each year [40], which may substantially affect the microbial decomposition processes, and thus, the PEs of different soil layers in different salt marshes. Our research showed that the input of exogenous carbon can promote the mineralization of SOC, resulting in a positive PE in the two soil layers of S. salsa and P. australis. The fresh carbon source brought by a glucose input can stimulate microbial growth and nutrient exploitation to meet their growth needs [41,42], which was confirmed by the correlation between the microbial biomass and the PE in our study. We found that there was no difference in the PEs between the two vegetation types in the topsoil layer, while the PE of S. salsa was significantly higher than that of P. australis in the subsoil layer. Furthermore, the topsoil layer showed a higher PE value than the subsoil layer for both vegetation types. These results highlight that the intensity of PEs depends on the vegetation type and the soil depth in these salt marshes.
4.1. The Dynamics of PEs under the Two Vegetation Types
Plant growth and the development of vegetation can affect the physicochemical characteristics of soil, thus regulating plant–microbe interactions and ultimately affecting the occurrence and intention of PEs [43]. In this study, although the PEs of the topsoil layer did not show a significant difference between the two vegetation types, S. salsa exhibited a higher PE value than P. australis in the subsoil layer. Similarly, Liu et al. [44] reported that the transition of vegetation from meadow to forest significantly decreased the PE in Letzenberg, Germany, and suggested that the phosphorus availability and shifts in the microbial community are important drivers of changes in PEs. Concerning the secondary vegetation succession of natural vegetation from shrublands to forests on farmland in Qinling Mountains, China, Chen et al. [45] found that the PE was generally higher in farmland than in shrubland and forests and suggested that the soil properties, such as the pH and N content, and the substrate quality regulate the variation in the PE during vegetation succession. These results suggest that the vegetation type is a key factor in the regulation of PEs due to their effect on a variety of abiotic and biotic factors. Indeed, when all the data were pooled together, we found a positive relationship between PEs and the soil salinity, DOC, and soil microbial biomass, which suggests that the soil physicochemical properties associated with different vegetation types significantly affect the PE by regulating the soil microbial biomass and activity in these coastal salt marshes. Furthermore, adding glucose resulted in significant changes in the soil microbial community structure (Figure S7), which may be an important factor responsible for the differences in PEs between the vegetation types.
Soil salinity is an important factor that influences the vegetation distribution and growth of salt marshes [46,47]. In topsoil, S. salsa showed a higher salinity than P. australis, indicating that the microorganisms in S. salsa faced greater environmental stress and a greater inhibition of activity. The addition of FOM could have alleviated salt stress by diluting the salt concentration and promoting the activity of microbes [48], which could potentially lead to a greater positive response of the PE in S. salsa. Bastida et al. [43] also found through a meta-analysis that salinity is an important indicator of PEs and has a negative impact on PEs. However, there was no difference in the PEs between the two vegetation types, indicating that other factors might have affected the response. Furthermore, DOC is often considered the most labile portion of organic matter in soil, and its concentration can directly reflect the substrate available for microorganisms [49]. In this study, no differences in the DOC or microbial biomass in the topsoil between the two vegetation types were found, suggesting a similar response of microbial activity in the topsoil layer of the two vegetation types. In addition to microbial activity, the structure of the microbial community is also shaped by the environmental factors in salt marshes [50,51]. Previous studies have proposed that PEs are caused by competition between microbes for energy and nutrients, with fast-growing r-strategists consuming FOM and indirectly stimulating K-strategists to decompose native soil carbon [52,53]. R-strategists have a fast growth rate and a rapid response to the available C and nutrient inputs and typically flourish in environments enriched in labile C, whereas K-strategists are slow-growing and more efficient with recalcitrant C with a lower availability [54,55]. In this study, we found no significant responses in either r- or K-strategy microorganisms after the addition of glucose to the topsoil layer of S. salsa, while the addition of glucose resulted in various responses in the r-strategy microorganisms, but significantly decreased the K-strategy microorganisms in P. australis (Figure 5). We speculated that the different responses of the microbial community structure may partly be the reason for the lack of differences in the PEs between the two vegetation types in the topsoil layer.
In the subsoil layer, the addition of glucose significantly increased the microbial biomass of S. salsa, but did not affect that of P. australis, which suggested that more microbes could have participated in soil carbon mineralization, leading to a higher PE in S. salsa. Furthermore, previous studies have suggested that the responses of different microbial species to added substrates depend on the quality and quantity of the added substrates [56,57]. In the control, there were no significant differences in the carbon mineralization rate in the subsoil layer between the types of vegetation (Table S1). The addition of glucose had no effect on the relative abundance of either r- or K-strategists in S. salsa, but significantly increased the relative abundance of r-strategy microbes and decreased that of K-strategists in P. australis, suggesting that the mineralization rate of native SOC in the subsoil of S. salsa was higher than that of P. australis. Thus, by regulating the biomass and structure of subsoil microorganisms, the addition of glucose leads to a significant difference in the response degree of PEs in the subsoil layers of the two types of vegetation.
4.2. The Topsoil Layer Showed a Higher PE Than the Subsoil Layer in Salt Marshes
In this study, we found that the topsoil exhibited a higher PE value in response to the glucose addition compared to the subsoil in both vegetation types, which suggests that the SOC in the topsoil will turn more rapidly than that in the subsoil in response to FOM inputs in these salt marshes. Similarly, Dai et al. [58] found that the PE value of topsoil, with or without a straw addition, was higher than that of subsoil in conventional cultivated soil in northeast China, which may be due to the higher soil C and N content in the topsoil. However, our findings are in contrast to many previous studies showing that the subsoil tends to produce a higher PE than the topsoil [59,60]. For example, Tian et al. [59] found that the magnitude of the PE in the subsoil was about two times higher than that in the topsoil after providing FOM inputs to a subtropical forest in China, which was associated with a stronger increase in microbial activity in the subsoil. Meanwhile, we found that there was a significant correlation between the PE and microbial biomass in the topsoil, while the PE in the subsoil was positively correlated with the salinity and negatively correlated with the TC and TOC content in the subsoil (Figure S6). Therefore, we suggest that the difference in PEs between the two soil layers might be caused by differences in physicochemical properties and microbial characteristics.
First, the initial salinity of the topsoil was significantly higher than that of the subsoil in both types of vegetation. The addition of glucose may alleviate the salt stress of microbes in the topsoil much more, which could promote microbial activity and the rate of SOM mineralization, leading to a higher value of PE in the topsoil than in the subsoil for both types of vegetation. Second, it is generally accepted that the quality of soil carbon controls the amount of energy available for soil microorganisms and, in turn, the rate of soil carbon mineralization [12]. In this study, there were no differences in the initial value of the TOC and DOC between the two soil layers in both types of vegetation, while we found that the DOC in the topsoil was significantly higher than that of the subsoil under the glucose addition treatment at the end of the experiment (Figure S2) and there was a significant correlation between the PE and the DOC, indicating a greater C source for microbial utilization in the topsoil [61]. Third, although there was no difference in the microbial biomass between the two soil layers in S. salsa, the topsoil showed a higher microbial biomass than the subsoil in P. australis at the beginning of the experiment. Meanwhile, the K-strategists in the topsoil were significantly more abundant than those in the subsoil in P. australis (Figure S5). Furthermore, it was the topsoil, but not the subsoil, that showed a significant correlation between the PE and the microbial biomass, which suggests that, after the input of FOM into soils, microorganisms in the topsoil more quickly increased their activity than in the subsoil, promoting SOC decomposition for the acquisition of energy and nutrients and favoring the occurrence of PEs in the topsoil [62,63]. Overall, the input of FOM has the potential to differentially alter the mineralization rate of native SOC in different soil layers, which could fundamentally change the storage of SOC in different soil layers of salt marshes.
5. Conclusions
In summary, based on systematic measurements of PEs together with soil and microbial properties, this study provides evidence that the input of FOM into soils can produce a positive PE for native SOM mineralization in salt marshes, which could fundamentally change SOM dynamics and lead to the loss of the previously sequestered soil C pool, potentially affecting the function of salt marshes as a long-term C sink. The distinct differences in PEs between the two soil layers and between the two vegetation types were closely associated with the soil properties, such as the salinity and substrate availability, and microbial traits (r- and K-strategists), suggesting that both the soil quality and the microbial community structure and function co-regulate the PE intensity in coastal salt marshes. Our findings provide a fundamental understanding of the response of the PEs of native SOM mineralization in coastal salt marshes, and highlight that the dependence of soil carbon metabolism and stability on PE mechanisms should be considered in Earth system models to accurately predict the soil C dynamics of coastal wetlands under changing environments. In addition, we suggest that further studies on the effects of an FOM input on soil C cycling in coastal wetlands should pay close attention to the SOM composition and quality as well as to changes in enzyme and microbial community structure, as our work uncovered the complex mechanisms driving the response of PEs to FOM inputs in coastal salt marshes. This study experimented using the laboratory incubation method, so caution is also suggested when applying our conclusions in the field due to the occurrence of artificial conditions relating to the use of incubation experiments.
Supplementary Materials
The following supporting information can be downloaded at: https://www.mdpi.com/article/10.3390/soilsystems8010034/s1, Table S1. Cumulative CO2 emissions derived from glucose and soil. Figure S1. The changes in the rate of soil mineralization for the control (CK) and glucose addition treatment (+G) in the topsoil (a) and subsoil (b) layers of the two salt marshes. Figure S2. The final values of soil physicochemical properties in the glucose addition treatment (+G) after the incubation. Figure S3. The relative abundances of different phyla of bacteria in the soil. Figure S4. The response ratio of the relative abundance of dominant bacterial groups at the phylum level at the end of the experiment. Figure S5. The relative abundance of r-strategists (a) and K-strategists (b), and their ratio (r/K ratio) (c), in the topsoil and subsoil layers for the two vegetation types under the glucose addition treatment. Figure S6. The Pearson correlation coefficients between the PEs and the physiochemical properties based on the two vegetation types and the two soil layers. Figure S7. Nonmetric multidimensional scaling (NMDS) ordination of OUT composition of the microbial communities in the CK and glucose addition treatment (+G) based on Bray–Curtis distances.
Author Contributions
Data curation, Y.Z., X.L. and W.S.; writing—original draft, Y.Z.; writing—review and editing, Y.Z., X.L., B.X., X.W., M.Z., G.H., Y.C. and W.S. All authors have read and agreed to the published version of the manuscript.
Funding
This research was supported by the NSFC-Shandong Union Project (U1906220), the National Natural Science Foundation of China (41706097), and the National Key Basic Research and Development Program (2022YFC3105402).
Institutional Review Board Statement
Not applicable.
Informed Consent Statement
Not applicable.
Data Availability Statement
The data are available when required under the responsibility of the corresponding author.
Conflicts of Interest
The authors declare no conflicts of interest.
References
- Lal, R. Soil carbon sequestration impacts on global climate change and food security. Science 2004, 304, 1623–1627. [Google Scholar] [CrossRef]
- Carvalhais, N.; Forkel, M.; Khomik, M.; Bellarby, J.; Jung, M.; Migliavacca, M.; Mu, M.Q.; Saatchi, S.; Santoro, M.; Thurner, M.; et al. Global covariation of carbon turnover times with climate in terrestrial ecosystems. Nature 2014, 514, 213–217. [Google Scholar] [CrossRef]
- Lehmann, J.; Kleber, M. The contentious nature of soil organic matter. Nature 2015, 528, 60–68. [Google Scholar] [CrossRef]
- van Groenigen, K.J.; Osenberg, C.W.; Terrer, C.; Carrillo, Y.; Dijkstra, F.A.; Heath, J.; Nie, M.; Pendall, E.; Phillips, R.P.; Hungate, B.A. Faster turnover of new soil carbon inputs under increased atmospheric CO2. Glob. Chang. Biol. 2017, 23, 4420–4429. [Google Scholar] [CrossRef] [PubMed]
- van Groenigen, K.J.; Qi, X.; Osenberg, C.W.; Luo, Y.Q.; Hungate, B.A. Faster decomposition under increased atmospheric CO2 limits soil carbon storage. Science 2014, 344, 508–509. [Google Scholar] [CrossRef] [PubMed]
- Allison, S.D.; Treseder, K.K. Climate change feedbacks to microbial decomposition in boreal soils. Fungal Ecol. 2011, 4, 362–374. [Google Scholar] [CrossRef]
- Don, A.; Bohme, I.H.; Dohrmann, A.B.; Poeplau, C.; Tebbe, C.C. Microbial community composition affects soil organic carbon turnover in mineral soils. Biol. Fertil. Soils 2017, 53, 445–456. [Google Scholar] [CrossRef]
- Karhu, K.; Alaei, S.; Li, J.; Merila, P.; Ostonen, I.; Bengtson, P. Microbial carbon use efficiency and priming of soil organic matter mineralization by glucose additions in boreal forest soils with different C: N ratios. Soil Biol. Biochem. 2022, 167, 108615. [Google Scholar] [CrossRef]
- Qiao, N.; Schaefer, D.; Blagodatskaya, E.; Zou, X.; Xu, X.; Kuzyakov, Y. Labile carbon retention compensates for CO2 released by priming in forest soils. Glob. Chang. Biol. 2014, 20, 1943–1954. [Google Scholar] [CrossRef] [PubMed]
- Kuzyakov, Y.; Friedel, J.K.; Stahr, K. Review of mechanisms and quantification of priming effects. Soil Biol. Biochem. 2000, 32, 1485–1498. [Google Scholar] [CrossRef]
- Sun, Z.L.; Liu, S.G.; Zhang, T.A.; Zhao, X.C.; Chen, S.; Wang, Q.K. Priming of soil organic carbon decomposition induced by exogenous organic carbon input: A meta-analysis. Plant Soil 2019, 443, 463–471. [Google Scholar] [CrossRef]
- Wang, H.; Xu, W.H.; Hu, G.Q.; Dai, W.W.; Jiang, P.; Bai, E. The priming effect of soluble carbon inputs in organic and mineral soils from a temperate forest. Oecologia 2015, 178, 1239–1250. [Google Scholar] [CrossRef]
- Deng, S.H.; Zheng, X.D.; Chen, X.B.; Zheng, S.M.; He, X.Y.; Ge, T.D.; Kuzyakov, Y.; Wu, J.S.; Su, Y.R.; Hu, Y.J. Divergent mineralization of hydrophilic and hydrophobic organic substrates and their priming effect in soils depending on their preferential utilization by bacteria and fungi. Biol. Fertil. Soils 2021, 57, 65–76. [Google Scholar] [CrossRef]
- Blagodatskaya, E.; Kuzyakov, Y. Mechanisms of real and apparent priming effects and their dependence on soil microbial biomass and community structure: Critical review. Biol. Fertil. Soils 2008, 45, 115–131. [Google Scholar] [CrossRef]
- Chen, R.R.; Senbayram, M.; Blagodatsky, S.; Myachina, O.; Dittert, K.; Lin, X.G.; Blagodatskaya, E.; Kuzyakov, Y. Soil C and N availability determine the priming effect: Microbial N mining and stoichiometric decomposition theories. Glob. Chang. Biol. 2014, 20, 2356–2367. [Google Scholar] [CrossRef] [PubMed]
- Blagodatskaya, E.; Yuyukina, T.; Blagodatsky, S.; Kuzyakov, Y. Three-source-partitioning of microbial biomass and of CO2 efflux from soil to evaluate mechanisms of priming effects. Soil Biol. Biochem. 2011, 43, 778–786. [Google Scholar] [CrossRef]
- Huo, C.F.; Liang, J.Y.; Zhang, W.D.; Wang, P.; Cheng, W.X. Priming effect and its regulating factors for fast and slow soil organic carbon pools: A meta-analysis. Pedosphere 2022, 32, 140–148. [Google Scholar] [CrossRef]
- Kuzyakov, Y. Review: Factors affecting rhizosphere priming effects. J. Plant Nutr. Soil Sci. 2002, 165, 382–396. [Google Scholar] [CrossRef]
- Liu, J.E.; Han, R.M.; Su, H.R.; Wu, Y.P.; Zhang, L.M.; Richardson, C.J.; Wang, G.X. Effects of exotic Spartina alterniflora on vertical soil organic carbon distribution and storage amount in coastal salt marshes in Jiangsu, China. Ecol. Eng. 2017, 106, 132–139. [Google Scholar] [CrossRef]
- Sawada, K.; Inagaki, Y.; Toyota, K. Priming effects induced by C and N additions in relation to microbial biomass turnover in Japanese forest soils. Appl. Soil Ecol. 2021, 162, 103884. [Google Scholar] [CrossRef]
- Xu, Y.; Seshadri, B.; Sarkar, B.; Rumpel, C.; Sparks, D.; Bolan, N.S. Chapter 6-Microbial control of soil carbon turnover. In The Future of Soil Carbon; Garcia, C., Nannipieri, P., Hernandez, T., Eds.; Academic Press: Cambridge, MA, USA, 2018; pp. 165–194. [Google Scholar]
- Fu, X.H.; Song, Q.L.; Li, S.Q.; Shen, Y.F.; Yue, S.C. Dynamic changes in bacterial community structure are associated with distinct priming effect patterns. Soil Biol. Biochem. 2022, 169, 108671. [Google Scholar] [CrossRef]
- Zhang, Z.Y.; Wang, W.F.; Qi, J.X.; Zhang, H.Y.; Tao, F.; Zhang, R.D. Priming effects of soil organic matter decomposition with addition of different carbon substrates. J. Soils Sediments 2019, 19, 1171–1178. [Google Scholar] [CrossRef]
- Schwarz, C.; van Rees, F.; Xie, D.H.; Kleinhans, M.G.; van Maanen, B. Salt marshes create more extensive channel networks than mangroves. Nat. Commun. 2022, 13, 2017. [Google Scholar] [CrossRef] [PubMed]
- Sun, H.M.; Jiang, J.; Cui, L.N.; Feng, W.T.; Wang, Y.G.; Zhang, J.C. Soil organic carbon stabilization mechanisms in a subtropical mangrove and salt marsh ecosystems. Sci. Total Environ. 2019, 673, 502–510. [Google Scholar] [CrossRef] [PubMed]
- Pratolongo, P.; Leonardi, N.; Kirby, J.R.; Plater, A. Chapter 3-Temperate coastal wetlands: Morphology, sediment processes, and plant communities. In Coastal Wetlands, 2nd ed.; Perillo, G.M.E., Wolanski, E., Cahoon, D.R., Hopkinson, C.S., Eds.; Elsevier: Amsterdam, The Netherlands, 2019; pp. 105–152. [Google Scholar]
- Dinter, T.; Geihser, S.; Gube, M.; Daniel, R.; Kuzyakov, Y. Impact of sea level change on coastal soil organic matter, priming effects and prokaryotic community assembly. FEMS Microbiol. Ecol. 2019, 95, fiz129. [Google Scholar] [CrossRef]
- Charles, H.; Dukes, J.S. Effects of warming and altered precipitation on plant and nutrient dynamics of a New England salt marsh. Ecol. Appl. 2009, 19, 1758–1773. [Google Scholar] [CrossRef]
- Bai, J.H.; Zhang, G.L.; Zhao, Q.Q.; Lu, Q.Q.; Jia, J.; Cui, B.S.; Liu, X.H. Depth-distribution patterns and control of soil organic carbon in coastal salt marshes with different plant covers. Sci. Rep. 2016, 6, 34835. [Google Scholar] [CrossRef]
- Sun, J.N.; Yang, R.Y.; Li, Y.N.; Geng, Y.J.; Pan, Y.H.; Zhang, Z.H. Fading positive effect of biochar on cotton yield in a coastal saline soil during a 2-year field trial. J. Soil Sci. Plant Nutr. 2023, 23, 991–1002. [Google Scholar] [CrossRef]
- Han, G.X.; Sun, B.Y.; Chu, X.J.; Xing, Q.H.; Song, W.M.; Xia, J.Y. Precipitation events reduce soil respiration in a coastal wetland based on four-year continuous field measurements. Agric. For. Meteorol. 2018, 256, 292–303. [Google Scholar] [CrossRef]
- IUSS Working Group WRB. World Reference Base for Soil Resources. Interbational Soil Classification System for Naming Soils and Creating Legends for Soil Maps, 4th ed.; International Union of Soil Sciences (IUSS): Rome, Italy, 2022. [Google Scholar]
- Gao, F.L.; Wang, Y.H.; Whitt, A.A.; Wang, H.D.; Ma, C.C.; Guo, H.Y. Belowground responses of Phragmites Australis and Suaeda Salsa to salinity and water depth changes. Pak. J. Bot. 2018, 50, 853–861. [Google Scholar]
- Vance, E.D.; Brookes, P.C.; Jenkinson, D.S. An Extraction Method for Measuring Soil Microbial Biomass-C. Soil Biol. Biochem. 1987, 19, 703–707. [Google Scholar] [CrossRef]
- Li, H.; Yang, S.; Semenov, M.V.; Yao, F.; Ye, J.; Bu, R.C.; Ma, R.; Lin, J.J.; Kurganova, I.; Wang, X.G.; et al. Temperature sensitivity of SOM decomposition is linked with a K-selected microbial community. Glob. Chang. Biol. 2021, 27, 2763–2779. [Google Scholar] [CrossRef] [PubMed]
- Semenov, M.V.; Krasnov, G.S.; Semenov, V.M.; Ksenofontova, N.; Zinyakova, N.B.; van Bruggen, A.H.C. Does fresh farmyard manure introduce surviving microbes into soil or activate soil-borne microbiota? J. Environ. Manag. 2021, 294, 113018. [Google Scholar] [CrossRef] [PubMed]
- Wang, X.X.; Zhang, W.; Zhou, F.; Liu, Y.; He, H.B.; Zhang, X.D. Distinct regulation of microbial processes in the immobilization of labile carbon in different soils. Soil Biol. Biochem. 2020, 142, 107723. [Google Scholar] [CrossRef]
- Luo, X.X.; Wang, L.Y.; Liu, G.C.; Wang, X.; Wang, Z.Y.; Zheng, H. Effects of biochar on carbon mineralization of coastal wetland soils in the Yellow River Delta, China. Ecol. Eng. 2016, 94, 329–336. [Google Scholar] [CrossRef]
- Gong, Z.N.; Zhang, C.; Zhang, L.; Bai, J.H.; Zhou, D.M. Assessing spatiotemporal characteristics of native and invasive species with multi-temporal remote sensing images in the Yellow River Delta, China. Land Degrad. Dev. 2021, 32, 1338–1352. [Google Scholar] [CrossRef]
- Lu, W.Z.; Xiao, J.F.; Liu, F.; Zhang, Y.; Liu, C.A.; Lin, G.H. Contrasting ecosystem CO2 fluxes of inland and coastal wetlands: A meta-analysis of eddy covariance data. Glob. Chang. Biol. 2017, 23, 1180–1198. [Google Scholar] [CrossRef]
- You, M.Y.; He, P.; Dai, S.S.; Burger, M.; Li, L.J. Priming effect of stable C pool in soil and its temperature sensitivity. Geoderma 2021, 401, 115216. [Google Scholar] [CrossRef]
- Thiessen, S.; Gleixner, G.; Wutzler, T.; Reichstein, M. Both priming and temperature sensitivity of soil organic matter decomposition depend on microbial biomass-An incubation study. Soil Biol. Biochem. 2013, 57, 739–748. [Google Scholar] [CrossRef]
- Bastida, F.; Garcia, C.; Fierer, N.; Eldridge, D.J.; Bowker, M.A.; Abades, S.; Alfaro, F.D.; Berhe, A.A.; Cutler, N.A.; Gallardo, A.; et al. Global ecological predictors of the soil priming effect. Nat. Commun. 2019, 10, 3481. [Google Scholar] [CrossRef]
- Liu, H.F.; Banfield, C.; Gomes, S.I.F.; Gube, M.; Weig, A.; Pausch, J. Vegetation transition from meadow to forest reduces priming effect on SOM decomposition. Soil Biol. Biochem. 2023, 184, 109123. [Google Scholar] [CrossRef]
- Chen, Y.C.; Li, W.P.; You, Y.; Ye, C.; Shu, X.; Zhang, Q.F.; Zhang, K.R. Soil properties and substrate quality determine the priming of soil organic carbon during vegetation succession. Plant Soil 2022, 471, 559–575. [Google Scholar] [CrossRef]
- Hou, W.H.; Zhang, R.J.; Xi, Y.B.; Liang, S.X.; Sun, Z.C. The role of waterlogging stress on the distribution of salt marsh plants in the Liao River estuary wetland. Glob. Ecol. Conserv. 2020, 23, e01100. [Google Scholar] [CrossRef]
- Rath, K.M.; Rousk, J. Salt effects on the soil microbial decomposer community and their role in organic carbon cycling: A review. Soil Biol. Biochem. 2015, 81, 108–123. [Google Scholar] [CrossRef]
- Kamble, P.N.; Gaikwad, V.B.; Kuchekar, S.R.; Baath, E. Microbial growth, biomass, community structure and nutrient limitation in high pH and salinity soils from Pravaranagar (India). Eur. J. Soil Biol. 2014, 65, 87–95. [Google Scholar] [CrossRef]
- Campbell, T.P.; Ulrich, D.E.M.; Toyoda, J.; Thompson, J.; Munsky, B.; Albright, M.B.N.; Bailey, V.L.; Tfaily, M.M.; Dunbar, J. Microbial communities influence soil dissolved organic carbon concentration by altering metabolite composition. Front. Microbiol. 2022, 12, 799014. [Google Scholar] [CrossRef] [PubMed]
- Lynum, C.A.; Bulseco, A.N.; Dunphy, C.M.; Osborne, S.M.; Vineis, J.H.; Bowen, J.L. Microbial community response to a passive salt marsh restoration. Estuaries Coasts 2020, 43, 1439–1455. [Google Scholar] [CrossRef]
- Wang, C.; Xiao, R.; Guo, Y.T.; Wang, Q.; Cui, Y.; Xiu, Y.J.; Ma, Z.W.; Zhang, M.X. Changes in soil microbial community composition during Phragmites australis straw decomposition in salt marshes with freshwater pumping. Sci. Total Environ. 2021, 762, 143996. [Google Scholar] [CrossRef]
- Morrissey, E.M.; Mau, R.L.; Schwartz, E.; McHugh, T.A.; Dijkstra, P.; Koch, B.J.; Marks, J.C.; Hungate, B.A. Bacterial carbon use plasticity, phylogenetic diversity and the priming of soil organic matter. ISME J. 2017, 11, 1890–1899. [Google Scholar] [CrossRef]
- Zhang, K.P.; Ni, Y.Y.; Liu, X.J.; Chu, H.Y. Microbes changed their carbon use strategy to regulate the priming effect in an 11-year nitrogen addition experiment in grassland. Sci. Total Environ. 2020, 727, 138645. [Google Scholar] [CrossRef]
- Fontaine, S.; Mariotti, A.; Abbadie, L. The priming effect of organic matter: A question of microbial competition? Soil Biol. Biochem. 2003, 35, 837–843. [Google Scholar] [CrossRef]
- Yang, S.; Wu, H.; Wang, Z.R.; Semenov, M.V.; Ye, J.; Yin, L.M.; Wang, X.G.; Kravchenko, I.; Semenov, V.; Kuzyakov, Y.; et al. Linkages between the temperature sensitivity of soil respiration and microbial life strategy are dependent on sampling season. Soil Biol. Biochem. 2022, 172, 108758. [Google Scholar] [CrossRef]
- Blagodatskaya, E.; Kuzyakov, Y. Active microorganisms in soil: Critical review of estimation criteria and approaches. Soil Biol. Biochem. 2013, 67, 192–211. [Google Scholar] [CrossRef]
- Luu, A.T.; Hoang, N.T.; Dinh, V.M.; Bui, M.H.; Grandy, S.; Hoang, D.T.T. Effects of carbon input quality and timing on soil microbe mediated processes. Geoderma 2022, 409, 115605. [Google Scholar] [CrossRef]
- Dai, S.S.; He, P.; Guo, X.L.; Ge, T.D.; Oliver, M.A.; Li, L.J. Faster carbon turnover in topsoil with straw addition is less beneficial to carbon sequestration than subsoil and mixed soil. Soil Sci. Soc. Am. J. 2022, 86, 1431–1443. [Google Scholar] [CrossRef]
- Tian, Q.X.; Yang, X.L.; Wang, X.G.; Liao, C.; Li, Q.X.; Wang, M.; Wu, Y.; Liu, F. Microbial community mediated response of organic carbon mineralization to labile carbon and nitrogen addition in topsoil and subsoil. Biogeochemistry 2016, 128, 125–139. [Google Scholar] [CrossRef]
- Zhang, M.; Dong, L.G.; Fei, S.X.; Zhang, J.W.; Jiang, X.M.; Wang, Y.; Yu, X. Responses of soil organic carbon mineralization and microbial communities to leaf litter addition under different soil layers. Forests 2021, 12, 170. [Google Scholar] [CrossRef]
- Zhao, Q.Q.; Bai, J.H.; Wang, X.; Zhang, W.; Huang, Y.J.; Wang, L.L.; Gao, Y.C. Soil organic carbon content and stock in wetlands with different hydrologic conditions in the Yellow River Delta, China. Ecohydrol. Hydrobiol. 2020, 20, 537–547. [Google Scholar] [CrossRef]
- Qiu, H.S.; Liu, J.Y.; Chen, X.B.; Hu, Y.J.; Su, Y.R.; Ge, T.D.; Li, D.; Wu, J.S. Rice straw carbon mineralization is affected by the timing of exogenous glucose addition in flooded paddy soil. Appl. Soil Ecol. 2022, 173, 104374. [Google Scholar] [CrossRef]
- Wang, H.; Boutton, T.W.; Xu, W.H.; Hu, G.Q.; Jiang, P.; Bai, E. Quality of fresh organic matter affects priming of soil organic matter and substrate utilization patterns of microbes. Sci. Rep. 2015, 5, 10102. [Google Scholar] [CrossRef]
Disclaimer/Publisher’s Note: The statements, opinions and data contained in all publications are solely those of the individual author(s) and contributor(s) and not of MDPI and/or the editor(s). MDPI and/or the editor(s) disclaim responsibility for any injury to people or property resulting from any ideas, methods, instructions or products referred to in the content. |
© 2024 by the authors. Licensee MDPI, Basel, Switzerland. This article is an open access article distributed under the terms and conditions of the Creative Commons Attribution (CC BY) license (https://creativecommons.org/licenses/by/4.0/).