Geochemical Fingerprint and Soil Carbon of Sandy Alfisols


1
Department of Soil Science, FD Hole Soils Lab, University of Wisconsin-Madison, Madison, WI 53706, USA
2
Department of Geoscience, University of Wisconsin-Madison, Madison, WI 53706, USA
*
Author to whom correspondence should be addressed.
Soil Syst. 2019, 3(3), 59; https://doi.org/10.3390/soilsystems3030059
Submission received: 17 June 2019
/
Revised: 14 August 2019
/
Accepted: 22 August 2019
/
Published: 29 August 2019
Abstract
:Soil carbon storage is affected by particle-size fractions and Fe oxides. We assessed soil carbon concentrations in different particle-size fractions, determined the soil chemical composition of the soil, and weathering and mineralogy of sandy soils of the Wisconsin Central Sands, USA. Three land uses were studied (agriculture, forest, and prairie). The soils contained a minimum of 830 g sand kg−1 up to 190 cm soil depth. Approximately 46% of the sand was in the 250–500 μm fraction, and 5% was <125 μm. Soil carbon ranged from 5 to 13 g kg−1 in the topsoil, and decreased with depth. The <45 μm fraction tended to have high concentrations of carbon, ranging from 19 to 43 g kg−1 in the topsoil. Silicon content was over 191 g Si kg−1, and was lowest in the Bt horizons (191–224 g Si kg−1). Up to 29 g Fe kg−1 and 39 g Al kg−1 were present in the soil, and were highest in the Bt horizons. These soils were mostly quartz, and diopside was found throughout the soil profiles. Weathering indices, such as the Ruxton Ratio, showed that the C horizons were the least weathered and the Bt horizons were more weathered. We conclude that most of the carbon in these soils is held in the <45 μm fraction, and soil carbon and total Fe were lowest in the coarser size fractions.
1. Introduction
More than two-thirds of terrestrial carbon is stored in the top meter of soil [1,2]. Soil carbon storage is affected by particle-size fractions, and plays an important role in soil fertility. Hassink [3] found an increase in the carbon stored in the <20 μm size fraction with an increase in silt + clay content. Soil carbon concentrations (g carbon kg−1 fraction) are often highest in the silt and clay size fractions, and lowest in the sand-size fractions [4,5].
Plant nutrients are stored in soil organic matter and released upon decomposition [6]. When soil carbon concentrations decrease, the concentration of plant nutrients also decreases [7,8,9]. The link between soil carbon and iron oxides is well known, and it is often thought that carbon binds to iron (Fe) oxides through ligand exchange [10]. In some soils, up to 90% of soil carbon is bound to Fe and aluminum (Al) oxides [11]. Heckman et al. [12] found that up to 75% of carbon was bound to organo-metal complexes.
Scanning electron microscopy (SEM) with energy dispersive spectrometry (EDS) has been commonly used to determine the elemental composition in soils, although EDS is not capable of detecting elements lighter than sodium [13]. Using EDS data, it is possible to assess how weathered a soil is using elemental indices [14].
Sandy soils are found throughout the world, primarily in arid to semi-arid regions [15,16]. Approximately 51% of sandy soils occur in Africa, and less than 4% occur in North America [16,17]. Sandy soils generally store low amounts of soil carbon, and have low nutrient levels and water holding capacity [16,18,19,20]. Because of this, sandy soils under agriculture often need irrigation and fertilizer to produce high crop yields [18,21].
The Central Sand Plains covers approximately 6% (8900 km2) of Wisconsin, USA. Much of the soils are intensely cultivated and commonly irrigated, limed, and fertilized. The chemical, physical, and biological components of the soil have changed under agriculture [22]. The carbon stocks are on average 41 Mg carbon ha−1 in the top 30 cm, and this is due to decades nitrogen fertilization and irrigation [23]. The soils under agriculture generally have thicker topsoils (28 cm) than soils under grassland (21 cm) and forest (14 cm) [22]. Madison and Lee [24] determined that quartz was the dominant mineral in the sandy soils of Wisconsin (60 to 96%), and feldspars (orthoclase, plagioclase) were the second most dominant mineral (2 to 12%). The percentage of heavy minerals was low (<3%), and they were primarily opaques (magnetite, hematite, ilmenite, leucoxcene), augite, hornblende, garnet, zircon, and tourmaline [24].
The main research question that will be addressed in this paper is: how is carbon stored in sandy soils? The overall objective of this research is to gain a better understanding of carbon storage, elemental composition, and mineralogy of sandy soils. The objective of the research was to: (i) assess soil carbon concentrations in different particle-size fractions, (ii) determine the soil elemental composition in the bulk and particle-size fractions, and (iii) assess the mineralogy and degree of weathering of these soils.
2. Materials and Methods
2.1. Study Area Description
Three soil pits were dug at a farm in Grand Marsh in the Central Sand Plains of Wisconsin, within an area of 8 ha. The soil pits were under different land use: irrigated agriculture (elevation of 308 m; slope of 0%), grassland (elevation of 308 m; slope of 0.49%), and forest (elevation of 309 m; slope of 1.04%; Figure 1). The water table at the time of sampling was at 190 cm for the soil under grassland and 180 cm for the soil under agriculture. Common crops are potatoes, soybean, and corn. The sampled sites had all been under the same land use (agriculture, grassland, forest) for the past 30 years. All three soils were classified as Richford loamy sand (loamy, mixed, superactive, mesic Arenic Hapludalfs). The soils were developed in outwash, very deep, well drained, and very permeable [25]. The underlying bedrock in the Central Sands is Late Cambrian sandstone, but there are also areas of dolomite and Ordovician shale [20,26].
Monthly climate data (1981 to 2010) was available from the Hancock Experimental Farm (44°7′8” N, 89°32′10” W), approximately 26 km northeast of the study site. The mean yearly temperature was 7 °C. The average temperature between December and March was −6 °C, and 13 °C between April and November. The annual mean precipitation was 832 mm, and the total mean snowfall was 1257 mm [27]. Approximately 84% of the average snowfall falls between December and March. In total, 60% of the rainfall falls during the months of May through September. According to the Köppen-Geiger Climate Classes, the climate regime is classified as Dfb (snow, fully humid, warm summer) [28].
2.2. Soil Sampling and Soil Properties
The soil profiles were described in the field, and soil samples were collected from the center of each horizon to approximately 2 m (Table 1). The samples were air dried in the laboratory and sieved through a 2 mm sieve. Coarse fragments (>2 mm) were determined by weight. Bulk density was collected at each horizon using 100 cm−3 rings and calculated after oven-drying (105 °C).
Soil texture (sand, silt, clay) was analyzed by the pipette method, and particle-size fractions were dry-sieved to six fractions: very coarse sand (1000–2000 μm), coarse sand (500–1000 μm), medium sand (250–500 μm), fine sand (125–250 μm), very fine sand plus silt (45–125 μm), and silt plus clay (<45 μm). A 1:1 soil water ratio was used to analyze the soil pH using an Oakton pH/CON 510 Series meter (Oakton Instruments). The bulk soil and particle-size fractions were ground and analyzed for total carbon using a Flash EA 1112 Series NC Soil Analyzer (Thermo Electron Corporation). Munsell soil color was recorded for the air-dried soil in the laboratory. Total Fe (crystalline plus non-crystalline) was analyzed by citrate dithionite bicarbonate (CDB) extraction, and the absorbance was measured using Ferrozine (C20H13N4NaO6S2) [29] on a Shimadzu UV Mini 1240 spectrometer (λ = 562 nm).
2.3. Elemental Analysis
Air-dried bulk soil samples were scanned using an Olympus Delta Professional Portable X-Ray Fluorescence (pXRF) analyzer. Each soil sample was scanned three times using GeoChem mode and averaged. GeoChem mode analyzes the following elements: Ag, Al, As, Bi, Ca, Cd, Co, Cr, Cu, Fe, Hg, Mg, Mn, Mo, Nb, Ni, P, Pb, Rb, S, Sb, Se, Si, Sn, Sr, Ta, Th, Ti, U, V, W, Y, Zn, and Zr.
A Hitachi S-3400 variable pressure SEM (Hitachi High-Technologies) was used to take images of particle-sized grains with an accelerating voltage of 15 kV. An EDS detector (Oxford x-act 10 mm2 silicon drift detector) was attached to the SEM, and used to determine elemental concentrations (Si, Al, Fe, Ti, Ca, Mg, K, Na) on the surface of each particle-sized grain using Oxford Aztec Version 3.3 software. Fifteen grains were analyzed for each of the particle fractions (10 s scans). All the grains were coated with 20 nm of carbon to avoid surface charging from the microscope. One grain from each B horizon was mapped using the EDS to show the elemental composition of the surface of the grain.
2.4. XRD Analysis
Mineral phases for the <45 μm soil fractions were determined using a Rigaku D/Max Rapid II (RINT RAPID II) diffractometer (XRD) (Rigaku Corporation) with a MoKα micro x-ray source (collimator: 0.1 mm) and a curved two-dimensional imaging plate (2D IP). The XRD was operating at 50 kV and 50 mA, with a scanning mode of 2θ = 2–45° and an exposure time of 30 min. Ground samples were packed into a polyamide tube for analysis. The x-ray diffractograms were analyzed using MDI Jade 9 software. A background correction was performed for each x-ray diffractogram before phase identification using Jade. The phases were identified using the Crystallography Open Database.
2.5. Weathering Indices
Weathering indices were calculated using molecular proportions of the oxides for the bulk soil using the pXRF data [14]. Eleven weathering indices were calculated: Ruxton Ratio (R), Weathering Potential Index (WPI), Product Index (PI) [30], Calcium/Titanium Ratio (CTR) [31], Weather Index of Parker (WIP) [32], Vogt’s Residual Index (V) [33], Silica-Titania Index (STI) [34], and B Index (B) [35]. The weathering index formula, optimum fresh value and weathered value, and the increase in weathering trend is given in Table 2. A detailed description of the weathering indices is found in Price and Velbel [14].
2.6. Statistics
Differences in soil properties were analyzed using a one-way analysis of variance (ANOVA) to determine whether the properties showed the same patterns of response to particle-size fraction, land use, and depth. A multivariable correlation was performed to compare soil properties, and pairwise correlations were performed to determine the significance between properties.
3. Results
3.1. Particle-Size Fractions
Figure 2 shows the distribution of particle-size fractions in the three sandy Alfisols. On average, 46% of the sand was in the 250–500 μm fraction, 29% in the 500–1000 μm fraction, and 15% in the 125–250 μm fraction. Only 5% of the sand was in the 1000–2000 μm fraction, 4% in the 45–125 μm fraction, and 1% in the <45 μm fractions. The different particle-size fractions were the same for each land use.
In the soil under agriculture, the percentages of coarse (500–2000 μm) and fine sand (<500 μm) did not vary with depth (Figure 2). The coarse sand was lowest in the Bw2 (35%) and C horizons (40%), whereas the finer sand was lowest in the C horizon (60%) and highest in the Bw2 horizon (71%). In the soils under grassland and forest, the percentages of coarse and fine sand varied with depth. In the soil under grassland, 29% of the Ap horizon was coarse sand, then decreased to 15% in the Bw horizons, and increased to 45% in the Bt horizons. The fine sand was lowest in the Bt horizons (55%) and highest in the Bw horizons (83%) under grassland. In the soil under forest, 25% of the sand in the Ap and Bw horizons was coarse, and increased to 44–58% in the Bt horizons. The fine sand was lowest in the Bt and C horizons (42–61%) and highest in the Ap and Bw horizons (74–77%). Fine sand was not different between land use or depth.
3.2. Carbon and Iron
3.2.1. Bulk Soil
Total soil carbon varied by depth in the three soil profiles (Table 1). Soil carbon was highest in the Ap horizon: 12.8 g carbon kg−1 under agriculture and grassland, but only 4.7 g carbon kg−1 in the Ap horizon under forest. Soil carbon decreased with depth, and was lowest in the C horizon (0.3 g carbon kg−1). In the soil under grassland, soil carbon was 3.5 g C kg−1 in the Bt1 horizon.
Carbon stocks were calculated using bulk density, horizon thickness, coarse fragments, and carbon concentration (Table 1). Since the data were by horizon, carbon stocks were splined (λ = 0.1) to a standard topsoil depth (0–30 cm). The soil under agriculture had the highest topsoil carbon stock (33 Mg carbon ha−1), and the soil under forest had the lowest topsoil carbon stock (12 Mg carbon ha−1).
Total Fe (CDB extractable) varied by depth in the three soil profiles (Table 1). Total Fe was highest in the Bt horizons, and was highest in the soil under agriculture (23 g kg−1) and lowest in the soil under forest (6 g kg−1). The Ap and C horizons had relatively low total Fe (3–6 g kg−1).
3.2.2. Particle-Size Fractions Carbon
Total soil carbon for each of the particle-size fractions in the three soil profiles is shown in Figure 2. In the topsoil (Ap), there was 12.8 g carbon kg−1 in the bulk soils under agriculture and grassland, but 43.1 g carbon kg−1 and 38.2 g kg−1 in the <45 μm fraction. Similarly, there was only 4.7 g carbon kg−1 in the bulk topsoil under forest and 19.4 g carbon kg−1 in <45 μm fraction. Topsoil carbon was high in the 45–125 μm fraction but low in the larger particle-size fractions (>125 μm).
Total carbon concentrations in the particle-size fractions decreased with depth (Figure 2). In the soil under agriculture, the carbon concentrations were highest in the <45 μm fraction of the Bw horizons (6.5 g carbon kg−1), and slightly lower in the Bt and C horizons (4.7 g carbon kg−1).
Under grassland, the carbon concentrations were highest in the <45 μm fraction of the Bw1 (11.0 g carbon kg−1) and Bt1 horizons (9.7 g carbon kg−1) (Figure 2). Carbon concentrations followed a similar trend in the 45–125 μm fraction. Subsoil carbon concentrations in the 125–1000 μm fractions were below 2.4 g carbon kg−1.
Under forest, carbon concentrations were also highest in <45 μm fraction of the Bw1, Bt1, Bt2, and C horizons. Carbon concentrations in the <45 μm fraction was 7.4 g carbon kg−1 in the Bt2 horizon, and 6.3 g carbon kg−1 in the C horizon, but less than 3.8 g carbon kg−1 in the Bw1, Bw2, and Bt1 horizons. Unlike soils under agriculture and grassland, the 500–1000 and 125–250 μm fractions of the soil under forest had higher carbon concentrations in the Bw2 horizon.
3.2.3. Particle-Size Fractions Iron
The distribution of total Fe (CDB extractable) for each particle-size fraction in the three soil profiles is shown in Figure 2. Similar to soil carbon, total Fe tended to be higher in the smaller fractions (<125 μm). In the topsoil (Ap), there was approximately 4 g Fe kg−1 in the bulk soils under agriculture and grassland, but 42 g Fe kg−1 and 67 g Fe kg−1 in the <45 μm fraction. Similarly, there was 6 g Fe kg−1 in the bulk topsoil under forest but 66 g Fe kg−1 in the <45 μm fraction.
Total Fe concentrations of the particle-size fractions decreased with depth, but increased in the Bt horizons (Figure 2). In the soil under agriculture, total Fe concentrations were highest in the Bt horizon (76–182 g Fe kg−1), and lowest in the Bw and C horizons (<20 g Fe kg−1).
Under grassland, total Fe concentrations were highest in the Bt1 horizon (49–153 g Fe kg−1), and lowest in the C horizon (1–25 g Fe kg−1) (Figure 2). The high Fe concentrations in the Bt horizons are visible in Figure 1 (reddish color). Total Fe concentrations were similar in the Ap and Bw horizons.
Unlike the soils under agriculture and grassland, the total Fe concentrations in the fractions >125 were similar in the Ap and Bw horizons (6–15 g Fe kg−1) and in the Bt horizons (5–23 g Fe kg−1). Total Fe was lowest in the C horizon (3–12 g Fe kg−1). Total Fe was high (>21 g Fe kg−1) in the <125 μm fractions in the Ap, Bw1, and Bt horizons, and was highest in the Bt horizons (>72 g Fe kg−1).
3.3. Elemental Analysis by pXRF and EDS
3.3.1. Bulk Soil (pXRF)
Silicon (Si) was most dominant in the bulk soil in each soil. In general, Si was highest in the C horizon (292 g Si kg−1), and lowest in the Bt horizon (207 g Si kg−1) (Table 3). Silicon concentrations were similar between land uses in the bulk soil.
Under all land uses, Al was highest in the Bt horizons (32–39 g Al kg−1) and lowest in the C horizon (11–18 g Al kg−1; Table 3). The Ap and Bw horizons had between 22 and 32 g Al kg−1 Al. Aluminum and Fe concentrations were similar between land uses. Similar to Al, Fe was highest in the Bt horizons (18–29 g Fe kg−1) and lowest in the C horizons (3–5 g Fe kg−1) under all land uses (Table 3).
Calcium (Ca) concentrations were highest in the soil under agriculture, and significantly different from the soil under grassland (p = 0.0276). Calcium was only present in nine of the soil samples. In the soil under agriculture, CaO was highest in the Ap horizon (15 g Ca kg−1) and lowest in the subsoil (<1 g Ca kg−1; Table 3). In the soil under grassland, Ca was constant with depth (346–533 mg Ca kg−1). In the soil under forest, Ca was less than 1 g Ca kg−1 throughout the profile. Similar to Ca, magnesium (Mg) concentrations were similar between land uses, and ranged from 18 to 29 g Mg kg−1.
3.3.2. Particle-Size Fractions (EDS)
Surface-coated Si varied by depth and fraction (Table 4). The concentrations of Si in the particle-size fractions were similar between land uses. In the soil under agriculture and grassland, Si was lowest in the Bt horizon (284–303 g Si kg−1) and in fractions <125 μm (~313 g Si kg−1), and highest in the 125–500 μm fractions (~360 g Si kg−1; Figure 3). In the soil under forest, Si was highest in the C horizon (387 g Si kg−1) and in the 125–250 μm fraction (375 g Si kg−1), and lowest in the Bt horizon (~310 g Si kg−1) and in the 1000–2000 and <125 μm fractions (~330 g Si kg−1).
The concentrations of surface-coated Al were highest in the soil under grassland, and significantly higher than the soil under agriculture (p < 0.01). Under all land uses, Al varied by depth and fraction (Table 4), and was highest in the Bt horizon (88–99 g Al kg−1) and in the 1000–2000 and <125 μm fractions (~78 g Al kg−1; Figure 3). Aluminum concentrations were lowest in the 125–500 μm fraction (57–62 g Al kg−1). In the soil under agriculture and forest, Al was lowest in the C horizon (40–54 g Al kg−1).
The concentrations of surface–coated Fe were similar between land uses, but Fe varied by depth and fraction (Table 4), and was highest in the Bt horizon (81–98 g Fe kg−1) and in the 45–125 μm fraction (8–10%; Figure 3). Iron concentrations were lowest in the 125–500 μm fraction (~51 g Fe kg−1). In the soil under agriculture and forest, Fe was lowest in the Ap, Bw, and C horizons (39–54 g Fe kg−1), while Fe was lowest in the C horizon (34 g Fe kg−1) in the soil under grassland.
The concentrations of surface-coated Ca were highest in the soil under agriculture, and significantly different from the soil under grassland and forest (p < 0.0001). In the soil under agriculture and grassland, Ca varied by depth and fraction (Table 4). In the soil under agriculture, Ca was highest in the Ap horizon (48 g Ca kg−1) and in the <45 μm fraction (56 g Ca kg−1), and was lowest in the Bw and C horizons (7–16 g Ca kg−1) and in the >45 μm fractions (7–19 g Ca kg−1). Calcium was not detected in the Bt horizon or in the 250–500 μm fraction in many samples. In the soil under grassland, Ca was highest in the C horizon (17 g Ca kg−1) and in the <125 μm fractions (9–11 g Ca kg−1), and lowest in the Ap and B horizons (5–9 g Ca kg−1) and in the 125–1000 μm fractions (4–5 g Ca kg−1).
The concentrations of surface-coated Mg were highest in the soil under agriculture, and significantly different from the soil under grassland and forest (p < 0.001). Under all land uses, Mg varied by depth and fraction (Table 4). In the soil under grassland and forest, Mg was highest in the Bt horizon (5–7 g Mg kg−1), and was highest in the Ap horizon (48 g Mg kg−1) in the soil under agriculture (Figure 3). Magnesium concentrations were highest in the <45 μm fraction (11–56 g Mg kg−1), and between 5 and 11 g Mg kg−1 in the >45 μm fractions.
3.4. Correlations
3.4.1. Bulk Soil (pXRF)
Scanning electron microscope images of the soil particles are shown in Figure 4. Magnesium, Al, Ti, and Fe concentrations decreased when sand content increased (r < −0.54), and increased with an increase in silt and clay content. Silicon decreased with an increase in silt and clay content (r < −0.57), and increased with an increase in sand content (r = 0.80). Bulk density decreased with an increase in soil carbon (r = −0.36) and clay content (r = −0.31). Soil carbon increased with an increase in silt content (r = 0.54) and Ca (r = 0.61). Soil carbon decreased with an increase in sand content (r = −0.35) and coarse fragments (r = −0.55).
3.4.2. Particle-Size Fractions (EDS)
Soil carbon was positively correlated with surface-coated Mg (r = 0.54), K (r = 0.45), Ca (r = 0.57), and Ti (r = 0.36). Soil carbon decreased with an increase in Si in the Ap (R2 = 0.54) and C horizons (R2 = 0.47). In the C horizons of the soils under grassland and forest, soil carbon increased with an increase in K (R2 = 0.70). In the C horizons, soil carbon increased with an increase in Al (R2 = 0.61). In the soil under agriculture, soil carbon increased with an increase in K (R2 = 0.60) and Mg (R2 = 0.60).
3.5. Mineralogy
In the <45 μm fractions, quartz was the dominant mineral. In the soil under agriculture, 66–81% of the peaks were quartz, and it was lowest in the Ap horizon and highest in the Bw1 horizon. The same trends were observed in the soils under grassland and forest. In the soil under grassland, 56–86% of the peaks observed were quartz, and 78–87% of the peaks observed in the soil under forest were quartz.
In most samples, diopside (MgCaSi2O6) was present throughout the soil profile. In the soil under agriculture, dolomite (CaMg(CO3)2) was present in the Ap horizon. In the soil under forest, some goethite (FeO(OH)) was present in the Bt2 and C horizons.
3.6. Weathering Indices
Based on the Ruxton Ratio, the least weathered horizon was the C horizon while the most weathered was the Bt horizon for the soil under agriculture (Table 5). The Ap and Bw horizons were least weathered (optimum fresh value: >10), and the Bt horizons were slightly weathered. The opposite trend was found using weathering indices that included Ca or Mg. The V weathering index showed that the soil profiles were weathered throughout and were slightly more weathered in the C horizon. In the soil under grassland, the most weathered horizon was the Bt and the least weathered was the C horizon based on the Ruxton Ratio, similar to the soil under agriculture. The V weathering index showed that the soils were not weathered. The STI weathering index suggested that the soils under all land uses are slightly weathered (optimum fresh value: >90).
4. Discussion
4.1. Total Carbon
Soil carbon decreased with depth from 5 to 13 g kg−1 in the Ap horizons to less than 1 g kg−1 in the C horizons. Other studies have found comparable results. For example, in sandy soils (Arenosols) from Denmark and Poland, topsoil carbon was up to 38 g kg−1, but less than 2 g kg−1 below 50 cm soil depth [36,37]. Roots and vegetation increase topsoil carbon during decomposition [38], and topsoil carbon may be transported into the subsoil by dissolved organic carbon (DOC), plant roots, and bioturbation [39]. As DOC moves through the profile, some of the DOC is absorbed by the soil particles [39].
Topsoil carbon was highest in the <45 μm fraction (19–43 g kg−1) and lowest in the >125 μm fractions (1–8 g kg−1), which was also reported by Amelung et al. [40], Chivenge et al. [41], Dalal and Mayer [42], Desjardins et al. [43], and Nelson et al. [44]. The silt and clay size fractions are able to store more soil carbon than the sand size fractions [3,42,45] due to the absorption of carbon onto fine sized particles [46,47]. Chivenge et al. [41] found that SOC levels were 1 to 3 g kg−1 in the sand size fraction (53–2000 μm), 5 to 12 g kg−1 in the silt size fraction (5–53 μm), and 35 to 48 g kg−1 in the clay size fraction (<5 μm).
We found that at least 80% of total soil carbon was in the >125 μm fractions in these sandy soils. Amelung et al. [40] found that approximately 43% of total soil carbon was in the <20 μm fraction, and approximately 33% of total soil carbon was in the sand fractions (20–2000 μm). Similarly, Nelson et al. [44] found that 55% to 76% of total carbon was in the clay fraction while 2% to 5% of total soil carbon was in the sand fraction.
4.2. Carbon Storage
Soil carbon was higher in the Bt horizon due to higher levels of Fe, Al, and clay in comparison to the other subsoil horizons. The Bw2 horizon in the soil under agriculture had 1 g carbon kg−1, 5 g Fe kg−1, and 10 g clay kg−1, whereas total carbon, Fe, and clay content increased to 2 g carbon kg−1, 23 g Fe kg−1, and 80 g clay kg−1 in the Bt horizon. Soil carbon, Fe, and Al levels were low in the Bw and C horizons. Soil carbon also increased with an increase in K, Al, and Mg, and decreased with an increase in Si (Figure 5).
Soil carbon is held onto mineral surfaces by clay minerals, Fe oxides and hydroxides, Al hydroxides, and secondary minerals [46,48,49]. In sandy soils in Florida, soil organic matter increased with an increase of Fe2O3 and Al2O3 (r > 0.66), exchangeable Fe and Al increased with an increase in clay content (r > 0.29), and Al associated with crystalline Fe increased with clay content (r = 0.67) [50]. In this study, there was no correlation between carbon and Fe, however, Fe increased with an increase in clay content (R2 = 0.67).
We calculated the percentage of total carbon and total Fe for each particle-size fraction. Although there were high concentrations of total carbon and iron in the <125 μm fractions, much of the carbon and Fe in these soils is stored in the 250–1000 μm fractions (Figure 6). In these soils, over 30% of the total carbon and Fe was present in the 250–500 μm fraction, and over 10% in the 500–1000 μm fractions. Less than 10% of total carbon and Fe was from the <45 μm fraction.
It appears that carbon is being stored in these sandy soils from Fe and clay coating the surface of the soil particles (Figure 7) which are known to assist in the stabilization of soil carbon [51]. Zhao et al. [52] found that the fraction of Fe-bound carbon tends to increase with an increase in sand content, and suggests that Fe plays a large role in carbon storage in sandy soils. They found that less than 20% of total organic carbon was Fe-bound carbon in soils with less than 40% sand, and at least 30% of total organic carbon was Fe-bound carbon in the soils with more than 70% sand [52]. Eusterhues et al. [53] found an increase in organo-mineral carbon with an increase in citrate-dithionite-bicarbonate-soluble Fe and oxalate-soluble Fe. From this research, we found that total carbon increases with an increase in total Fe in the Ap, Bw, and Bt horizons (Figure 8). We cannot prove that soil carbon is directly associated with Fe in these sandy soils. Extractions designed to specifically estimate Fe-bound carbon [12,51,52,54] will be required to directly confirm the association of carbon with Fe oxides.
4.3. Elements, Mineralogy, and Weathering
In these sandy soils, quartz was the dominant mineral, and Si was high throughout the soil profiles (191–297 g Si kg−1). Madison and Lee [22] found that up to 96% of these sandy soils are quartz dominant. The Bt horizons had low Si (191–224 g Si kg−1), and a slightly higher silt and clay content (100–190 g kg−1) than the Ap horizons. The decrease in Si in the Bt horizons suggests a decrease in quartz and an increase in clay minerals such as kaolinite and vermiculite [35,55]. The soil material in the Bt horizons was more weathered than the soils with higher Si based on the Ruxton index.
The second and third most abundant oxides in these sandy soils were Al (11–39 g Al kg−1) and Fe (3–29 g Fe kg−1). Unlike Si, Al and Fe were highest in the Bt horizons (13–18% and 11–14% respectively) due to the accumulation of finer soil particles. The Al and Fe concentrations were lowest in the C horizon (11–18 g Al kg−1; and 3–5 g Fe kg−1) due to little to no clay in the C horizon. Kristiansen [36] and Zhang et al. [50] found that Fe2O3 was highest in the Bt horizon due to an increase in clay and soil carbon content. Goethite was the only Fe oxide present in the diffractograms for the soil under forest, but other studies have showed that these sandy soils may contain up to 12% feldspars and less than 3% Fe oxides, inosilicates (augite), and silicates (hornblende) [22].
Topsoil Ca and Mg concentrations were higher in the soil under agriculture due to regular lime applications. Based on information received from the farmer, 79% of the lime applied was <250 μm (sieve #60), and approximately 65% was <149 μm (sieve #100). From the chemical analysis, the lime was 21% Ca and 10% Mg, and had a Ca carbonate equivalent of 106%. We found that Ca and Mg were much higher in the <45 μm size fraction, and remained slightly higher than the fractions >45 μm in the subsoil. The Ca and Mg in the 45–125 and 125–250 μm fractions were higher than the coarser soil fractions throughout the profile which reflects that the lime was <250 μm.
The Ruxton Ratio (R), product index (PI), and silica-titania index (STI) were the reliable weathering indices for these soils because they only include Si, Al, Ti, and Fe. The R and PI indices showed the C horizon as being the least weathered. The Bt horizons were most weathered due to a lower Si and higher levels of Al, Fe, and Ti. Fertilizer and lime additions to the soils under agriculture affect the use of weathering indices. Indices that include K, Na, Ca, and Mg revealed the topsoil is not weathered. The topsoils under grassland and forest are equally weathered compared the rest of the soil profile using all of the weathering indices.
4.4. Global Soils Database
Soil properties from this study were compared to data from the National Cooperative Soil Survey Soil Characterization Database (NCSS) [56]. The soils selected from the NCSS database had the following properties similar to the data in this study: >800 g sand kg−1, <110 g silt kg−1, <100 g clay kg−1, 1.40 to 1.80 Mg m−3 bulk density, <13 g carbon kg−1, and pH between 4.4 and 7.4.
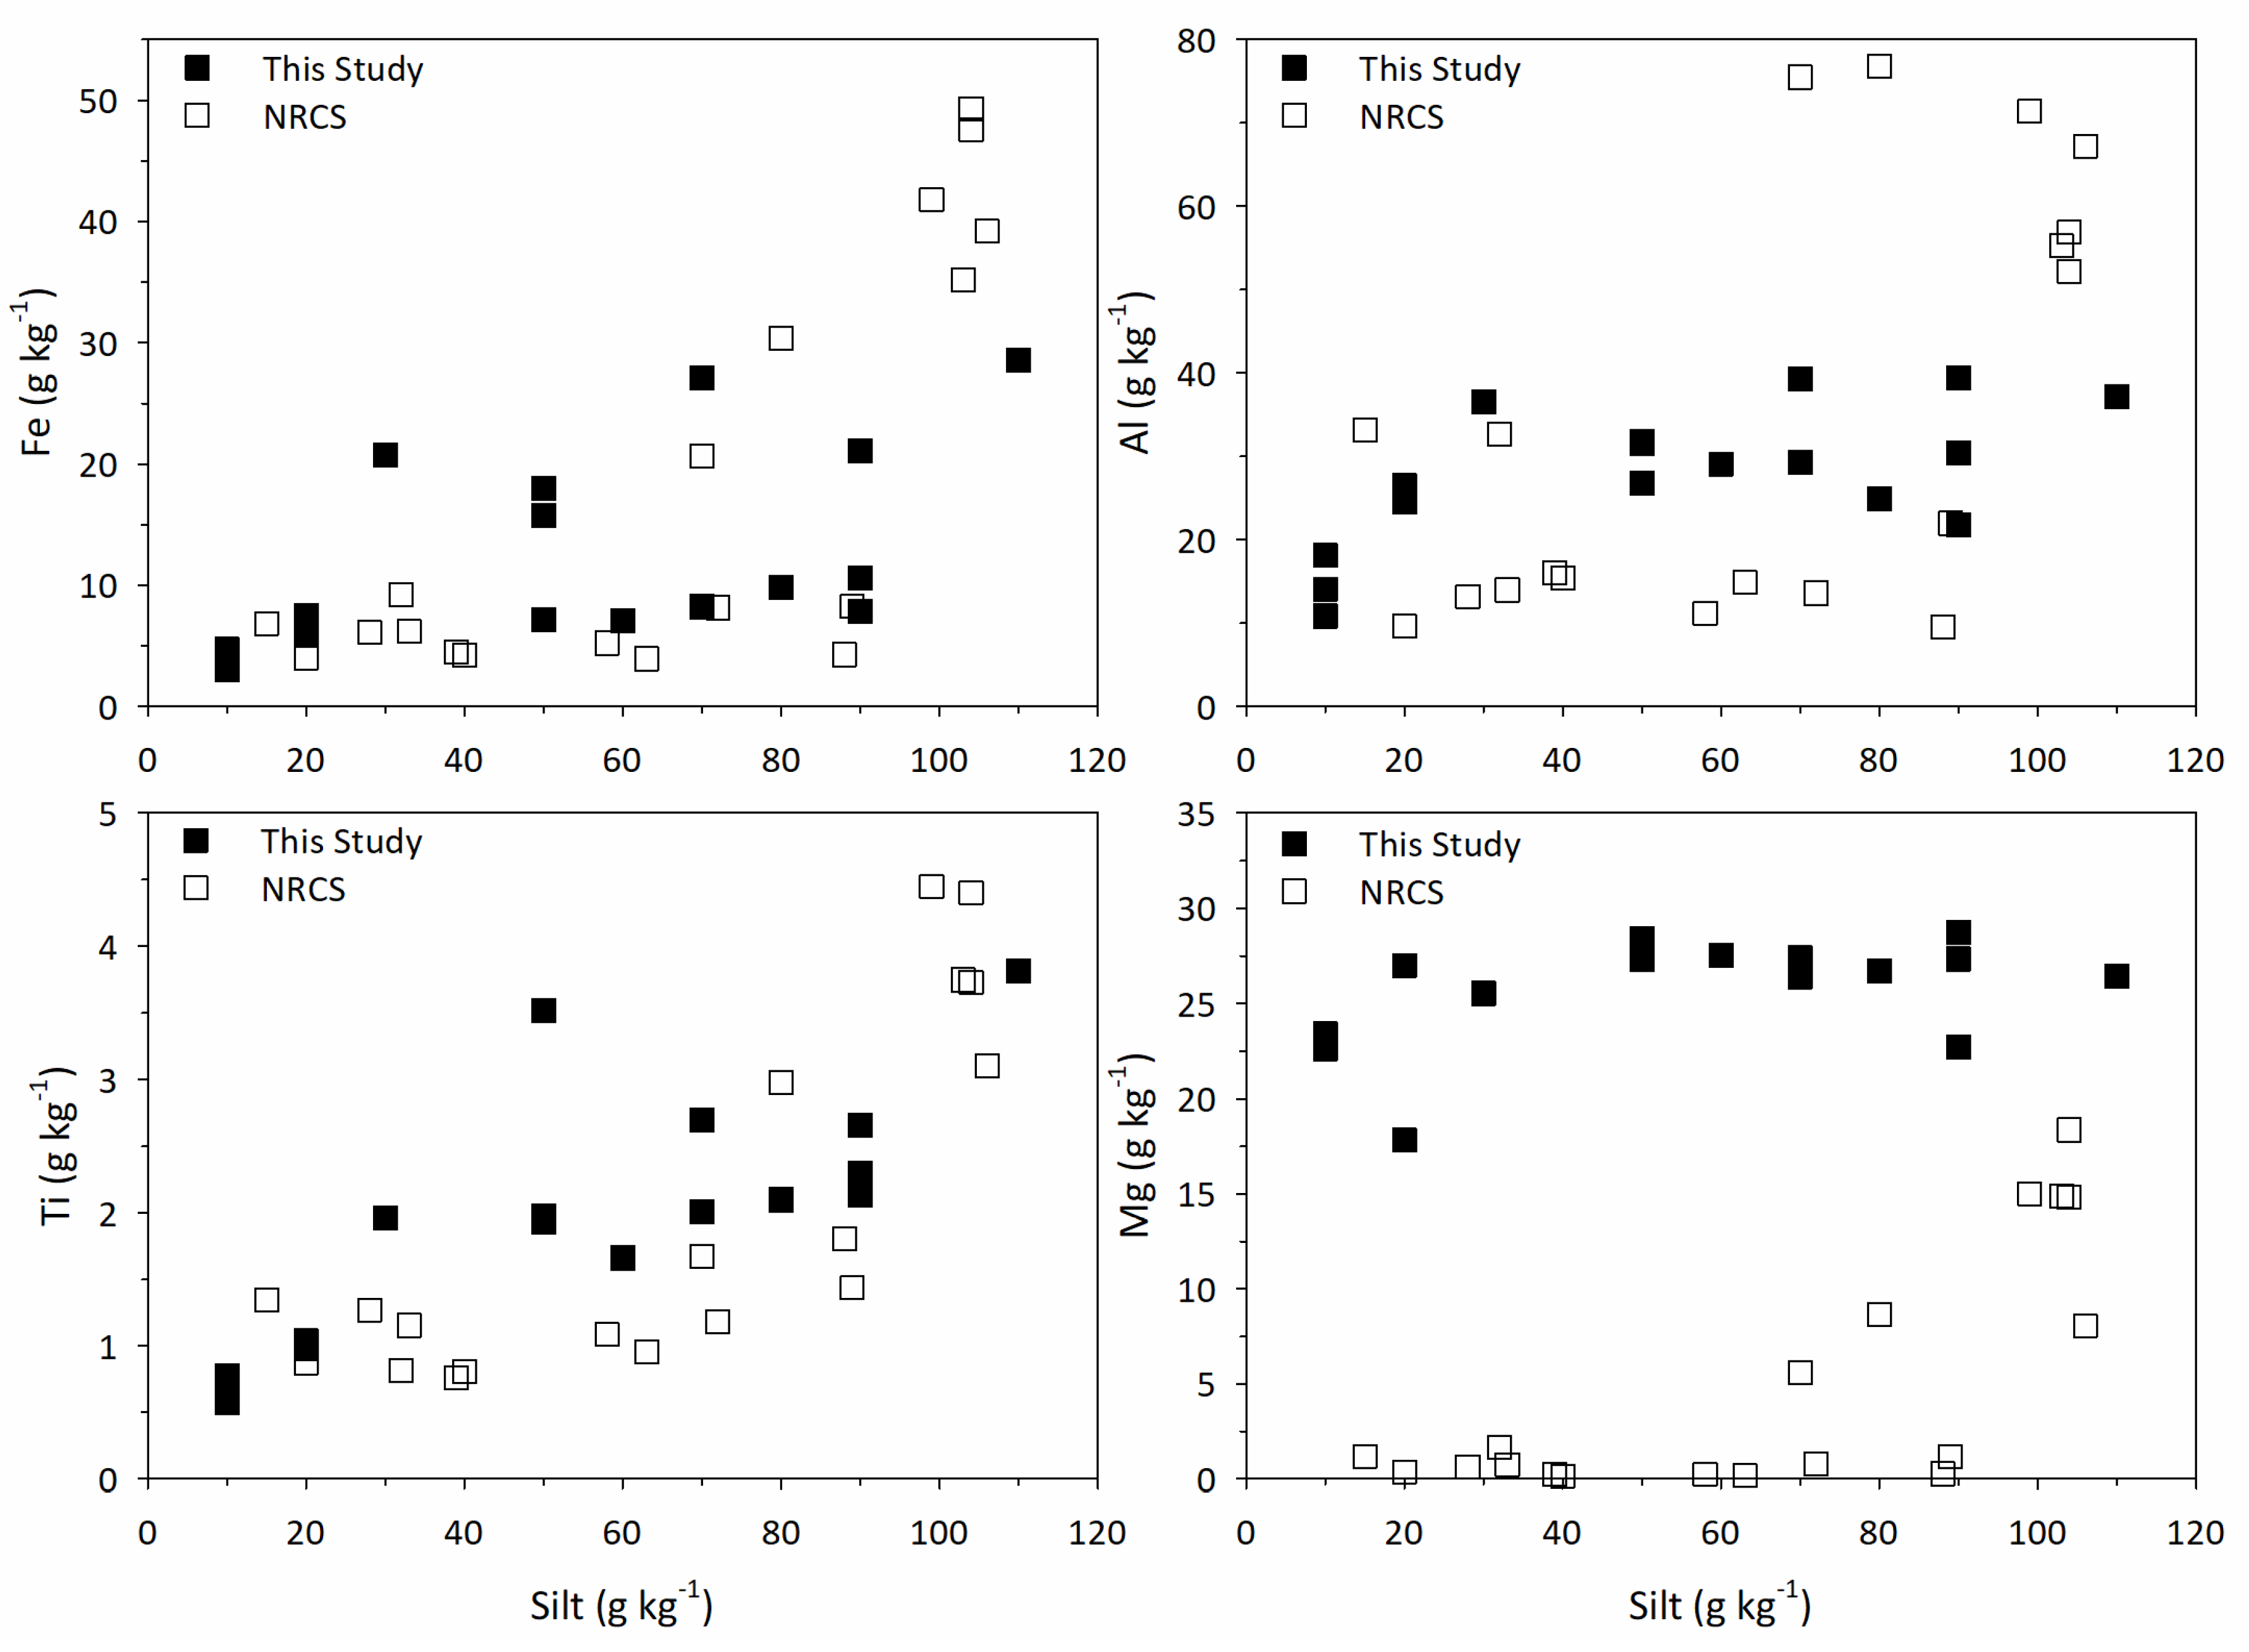
Elemental concentrations were influenced by soil texture. In general, Fe, Al, Ti, and Mg increased with an increase in silt content (NCSS: r > 0.60; pXRF data: r > 0.50) (Figure 9) and decreased with an increase in sand content (NCSS: r < −0.57; pXRF data: r < −0.58). Elemental concentrations (i.e., Fe, Al) from our study had similar trends to the sandy soils of the NCSS database. The difference in Mg concentrations was caused by how they were measured. For this study, pXRF was used, and the NCSS uses wet chemistry to determine elemental concentrations of the weight of the soil.
In this study, Mg, Al, Ti, and Fe decreased when sand content increased, and increased with an increase in silt and clay content. Zhang et al. [50] found that organically bound Fe and Al increased with an increase in silt content (r > 0.24), and exchangeable and amorphous Fe and Al increased with an increase in clay content (r > 0.29) in sandy Spodosols, Alfisols, and Entisols. In sandy Spodosols and Entisols, exchangeable K, Na, Mg, and Ca decreased with an increase in sand content (r < −0.68) and increased with an increase in silt and clay content (r > 0.64) [36].
5. Conclusions
This research aimed to determine how soil carbon is stored in sandy soils. In these soils, approximately 46% of the soil was medium sized sand (250–500 μm). Topsoil carbon was highest in the soils under agriculture and grassland, and was lowest in the soil under forest. Soil carbon and total Fe were highest in the <45 μm fraction and lowest in the coarser size fractions. Although most carbon and Fe were found in the smaller fractions, at least 40% of total carbon and Fe in the soils was found in the 250–1000 μm fractions. Much of the carbon is likely held by Fe oxides coatings on sand grains and clay and silt size particles. Iron and clay were high in the Bt horizons possibly due to mineral weathering. The Ruxton Ratio (R), Product Index (PI), and Silica-Titania Index (STI) were reliable weathering indices for these soils, and the C horizon was least weathered in these soil profiles. Fertilizer and lime additions to soils misrepresent the weathering indices of the soils.
Author Contributions
Conceptualization, J.L.Y. and A.E.H.; Methodology, J.L.Y., E.E.R., and A.E.H.; Formal Analysis, J.L.Y., E.E.R., and A.E.H.; Writing—Original Draft Preparation, J.L.Y. and A.E.H.; Writing—Review and Editing, J.L.Y., E.E.R., and A.E.H.; Project Administration, A.E.H.; Funding Acquisition, E.E.R. and A.E.H.
Funding
This research was partly supported by a Hatch project of the National Institute of Food and Agriculture, United States Department of Agriculture, accession number 1003083.
Acknowledgments
We are grateful to Wallendal Farms for allowing us to collect soil samples from their fields.
Conflicts of Interest
The authors declare no conflict of interest. The funders had no role in the design of the study; in the collection, analyses, or interpretation of data; in the writing of the manuscript, and in the decision to publish the results.
Abbreviations
| B | B Index |
| CTR | calcium/titanium ratio |
| EDS | energy dispersive spectrometry |
| PI | product index |
| pXRF | portable x-ray fluorescence |
| R | Ruxton ratio |
| SEM | scanning electron microscope |
| STI | silica-titania index |
| V | Vogt’s residual index |
| WIP | weather index of Parker |
| WPI | weathering potential index |
| XRD | x-ray diffractometer |
References
- Lal, R.; Kimble, J.M.; Follett, R.F. Pedospheric processes and the carbon cycle. In Soil Processes and the Carbon Cycle; Lal, R., Kimble, J.M., Follett, R.F., Stewart, B.A., Eds.; CRC Press: Boca Raton, FL, USA, 1998. [Google Scholar]
- Stockmann, U.; Adams, M.A.; Crawford, J.W.; Field, D.J.; Henakaarchchi, N.; Jenkins, M.; Minasny, B.; McBratney, A.B.; De Courcelles, V.D.R.; Singh, K.; et al. The knowns, known unknowns and unknowns of sequestration of soil organic carbon. Agric. Ecosyst. Environ. 2013, 164, 80–99. [Google Scholar] [CrossRef]
- Hassink, J. The capacity of soils to preserve organic C and N by their association with clay and silt particles. Plant Soil 1997, 191, 77–87. [Google Scholar] [CrossRef]
- Liang, A.; Yang, X.; Zhang, X.; McLaughlin, N.; Shen, Y.; Li, W. Soil organic carbon changes in particle-size fractions following cultivation of Black soils in China. Soil Tillage Res. 2009, 105, 21–26. [Google Scholar] [CrossRef]
- Gelaw, A.M.; Singh, B.R.; Lal, R. Organic carbon and nitrogen associated with soil aggregates and particle sizes under different land uses in Tigray, Northern Ethiopia. L. Degrad. Dev. 2015, 26, 690–700. [Google Scholar] [CrossRef]
- Staaf, H. Release of plant nutrients from decomposing leaf litter in a south Swedish beech forest. Holarct. Ecol. 1980, 3, 129–136. [Google Scholar] [CrossRef]
- Dick, W.A. Organic carbon, nitrogen, and phosphorus concentrations and pH in soil profiles as affected by tillage intensity. Soil Sci. Soc. Am. J. 1983, 47, 102–107. [Google Scholar] [CrossRef]
- Rhoton, F.E. Influence of time on soil response to no-till practices. Soil Sci. Soc. Am. J. 2000, 64, 700–709. [Google Scholar] [CrossRef]
- Shuman, L.M. Effect of organic matter on the distribution of manganese, copper, iron, and zinc in soil fractions. Soil Sci. 1988, 146, 192–198. [Google Scholar] [CrossRef]
- Schwertmann, U.; Kodama, H.; Fischer, W.R. Mutual interactions between organics and iron oxides. In Interactions of Soil Minerals with Natural Organics and Microbes; SSSA: Madison, WI, USA, 1986; pp. 223–250. [Google Scholar]
- Kalbitz, K.; Solinger, S.; Park, J.-H.; Michalzik, B.; Matzner, E. Controls on the dynamics of dissolved organic matter in soils: A review. Soil Sci. 2000, 165, 277–304. [Google Scholar] [CrossRef]
- Heckman, K.; Lawrence, C.R.; Harden, J.W. A sequential selective dissolution method to quantify storage and stability of organic carbon associated with Al and Fe hydroxide phases. Geoderma 2018, 312, 24–35. [Google Scholar] [CrossRef]
- Buck, B.J.; Brock, A.L.; Johnson, W.H.; Ulery, A.L. Corrosion of depleted uranium in an arid environment: Soil-geomorphology, SEM/EDS, XRD, and electron microprobe analysis. Soil Sediment Contam. 2004, 13, 545–561. [Google Scholar] [CrossRef]
- Price, J.R.; Velbel, M.A. Chemical weathering indices applied to weathering profiles developed on heterogeneous felsic metamorphic parent rocks. Chem. Geol. 2003, 202, 397–416. [Google Scholar] [CrossRef]
- Van Wambeke, A. Soils of the Tropics: Properties and Appraisal; McGraw Hill: New York, USA, 1992. [Google Scholar]
- Yost, J.L.; Hartemink, A.E. Soil carbon in sandy soils – a review. Adv. Agron. 2019, 158. [Google Scholar]
- Hartemink, A.E.; Huting, J. Land cover, extent, and properties of Arenosols in Southern Africa. Arid L. Res. Manag. 2008, 22, 134–147. [Google Scholar] [CrossRef]
- Yost, J.L.; Hartemink, A.E. Effects of carbon on moisture storage in soils of the Wisconsin Central Sands, USA. Eur. J. Soil Sci. 2019, 70, 565–577. [Google Scholar] [CrossRef]
- Soil Survey Staff. Keys to Soil Taxonomy, 12th ed.; USDA-Natural Resources Conservation Service: Washington, DC, USA, 2014.
- WI-DNR. Central Sand Plains Ecological Landscape. In The ecological landscape of Wisconsin: An Assessment of Ecological Resources and a Guide to Planning Sustainable Management; Wisconsin Department of Natural Resources: Madison, WI, USA, 2014; p. 108. [Google Scholar]
- Kraft, G.J.; Clancy, K.; Mechenich, D.J.; Haucke, J. Irrigation effects in the Northern Lake States: Wisconsin Central Sands revisited. Ground Water 2012, 50, 308–318. [Google Scholar] [CrossRef] [PubMed]
- Watson, H.D.; Hartemink, A.E. Rapid changes in sandy soils under intensive agriculture in Wisconsin. Soil Horizons 2015, 56, 1–6. [Google Scholar] [CrossRef]
- Adhikari, K.; Hartemink, A.E. Soil organic carbon increases under intensive agriculture in the Central Sands, Wisconsin, USA. Geoderma Reg. 2017, 10, 115–125. [Google Scholar] [CrossRef]
- Madison, F.W.; Lee, G.B. Some mineralogic characteristics of sandy soils in Wisconsin. Trans. Wisconsin Acad. Sci. Arts Lett. 1965, 54, 223–230. [Google Scholar]
- Otter, A.J.; Simeth, F.J.; Simonson, D.T. Soil Survey of Waushara County, Wisconsin; United States Department of Agriculture: Washington, DC, USA, 1989.
- Colgan, P.M.; Mickelson, D.M. Genesis of streamlined landforms and flow history of the Green Bay Lobe, Wisconsin, USA. Sediment. Geol. 1997, 111, 7–25. [Google Scholar] [CrossRef]
- Arguez, A.; Durre, I.; Applequist, S.; Vose, R.S.; Squires, M.F.; Yin, X.; Heim, R.R., Jr.; Owen, T.W. NOAA’s 1981–2010 U.S. climate normals: An overview. Bull. Am. Meteorol. Soc. 2012, 93, 1687–1697. [Google Scholar] [CrossRef]
- Kottek, M.; Grieser, J.; Beck, C.; Rudolf, B.; Rubel, F. World Map of the Köppen-Geiger climate classification updated. Meterologische Z. 2006, 15, 259–263. [Google Scholar] [CrossRef]
- Stookey, L.L. Ferrozine—A new spectrophotometric reagent for iron. Anal. Chem. 1970, 42, 779–781. [Google Scholar] [CrossRef]
- Ruxton, B.P. Measures of the degree of chemical weathering in rocks. J. Geol. 1968, 76, 518–527. [Google Scholar] [CrossRef]
- Nesbitt, H.W.; Young, G.M. Early proterozoic climates and plate motions inferred from major element chemistry of lutites. Nature 1982, 299, 715–717. [Google Scholar] [CrossRef]
- Parker, A. An index of weathering for silicate rocks. Geol. Mag. 1970, 107, 501–504. [Google Scholar] [CrossRef]
- Vogt, T. Sultijelmafeltets geologi og petrografi. Norges Geol. Unders. 1927, 121, 1–560. [Google Scholar]
- Jayawardena, U.; Izawa, E. A new chemical index of weathering for metamorphic silicate rocks in tropical regions: A study from Sri Lanka. Eng. Geol. 1994, 36, 303–310. [Google Scholar] [CrossRef]
- Kronberg, B.I.; Nesbitt, H.W. Quantification of weathering, soil geochemistry and soil fertility. J. Soil Sci. 1981, 32, 453–459. [Google Scholar] [CrossRef]
- Kristiansen, S.M. Present-day soil distribution explained by prehistoric land-use: Podzol-Arenosol variation in an ancient woodland in Denmark. Geoderma 2001, 103, 273–289. [Google Scholar] [CrossRef]
- Majgier, L.; Rahmonov, O.; Bednarek, R. Features of abandoned cemetery soils on sandy substrates in Northern Poland. Eurasian Soil Sci. 2014, 47, 621–629. [Google Scholar] [CrossRef]
- Jobbágy, E.G.; Jackson, R.B. The vertical distribution of soil organic carbon and its relation to climate and vegetation. Ecol. Appl. 2000, 10, 423–436. [Google Scholar] [CrossRef]
- Rumpel, C.; Kögel-Knabner, I. Deep soil organic matter-a key but poorly understood component of terrestrial C cycle. Plant Soil 2011, 338, 143–158. [Google Scholar] [CrossRef]
- Amelung, W.; Zech, W.; Zhang, X.; Follett, R.F.; Tiessen, H.; Knox, E.; Flach, K.-W. Carbon, nitrogen, and sulfur pools in particle-size fractions as influenced by climate. Soil Sci. Soc. Am. J. 1998, 62, 172–181. [Google Scholar] [CrossRef]
- Chivenge, P.P.; Murwira, H.K.; Giller, K.E.; Mapfumo, P.; Six, J. Long-term impact of reduced tillage and residue management on soil carbon stabilization: Implications for conservation agriculture on contrasting soils. Soil Tillage Res. 2007, 94, 328–337. [Google Scholar] [CrossRef]
- Dalal, R.C.C.; Mayer, R.J.J. Long-term trends in fertility of soils under continuous cultivation and cereal cropping in southern Queensland. III Distribution and kinetics of soil organic carbon in particle-size fractions. Aust. J. Soil Resour. 1986, 24, 293–300. [Google Scholar] [CrossRef]
- Desjardins, T.; Andreux, F.; Volkoff, B.; Cerri, C.C. Organic carbon and 13C contents in soils and soil size-fractions, and their changes due to deforestation and pasture installation in eastern Amazonia. Geoderma 1994, 61, 103–118. [Google Scholar] [CrossRef]
- Nelson, P.N.; Dictor, M.-C.; Soulas, G. Availability of organic carbon in soluble and particle-size fractions from a soil profile. Soil Biol. Biochem. 1994, 26, 1549–1555. [Google Scholar] [CrossRef] [Green Version]
- Gulde, S.; Chung, H.; Amelung, W.; Chang, C.; Six, J. Soil carbon saturation controls labile and stable carbon pool dynamics. Soil Sci. Soc. Am. J. 2008, 72, 605–612. [Google Scholar] [CrossRef]
- Singh, B.P.; Setia, R.; Wiesmeier, M.; Kunhikrishnan, A. Agricultural management practices and soil organic carbon storage. In Soil Carbon Storage; Singh, B.K., Ed.; Academic Press: London, UK, 2018; pp. 207–244. ISBN 9780128127667. [Google Scholar]
- Souza, I.F.; Almeida, L.F.J.; Jesus, G.L.; Kleber, M.; Silva, I.R. The mechanisms of organic carbon protection and dynamics of C-saturation in Oxisols vary with particle-size distribution. Eur. J. Soil Sci. 2017, 68, 726–739. [Google Scholar] [CrossRef]
- Kiem, R.; Knicker, H.; Kögel-Knabner, I. Refractory organic carbon in particle-size fractions of arable soils I: Distribution of refractory carbon between the size fractions. Org. Geochem. 2002, 33, 1683–1697. [Google Scholar] [CrossRef]
- Tahir, S.; Marschner, P. Clay addition to sandy soil—Influence of clay type and size on nutrient availability in sandy soils amended with residues differing in C/N ratio. Pedosphere 2017, 27, 293–305. [Google Scholar] [CrossRef]
- Zhang, M.; Li, Y.C.; Calvert, D.V.; Alva, A.K. Fraction of iron, manganese, aluminum, and phosphorus in selected sandy soils under citrus production. Soil Sci. Soc. Am. J. 1997, 61, 794–801. [Google Scholar] [CrossRef]
- Wagai, R.; Mayer, L.M. Sorptive stabilization of organic matter in soils by hydrous iron oxides. Geochimica 2007, 71, 25–35. [Google Scholar] [CrossRef]
- Zhao, Q.; Poulson, S.R.; Obrist, D.; Sumaila, S.; Dynes, J.J.; Mcbeth, J.M.; Yang, Y. Iron-bound organic carbon in forest soils: Quantification and characterization. Biogeosciences 2016, 13, 4777–4788. [Google Scholar] [CrossRef]
- Eusterhues, K.; Rumpel, C.; Kögel-Knabner, I. Organo-mineral associations in sandy acid forest soils: Importance of specific surface area, iron oxides and micropores. Eur. J. Soil Sci. 2005, 56, 753–763. [Google Scholar] [CrossRef]
- Lalonde, K.; Mucci, A.; Ouellet, A.; Gélinas, Y. Iron promotes the preservation of organic matter in sediments. Nature 2012, 483, 198–200. [Google Scholar] [CrossRef]
- Sudom, M.D.; Arnaud, R.J. Use of quartz, zirconium and titanium as indices in pedological studies. Can. J. Soil Sci. 1971, 51, 385–396. [Google Scholar] [CrossRef]
- National Cooperative Soil Survey. National Cooperative Soil Survey Characterization Database; United States Department of Agriculture: Washington, DC, USA, 2016.
Figure 1.
Horizonation of three sandy Alfisols (loamy, mixed, superactive, mesic Arenic Hapludalfs) under different land use in the Central Sand Plains of Wisconsin, USA.
Figure 1.
Horizonation of three sandy Alfisols (loamy, mixed, superactive, mesic Arenic Hapludalfs) under different land use in the Central Sand Plains of Wisconsin, USA.
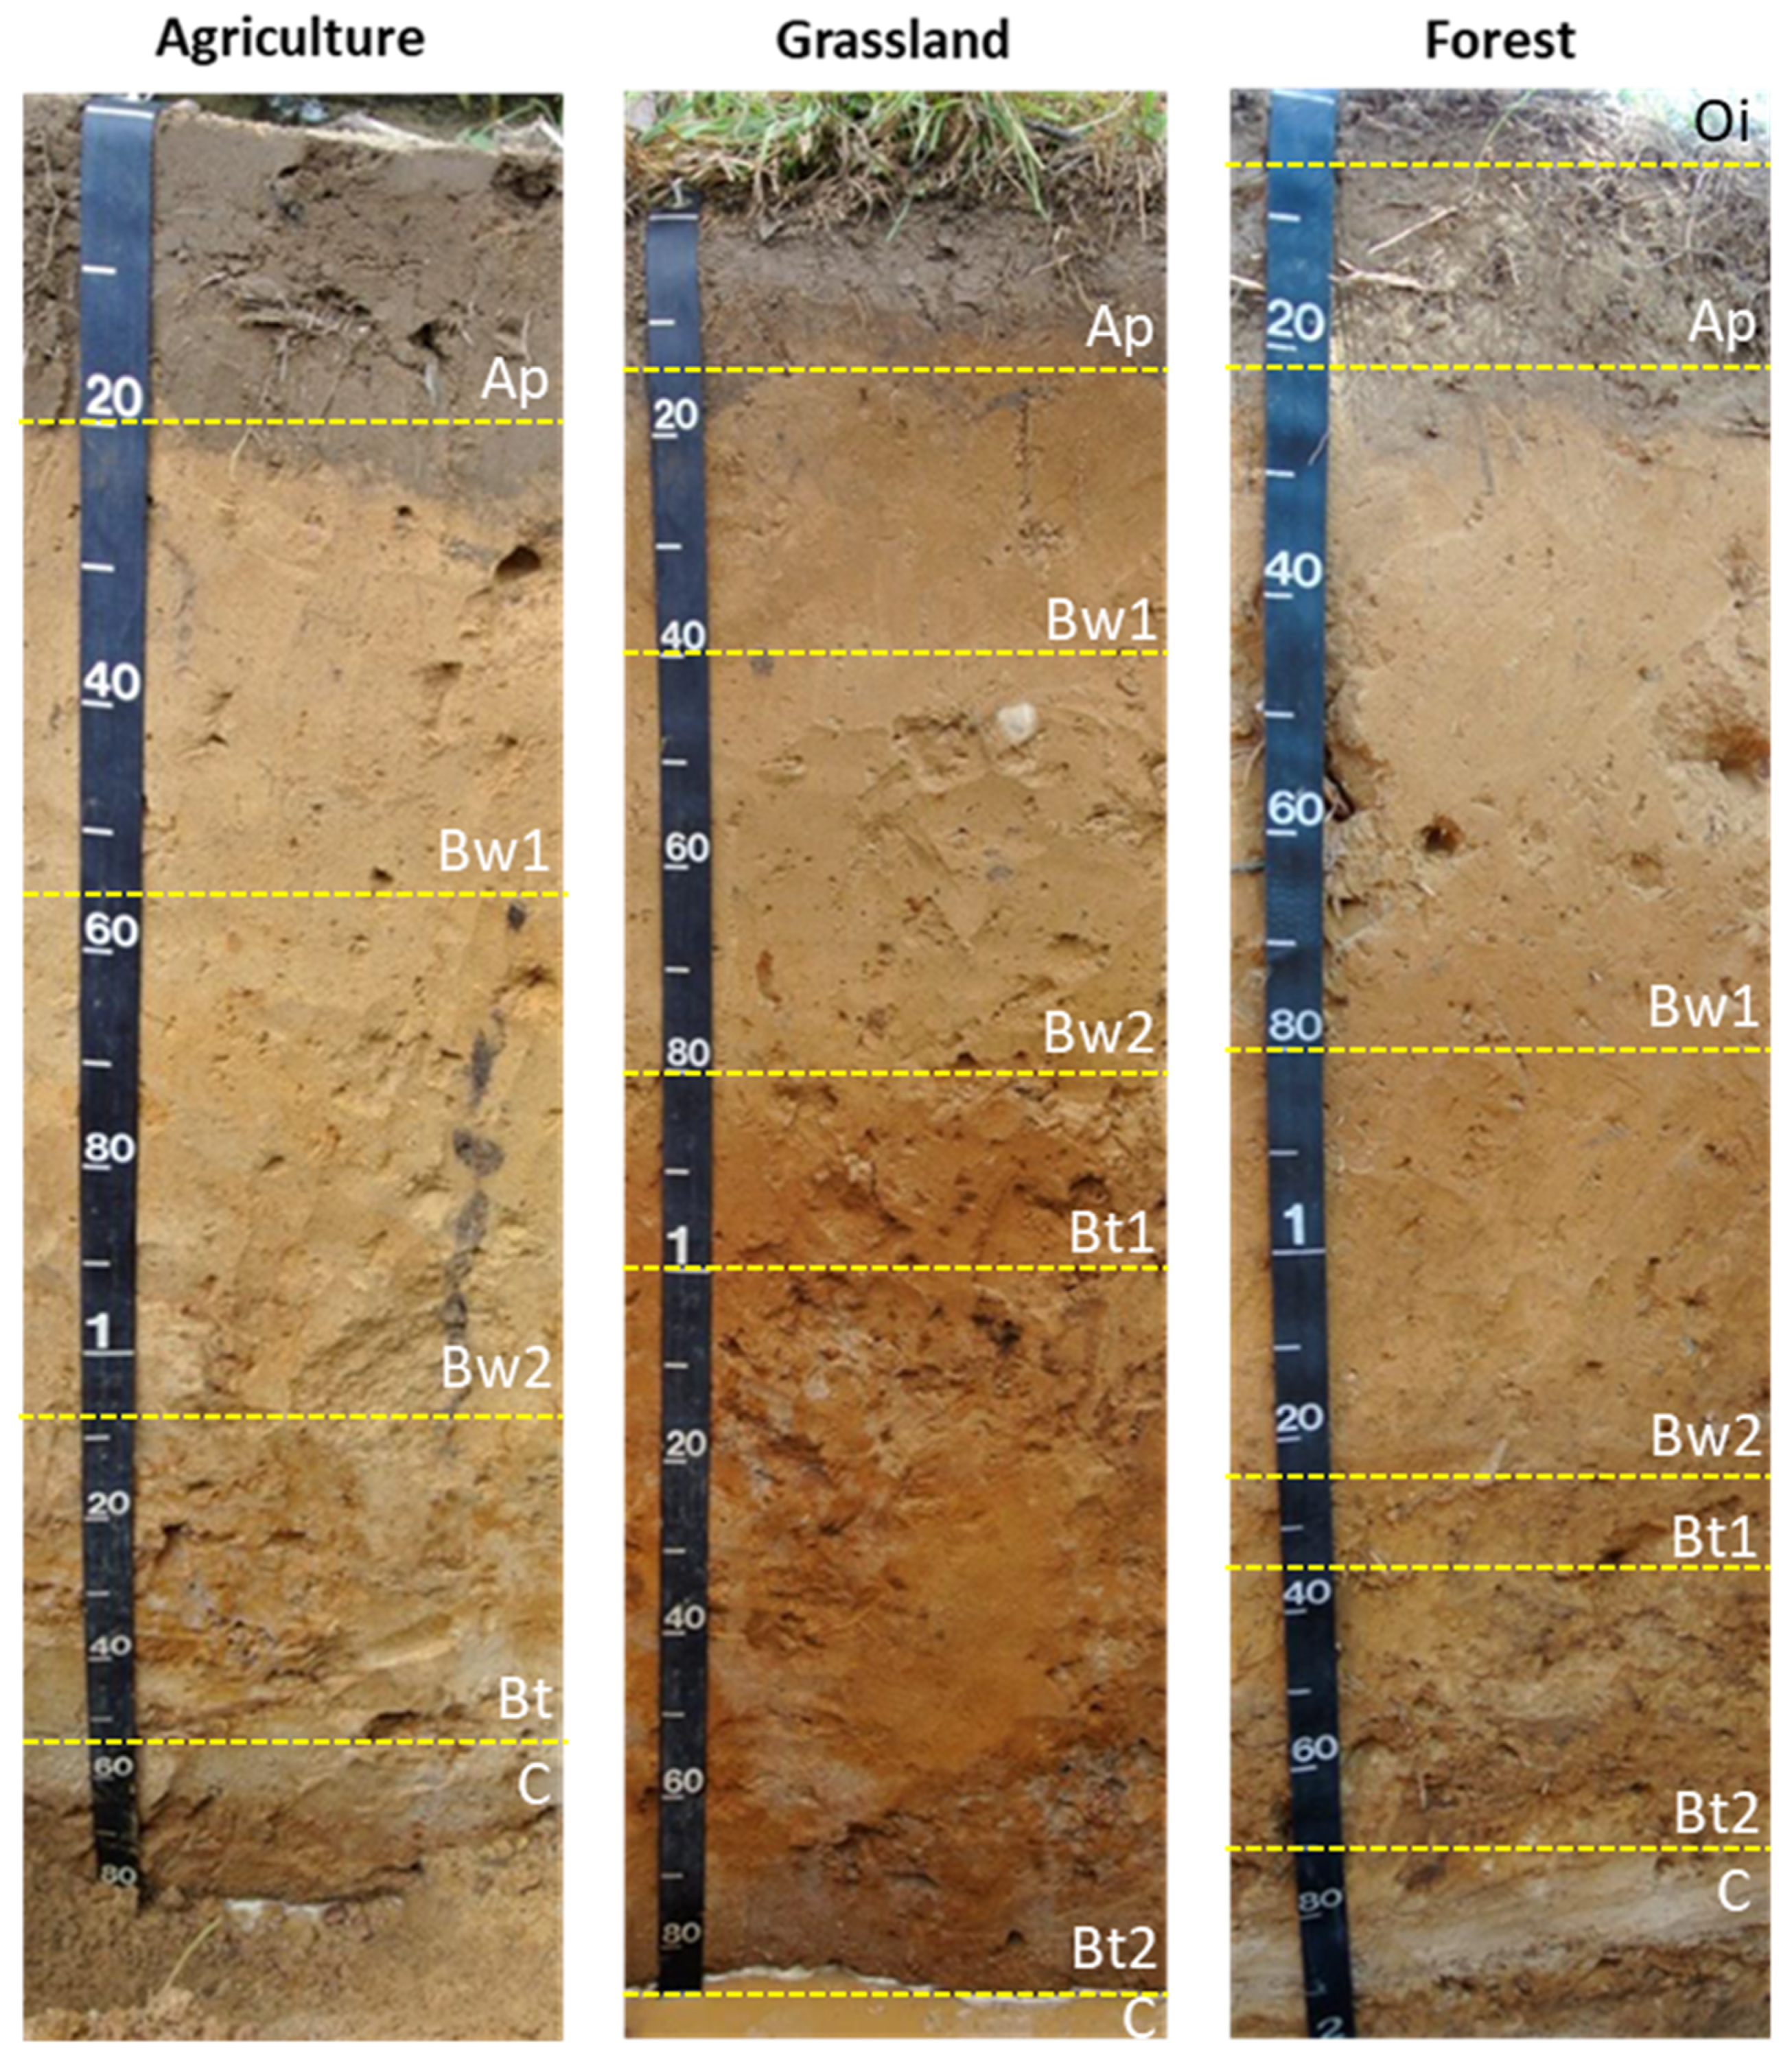
Figure 2.
Particle size distribution, total carbon, and total iron (Fe3+; CDB extractable) for six particle-size fractions (μm) in three sandy Alfisols under different land use. Note different x-axis scales. Due to low amounts of <45 μm soil samples, total iron was not analyzed for all samples.
Figure 2.
Particle size distribution, total carbon, and total iron (Fe3+; CDB extractable) for six particle-size fractions (μm) in three sandy Alfisols under different land use. Note different x-axis scales. Due to low amounts of <45 μm soil samples, total iron was not analyzed for all samples.

Figure 3.
Surface-coated elemental concentrations (by EDS) for the six particle-size fractions of three sandy Alfisols under different land use. Note different x-axis scales for Ca and Mg.
Figure 3.
Surface-coated elemental concentrations (by EDS) for the six particle-size fractions of three sandy Alfisols under different land use. Note different x-axis scales for Ca and Mg.
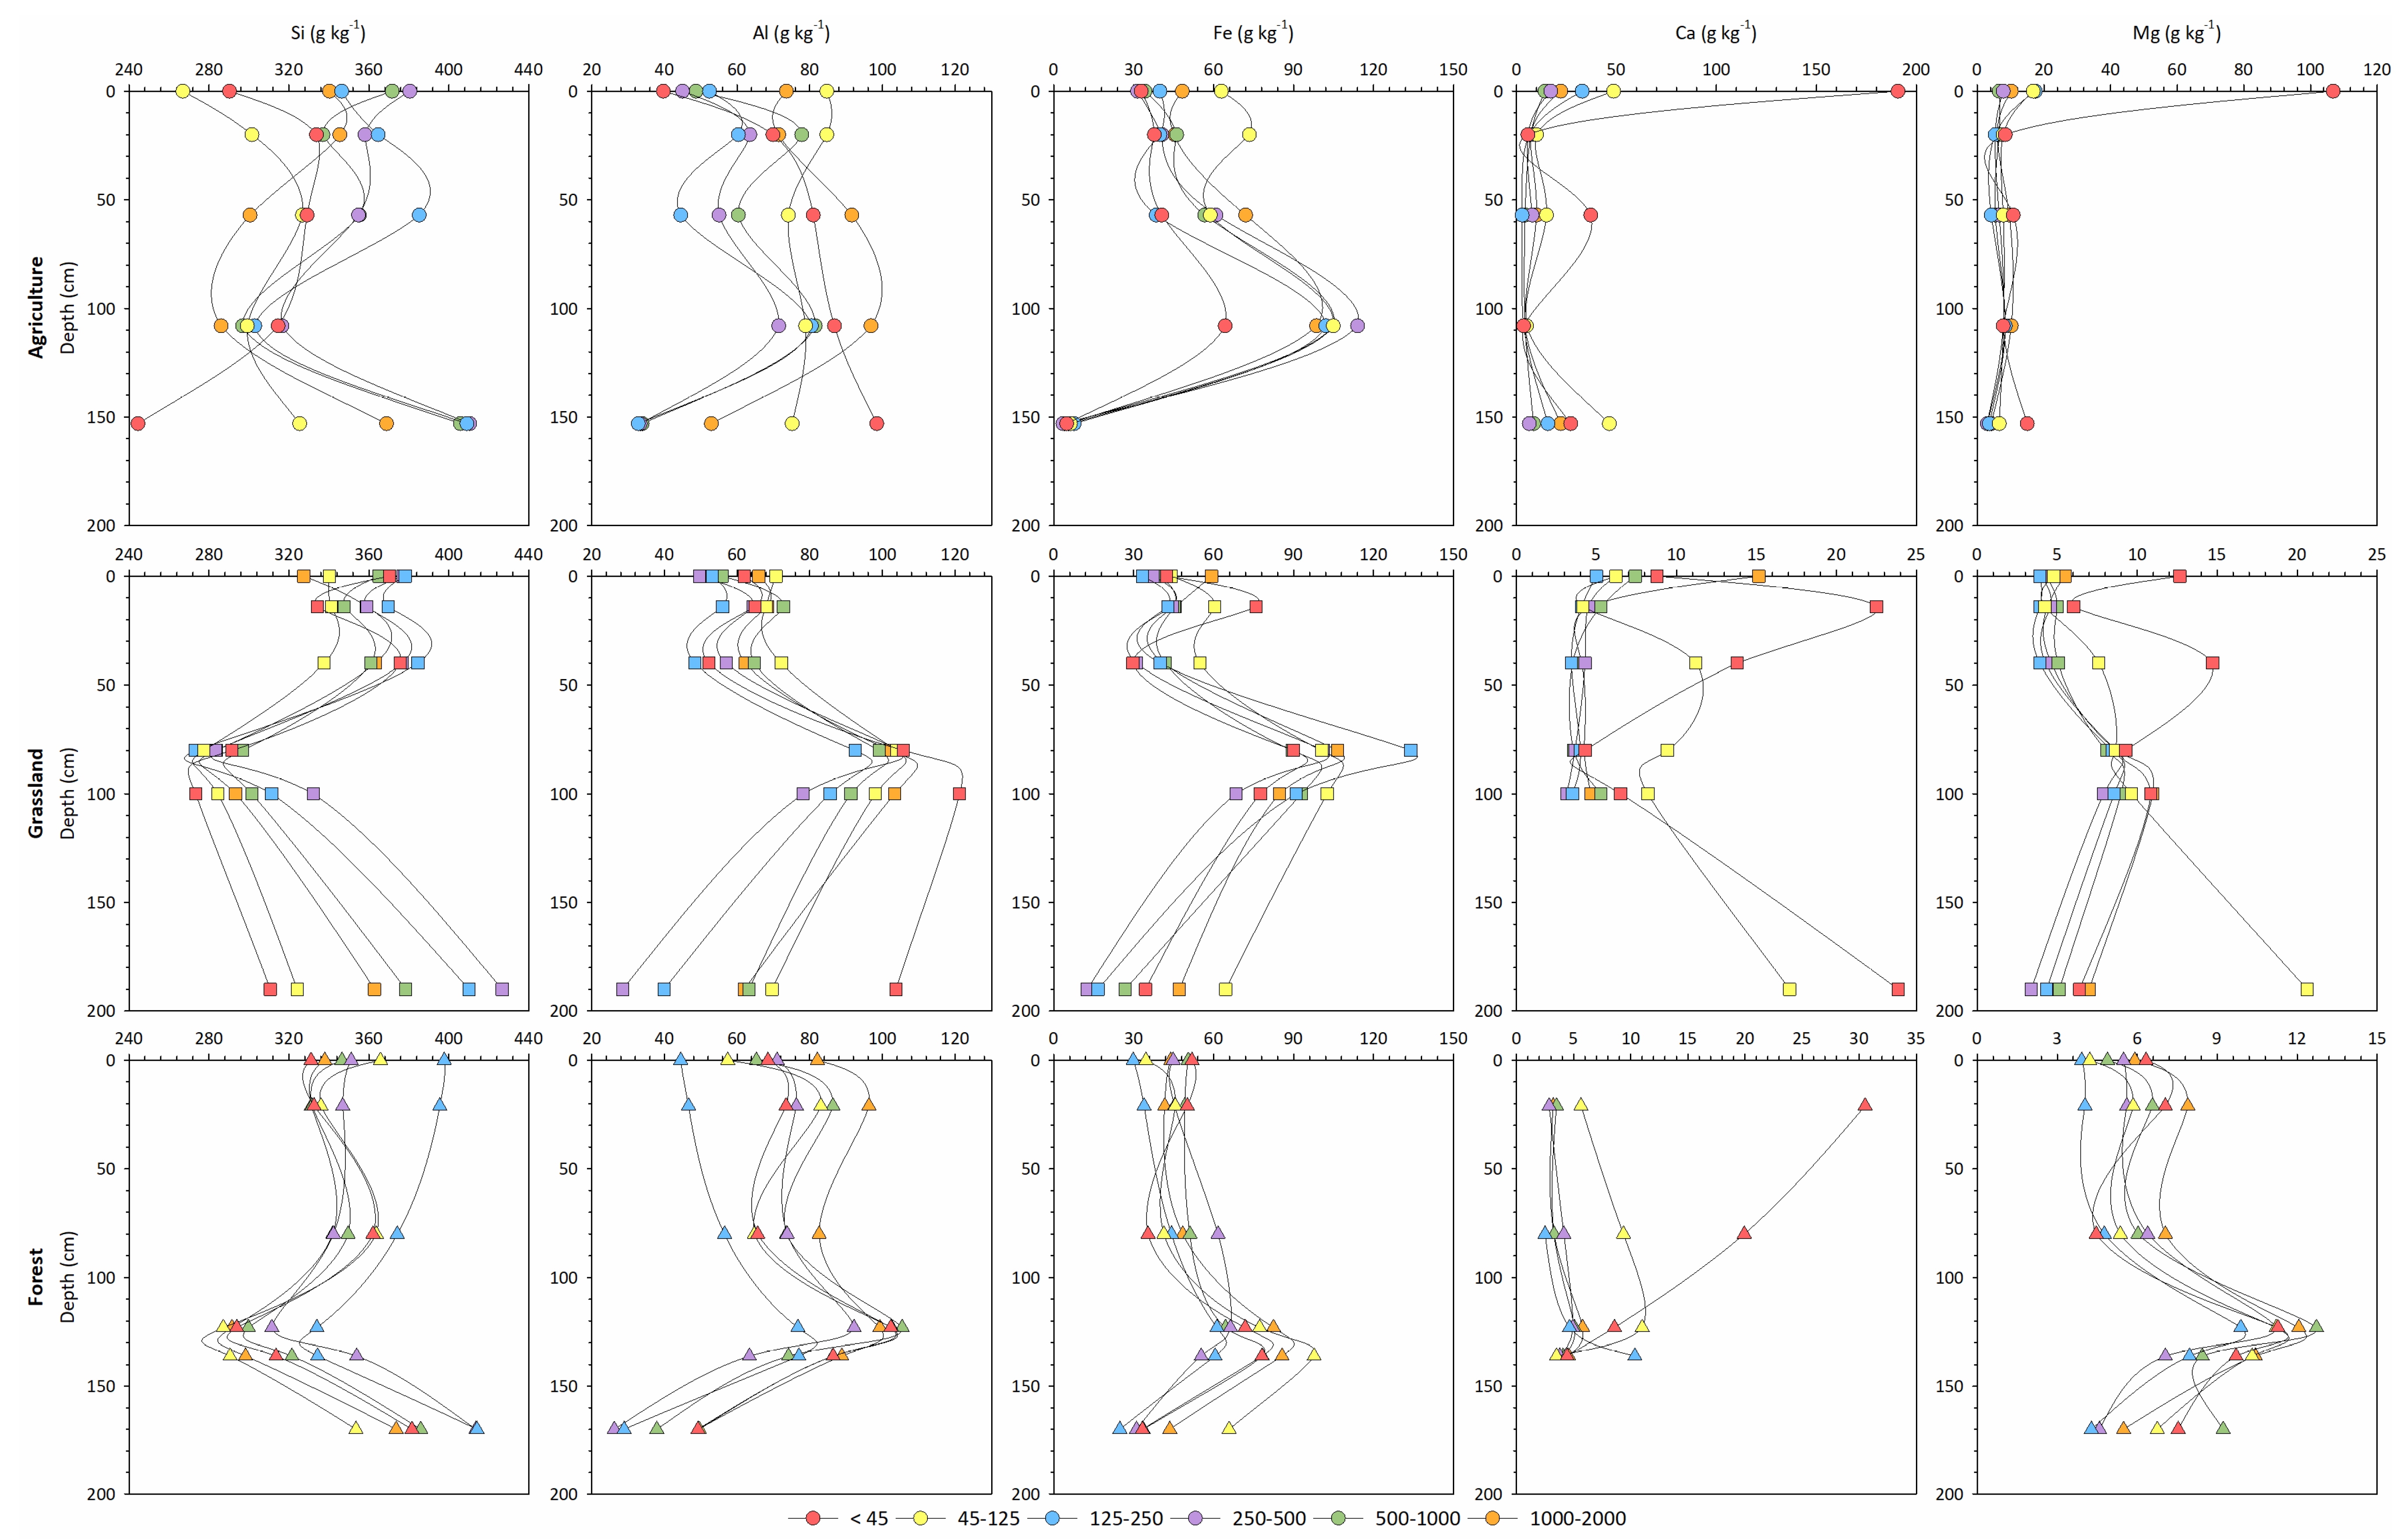
Figure 4.
SEM images of particle-size grains of different soil horizons from three sandy Alfisols under different land use.
Figure 4.
SEM images of particle-size grains of different soil horizons from three sandy Alfisols under different land use.
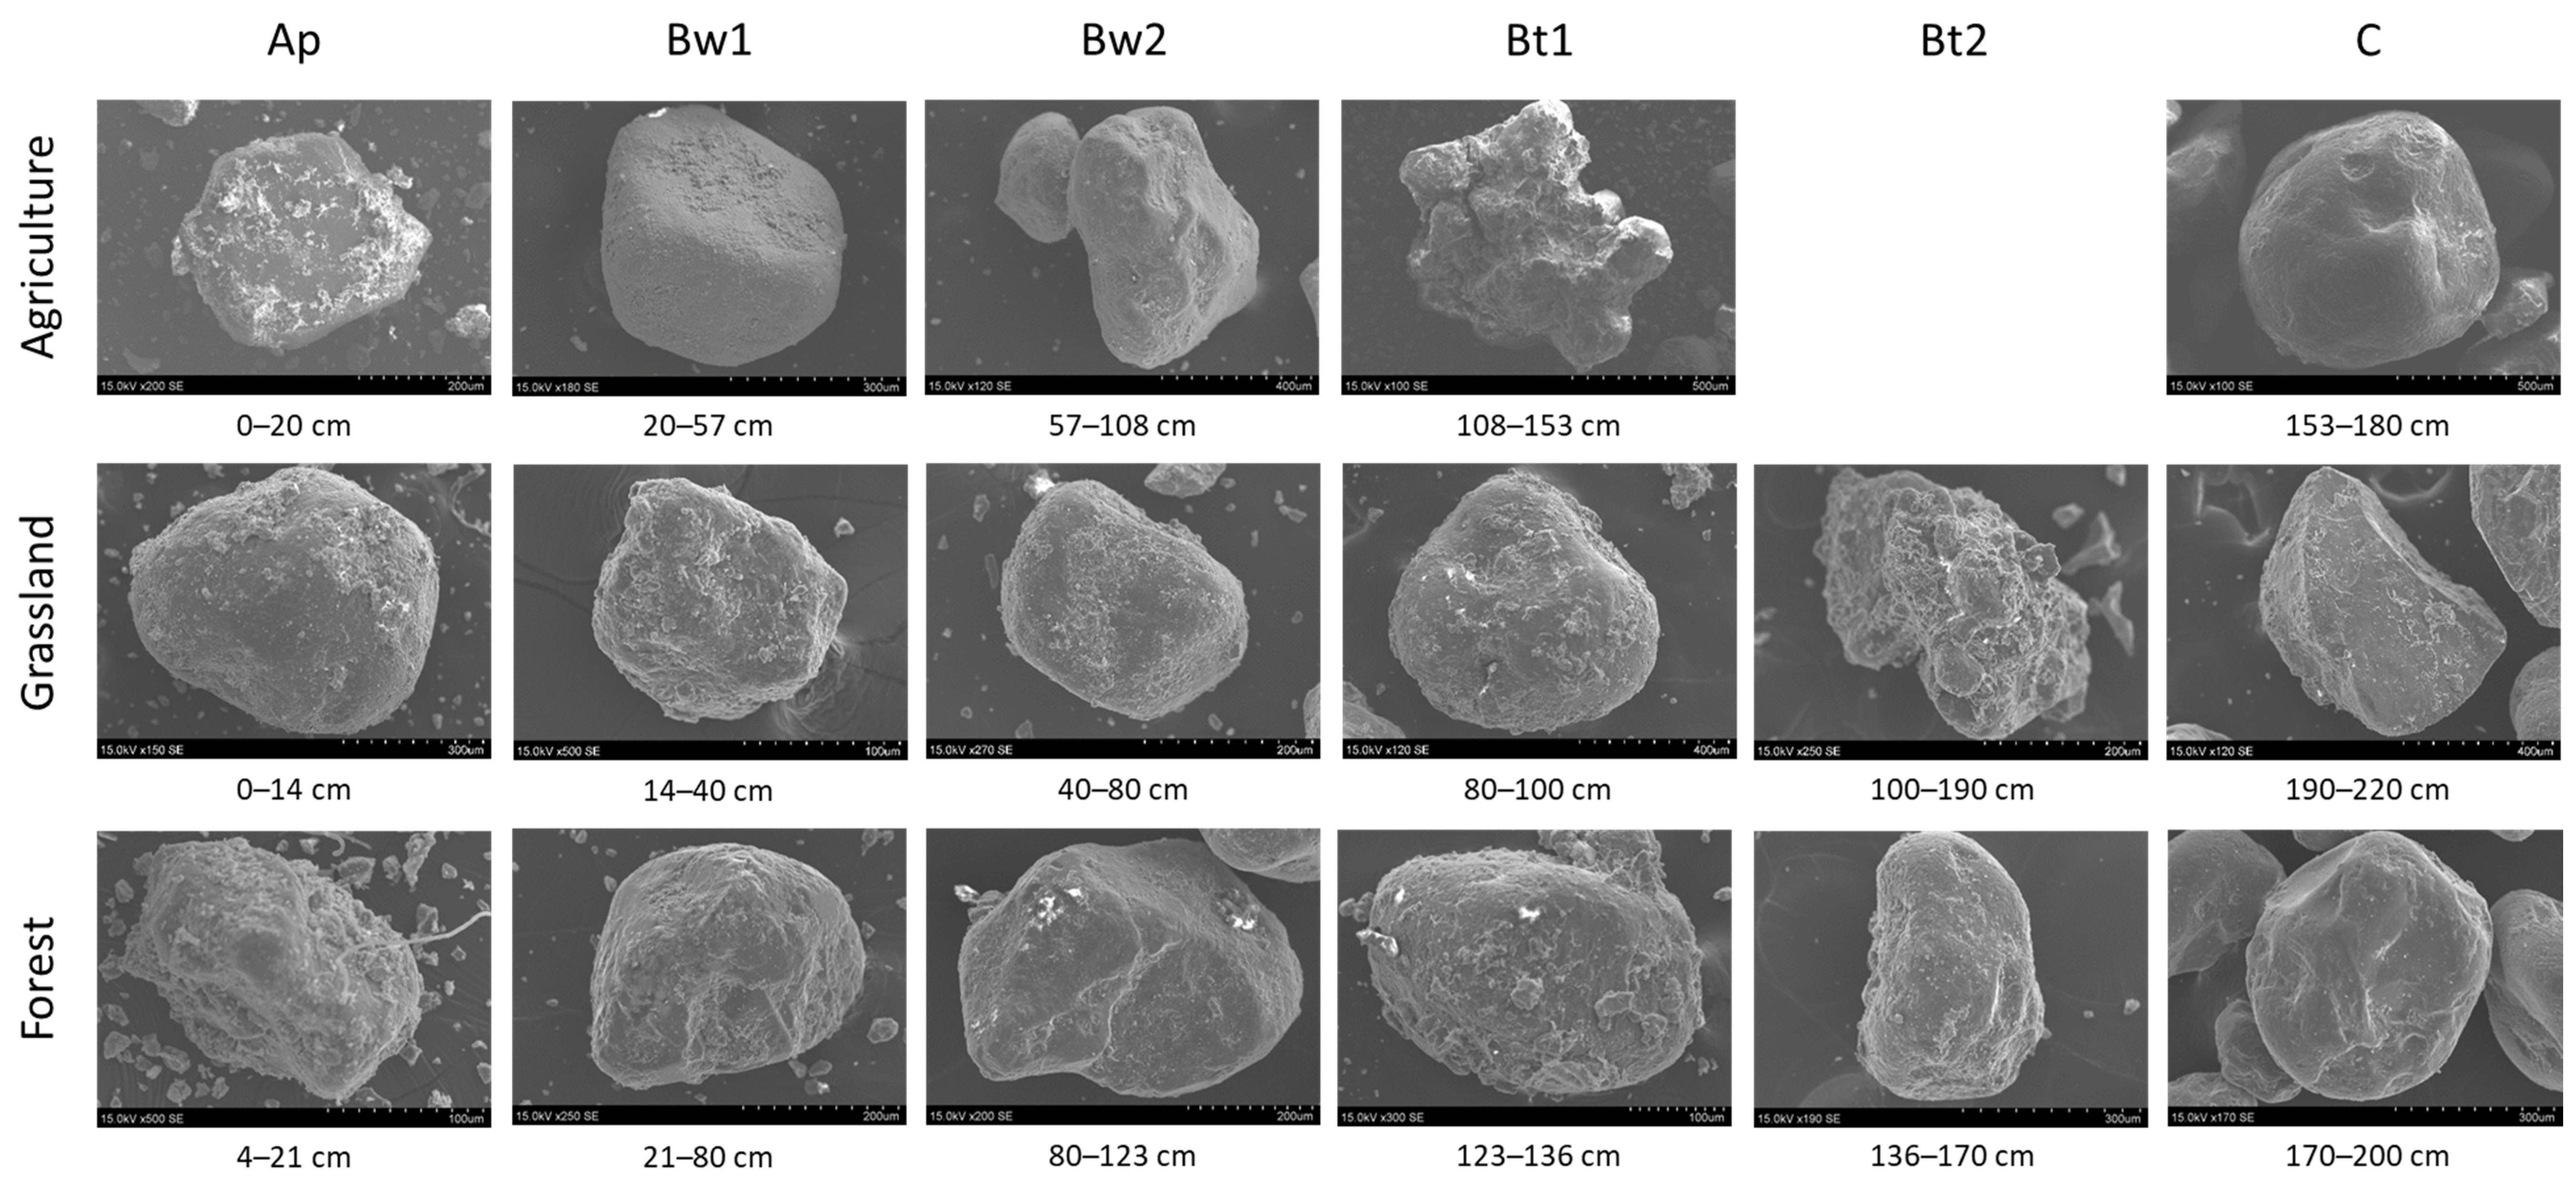
Figure 5.
Relationships between soil carbon and Si, K, Al, and Mg in the different particle sizes by horizon and land use using EDS data. Line represents linear fit.
Figure 5.
Relationships between soil carbon and Si, K, Al, and Mg in the different particle sizes by horizon and land use using EDS data. Line represents linear fit.

Figure 6.
Percentage of bulk soil for particle size distribution, total carbon, and total iron (Fe3+; CDB extractable) in each fraction (μm) of the horizons of three sandy Alfisols under different land use.
Figure 6.
Percentage of bulk soil for particle size distribution, total carbon, and total iron (Fe3+; CDB extractable) in each fraction (μm) of the horizons of three sandy Alfisols under different land use.

Figure 7.
Iron coating of the surface of soil particles from the Bw soil horizons under different land use (SEM-EDS images and data).
Figure 7.
Iron coating of the surface of soil particles from the Bw soil horizons under different land use (SEM-EDS images and data).
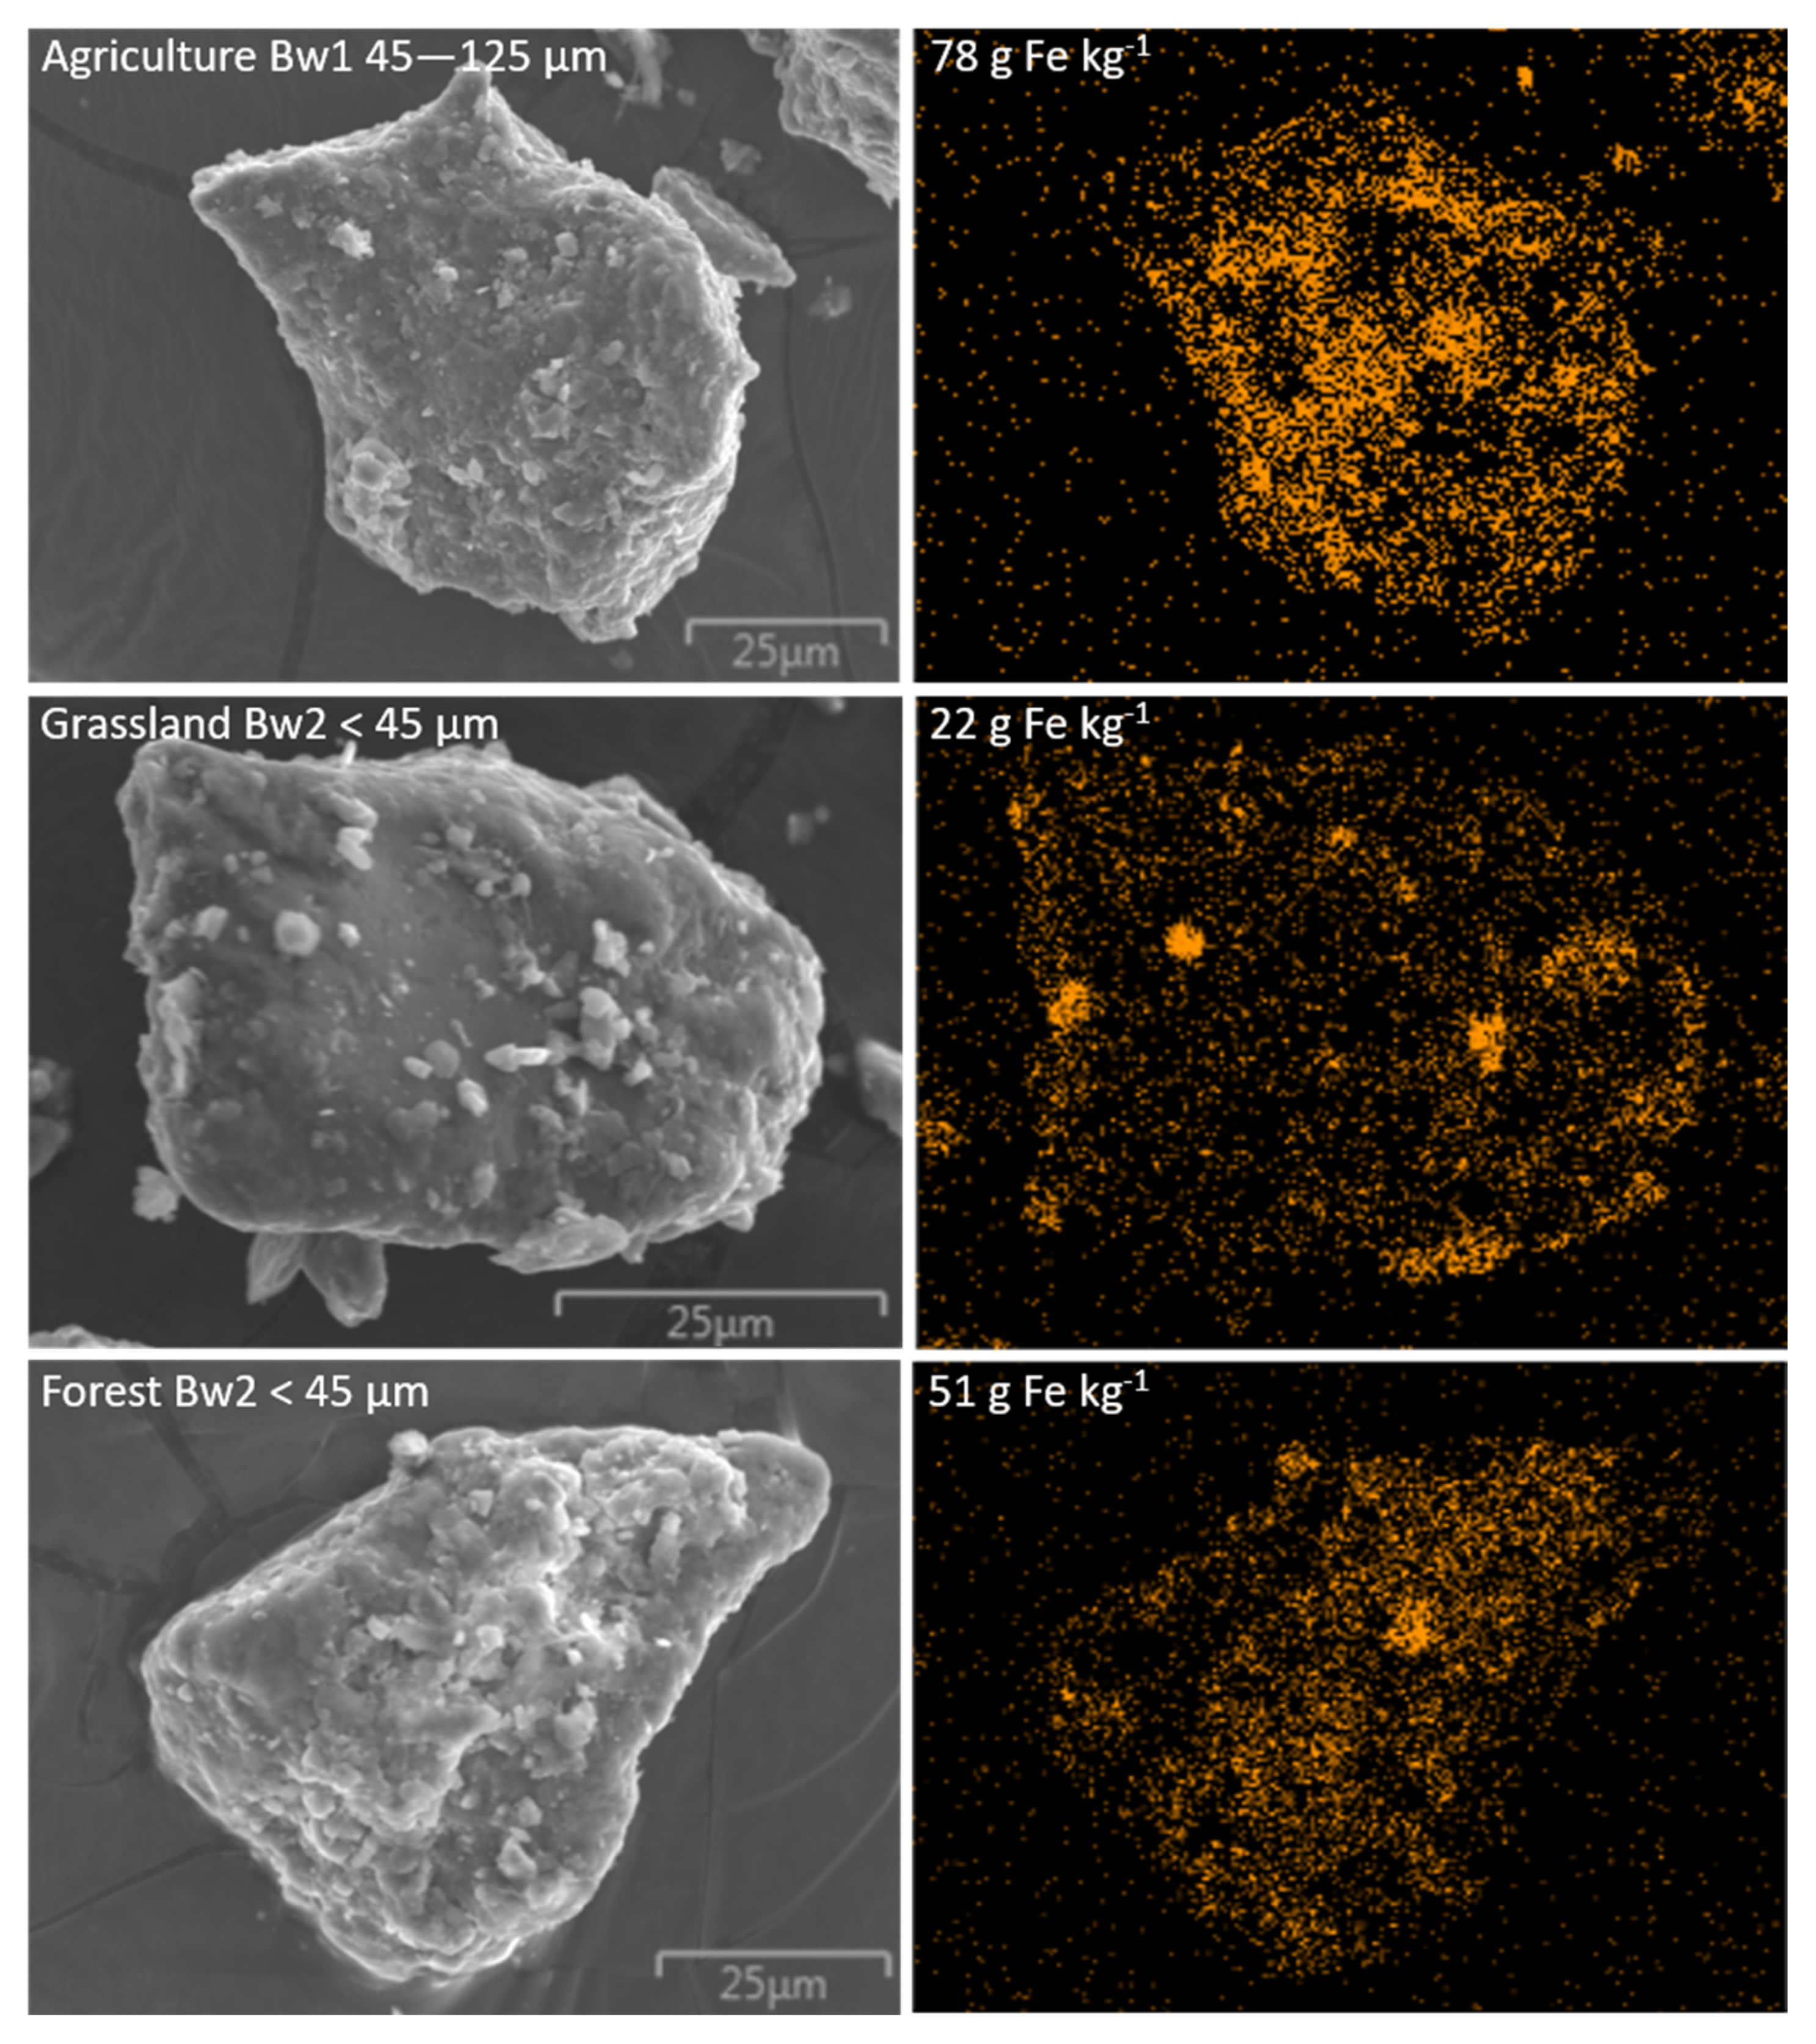
Figure 8.
Total carbon and total Fe3+ (CDB extractable) in the particle-size fractions of three sandy Alfisols under different land use. Note different x- and y-axes scales.
Figure 8.
Total carbon and total Fe3+ (CDB extractable) in the particle-size fractions of three sandy Alfisols under different land use. Note different x- and y-axes scales.
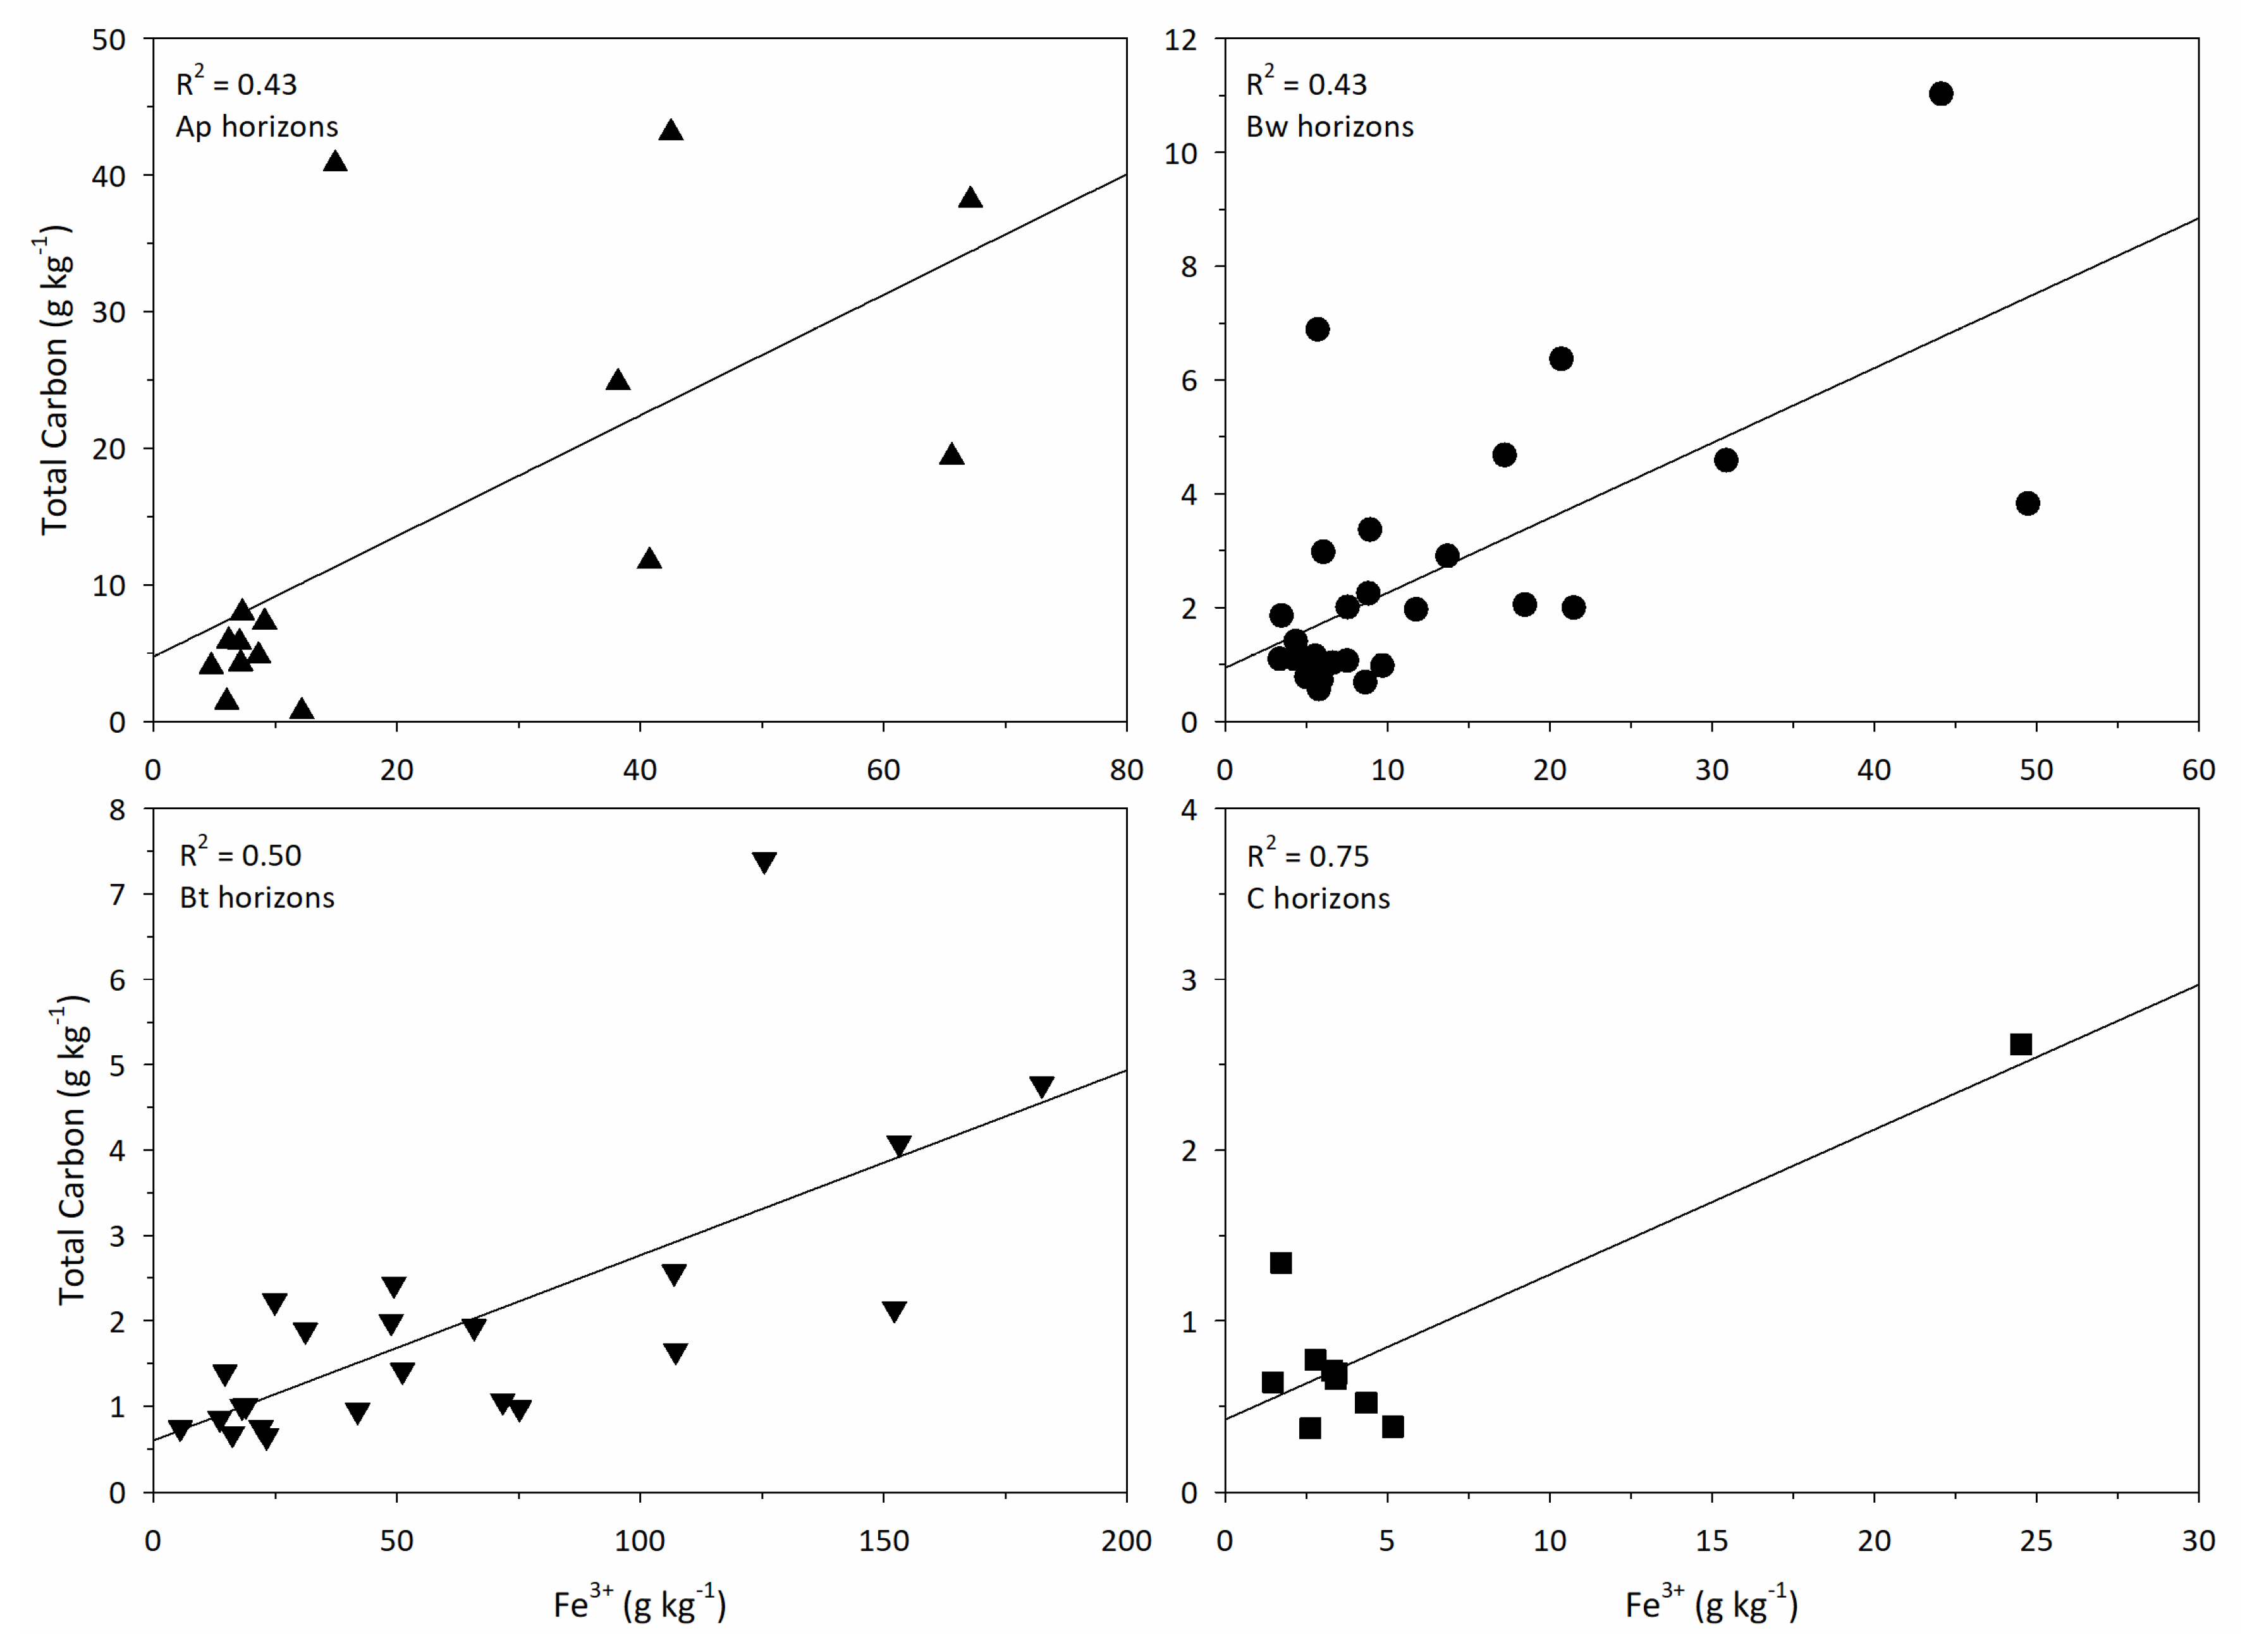
Figure 9.
Iron, Al, Ti, and Mg against silt content for the NCSS database and using the pXRF data from this study.
Figure 9.
Iron, Al, Ti, and Mg against silt content for the NCSS database and using the pXRF data from this study.

Table 1.
Soil chemical and physical properties of three sandy Alfisols (loamy, mixed, superactive, mesic Arenic Hapludalfs) under different land use from the Wisconsin Central Sand Plains.
Table 1.
Soil chemical and physical properties of three sandy Alfisols (loamy, mixed, superactive, mesic Arenic Hapludalfs) under different land use from the Wisconsin Central Sand Plains.
| Land Use | Horizon | Depth | Munsell | Total Carbon | Carbon Stock | Total Fe | pH | Clay | Silt | Sand | CF | Bulk Density |
|---|---|---|---|---|---|---|---|---|---|---|---|---|
| (cm) | (dry) | (g kg−1) | (Mg ha−1) | (mg kg−1) | (1:1 H2O) | (g kg−1) | (%) | (Mg m−3) | ||||
| Agriculture | Ap | 0–20 | 10YR 5/3 | 12.7 | 40 | 3077 | 7.4 | 20 | 90 | 890 | 1 | 1.57 |
| Bw1 | 20–57 | 10YR 6/6 | 1.1 | 7 | 2809 | 7.3 | 0 | 60 | 940 | 2 | 1.70 | |
| Bw2 | 57–108 | 10YR 6/6 | 0.9 | 7 | 5111 | 6.4 | 10 | 20 | 970 | 6 | 1.63 | |
| Bt | 108–153 | 10YR 5/6 | 1.9 | 13 | 23,135 | 5.1 | 80 | 110 | 810 | 9 | 1.68 | |
| C | >153 | 10YR 7/4 | 0.3 | 2913 | 5.2 | 10 | 10 | 980 | 7 | 1.68 | ||
| Grassland | Ap | 0–14 | 10YR 5/3 | 12.9 | 27 | 3798 | 5.1 | 40 | 80 | 880 | 0 | 1.50 |
| Bw1 | 14–40 | 10YR 6/6 | 3.7 | 16 | 8776 | 5.3 | 30 | 70 | 900 | 0 | 1.65 | |
| Bw2 | 40–80 | 10YR 5/6 | 1.7 | 11 | 6800 | 5.5 | 20 | 50 | 930 | 1 | 1.62 | |
| Bt1 | 80–100 | 10YR 5/6 | 3.5 | 10 | 14,468 | 5.5 | 100 | 70 | 830 | 3 | 1.51 | |
| Bt2 | 100–190 | 10YR 6/6 | 0.8 | 11 | 9289 | 5.4 | 70 | 30 | 900 | 6 | 1.59 | |
| C | >190 | 10YR 7/4 | 0.3 | 4273 | 5.3 | 10 | 10 | 980 | 7 | 1.59 | ||
| Forest | Oi | 0–4 | ||||||||||
| Ap | 4–21 | 10YR 5/3 | 4.7 | 12 | 6057 | 4.4 | 50 | 90 | 860 | 0 | 1.48 | |
| Bw1 | 21–80 | 10YR 5/6 | 1.0 | 9 | 5335 | 5.1 | 20 | 50 | 930 | 1 | 1.49 | |
| Bw2 | 80–123 | 10YR 5/6 | 0.4 | 3 | 3360 | 5.7 | 10 | 20 | 970 | 3 | 1.58 | |
| Bt1 | 123–136 | 10YR 5/8 | 0.6 | 1 | 13,154 | 5.7 | 80 | 90 | 830 | 8 | 1.55 | |
| Bt2 | 136–170 | 10YR 5/8 | 0.9 | 4 | 6130 | 5.4 | 50 | 50 | 900 | 9 | 1.57 | |
| C | >170 | 10YR 7/4 | 0.2 | 2532 | 5.9 | 0 | 10 | 990 | 5 | 1.57 | ||
Carbon stocks were corrected for coarse fragments; CF = coarse fragments; Total Fe from CDB analysis.
Table 2.
Summary of weathering indices used in this study. The indices were calculated using molecular proportions of element oxides. Listing modified from Price and Velbel [14].
Table 2.
Summary of weathering indices used in this study. The indices were calculated using molecular proportions of element oxides. Listing modified from Price and Velbel [14].
| Index | Formula | Optimum Fresh Value | Optimum Weathered Value | Increase in Weathering Trend | Reference |
|---|---|---|---|---|---|
| Ruxton Ratio (R) | >10 | 0 | Negative | [14,30] | |
| Weather Potential Index (WPI) | [30] | ||||
| Product Index (PI) | [30] | ||||
| Calcium/Titanium Ratio (CTR) | [31] | ||||
| Weather Index of Parker (WIP) | >100 | 0 | Negative | [14,32] | |
| Vogt’s Residual Index (V) | <1 | Indefinite | Positive | [14,33] | |
| Silica-Titania Index (STI) | >90 | 0 | Negative | [14,34] | |
| B Index (B) | [35] |
Table 3.
Elemental analysis for three sandy Alfisols under different land use in the Wisconsin Central Sands. Data from pXRF.
Table 3.
Elemental analysis for three sandy Alfisols under different land use in the Wisconsin Central Sands. Data from pXRF.
| Land Use | Horizon | Depth | Si | Al | Fe | Ti | Ca | Mg |
|---|---|---|---|---|---|---|---|---|
| (cm) | (g kg−1) | |||||||
| Agriculture | Ap | 0–20 | 228 | 22 | 8 | 2 | 15 | 23 |
| Bw1 | 20–57 | 268 | 29 | 7 | 2 | 0.5 | 28 | |
| Bw2 | 57–108 | 273 | 27 | 6 | 1 | 27 | ||
| Bt | 108–153 | 210 | 37 | 29 | 4 | 1 | 26 | |
| C | >153 | 294 | 14 | 5 | 0.8 | 23 | ||
| Grassland | Ap | 0–14 | 252 | 25 | 10 | 2 | 0.3 | 27 |
| Bw1 | 14–40 | 264 | 29 | 8 | 2 | 26 | ||
| Bw2 | 40–80 | 281 | 27 | 7 | 2 | 27 | ||
| Bt1 | 80–100 | 191 | 39 | 27 | 3 | 0.4 | 27 | |
| Bt2 | 100–190 | 194 | 37 | 21 | 2 | 0.5 | 26 | |
| C | >190 | 297 | 18 | 3 | 0.6 | 23 | ||
| Forest | Ap | 4–21 | 243 | 30 | 11 | 2 | 27 | |
| Bw1 | 21–80 | 264 | 32 | 16 | 4 | 1 | 28 | |
| Bw2 | 80–123 | 247 | 25 | 8 | 1 | 18 | ||
| Bt1 | 123–136 | 218 | 39 | 21 | 3 | 1 | 29 | |
| Bt2 | 136–170 | 224 | 32 | 18 | 2 | 0.7 | 27 | |
| C | >170 | 285 | 11 | 3 | 0.6 | 23 | ||
Table 4.
Analysis of variance for the depth and fraction (p-value) of each surface-coated element (EDS data) from three sandy soils under different land use.
Table 4.
Analysis of variance for the depth and fraction (p-value) of each surface-coated element (EDS data) from three sandy soils under different land use.
| Land Use | ANOVA | Si | Al | Fe | Ti | Ca | Mg |
|---|---|---|---|---|---|---|---|
| Agriculture | Depth | *** | *** | *** | n.s. | *** | *** |
| Fraction | *** | *** | * | n.s. | *** | *** | |
| Depth × Fraction | *** | *** | ** | * | *** | *** | |
| Grassland | Depth | *** | *** | *** | n.s. | ** | ** |
| Fraction | *** | *** | * | *** | *** | ** | |
| Depth × Fraction | * | *** | n.s. | ** | * | ** | |
| Forest | Depth | *** | *** | *** | n.s. | n.s. | *** |
| Fraction | *** | *** | ** | ** | n.s. | *** | |
| Depth × Fraction | n.s. | n.s. | n.s. | n.s. | n.s. | n.s. |
* = p ≤ 0.05; ** = p ≤ 0.01; *** = p ≤ 0.001; n.s. = not significant.
Table 5.
Weathering indices (calculated using molecular proportions of element oxides using the equations listed in Table 2) for the bulk soil in three sandy Alfisols under different land use. The indices were calculated using data collected from the pXRF. Note, Na and K were not included in the calculations.
| Land Use | Horizon | Depth (cm) | R | WPI | PI | CTR | WIP | V | STI | B |
|---|---|---|---|---|---|---|---|---|---|---|
| Agriculture | Ap | 0–20 | 20 | 14 | 94 | 8.40 | 16 | 0.31 | 86 | 0.48 |
| Bw1 | 20–57 | 18 | 10 | 94 | 0.39 | 13 | 0.47 | 89 | 0.02 | |
| Bw2 | 57–108 | 20 | 10 | 94 | n.d. | 12 | 0.44 | 91 | 0.00 | |
| Bt | 108–153 | 11 | 12 | 88 | 0.44 | 13 | 0.61 | 83 | 0.05 | |
| C | >153 | 40 | 8 | 97 | n.d. | 11 | 0.27 | 92 | 0.00 | |
| Grassland | Ap | 0–14 | 19 | 10 | 94 | 0.20 | 12 | 0.42 | 87 | 0.02 |
| Bw1 | 14–40 | 17 | 10 | 93 | n.d. | 12 | 0.50 | 88 | 0.00 | |
| Bw2 | 40–80 | 20 | 10 | 94 | n.d. | 12 | 0.44 | 88 | 0.00 | |
| Bt1 | 80–100 | 9 | 13 | 87 | 0.15 | 13 | 0.64 | 84 | 0.01 | |
| Bt2 | 100–190 | 10 | 12 | 88 | 0.32 | 12 | 0.64 | 86 | 0.02 | |
| C | >190 | 32 | 8 | 97 | n.d. | 11 | 0.35 | 93 | 0.00 | |
| Forest | Ap | 4–21 | 15 | 11 | 92 | n.d. | 12 | 0.50 | 87 | 0.00 |
| Bw1 | 21–80 | 16 | 11 | 92 | 0.35 | 13 | 0.49 | 84 | 0.04 | |
| Bw2 | 80–123 | 19 | 7 | 94 | n.d. | 8 | 0.62 | 91 | 0.00 | |
| Bt1 | 123–136 | 11 | 12 | 89 | 0.51 | 14 | 0.60 | 85 | 0.04 | |
| Bt2 | 136–170 | 14 | 12 | 91 | 0.42 | 13 | 0.51 | 87 | 0.03 | |
| C | >170 | 50 | 8 | 98 | n.d. | 10 | 0.22 | 93 | 0.00 |
R, Ruxton Ratio; WPI, Weather Potential Index; PI, Product Index; CTR, Calcium/Titanium Ratio; WIP, Weather Index (of Parker); V, Vogt’s Index; STI, Silica-Titania Index; B, B Index; n.d., no data.
© 2019 by the authors. Licensee MDPI, Basel, Switzerland. This article is an open access article distributed under the terms and conditions of the Creative Commons Attribution (CC BY) license (http://creativecommons.org/licenses/by/4.0/).
Share and Cite
MDPI and ACS Style
Yost, J.L.; Roden, E.E.; Hartemink, A.E. Geochemical Fingerprint and Soil Carbon of Sandy Alfisols. Soil Syst. 2019, 3, 59. https://doi.org/10.3390/soilsystems3030059
AMA Style
Yost JL, Roden EE, Hartemink AE. Geochemical Fingerprint and Soil Carbon of Sandy Alfisols. Soil Systems. 2019; 3(3):59. https://doi.org/10.3390/soilsystems3030059
Chicago/Turabian StyleYost, Jenifer L., Eric E. Roden, and Alfred E. Hartemink. 2019. "Geochemical Fingerprint and Soil Carbon of Sandy Alfisols" Soil Systems 3, no. 3: 59. https://doi.org/10.3390/soilsystems3030059