Article

Erosion Induced Heterogeneity of Soil Organic Matter in Catenae from the Baltic Sea Catchment

1
Faculty of Agricultural and Environmental Sciences, Soil Science, University of Rostock, Justus-von-Liebig-Weg 6, 18059 Rostock, Germany
2
Department of Agroecology and Environment, Aarhus University, Blichers Allé 20, Postboks 50, 8830 Tjele, Denmark
3
Institute of Ecology and Earth Sciences, University of Tartu, Vanemuise St. 46, 51014 Tartu, Estonia
4
Institute of Soil Science and Plant Cultivation, State Research Institute, ul. Czartoryskich 8, 24-100 Puławy, Poland
*
Author to whom correspondence should be addressed.
Soil Syst. 2019, 3(2), 42; https://doi.org/10.3390/soilsystems3020042
Submission received: 29 April 2019 / Revised: 5 June 2019 / Accepted: 11 June 2019 / Published: 19 June 2019
(This article belongs to the Special Issue Soil Erosion and Land Degradation)

Abstract

:
Soil organic matter (SOM) is unevenly distributed in arable fields in undulated landscapes, but the chemical composition resulting from their turnover, transport and deposition processes is insufficiently known. Therefore, we aimed at disclosing the molecular-chemical composition of SOM in four different catenae at shoulderslope, backslope and footslope positions in arable fields in the Baltic Sea catchment, Europe. The backslope positions always had the lowest organic C-contents (Corg) (1.6…11.8 g·kg−1) and C-stocks (3.8…8.5 kg·m−2) compared to the shoulderslopes and footslopes (1.7…17.7 g·Corg·kg−1, 5.4…15 kg·Corg·m−2). In the SOM-poor backslope positions, the organic matter was characterized by relatively high proportions of carbohydrates, phenols + lignin monomers, alkylaromatic compounds, N-compounds and amides, indicating intensive microbial decomposition. By contrast, the footslopes had the largest Corg-contents (9.3…16.5 g·kg−1) and C-stocks (8.9…15 kg·m−2) in the catenae and particular enrichments in lipids, lignin dimers, sterols and free fatty acids. These relatively stabile SOM compound classes are interpreted as leftovers from erosive downslope transport and concurrent microbial decomposition, e.g., they are pronounced at backslope positions, followed by restricted microbial decomposition. This heterogeneous SOM distribution calls for an adapted soil management that reduces erosion and places amendments to field areas, such as the shoulderslope and backslope.

1. Introduction

Interlinked processes, such as soil compaction and structure deterioration, soil erosion and re-distribution, together with soil organic matter (SOM) loss and biological degradation, are areas of major concern in Europe [1,2]. In undulated landscapes under intensive crop production, erosion sedimentation dynamics result in a redistribution of humus- and nutrient-rich, potentially fertile, soil constituents at the field scale [3]. This is schematically visualized in Figure 1 along with hypothetical processes of SOM enrichment or turnover at specific landscape positions. Because of these processes, the top and upper slope positions are usually depleted, whereas the depressional areas are enriched in SOM [4,5].
The composition of SOM is likely affected by these re-distributions, although our understanding of the processes involved is still fragmentary. For instance, Gregorich et al. [7] observed more easily mineralizable SOM fractions in depositional areas where plant growth is less moisture-limited than at more elevated positions. Furthermore, microbial community composition and size may also be affected by landscape processes [8], which has consequences for soil microbial processes, such as N mineralization [9] and denitrification [10,11]. New evidence on how the erosion/deposition and soil moisture dynamics govern the spatial distribution of SOM content and quality, and related soil fertility properties, can be derived from in-depth SOM investigations using molecular-level mass spectrometric methods or novel synchrotron-based C- and N-speciation techniques [12]. In the suite of versatile methods, pyrolysis-field ionization mass spectrometry (Py-FIMS) has recently been applied successfully to disclose the SOM composition of bulk soil samples from different major soil units [13], and unusually humus-rich Chernozem-like soils in the Baltic region [14,15,16,17] or no-till soils under perennial crops in Sweden [18]. The issue of erosion/sedimentation was tackled by Beyer et al. [19], who showed a relative SOM accumulation, along with enrichments in lignin dimers and lipids in Colluvisols that are located in depressional areas of differently tilled arable soils from Pleistocene deposits in Schleswig-Holstein/Germany. The heterogeneity of organic carbon (OC) as a result of erosion, and the resulting lateral relocation of sediments [20,21,22], is reflected by the high amounts of OC accumulated in fluvial and colluvic deposits [6]. These authors showed recently that the OC stored in topsoils has been determined mostly by land use, but that subsoil OC stocks highly depend on landform. Moreover, the high OC stocks in subsoils were justified by the formerly high input of OC-rich sediments, preservation of this OC from decomposition due to high water saturation and current land use (grassland) [6]. A few studies showed that large amounts of OC can be stored in the subsoil deeper than 30 cm [23,24,25,26], but the reasons for this phenomenon are not always clear. Knowledge gaps arise from the fact all the above studies were restricted to regional sampling sites at the field scale and, thus, yielded site-specific results that cannot be generalized and which often lack in depth molecular-scale determinations of OC or SOM compounds. Therefore, generalizing and deducing what happens with the SOM during erosion at the topslope and upslope positions, erosive downslope transport and deposition in depressional areas is scarcely possible from these investigations. Lal [27] emphasized that the lack of credible data regarding the fate of SOM at different erosional stages is a major cause of uncertainties in global C budgeting.
Consequently, the objectives of the present study were (i) to investigate the SOM composition and SOM-related soil fertility parameters in typical soil catenae from Weichselian glaciation deposits around the Baltic Sea, (ii) to determine a common principle of erosion-induced SOM alterations and soil fertility distributions that, independent of site specifics in Denmark, Germany, Poland and Estonia, is generally valid for intensively cropped fields in the Weichselian glaciation landscapes.
From the literature review and previous experience in SOM research, we hypothesize that (1) the SOM composition at the shoulder- and backslope positions is affected by the erosive losses of clay- and silt-sized organic-mineral particles and SOM dilution by successive tillage-depthing into the subsoil; therefore, site-effects from crop rotation and actual management should be strongest at these positions. (2) The SOM accumulation and molecular composition in depressional positions is due to intrinsically stabile OM compounds from upslope positions or a suppressed oxidative decomposition of the primary organic matter.

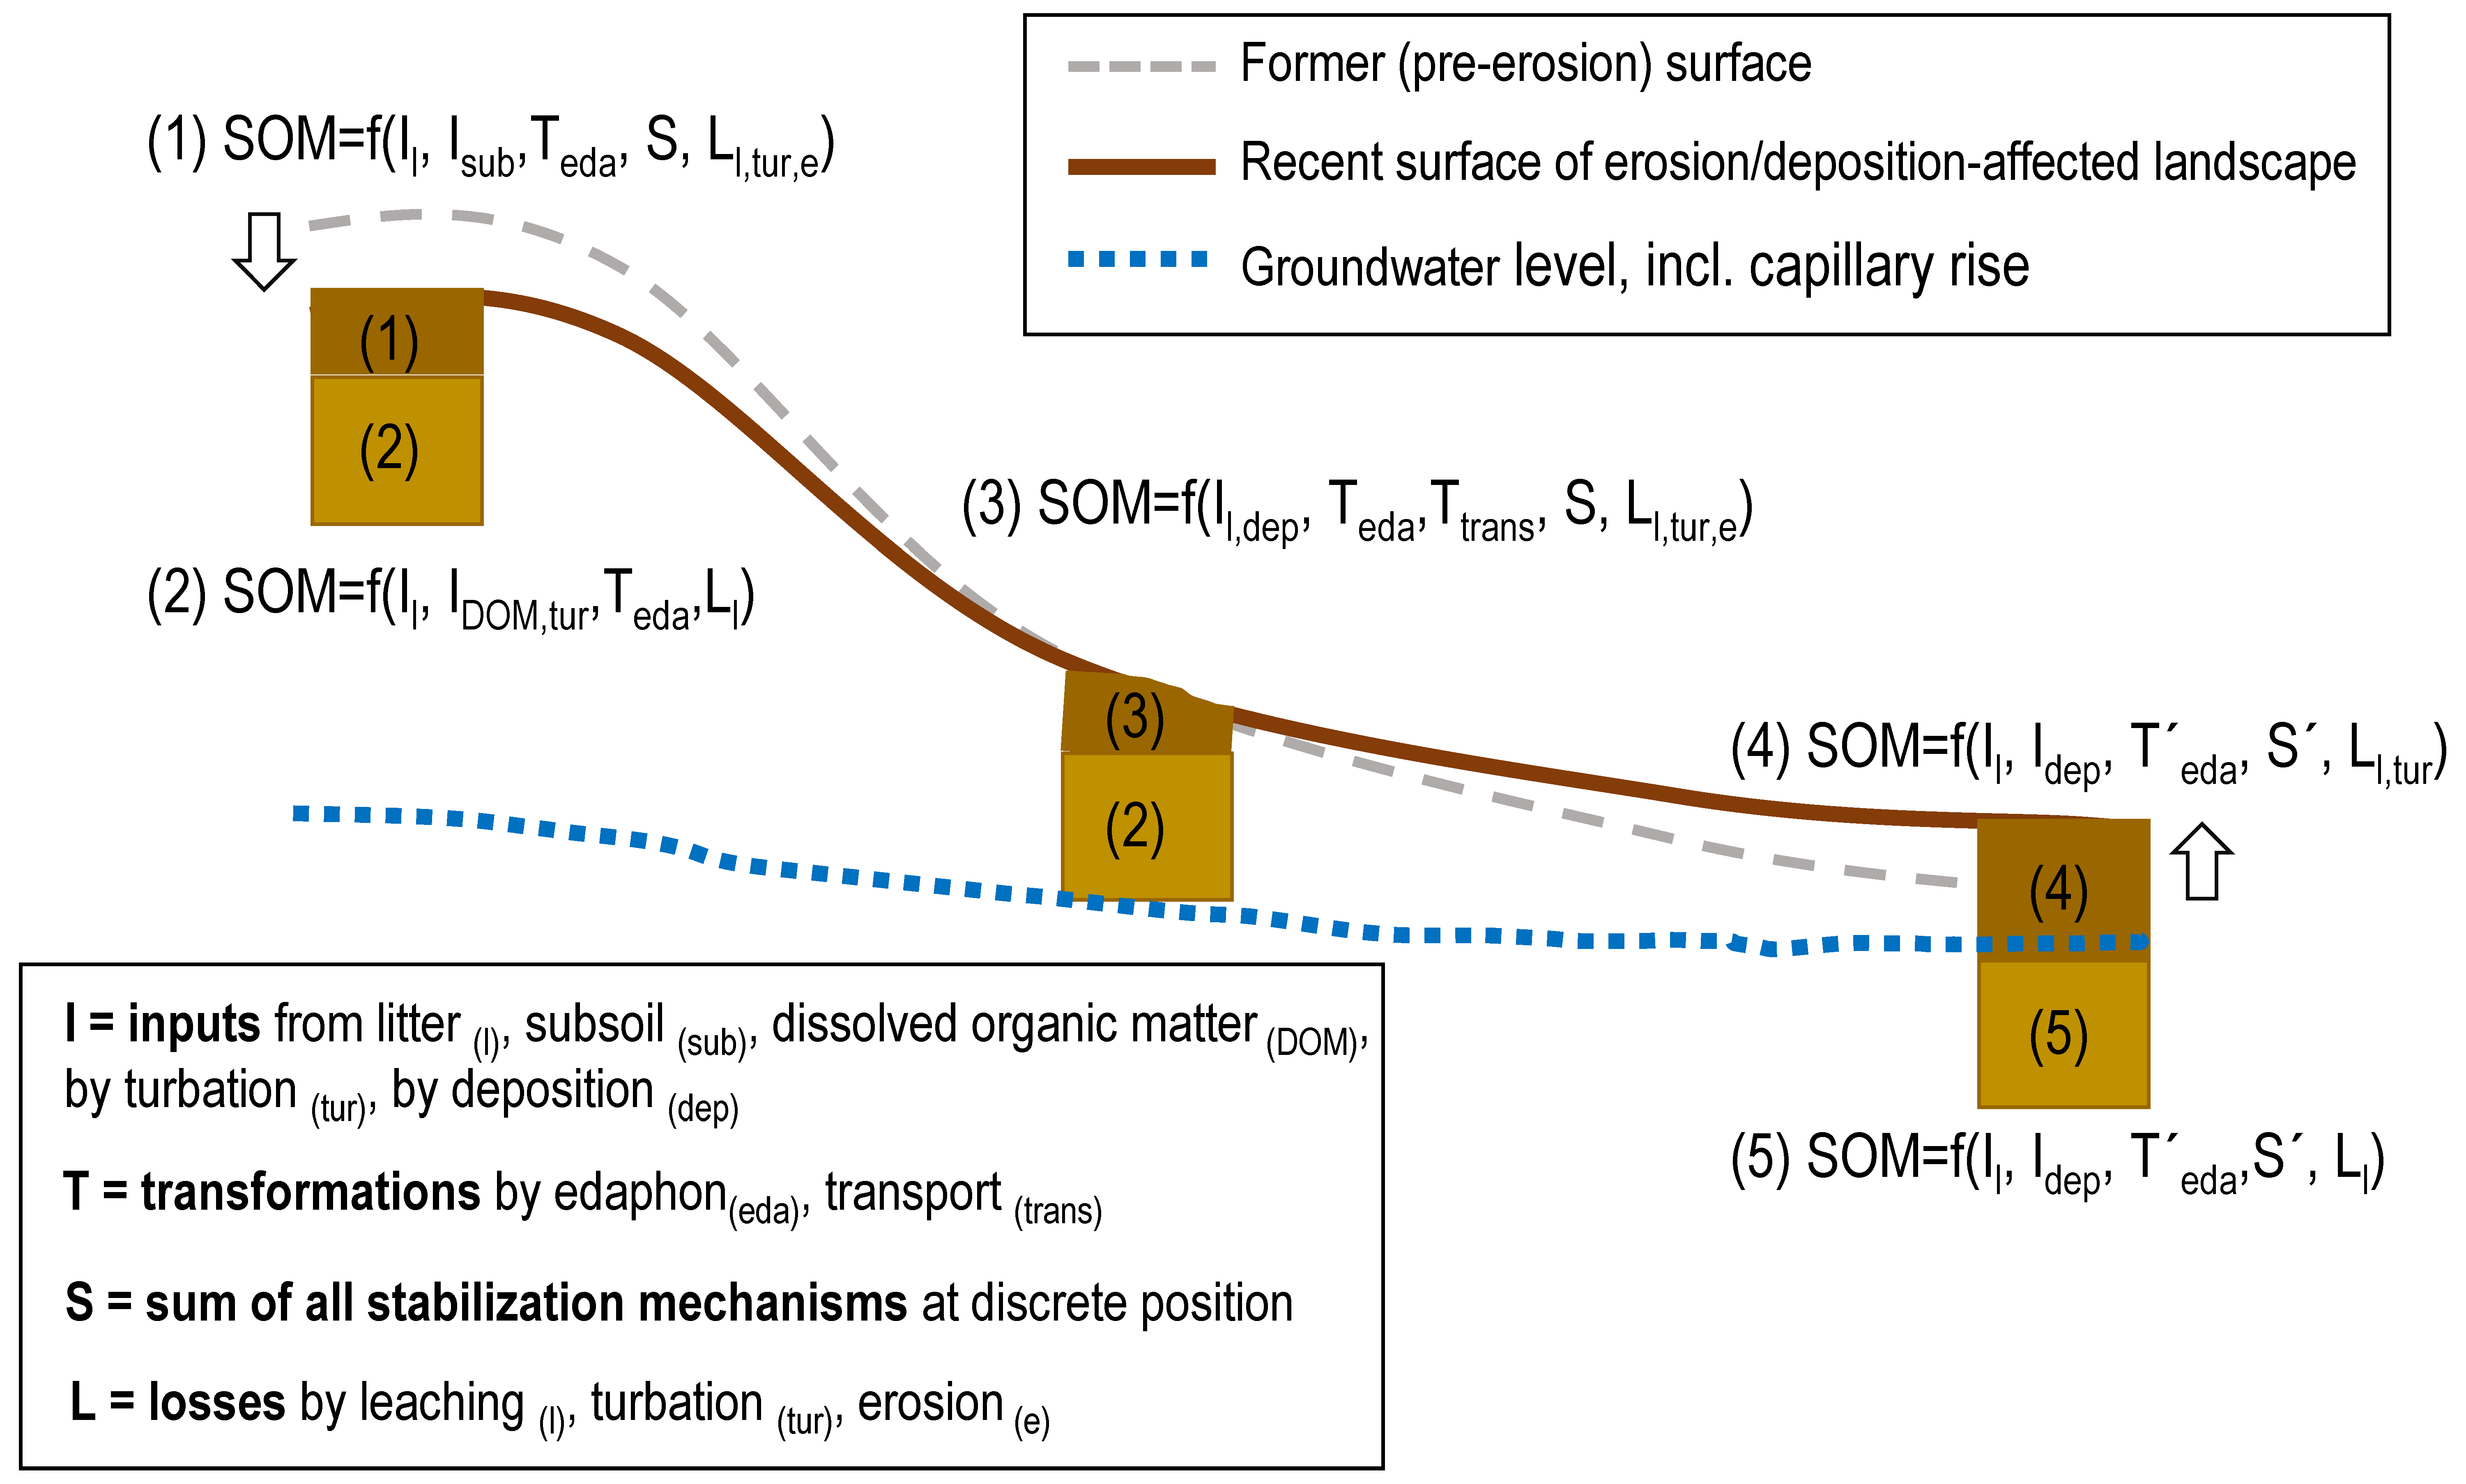
2. Materials and Methods

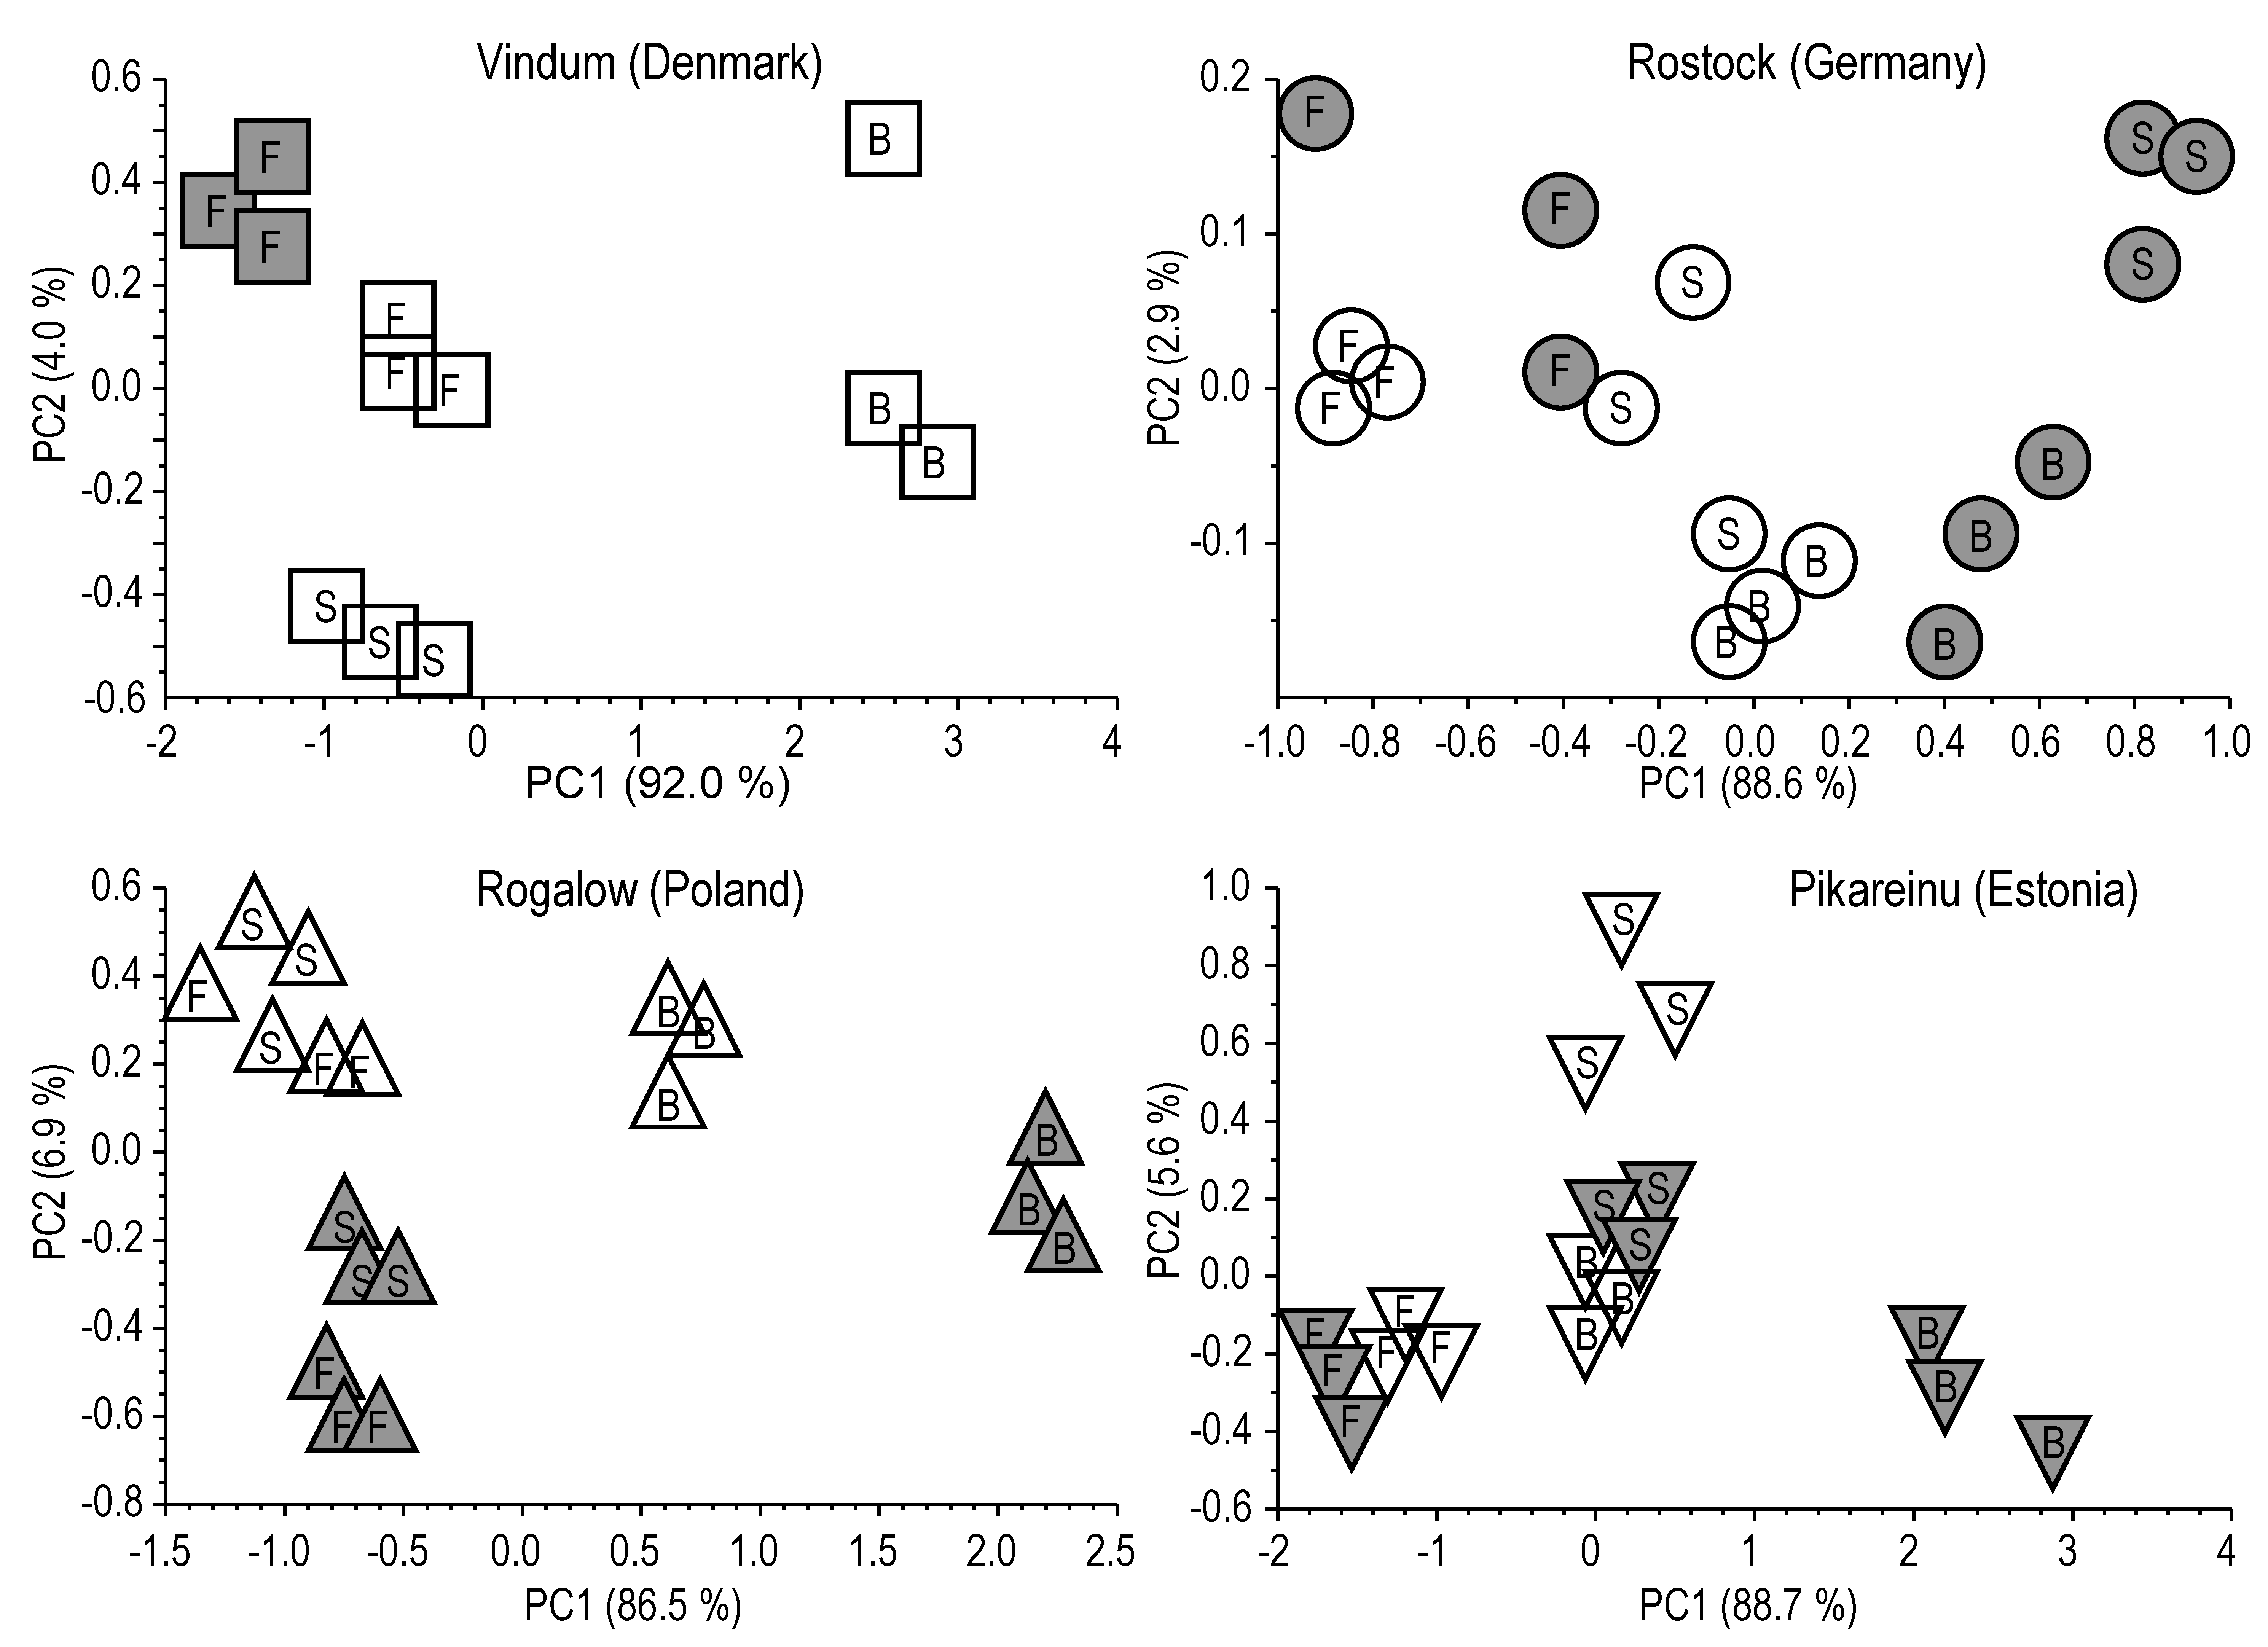
2.1. Description of Sampling Areas

Soils from four catenae located in the the Baltic Sea catchment in Vindum (Denmark), Rostock (Germany), Rogalow (Poland) and Pikareinu (Estonia) were sampled at the tilled topsoil and non-tilled subsoil. For physical analyses, we took 250 cm soil cores in 3 replicates for each horizon. For chemical analyses, the disturbed sample material was taken around and between the cores. Because the physical parameters showed good agreement among the individual cores, the disturbed pooled samples are considered to be representative for a soil volume of 10,000 cm3 of the respective horizon. All catenae were located in undulated-moraine landscapes and had the same bedrock (parent material), with a Pleistocene boulder till derived from glacial sediments. They were tilled (ploughed) for a longer period of time (decades), which resulted in tillage and water erosion becoming the driving forces of particle and SOM redistributions at the field scale. For geographical position, soil classification and climate data, more details of the catenae can be found in Table 1.

2.1.1. Vindum (Denmark)

The study site was an arable field with a rolling, complex topography, situated in western Denmark and described in detail by Djurhuus and Olesen [28]. The dominant soil textural classes at the field site were loamy sand and sandy loam. The selected field had been under continuous intensive cropping for more than 100 years, with crop rotations dominated by spring barley (Hordeum vulgare L.), grass (primarily ryegrass, Lolium perenne L.) and fodder beet (Beta vulgaris L.) before the 1970s, and since then, by winter wheat, spring barley and winter oilseed rape (Brassica napus L.). Straw has generally been removed following the harvest. The field has regularly received livestock manure prior to 1975, predominantly as farmyard manure, and thereafter as pig slurry. Typical slurry rates are 20–30 Mg·ha−1, containing about 3–4 kg total N per Mg slurry. Mineral N fertilizer has been applied since the 1950s. Based on the general fertilization practice in Denmark, the estimated average rates declined from about 210 kg·N·ha−1·yr−1 in the late 1980s to presently about 170 kg·N·ha−1·yr−1 for a typical crop rotation of winter oilseed rape, two times that of winter wheat, followed by winter barley. Soil pH has been maintained between 6.5 and 7.5 by intermittent liming. The field has been mouldboard-ploughed, typically once a year, to a nominal depth of 20–25 cm from the mid-1950s to 2008. Hereafter, reduced tillage was introduced, working the soil to a depth of ca. 8 cm with a tine bar cultivator. Winter wheat was grown in 2011/2012, when this study was conducted. Winter wheat was sown at a seed rate of 180 kg·ha−1, with a pneumatic seeder fitted with broadcast injectors. There were no gaps between seed bands, resulting in a relatively uniform plant stand.

2.1.2. Rostock (Germany)

The study site was an arable field with a rolling topography situated in Northern Germany. The dominant soil textural class at the field site was sandy loam without any obvious difference in the profiles and at the field. The selected field had been under continuous intensive cropping for more than 100 years, with crop rotations dominated by winter wheat (Triticum aestivum L.), winter barley (Hordeum vulgare L.), oilseed rape (Brassica napus L.), sugar beets (Beta vulgaris subsp. vulgaris) and grass/clover mixtures (primarily ryegrass, Lolium perenne L. and red clover, Trifolium pretense). Before the 1990s, farmyard manure (about 20 t ha−1) had been applied to root crops. In the past 20 years, the cropping system has become dominated by winter wheat, oilseed rape and maize (Zea mays L.); the latter is mostly used for biogas operations. Based on the general fertilization practice in Northern Germany, the estimated average rates for the N-fertilizer were about 190 kg·N·ha−1·yr−1 for a typical crop rotation of winter barley, winter oilseed rape and winter wheat, followed by two times maize. Soil pH 5.5 and the contents of plant available P and K have been maintained by intermittent liming and fertilizer application according to recommendations by the Agricultural Analysis and Research Institute (LUFA) Rostock. The field has typically been mouldboard-ploughed once a year to a nominal depth of 25–30 cm. Winter wheat was grown in 2011/2012 and sown at a seed rate of 180 kg·ha−1 with a pneumatic seeder fitted with broadcast injectors.

2.1.3. Rogalow (Poland)

The catena is located in the eastern part of Poland within a cultivated field of 1.05 ha. The catena is located on the Naleczow Plateau in the basin of the river Bystra. The relief varies, with the slopes on most surfaces having an inclination in the range 6% to 10% and 10% to 18%. The soil substrate loess (texture silt loam) favours erosion processes in the study area. The dominant crops grown are cereals, and spring barley was grown in the sampling year. The recommended dose of nitrogen for barley ranges from 40 to 80 kg·N·ha−1. Straw is removed following harvest. The study site has been regularly mouldboard-ploughed once a year to a depth of around 25 to 30 cm. Heavy farm equipment was not used.

2.1.4. Pikareinu (Estonia)

The Estonian catena is located in South–Estonia, Põlva County, Valgjärve municipality, Pikareinu village. The relief is a hilly-moraine landscape in the Otepää upland. The parent material is a red-brown, weakly calcareous till, and the bedrock consists of Devonian “old-red” sandstone (depth 50–60 m), below the glacial and glacio-limnic/glacio-fluvial sediments. The stoniness is 2−5 m3·ha−1 with an average 20...40 cm diameter. The hilltops’ slightly stony soil is well drained, whereas the steeper backslope regions are more prone to humus erosion. Downslope soils are less drainable and favor reductive conditions in subsoils. The study site has a cropping history of over a century, and the field has been regularly mouldboard-ploughed to a nominal depth of around 20–25 cm, whereas implementation of more powerful machinery caused a deepening of the soil’s tillage depth. Up to the end of the last century, the field was cropped mainly with cereals. Since 2000, environmental-friendly cattle-farming, combined with grassland husbandry, was introduced, and the Estonian National Rural Development program also started to support a grassland establishment for the hilly landscapes region to prevent further soil erosion and improve soil fertility and environmental quality. According to mineral fertilization practices during the Soviet period, the average application rates for mineral N for cereals were in the range from 80 to 100 kg·ha−1. In this century, no mineral N has been added. However, grazing animals leave dung and urine patches on the pasture. During the sampling year, the field was used for spring barley, undersown with a grass and clover mixture. The impact of clover on the soil’s N content has not been quantified.

2.2. Soil Sampling, Sample Codes and Pretreatments

All soil samplings were carried out in 2011. Soil pits were dug at each of the three positions in a catena; these positions are used for the sample coding throughout the text: shoulderslope (S), the backslope (B) and the footslope (F), as per Ruhe [29]. The catenae will be described in order of their location in the west–east direction.
At each slope position, undisturbed soil cores were collected from topsoils and subsoils in 100 cm3 stainless steel cylinders for water retention and bulk density measurements. Within a sampling area of 0.25 m by 0.75 m, five cores were taken from the 0.05–0.10 m and the 0.33–0.38 m layer by forcing the cylinders vertically into the soil with a hammer and a special flange. In this study, these samples represent the 0–0.3 m and the 0.3–0.6 m layers, respectively. All samples were carefully protected from evaporation and physical disruption and stored at 2–5 °C until physical analyses. Disturbed soil material between the rings was taken for chemical analyses, stored in closed plastic bags, and then the subsamples were dried, sieved at <2 mm and distributed to the laboratory in charge.

2.3. Analytical Methods

2.3.1. Physical Soil Properties: Texture, Bulk Density, Porosity and Water Retention

To determine soil texture, 40 g of the air-dry sample at <2 mm was stirred for 15 min, and the suspension was transferred into sedimentation cylinders. After certain sedimentation times, the suspension density was measured periodically by a hydrometer to estimate the proportions of sand (>0.05 mm), silt (0.005–0.0002 mm) and clay (<0.002 mm). After completing the hydrometer measurements, the suspension was transferred to a set of sieves to fractionate the sand (2–1, 1–0.5, 0.5–0.25, 0.25–0.1 and 0.1–0.05 mm). The sand samples were then dried at 105 °C and weighed. Texture classes were defined according to USDA standards [30].
Soil water content at a field capacity (FC) was determined after saturating the soil cores with water from below, by draining to a water potential of −50 hPa (pF 1.7) in a sandbox and weighing [31]. Soil water content at a permanent wilting point (PWP) pF 4.2 was measured with a chilled-mirror dew point psychrometer, according to Resurreccion et al. [32]. The plant available water content (PAW) was then calculated according to Equation (1):
PAW = FC (pF 1.7) − PWP (pF 4.2).
Upon completion of the water retention measurements, the 100 cm3 soil cores were oven-dried at 105 °C for 24 h and weighed to determine the dry bulk density (ρd). Porosity was calculated from the bulk density, assuming a soil particle density of 2650 kg·m−3.

2.3.2. Chemical Soil Properties: Elemental Concentrations, pH and Cation Exchange Capacity

The total nitrogen, carbon and sulphur content of the oven-dried samples was determined by a dry combustion method on a varioMAX CNS elemental analyzer (Elementar Analysensysteme GmbH, Hanau, Germany). Samples were tested with hydrochloric acid for abundance of carbonates. Since most samples were free of carbonate, the total C was considered to be organic C (Corg). Exclusively, the Corg concentration at the shoulderslope in 0–30 cm in Pikareinu was calculated considering 0.39 g·kg−1 CaCO3. The carbon stock was counted for an area of 1.0 m2 and at soil depth increments of 0.3 m, resulting in a volume of 0.3 m3, for each of the investigated soil depths of 0–30 cm and 30–60 cm. Due to the bulk density of each sampling point, the soil mass of this volume was calculated and used to derive the carbon stocks (kg·m−2) from the corresponding Corg concentrations. The total P was determined in finely ground subsamples by the molybdate blue method of Murphy and Riley [33] after wet oxidation of the samples in a mixture of concentrated perchloric and sulphuric acid [34]. The pH value was determined potentiometrically in a 1:2.5 (w/v) mixture of soil and a 1 M KCl solution.
For determination of cation exchange capacity (CEC) and exchangeable cations (Ca2+, Mg2+, K+, Na+), about 2 g of air-dry soil was suspended with 100 mL of a 1 M ammonium acetate solution (pH 7.0) in 120 mL plastic containers. Desorbed cations were determined directly in the equilibrium solution by atomic absorption spectrometry (AAS). CEC was calculated as the sum of the exchangeable basic cations and exchangeable acidity [35].

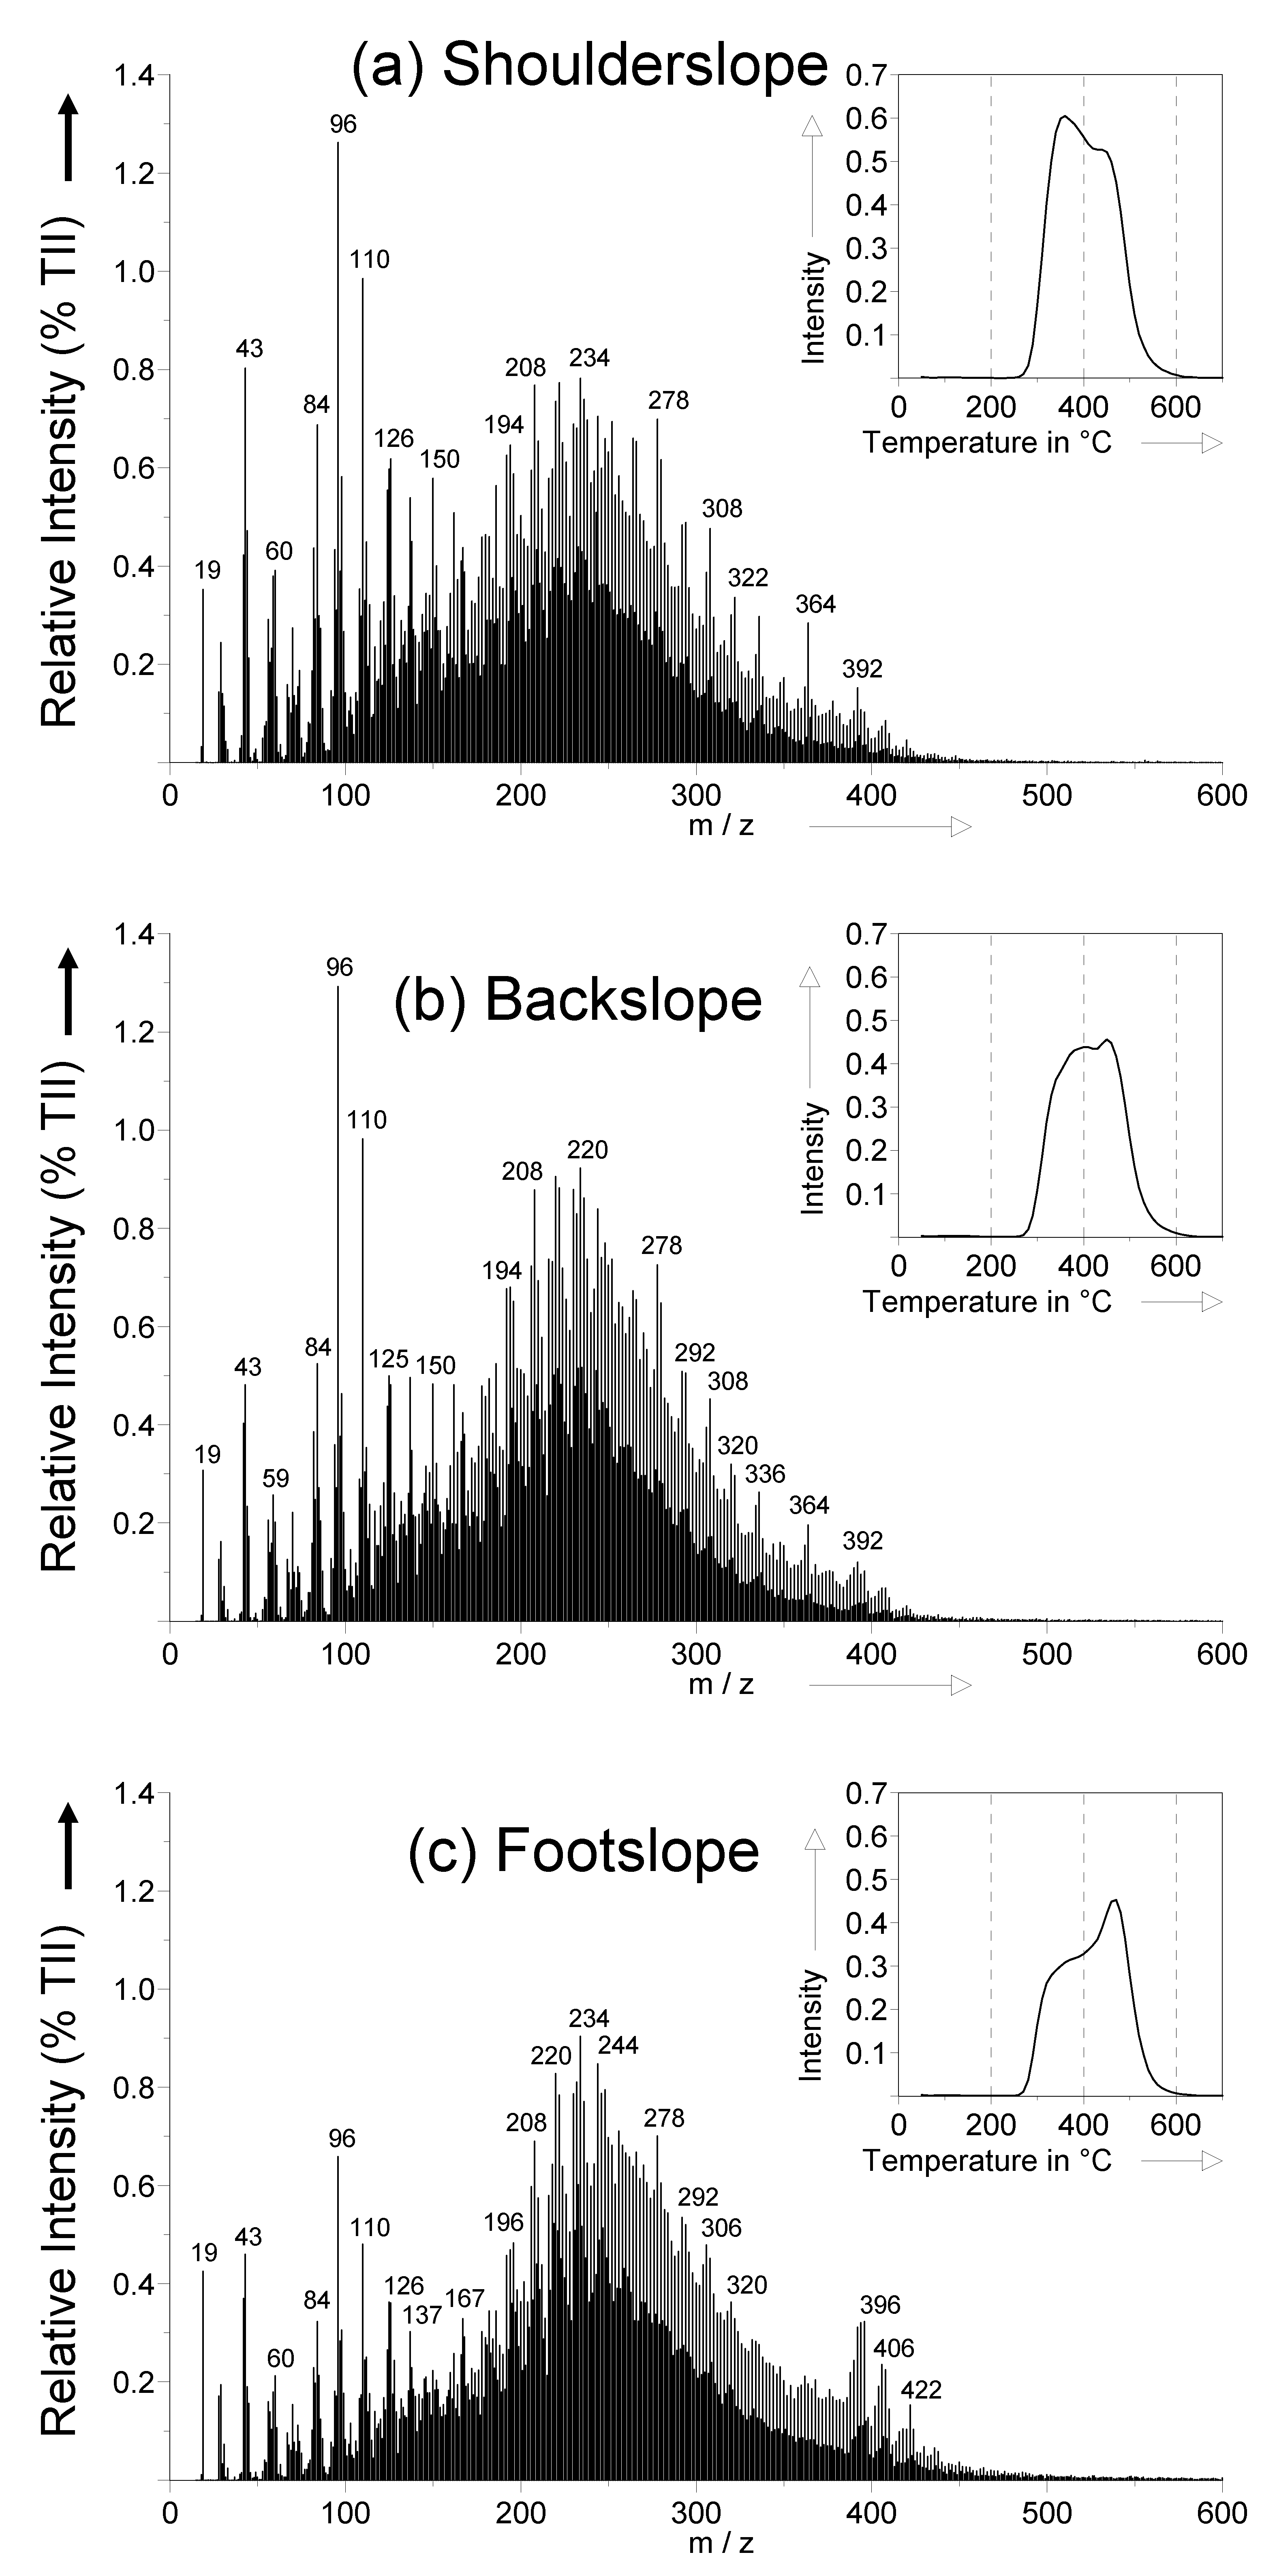
2.3.3. Soil Organic Matter Quality by Pyrolysis-Field Ionization Mass Spectrometry (Py-FIMS)

For Py-FIMS, about 4 mg of the air-dried and extra finely ground and homogenized soil samples were degraded by pyrolysis in the ion source (emitter: 4.7 kV, counter electrode −5.5 kV) of a double-focusing Finnigan MAT 95. The samples were heated in a vacuum of 10−4 Pa from 50 °C to 700 °C, at temperature steps of 10 °C. Between magnetic scans, the emitter was flash heated to avoid any residue from the pyrolysis products. Sixty-five spectra were recorded for the mass range m/z 15 to 900. Ion intensities referred to 1 mg of the sample. Three replicates were run for each sample. The Py-FIMS method, including assignment of marker signals (m/z) to relevant compound classes ((carbohydrates, phenols + lignin monomers, lignin dimers, lipids (alkanes, alkenes, alkanoic acids, alkyl ester), alkylaromatic compounds, N-containing compounds (aromatic N-heterocyclic compounds and nitriles), sterols, nonaromatic amides (peptides, amino sugars) + free amino acids, suberin, and n-alkanoic acids from n-C16 to n-C34)), was described in detail by Schulten et al. [36], Leinweber et al. [13] and Leinweber et al. [37]. Furthermore, close relationships between microbial decomposition and thermal stability in Py-FIMS [38] were reflected by a separation of Py-FIMS thermograms into thermally labile (faster degradable) and stabile (slower degradable) proportions [39]. Therefore, this criterion will be used to discuss SOM stability. The thermostability was calculated after dividing the area under the thermograms into the thermally labile (lower than 420 °C) and stabile proportions (≥420 °C) using the formula: Thermostability = stabile proportions/(stabile + labile proportions).

2.3.4. Statistical Analyses

Students t-test (heteroscedastic using MS Excel 2003) was used to establish the significance of thermostability and compound class differences along each catena at the shoulder-, back-, and footslope positions at 0–30 cm and 30–60 cm and to compare topsoil to subsoil. A three-factorial analysis of variance (ANOVA) was used to analyse the significant effects of the different catenae, catena positions, sampling depths in the soil of the compound classes (% TII (Total Ion Intensity)) determined by Py-FIMS. It was computed using the software STATISTICA [40].
Furthermore, the Py-FIMS spectra were analyzed by principal component analysis (PCA). The PCA reduced the dimensionality of the data set to a few principal components (PC) containing most of the information (measured as total variance) in the original variable space. The PCA was calculated using the 886 relative intensities of m/z 15…900 using R, Version 3.1.1 [41], with module prcomp and unscaled variables.

3. Results and Discussion

3.1. Physical Soil Properties of the Baltic Catenae

The soil texture classes in Vindum, Rostock and Pikareinu catenae are sandy loams, whereas in the Rogalow catena, the soil is a silty loam (Table 2). Accordingly, the silt content in the Polish catena was significantly higher (71–76%) and the sand content significantly lower (21–23%) than those in other three catenae (20–36% silt and 56–74% sand). As a sign of lessivage, the shoulderslope and backslope sites in Vindum had significantly more clay in soil depth at 30–60 cm. In all other sites of all catenae in the clay, silt and sand contents did not differ significantly between the top- and subsoils. The average ± standard error of the bulk density and porosity in Vindum (1.61 ± 0.05 g·cm−3 and 39 ± 2 vol.%, respectively) significantly differed from those in Rogalow (1.37 ± 0.04 g·cm−3 and 48 ± 2 vol.%, respectively). In the other catenae, the bulk density and porosity varied from 1.44 ± 0.06 to 1.51 ± 0.04 g·cm−3 and from 43 ± 1 to 46 ± 2 vol.%,. The soils in Rogalow catena showed the highest FC (pF 1.7) and PAW values (40 ± 0.6 and 35 ± 0.7 vol.%, respectively), whereas in Vindum, the PWP (pF 4.2) value (9 ± 0.6 vol.%) significantly exceeded that of the other catenae.
The soil classifications in Table 1 indicate a stronger erosion/transport/sedimentation dynamic in the Vindum and Rostock catenae (Anthrosols in footslope positions) than in Rogalow and Pikareinu. In Denmark, the acidic and sandy Podzoluvisols occupy an estimated 2% of the area scattered throughout Jutland, whereas Luvisols are the dominant soil type in the moraine landscapes of Denmark and cover about one-third of the country [42]. Covering about 50% of Denmark, sandy loam is the most widespread texture class [43]. At Vindum, bulk densities tended to be higher than at the other sites (Table 2). The bulk density ranges observed in the consolidated plough layer and subsoil are common for this texture class and soil type in Denmark [44]. The bulk density clearly increased in the subsoils at the shoulder and back slope positions due to a combination of subsoil compaction of the glacial till and clay accumulation in the illuvial Bt horizon (Table 2). The lower bulk density in the subsoil at the foot slope position is more directly consistent with a buried plough layer of a similar texture than the plough layer resulting from tillage erosion [6].
The bulk densities in the Rostock catena are smaller than those in an earlier study of compacted soils [45], but the difference between top- and subsoil bulk density is comparable at the footslope position (0.06 g·cm−3). Accordingly, the porosities showed the same differences for the footslope position, but at the shoulderslope, the present study indicated a stronger subsoil compaction than in the previous investigation [45].
In Rogalow, the bulk density ranges for Luvisols (1.2–1.46 g·cm−3) agree with data for Luvisols at nearby experimental sites [46,47] or lowland areas in Poland [48]. Furthermore, the bulk density values in this catena are typical for the cultivated silty Haplic Luvisols of loess areas and confirm the results of Turski and Witkowska-Walczak [49] and Rejman [50]. The footslope is enriched with diluvial material (which contains more clay than other soil profiles in catena) as a result of water erosion. This contributes to a lower porosity and, thus, a higher soil bulk density at the footslope. This is compatible with studies on the impact of water erosion on physical properties of loess soils conducted by Turski [51]. Similarly, in the case of Corg, the greatest accumulation was observed at the footslope of the Rogalow catena, whereas at backslope, the C content was the lowest (Table 3). This is compatible with the results of the studies conducted on eroded loess soils [50,51].
At Pikareinu, the bulk density (BD) of soils can be compared with the BD of the Estonian National Soil Monitoring data (ENSM; 1983–2008). The results show that the average BD value for the plough layer of Aric Regosols (n = 93 in ENSM), which also includes the Pikareinu data, was 1.65 g·cm−3 [52]. However, this mean value is more typical for subsoils than for topsoils for both slope positions in the present study (Table 2). We assume that introducing a clover grass mixture on the previously compacted eroded soils resulted in the soil loosening by about 0.3 g·cm−3 during the last decade. This may have supported the infiltration of precipitation and reduced the lateral flux of water and organic matter, as reported by Auerswald and Fiener [53] for fields after conversion from arable to grassland. The average BD value for the footslope soils generalised as Colluvic Regosols (n = 233 in ENSM) is 1.50 g·cm−3 [52]. Here, our current results again showed soil loosening but to a lesser degree than it was estimated on the upper slope positions. In Pikareinu, the bulk densities did not equalize between the top- and subsoils, as was recorded for the sites in Denmark and Poland (Table 2). We also notice that in Pikareinu, the subsoil horizon is not a common mineral subsoil but a buried Thaptomollic horizon.
In summary, increases in bulk densities and decreases in porosity indicate severe to moderate subsoil compaction below the ploughed horizon in almost all catenae. The absolute values, gradients with soil depth and extension in the whole catena indicate the order (Vindum and Pikareinu > Rostock and Rogalow) for the extent of compaction. Furthermore, the footslope positions in Vindum and Pikareinu had slightly larger values for FC and PAW than the other catenae positions, indicating advantages in the water supply for the crops growing at these field positions.

3.2. General Chemical Soil Properties

The soil pH values all were slightly (pH 6.7) to moderately acidic (pH 5.2); only two subsoil samples were strongly acidic (pH 4.7 and 4.1) (Table 3). The C- and N-contents reached their highest values in each catena in the footslope positions (except Rostock topsoil shoulderslope). Remarkably, the footslope positions showed only very slight reductions or even increases of C- and N-contents down in the profiles. Because of this analogous trend, this corresponds to the C:N ratios which, although generally narrow, were widest in samples from the footslope positions. The pattern of C-stocks in the soil profiles was similar to the C-contents in showing accumulations towards the footslope positions. In all catenae, the general order of summed C-contents, N-contents and C-stocks for the 60 cm under study was: backslope < shoulderslope < footslope, with the differences between shoulderslope and backslope always smaller than those between backslope and footslope. This also showed that the C-, N-contents and the C-stock were lowest in the backslope position. The S- and P-contents and the CEC’s were sometimes larger in the footslope positions but not always, and not as pronounced for the organic matter contents.
The C concentrations in the Vindum catena at the shoulderslope-topsoil (10.4 g·kg−1) were slightly lower than the earlier data described for this catena (12.5…14.4 g·kg−1), whereas the C concentration at the footslope-topsoil (12.7 g·kg−1) was lower than the previously reported data range (30.6…53.1 g·kg−1) [54]. The C concentrations in the top- and subsoils in Rostock (5.2…14.1 g·kg−1) were nearly in the same range as those described for the seven catenae in this area (Late Pleistocene ground moraine) (6.1…18.1 g·kg−1) [55]. In the Rogalow catena, the Corg for the Luvisol-topsoils (8.4…10.6 g·kg−1) is below the values reported for Luvisols from the same area (16…17 g·kg−1 [46]). The C concentrations in topsoils in the Estonian catenae (11.8…16.5 g·kg−1, Table 3) generally agree with the humus contents of 12…45 g·kg−1 in regional Cambisols, Luvisols and Albeluvisols [56], considering about 50% of C in humus. The increase in C contents downslope in the Estonian catena could be caused by grassland use during the last 15 years. During the first phase after conversion of cropland to the grassland, the C and N contents of backslope soils could have increased, mainly due to the lack of frequent soil cultivation. Compared to the well-aerated backslope soils, in poorly aerated footslope soil, where oxygen is limited or absent, organic matter is more slowly decomposed [56].
The C-stock data for all soils between 3.8…15 kg·m−2 (Table 3) are in the same range as described for comparable soil units at the investigated soil depth (5.7…16.4 kg·m−2 [57]). In more detail, data for the catena Vindum confirm earlier results from a similar catena in Denmark regarding larger C-stocks in the footslope than in the shoulderslope positions and the extreme C stock enrichment in the subsoil at the footslope [58]. However, the latter publication reported much larger C-stocks in the footslope position (20.2 kg·m−2) than in the Anthrosol of the present study (12 kg·m−2, Table 3), indicating less severe erosion/deposition in the present catena.
In the Rostock catena, the C-stock of Stagnic Anthrosol at the backslope (5.4 kg·m−2) was in the range (1.6…10.6 kg·m−2), as described for comparable relief positions in the catenae in Late Pleistocene ground moraine (Germany) near Rostock (as reported by Reuter et al. [55]).
In the catena Rogalow, the Luvisol in the shoulderslope (6.1 kg·m−2) and footslope (8.9 kg·m−2) showed roughly the same C-stocks as in comparable soil units like luvisols from loess in Germany (ca. 6–8 kg·m−2 [57]). The C-stock in the catena Pikareinu and the Aric Regosol at the shoulder slope (12 kg·m−2) and the backslope (8.5 kg·m−2) are in the same range as comparable soil units, such as podzols in Germany (11…16 kg·m−2 [57]). The C-stock in the Thaptomollic Luvisol at the footslope (15 kg·m−2) is above the luvisols from loess (see above), which plausibly originates from buried (>50 cm) and, therefore, conserved SOM-rich soil material [59].
The described overall C accumulation downwards on the catenae confirms previous publications on comparable landscapes [19,56] but seems to be less pronounced than in hedgerow landscapes in France [60]. This SOM accumulation in all footslope positions (Table 3) generally agrees with SOM enrichments in depressional areas combined with SOM depletion in all upper slope-positions, explained as result of intensive crop production in undulated landscapes [4,5]. This is partly caused by tillage, as has been described for catenae with Cambisols and Luvisols in Denmark for top- as well as for subsoils [61]. Although the investigated catenae contained nearly the same C-stock as comparable soil units described in the literature, the remarkably higher C-stocks in the footslope subsoils of all catenae indicated a colluvial SOM conservation. Moreover, in all catenae, the lowest C-, N-contents and C-stocks were consistently determined to be in the backslope position, which, to the best of our knowledge, has not yet been described before as a common feature of arable landscapes. The only comparable report comes from a loess hilly-gully region in China where Li et al. [62] found minimum P stocks in midslope positions, but only in natural (and not artificial) grasslands on loess.

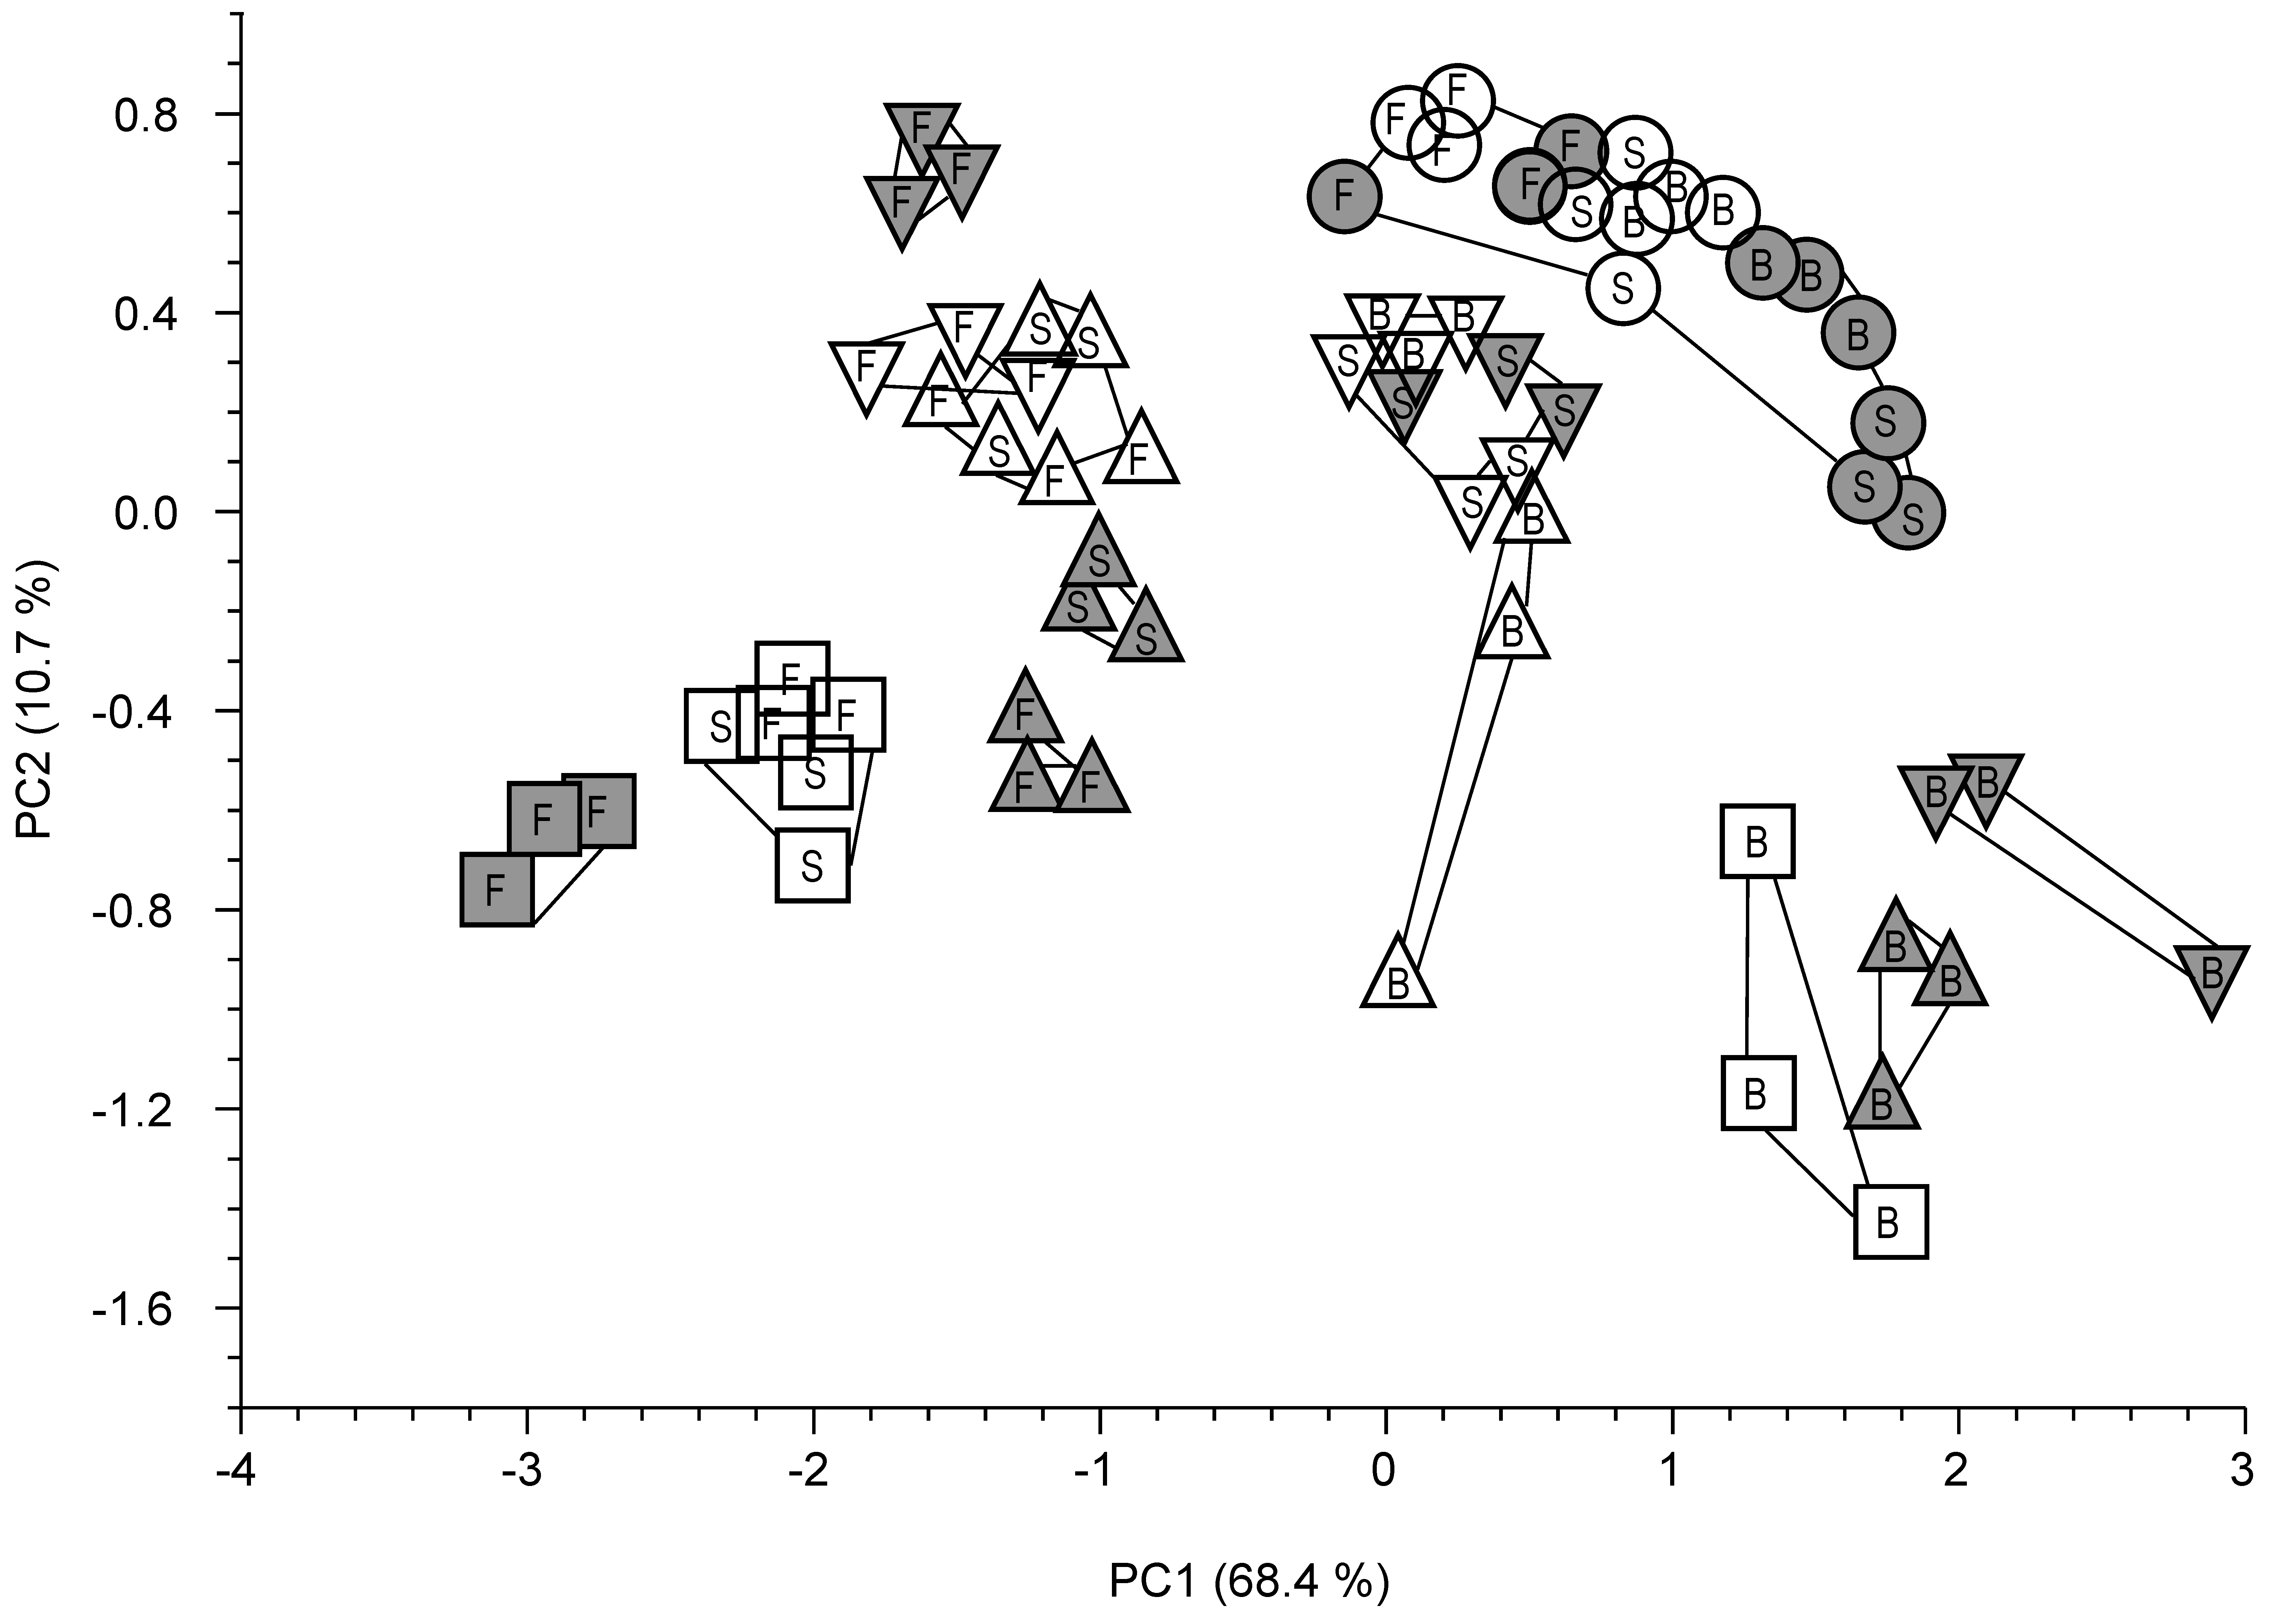
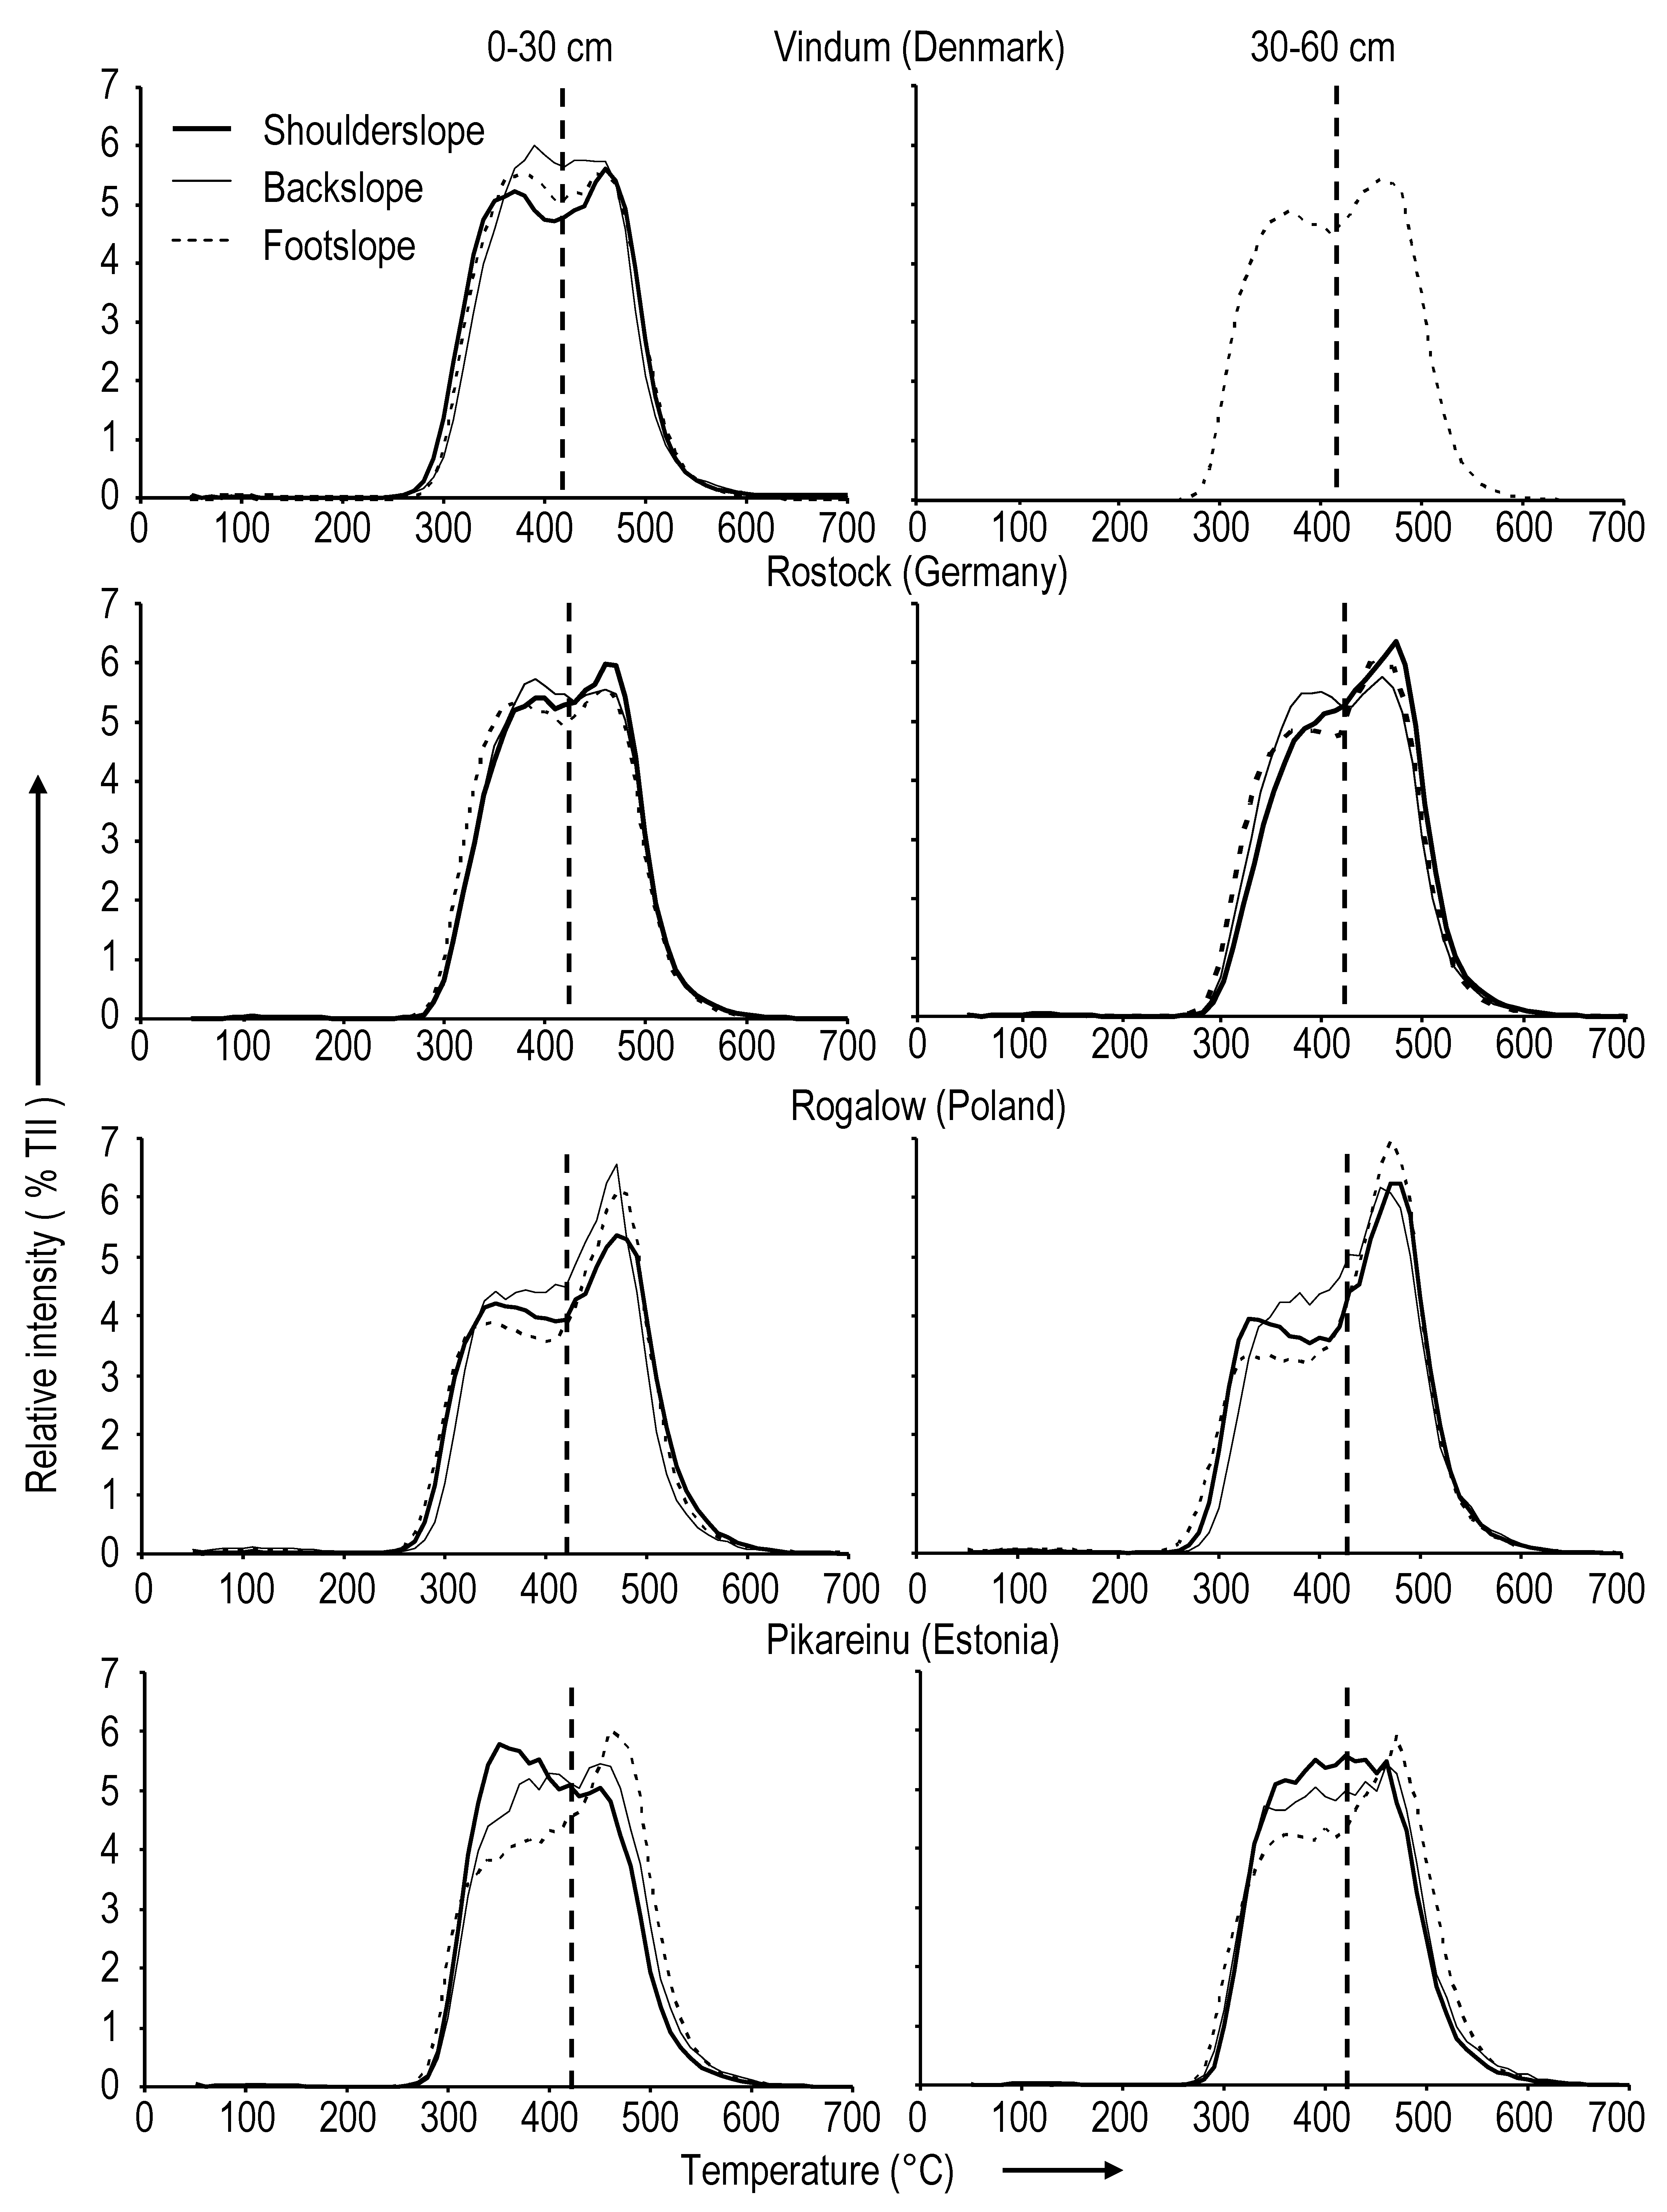
3.3. Detailed SOM Characterization by Py-FIMS

As an example for pronounced differences, the Py-FI mass spectra of 0–30 cm samples from the three positions of the catena in Pikareinu showed the predominance of markers of carbohydrates (m/z 60, 84, 96, 110, 124, 125, 126), phenols + lignin monomers (m/z 150, 194, 196, 208), alkylaromatic compounds (m/z 220, 234, 244), amino sugar (m/z 167), aromatic nitrogen (m/z 137), phytadiene from chlorophyll (m/z 278) and other alkadienes/alkenes (m/z 292, 306, 308, 320, 322, 336, 364, 392) (Figure 2). These markers are also at the highest intensity in the spectra of all catenae and depths (not shown). Additionally, the footslope soil in all catenae revealed peaks of ergosterol m/z 396, the [M–H2O]+ of nonacosanol m/z 406, and of nonacosanone m/z 422. These substances are also detected in every position in each catena but not at the highest intensity.
Because of the extremely low Corg concentrations at the shoulderslope (30–60 cm (1.7 g·kg−1)) and backslope (30–60 cm (1.6 g·kg−1)) in the catena Vindum, analysis with Py-FIMS was not possible.
The principal component analysis (PCA), involving all signals in the Py-FI mass spectra, was carried out to establish and visualize the mass-spectral differences or similarities among all samples (catenae, positions, depth; Figure 3), and to compute the most influencing m/z (not shown). If the whole sample set is considered, samples from the catena Rostock clearly showed the greatest similarities in SOM composition. In the Rogalow catena, the SOM at the shoulder-/footslope (both 0–30 cm and 30–60 cm) was clearly separated from the backslope (0–30 cm and 30–60 cm). This was also valid in the Vindum catena (0–30 cm). Furthermore, in the Pikareinu catena, the SOM at the footslope (0–30 cm and 30–60 cm) was clearly separated from the shoulderslope (0–30 cm and 30–60 cm) and from the backslope (30–60 cm). The separation of samples by this PCA was based mainly on signals from lipids and sterols (e.g., m/z 394, 396, 410, 424, 340, 368, 390, 438, 342, 382, 422, 380, 386), and some non-assigned signals (e.g., m/z 391, 370, 398, 366, 384, 425, 338, 395, 397) (ordered in each group according to relevance). By far the most influence on the separation was induced by coprostanol m/z 388 and ergosterin m/z 396, with the highest TII-proportion in the footslope and the lowest in the backslope samples. Samples from the catena in Rostock did not contain these sterols. Moreover, the biggest differences between the shoulderslope, backslope and footslope within the four catenae were generally caused by an abundance of signals from the lignin building blocks.
Separately, a second PCA for each single catena showed for Vindum that the SOM composition at the backslope clearly differed from the similar shoulder- and footslope SOM (Figure 4). This separation was based mainly on signals from the phenol + lignin monomers, sterols, lipids, free fatty acids, alkylaromatic compounds, N-containing compounds and lignin dimers (e.g., m/z 252, 394, 396, 392, 390, 368, 372, 364, 184, 333, 315, 156, 344, 410, 391), and from unassigned signals (e.g., m/z 366, 305, 404, 376, 348, 406, 362, 407, 336) (ordered in each compound class according to relevance). Similar differences became obvious for the Rostock catena as well. At 0-30 cm depth, the shoulder- and backslope position contained similar SOM, which differed from SOM at the footslope. In the 30–60 cm layer, SOM composition showed more pronounced differences between all three slope positions. These separations were based on signals from carbohydrates, phenols + lignin monomers, alkylaromatic compounds, lignin dimers, free fatty acids, N-containing compounds, lipids and nonaromatic amides (peptides, amino sugars) + free amino acids (e.g., m/z 132, 108, 94, 134, 148, 82, 110, 340, 326, 313, 284, 289, 127, 271, 184, 287, 301, 120, 286, 122) and from nonassigned signals (e.g., m/z 158, 290, 172, 118, 337) (ordered in each compound class according to relevance).
At Rogalow, the SOM composition at the shoulder- and footslope was clearly distinct from that of the backslope position in the 0–30 cm layer, which was comparable to findings for the Vindum catena. Furthermore, the SOM composition at a soil depth of 0–30 cm was clearly different to 30–60 cm at the backslope position. Here, the signals from N-containing compounds, nonaromatic amides (peptides, amino sugars) + free amino acids, carbohydrates, phenols + lignin monomers, alkylaromatic compounds, lipids, sterols, and free fatty acids (e.g., m/z 117, 58, 96, 94, 132, 120, 184, 95, 81, 134, 108, 202, 156, 394, 110, 82, 109, 170, 92, 382) and nonassigned signals (e.g., m/z 93, 44, 146, 131, 318) were mainly responsible for the separation (ordered in each compound class according to relevance).
The catena in Pikareinu had a similar SOM composition at the shoulder- and backslope at a soil depth of 0–30 cm but a clearly different SOM composition at the footslope. Whereas the subsoil SOM cannot be distinguished from the corresponding topsoil at the shoulder- and footslope, the PCA clearly separates the top- and subsoil SOM at the backslope position. Furthermore, the subsoil samples of shoulder-, back- and footslope were clearly separated. The signals mainly responsible for the separation were from free fatty acids, sterols, phenols + lignin monomers, lipids, alkylaromatic compounds, N-containing compounds, nonaromatic amides (peptides, amino sugars) + free amino acids and carbohydrates (e.g., m/z 383, 388, 194, 396, 402, 422, 170, 123, 414, 143, 136, 395, 413, 132, 412, 394, 392, 121) and nonassigned (e.g., m/z 118, 406, 384, 335, 93, 468, 351) (ordered in each compound class according to relevance).
The comparison of each of the 25 signals most responsible for the separations in the four single and all catenae revealed that the 27 signals were detected more than once (22 twice, 2 three times, 3 four times). These signals were mainly from lipids, sterols and lignin building blocks, followed by nonassigned signals and those for alkylaromatic compounds and carbohydrates. In general, the separation of samples by PCA was based mainly on signals from sterols and lipids typical for manure, especially coprostanol m/z 388 and ergosterin m/z 396, with the highest contents found in footslope samples and the lowest in backslope samples.
Assignment of the recorded m/z signals in the Py-FI mass spectra (% TII) to important classes of chemical compounds indicated that alkylaromatic compounds and/or phenols + lignin monomers were most abundant in all samples (Table 4). At the backslope positions (0–30 cm) in the Vindum, Rostock and Rogalow catenae, the relatively high proportions of carbohydrates, phenols + lignin monomers, alkylaromatic compounds, N-compounds and amides exceed those in the shoulderslope and footslope positions. The latter had relatively more lipids, lignin dimers, sterols and free fatty acids, which appeared to be depleted in the backslope positions. This distribution pattern was also valid for the soil depth of 30–60 cm in Rogalow. Furthermore, all footslope positions at 30–60 cm depths were characterized by relatively high proportions of lignin dimers, lipids, sterols and free fatty acids, which reached their highest values per catena in 14 out of 16 cases.
A three factorial ANOVA of compound class proportions (% TII) revealed that the proportions of all compound classes were significantly affected by the study sites and slope positions in the catenae (Table S1, shown in the Supplementary Materials). The only nonsignificant effects were obtained for depth effects on N-compounds and suberin and some corresponding interactions.
Direct comparisons of the proportions of SOM compound classes (% TII) for adjacent and distant positions along the catenae showed 72 and 69 significant differences out of 132 possible differences for the 0–30 cm and the 30–60 cm soil depths, respectively, and 48 significant out of 132 possible differences for the comparison of top- to subsoil, giving a total of about 48% significant differences (Table 5). For the backslope positions, which were particularly subjected to SOM losses (Table 3), depletions relative to the shoulder- and footslope positions at 0–30 cm were obvious for lignin dimers (Vindum, Rostock, Rogalow), sterols and free fatty acids (Vindum, Rogalow), lipids (Rogalow), suberin (Vindum). The 30–60 cm soil depths were relatively depleted in sterols and free fatty acids (Rogalow, Pikareinu) and lignin dimers, lipids and suberin (Rogalow).
In addition to the chemical composition reflected by signal patterns (Figure 2) and compound classes (Table 4), the thermal properties of SOM are also indicative of transformation and stabilization processes. Pronounced changes in the overall thermal stability were observed for the catenae in Rogalow and Pikareinu, which showed progressive increases in the proportions of thermally stabile SOM at the expense of thermally labile SOM from the shoulderslope downwards to the footslope positions (Figure 5).
Thermostabilities have also been calculated for the SOM compound classes. Their comparisons showed increases and decreases of thermostability along the catenae in Vindum, Rostock, Rogalow and Pikareinu between shoulderslope (SS) vs. backslope (BS), backslope (BS) vs. footslope (FS), and shoulderslope (SS) vs. footslope (FS). Differences were significant for 47 out of 144 possibilities for soil depths of 0–30 cm, 27 out of 144 for soil depths of 30–60 cm, and 27 of 144 for the comparison of top- to subsoil, totalling 23.4% significant differences (Table 6). Increases in SOM thermostability in the 0–30 cm layer downwards on the catena in Rogalow (Figure 5) were reflected by the significantly increased thermostability of lipids (shoulderslope < backslope) and suberin (shoulderslope < footslope). In the Pikareinu catena, more compound classes contributed to an increase in thermostability (phenols + lignin monomers, lignin dimers, alkylaromatics, amides: continuously through the whole catena, shoulderslope < backslope < footslope), carbohydrates and suberin (shoulderslope/backslope < footslope), lipids (shoulderslope < backslope/footslope). The samples from 30 to 60 cm from Rogalow showed increases in thermostability for lipids and free fatty acids (shoulderslope < backslope) and for lignin dimers and free fatty acids (shoulderslope < footslope). In Pikareinu, again, the increases in thermostability came from more compound classes: lignin dimers, lipids, free fatty acids (shoulderslope < backslope) and amides (shoulderslope < footslope).
Since it is known that thermally stabile compounds are less decomposable by microorganisms [39], the general trend towards a more thermally stable SOM, which is variable for individual compound classes and slope position comparisons, is interpreted as the residual accumulation of compounds that resisted microbial decomposition after disaggregation and erosional transport. These transformation processes preferentially mineralized the thermally labile proportions of carbohydrates. This process was supported by the decreased proportions down all catenae (Table 5). This partly disagrees with the more stabilized compounds at divergent shoulder- or backslope positions and more “active” compounds at footslope and depressional positions in the Canadian prairies, as reported in [12]. This partial disagreement can be explained by the different soil use, arable soils in the present study and prairie use for wildlife conservation in the study found in [12], or different soil moisture regimes. Nevertheless, thermostability evaluations indicate that the SOM dislocation from the shoulder- to the footslope field positions is accompanied by SOM transformations and alterations in thermal stability. This confirms similar observations of organic-mineral clay fractions from a pasture hillslope in Delaware [63].

3.4. Summarizing Discussion

Hypothesis 1, that SOM at the shoulder- and backslope positions is affected by erosive losses, is partly confirmed by the C-stocks and differences in chemical composition. However, we also found that the organic matter at backslope positions has been most strongly affected, as indicated by the smallest C-stocks (Table 2) and the most pronounced differences in chemical SOM composition compared to the upper shoulderslope as well as the lower footslope positions. The relatively high proportions of carbohydrates, phenols + lignin monomers, N-compounds and amides at the backslope positions at 0–30 cm of the catenae in Vindum, Rostock and Rogalow are interpreted as indicators of the ongoing microbial decomposition of primary organic matter that may have been stored in aggregates before the downwards transport and temporal deposition at the backslopes. Similar accumulations of readily degradable carbohydrates and non-aromatic amides (peptides, amino sugars) + free amino acids have been reported for divergent (i.e., water-shedding) slope positions in a hummocky landscape (St. Denis National Wildlife Area, Saskatoon, SK, Canada) [12], but the reasons may be different. In that study, snow accumulation and water shedding in divergent slope positions may have contributed to the molecular signature of SOM, whereas in the present study, the backslope positions obviously formed hot-spots of aerobic SOM transformations and decomposition. For the schematic presentation of SOM contents and transformation in Figure 1, this would mean that the transformation effects on SOM at backslope positions (bsT) are stronger than those at the shoulderslope (shT) and footslope positions (fsT): bsT > shT, fsT’. This phenomenon appears to be specific for arable soils on the glacial till, because both Auerwald and Fiener [53] reported that erosion and accumulation were balanced at the middle slope positions in grassland fields 20 years after conversions from cropland.
Hypothesis 2, that the SOM accumulation in depressional positions is due to an intrinsically stabile SOM from upslope positions or a suppressed oxidative decomposition of primary organic matter, is confirmed by the maximum C-concentrations and C-stocks at the footslope positions in the topsoils and subsoils (except for Rostock’s topsoil). We found that the SOM composition was more similar in both soil depths at the footslope position than at the more elevated positions that sowed more contrast between the two sampling depths. This similarity is interpreted as an effect of the successive burial of eroded topsoil material, which, in this way, gradually reaches a subsoil position. The observation, that lipids, lignin dimers, sterols and free fatty acids were in higher proportions in the footslope and shoulderslope positions, indicates a stabilization processes with similar results. These slowly degradable compounds, partly originating from the shoulderslope, were eroded and transported downwards in a mineral-bound status that made them resistant to microbial decomposition during passage of the backslope. A comparable accumulation of lipids and sterols in the top- and subsoil samples of cultivated Colluvisols, developed from eroded Luvisols at higher relief positions, was reported earlier by Beyer et al. [19] without considering backslopes. Furthermore, the low proportions of carbohydrates, phenols + lignin monomers, alkylaromatics, N-compounds and amides in the footslopes indicate suppressed microbial decomposition of the primary organic matter leading to their conservation in the depressional areas. This disagrees with the easily transported larger proportions of labile fractions of soil C in depositional sites in Canada (reported in [7]) but agrees with the high relative abundance of lignin dimers, lipids and sterols at the footslope positions in the relief of a hummocky landscape (St. Denis National Wildlife Area, Saskatoon, Saskatchewan, Canada) [12]. The equation depicting the dependencies of SOM contents in Figure 1 means that the larger sum of inputs (Idep), coinciding with the smaller “complete” transformations to CO2 at wetter and more often anaerobic sites, plausibly explains the SOM stock enrichment. In comparison with the schematic equations for the other sites, this means that fsTeda < shTeda, bsTeda. These relationships agree with the observations of Salazar et al. [64] at the forest sites.
In summary, the different SOM compositions at the shoulder-, back- and footslope positions in all investigated catenae and the accumulation of thermally stabile compounds from the shoulder- to the footslope are interpreted by (i) the SOM formation that is driven by different parameters along the catena (e.g., a different pedogenesis in the colluvium), (ii) an SOM alteration during the erosive transport from shoulder- to the footslope field positions, and (iii) more likely, a combination of both. This redistribution of SOM and “fertile” soil particles in the fields has practical consequences. For instance, a rough calculation of the stocks of plant available P, applying recent P-data by Koch et al. [65] (an average of 12% of Pt = plant available), and an average P removal of 20 kg·ha−1 with the harvest, indicates that the backslope positions have sufficient P for about 25 harvests, whereas, at footslope positions, the available P stock is sufficient for about 31 harvests. For CEC and the resulting holding capacity for cationic plant nutrients, the relationships are similar (Table 3). Although many other factors affect nutrient availability and uptake, these greatly uneven distributions of important soil fertility parameters require adapted soil management.

4. Conclusions

(i)
Since we found some common properties for specific catena positions despite quite different geographic origins and management histories in the catenae under study, we can conclude that the experimental approach to combine basic soil physical and chemical soil parameters with a very detailed data set on the SOM molecular composition and thermal stability from Py-FIMS was suitable to describe the effects of soil erosion on SOM and on the overall soil fertility in agricultural fields from the Weichselian glacial and periglacial (i.e., loess) deposits in the Baltic Sea catchment.
(ii)
Since the special character of the backslope positions has been disclosed as a common characteristic of all these catenae for the first time, forthcoming studies should not be restricted to top and bottom positions in fields but also involve the intermediate positions that are characterized by transitions between erosive losses and depositional accumulations. Balancing these material transfers for field situations with a different curvature of the slopes seems to be an attractive scientific approache that may lead to sound data inputs into coupled erosion/SOM turnover models.
(iii)
The heterogeneity in the distribution of SOM-stocks, and related nutrient reserves along the catenae, representing field heterogeneity, call for an adapted soil management that (1) generally reduces soil erosion by covering the soil surface and reducing the length of erosive slopes (e.g., avoiding the “classical” backslope positions that are found here as hot spots of the SOM turnover, e.g., by establishment of barriers, hedges, etc.), and establishing soil amendments, such as manure and compost, preferentially at field sites of special demand (shoulderslope, backslope > footslope).

Supplementary Materials

The following are available online at https://www.mdpi.com/2571-8789/3/2/42/s1, Table S1: ANOVA results (P values) of the compound class proportions (% TII (Total Ion Intensity)) of organic soil matter determined with Py-FIMS in the catenae Vindum, Rostock, Rogalow and Pikareinu on the shoulder-, back-, and footslope position at a soil depth of 0–30 cm and 30–60 cm. Significant effects are indicated by P < 0.05, P < 0.01, and P < 0.001 (n = 3) (df Error = 49).

Author Contributions

Conceptualization, G.J., C.B., G.H., M.H.G., Ü.M., B.M.-K., J.N. and P.L.; Data curation, G.J., C.B., G.H., A.K., Ü.M., J.N. and K.-U.E.; Investigation, G.J., G.H., M.H.G., A.K., J.N. and K.-U.E.; Methodology, G.J., G.H., Ü.M., B.M.-K., K.-U.E. and P.L.; Supervision, G.J. and P.L.; Writing—original draft, G.J.; Writing—review & editing, G.J., G.H., Ü.M. and P.L.

Funding

The authors are grateful for the financial support of the German Federal Ministry of Education and Research, project NOE 10/030: “The state and fate of soil carbon stocks on arable land of the Baltic rim” (Project ID: 6171), in the frame of the call “Circum Mare Balticum” to buildup research networks with partners from Baltic Sea neighbouring countries.

Acknowledgments

The authors are grateful to R. Beese and U. Mast (University of Rostock, Faculty of Agricultural and Environmental Sciences, Germany) for the technical support and their contributions to the presented work. This study was also supported by Ministry of Education and Science of Estonia grants nos. SF0180127s08 and IUT2-16, and the EU through the European Regional Development Fund (Center of Excellence ENVIRON).

Conflicts of Interest

The authors declare no conflict of interest.

References

  1. De Vente, J.; Poesen, J.; Verstraeten, G.; Govers, G.; Vanmaercke, M.; van Rompaey, A.; Arabkhedri, M.; Boix-Fayos, C. Predicting soil erosion and sediment yield at regional scales: Where do we stand? Earth-Sci. Rev. 2013, 127, 16–29. [Google Scholar] [CrossRef]
  2. Virto, I.; Imaz, M.J.; Fernández-Ugalde, O.; Gartzia-Bengoetxea, N.; Enrique, A.; Bescansa, P. Review Soil Degradation and Soil Quality in Western Europe: Current Situation and Future Perspectives. Sustainability 2015, 7, 313–365. [Google Scholar] [CrossRef]
  3. Lugato, E.; Smith, P.; Borrelli, P.; Panagos, P.; Ballabio, C.; Orgiazzi, A.; Oihane, F.-U.; Montanarella, L.; Jones, A. Soil erosion is unlikely to drive a future carbon sink in Europe. Sci. Adv. 2018, 4. [Google Scholar] [CrossRef] [PubMed]
  4. Pennock, D.J.; Anderson, D.W.; de Jong, E. Landscape-scale changes in indicators of soil quality due to cultivation in Saskatchewan, Canada. Geoderma 1994, 64, 1–19. [Google Scholar] [CrossRef]
  5. Landi, A.; Mermut, A.R.; Anderson, D.W. Carbon distribution in a hummocky landscape from Saskatchewan, Canada. Soil Sci. Soc. Am. J. 2004, 68, 175–184. [Google Scholar] [CrossRef]
  6. Mayer, S.; Schwindt, D.; Steffens, M.; Völkel, J.; Kögel-Knabner, I. Drivers of organic carbon allocation in a temperate slope-floodplain catena under agricultural use. Geoderma 2018, 327, 63–72. [Google Scholar] [CrossRef]
  7. Gregorich, E.G.; Greer, K.J.; Anderson, D.W.; Liang, B.C. Carbon distribution and losses: Erosion and deposition effects. Soil Tillage Res. 1998, 47, 291–302. [Google Scholar] [CrossRef]
  8. Ma, W.K.; Bedard-Haughn, A.; Siciliano, S.D.; Farrell, R.E. Relationship between nitrifier and denitrifier community composition and abundance in predicting nitrous oxide emissions from ephemeral wetland soils. Soil Biol. Biochem. 2008, 40, 1114–1123. [Google Scholar] [CrossRef]
  9. Walley, F.L.; van Kessel, C.; Pennock, D.J. Landscape-scale variability of N mineralization in forest soils. Soil Biol. Biochem. 1996, 28, 383–391. [Google Scholar] [CrossRef]
  10. Pennock, D.J.; van Kessel, C.; Farrell, R.E.; Sutherland, R.A. Landscape-scale variations in denitrifi cation. Soil Sci. Soc. Am. J. 1992, 56, 770–776. [Google Scholar] [CrossRef]
  11. Van Kessel, C.; Pennock, D.J.; Farrell, R.E. Seasonal variations in denitrification and nitrous oxide evolution at the landscape scale. Soil Sci. Soc. Am. J. 1993, 57, 988–995. [Google Scholar] [CrossRef]
  12. Gillespie, A.W.; Walley, F.L.; Farrell, R.E.; Leinweber, P.; Eckhardt, K.-U.; Regier, T.Z.; Blyth, R.I.R. XANES and pyrolysis-FIMS evidence of organic matter composition in a hummocky landscape. Soil Sci. Soc. Am. J. 2011, 75, 1741–1755. [Google Scholar] [CrossRef]
  13. Leinweber, P.; Jandl, G.; Eckhardt, K.-U.; Schlichting, A.; Hofmann, D.; Schulten, H.-R. Analytical Pyrolysis and Soft-Ionization Mass Spectrometry. In Biophysico-Chemical Processes Involving Natural Nonliving Organic Matter in Environmental Systems; Senesi, N., Xing, B., Huang, P.M., Eds.; John Wiley & Sons, Inc.: Chichester, UK, 2009; pp. 539–588. [Google Scholar]
  14. Thiele-Bruhn, S.; Leinweber, P.; Eckhardt, K.-U.; Siemc, H.K.; Blume, H.-P. Chernozem properties of Black Soils in the Baltic region of Germany as revealed by mass-spectrometric fingerprinting of organic matter. Geoderma 2014, 213, 144–154. [Google Scholar] [CrossRef]
  15. Acksel, A.; Amelung, W.; Kühn, P.; Gehrt, E.; Regier, T.; Leinweber, P. Soil organic matter characteristics as indicator of Chernozem genesis in the Baltic Sea region. Geoderma Reg. 2016, 7, 187–200. [Google Scholar] [CrossRef]
  16. Acksel, A.; Kappenberg, A.; Kühn, P.; Leinweber, P. Human activity formed deep, dark topsoils around the Baltic Sea. Geoderma Reg. 2017, 10, 93–101. [Google Scholar] [CrossRef]
  17. Acksel, A.; Giani, L.; Stasch, C.; Kühn, P.; Eiter, S.; Potthoff, K.; Regier, T.; Leinweber, P. 2019. Humus-rich topsoils in SW Norway–Molecular and isotopic signatures of soil organic matter as indicators for anthropo-pedogensis. Catena 2019, 12, 831–845. [Google Scholar] [CrossRef]
  18. Jandl, G.; Acksel, A.; Baum, C.; Leinweber, P. Indicators for soil organic matter quality in no-till soils under perennial crops in Central Sweden. Soil Tillage Res. 2015, 148, 74–84. [Google Scholar] [CrossRef]
  19. Beyer, L.; Blume, H.-P.; Köbbemann, C. Colluvisols under cultivation in Schleswig-Holstein. 3. Soil organic matter transformation after translocation. J. Plant Nutr. Soil Sci. 1999, 162, 61–69. [Google Scholar] [CrossRef]
  20. Doetterl, S.; Six, J.; Van Wesemael, B.; Van Oost, K. Carbon cycling in eroding landscapes: Geomorphic controls on soil organic C pool composition and C stabilization. Glob. Chang. Biol. 2012, 18, 2218–2232. [Google Scholar] [CrossRef]
  21. Kirkels, F.M.S.A.; Cammeraat, L.H.; Kuhn, N.J. The fate of soil organic carbon upon erosion, transport and deposition in agricultural landscapes—A review of different concepts. Geomorphology 2014, 226, 94–105. [Google Scholar] [CrossRef]
  22. Lal, R. Soil erosion and the global carbon budget. Environ. Int. 2003, 29, 437–450. [Google Scholar] [CrossRef]
  23. Aldana Jague, E.; Sommer, M.; Saby, N.P.A.; Cornelis, J.-T.; van Wesemael, B.; Van Oost, K. High resolution characterization of the soil organic carbon depth profile in a soil landscape affected by erosion. Soil Tillage Res. 2016, 156, 185–193. [Google Scholar] [CrossRef]
  24. Angst, G.; Kögel-Knabner, I.; Kirfel, K.; Hertel, D.; Mueller, C.W. Spatial distribution and chemical composition of soil organic matter fractions in rhizosphere and non-rhizosphere soil under European beech (Fagus sylvatica L.). Geoderma 2016, 264, 179–187. [Google Scholar] [CrossRef]
  25. Batjes, N.H. Total carbon and nitrogen in the soils of the world. Eur. J. Soil Sci. 1996, 47, 151–163. [Google Scholar] [CrossRef]
  26. Rumpel, C.; Kögel-Knabner, I. Deep soil organic matter—A key but poorly understood component of terrestrial C cycle. Plant Soil 2010, 338, 143–158. [Google Scholar] [CrossRef]
  27. Lal, R. Accelerated soil erosion as a source of atmospheric CO2. Soil. Tillage Res. 2019, 188, 35–40. [Google Scholar] [CrossRef]
  28. Djurhuus, J.; Olesen, J.E. Characterisation of Four Sites in Denmark for Long-Term Experiments on Crop Rotations for Organic Farming; DIAS Report Plant Production; Danmarks JordbrugsForskning: Tjele, Denmark, 2000; Volume 33, 74p. [Google Scholar]
  29. Ruhe, R.V. Elements of the soil landscape. In Transactions of 7th International Congress of Soil Science; International Society of Soil Science: Madison, WI, USA, 1996; pp. 165–170. [Google Scholar]
  30. Soil Survey Division Staff. Soil Survey Manual Soil Conservation Service; Handbook 18; US. Department of Agriculture: Washington, DC, USA, 1993.
  31. Klute, A. (Ed.) Water retention: Laboratory methods. In Methods of Soil Analysis, Part 1. Physical and Mineralogical Methods; American Society of Agronomy-Soil Science Society of America: Madison, WI, USA, 1986; pp. 635–662. [Google Scholar]
  32. Resurreccion, A.C.; Moldrup, P.; Tuller, M.; Ferre, T.; Kawamoto, K.; Komatsu, T.; de Jonge, L.W. The soil-water characteristic curve at low soil-water contents: Relationships with soil specific surface area and texture. Water Resourc. Res. 2011, 47, W06522. [Google Scholar] [CrossRef]
  33. Murphy, J.; Riley, J.P. A modified single solution method for the determination of phosphate in natural waters. Anal. Chem. Acta 1962, 27, 31–36. [Google Scholar] [CrossRef]
  34. Kafkafi, U. Soil phosphorus. In Analytical Chemistry of Phosphorus Compounds; Halmann, M., Ed.; John Wiley: New York, NY, USA, 1972; pp. 727–741. [Google Scholar]
  35. Ostrowska, A.; Gawliński, S.; Szczubiałka, Z. Methods of Analysis and Evaluation of the Soils and Plant Properties; IOŚ: Warsaw, Poland, 1991. (In Polish) [Google Scholar]
  36. Schulten, H.-R.; Leinweber, P.; Schnitzer, M. Analytical pyrolysis and computer modelling of humic and soil particles. In IUPAC Environmental Analytical and Physical Chemistry Series; Environmental Particles: Structure and Surface Reactions of Soil Particles; Huang, P.M., Senesi, N., Buffle, J., Eds.; Wiley: Chichester, UK, 1998; Volume 4, pp. 281–324. [Google Scholar]
  37. Leinweber, P.; Kruse, J.; Baum, C.; Arcand, M.; Knight, J.D.; Farrell, R.; Eckhardt, K.-U.; Kiersch, K.; Jandl, G. Advances in understanding organic nitrogen chemistry in soils using state-of-the-art analytical techniques. Adv. Agron. 2012, 119, 83–151. [Google Scholar]
  38. Kalbitz, K.; Schwesig, D.; Schmerwitz, J.; Kaiser, K.; Haumaier, L.; Glaser, B.; Ellerbrock, R.; Leinweber, P. Changes in properties of soil-derived dissolved organic matter induced by biodegradation. Soil Biol. Biochem. 2003, 35, 1129–1142. [Google Scholar] [CrossRef]
  39. Leinweber, P.; Jandl, G.; Baum, C.; Eckhardt, K.-U.; Kandeler, E. Stability and composition of soil organic matter control respiration and soil enzyme activities. Soil Biol. Biochem. 2008, 40, 1496–1505. [Google Scholar] [CrossRef]
  40. STATISTICA. STATISTICA for Windows Software, Release 5.10; StatSoft: Tulsa, OK, USA, 1996. [Google Scholar]
  41. R Core Team R. A Language and Environment for Statistical Computing; R Foundation for Statistical Computing: Vienna, Austria, 2014; Available online: http://www.R-project.org/ (accessed on 9 October 2018).
  42. Adhikari, K.; Minasny, B.; Greve, M.B.; Greve, M.H. Constructing a soil class map of Denmark based on the FAO legend using digital techniques. Geoderma 2014, 214–215, 101–113. [Google Scholar] [CrossRef]
  43. Madsen, H.B.; Nørr, A.H.; Holst, K.A. Atlas over Danmark. Serie I, Bind 3; Den Danske Jordklassificering; Det Kongelige Danske Geografiske Selskab: København, Denmark, 1992. [Google Scholar]
  44. Adhikari, K.; Bou Kheir, R.; Greve, M.B.; Greve, M.H.; Malone, B.P.; Minasny, B.; McBratney, A.B. Mapping soil pH and bulk density at multiple soil depths in Denmark. In Proceedings of the 1st GlobalSoilMap Conference: Basis of the Global Spatial Soil Information System, Orléans, France, 7–9 October 2013; pp. 155–160. [Google Scholar]
  45. Leinweber, P.; Menning, P. Character of compacted layers in arable soils on loamy Moraine sites in Mecklenburg [Germany]. J. Rural Eng. Dev. 1992, 33, 100–107. (in Germany). [Google Scholar]
  46. Brzezińska, M.; Lipiec, J.; Frąc, M.; Oszust, K.; Szarlip, P.; Turski, M. Quantitative interactions between total and specific enzyme activities and C and N contents in earthworm-affected pear orchard soil. Land Degrad. Dev. 2018, 1–11. [Google Scholar] [CrossRef]
  47. Lipiec, J.; Frac, M.; Brzezinska, M.; Turski, M.; Oszust, K. Linking microbial enzymatic activities and functional diversity of soil around earthworm burrows and casts. Front. Microbiol. 2016, 7, 1–8. [Google Scholar] [CrossRef]
  48. Adamczyk, B.; Bialousz, S.; Borkowski, J.; Borowiec, J.; Ciesla, W.; Dobrzanski, B.; Konecka-Betley, K.; Kowalinski, S.; Kowalkowski, A.; Królikowski, L.; et al. Polskie Towarzystwo Gleboznawcze; Album, G.P., Królikowski, L., Eds.; Panstwowe Wydawnictwo Naukowe: Warszawa, Poland, 1986. [Google Scholar]
  49. Turski, M.; Witkowska-Walczak, B. Soil physical properties of Luvisols developed from silty material of various origins. Rozprawy I Monografie 2004, 101, 1–58. (In Polish) [Google Scholar]
  50. Rejman, J. Redistribution of basic physical properties and water content of soils in a loess catchment. Acta Agrophys. Mono. 2013, 5, 1–106. [Google Scholar]
  51. Turski, R.; Paluszek, J.; Słowińska-Jurkiewicz, A. Erosion effect on physical properties of soils developed from loess. Roczniki Gleboznawcze 1987, 38, 37–49. (In Polish) [Google Scholar]
  52. Suuster, E.; Ritz, C.; Roostalu, H.; Reintam, E.; Kõlli, R.; Astover, A. Soil bulk density pedotransfer functions of the humus horizon in arable soils. Geoderma 2011, 163, 74–82. [Google Scholar] [CrossRef]
  53. Auerswald, K.; Fiener, P. Soil organic carbon storage following conversion from cropland to grassland on sites differing in soil drainage and erosion history. Sci. Total Environ. 2019, 661, 481–491. [Google Scholar] [CrossRef]
  54. Chirinda, N.; Roncossek, S.D.; Heckrath, G.; Elsgaard, L.; Thomsen, I.K.; Olesen, J.E. Root and soil carbon distribution at shoulderslope and footslope positions of temperate toposequences cropped to winter wheat. Catena 2014, 123, 99–105. [Google Scholar] [CrossRef]
  55. Reuter, G.; Böttcher, H.; Honermeier, B.; Kopp, H.; Lange, G.; Makowski, N.; Mueller, K.; Teltschik, K. Diversity of humus stocks in the arable soil of the Late Pleistoceine ground morains in Mecklenburg, West Pomerania, Germany. Arch. Agron. Soil Sci. 2007, 53, 231–240. [Google Scholar] [CrossRef]
  56. Kõlli, R.; Ellermäe, O.; Kauer, K.; Köster, T. Erosion-affected soils in the Estonian landscape: Humus status, patterns and classification. Arch. Agron. Soil Sci. 2010, 56, 149–164. [Google Scholar]
  57. Blume, H.-P.; Brümmer, G.W.; Horn, R.; Kandeler, E.; Kögel-Knabner, I.; Kretzschmar, R.; Stahr, K.; Wilke, B.-M.; Thiele-Bruhn, S.; Welp, G. Scheffer/Schachtschabel: Lehrbuch der Bodenkunde; Spektrum Akademischer Verlag: Heidelberg, Germany, 2010; p. 569. [Google Scholar]
  58. Chirinda, N.; Elsgaard, L.; Thomsen, I.K.; Heckrath, G.; Olesen, J.E. Carbon dynamics in topsoil and subsoil along a cultivated toposequence. Catena 2014, 120, 20–28. [Google Scholar] [CrossRef]
  59. Quantin, P.; Spaargaren, O. Classification of the Reference Pedons: World Reference Base for Soil Resources and Soil Taxonomy. In Soils of Volcanic Regions in Europe; Springer: New York, NY, USA, 2007. [Google Scholar] [CrossRef]
  60. Walter, C.; Merot, P.; Layer, B.; Dutin, G. The effect of hedgerows on soil organic carbon storage in hillslopes. Soil Use Manag. 2003, 19, 201–207. [Google Scholar] [CrossRef]
  61. Heckrath, G.; Djurhuus, J.; Quine, T.A.; Van Oost, K.; Govers, G.; Zhang, Y. Tillage erosion and its effect on soil properties and crop yield in Denmark. J. Environ. Qual. 2005, 34, 312–324. [Google Scholar] [PubMed]
  62. Li, Z.; Liu, C.; Dong, Y.; Chang, X.; Nie, X.; Liu, L.; Xiao, H.; Lu, Y.; Zeng, G. response of soil organic carbon and nitrogen stocks to soil erosion and land use types in the Loess hilly–gully region of China. Soil Tillage Res. 2017, 166, 1–9. [Google Scholar] [CrossRef]
  63. Chen, C.; Leinweber, P.; Eckhardt, K.-U.; Sparks, D.L. The composition and stability of clay-associated organic matter along a soil profile. Soil Syst. 2018, 2, 16. [Google Scholar] [CrossRef]
  64. Salazar, S.; Sanchez, L.; Alvarez, J.; Valverde, A.; Galindo, P.; Igual, J.M.; Peix, A.; Santa-Regina, I. Correlation among soil enzyme activities under different forest system management practices. Ecol. Eng. 2011, 37, 1123–1131. [Google Scholar] [CrossRef]
  65. Koch, M.; Kruse, J.; Eichler-Löbermann, B.; Zimmer, D.; Willbold, S.; Leinweber, P.; Siebers, N. Phosphorus stocks and speciation in soil profiles of a long-term fertilizer experiment: Evidence from sequential fractionation, P K -edge XANES, and 31 P NMR spectroscopy. Geoderma 2018, 316, 115–126. [Google Scholar] [CrossRef]
Figure 1. Schematic presentation of sampling points in a typical catena in an undulated Pleistocene landscape with hypothetical description of processes that govern soil organic matter (SOM) content and composition at certain catena positions: At the upper slope position, the SOM content, composition and pool size in the tilled A-horizon (1) is a function of the inputs (I) of litter (aboveground and belowground (l)) and of subsoil material (Isub), because erosion in combination with constant tillage depth mixes in subsoil material into the tilled upper soil horizon. Furthermore, transformations by all soil organisms (edaphon; Teda) and various stabilization mechanisms (S) affect the SOM at this position. As the mixed-in subsoil material usually is poorer in SOM, the binding of organic molecules by “fresh” mineral surfaces is likely an important stabilization mechanism at this catena position. Losses may occur by leaching (l), turbation (tur), and erosion (e). Consequently, the SOM in the corresponding subsoil horizon (2) is affected by inputs from litter (Il)—mostly from roots and rhizodeposits—and dissolved organic matter (DOM) or organics brought into the depth by organisms (turb), biotic transformations (Teda) and leaching losses (Ll), e.g., of DOM towards the groundwater. At the backslope position (3), another factor, transformations by transport of SOM from position (1) to (3), likely affects the SOM because transport most probably is linked with aggregate disruption and exposure of interaggregate OM to microbial decomposition. In the subsoil at this position, the same factors may influence the SOM as in the upper slope position. Finally, SOM in the footslope position may be affected by somewhat reduced aerobic decomposition [(4) T’eda < Teda], because at this position, a higher groundwater level causing temporary anaerobic conditions restricts SOM decomposition (at least temporarily) [6]. In addition to the stabilization mechanisms valid for all slope positions and profile depths, in subsoils, the accumulation of redox-sensitive pedogenic oxides may provide additional reactive surfaces [(5) S’ > S], hypothetically resulting in more stabilized SOM compounds.
Soilsystems 03 00042 g001
Figure 2. Summed and averaged (n = 3) pyrolysis-field ionization mass spectra and thermograms (insert upper right) of the total ion intensity of the soils from the catena Pikareinu (Estonia) at soil depths of 0–30 cm from the (a) shoulderslope, (b) backslope and (c) footslope.
Soilsystems 03 00042 g002
Figure 3. Principal component analysis of the pyrolysis-field ionization mass spectra (m/z 15 to 900) of the catenae in Vindum (Denmark) (0–30 cm: -□- and 30–60 cm: -■-), Rostock (Germany) (0–30 cm: -○- and 30–60 cm: -●-), Rogalow (Poland) (0–30 cm: -Δ- and 30–60 cm: -▲-) and Pikareinu (Estonia) (0–30 cm: -∇- and 30–60 cm: -▼-) for shoulderslope “S”, backslope “B” and footslope “F” positions in the catena.
Soilsystems 03 00042 g003
Figure 4. Principal component analysis of the pyrolysis-field ionization mass spectra (m/z 15 to 900) of each single catena: Vindum (Denmark) (0–30 cm: -□- and 30–60 cm: -■-), Rostock (Germany) (0–30 cm: -○- and 30–60 cm: -●-), Rogalow (Poland) (0–30 cm: -Δ- and 30–60 cm: -▲-) and Pikareinu (Estonia) (0–30 cm: -∇- and 30–60 cm: -▼-) for shoulderslope “S”, backslope “B” and footslope “F” positions in the catena.
Soilsystems 03 00042 g004
Figure 5. Thermograms for the volatilization of substances in the mass range m/z 15.900 in the catenae in Vindum (Denmark), Rostock (Germany), Rogalow (Poland) and Pikareinu (Estonia) at the shoulderslope (-), backslope (-) and footslope (- - -) at soil depths of 0–30 cm and 30–60 cm. The dotted vertical line symbolizes the temperature for the separation into thermally labile (<420 °C) and stabile (≥420 °C) proportions.
Soilsystems 03 00042 g005
Table 1. Description of the catenae in Vindum (Denmark), Rostock (Germany), Rogalow (Poland) and Pikareinu (Estonia).
Geographical Coordinates Soil Unit 1 Average Annual Temperature (°C)Average Precipitation (mm)
ShoulderslopeBackslopeFootslopeShoulderslopeBackslopeFootslope
Vindum 56°22′30.9″ N
9°33′32.8″ E
56°22′31.0″ N
9°33′33.5″ E
56°22′31.1″ N
9°33′34.2″ E
Stagnic PodzoluvisolStagnic PodzoluvisolAric Anthrosol7.3704
Terrain slope (degrees)4.811.56.7
Profile curvature 2−0.013−0.0020.011
Horizontal distance (m)01123
Elevation a.s.l. (m) 3646259
Rostock 54°1′58.51″ N
12°6′12.92″ E
54°1′57.63″ N
12°6′17.74″ E
54°1′56.83″ N
12°6′22.33″ E
Eutric LeptosolStagnic AnthrosolGleyic Anthrosol8.1600
Terrain slope (degrees)4.53.01.6
Profile curvature 2−0.0870.0020.547
Horizontal distance (m)091179
Elevation a.s.l. (m) 3433734
Rogalow 51°19′06″ N
22°08′30″ E
51°19′05.5″ N
22°08′32.1″ E
51°19′06.8″ N
22°08′31.8″ E
Halpic LuvisolHaplic LuvisolHaplic Luvisol7.7550
Horizontal distance (m)02964
Elevation a.s.l. (m) 3197191185
Pikareinu 58°6′13.7″ N
26°39′55.4″ E
58°6′14.6″ N
26°39′57″ E
58°6′71″ N
26°40′2.8″ E
Aric RegosolAric RegosolThaptomollic Luvisol5.7719
Horizontal distance (m)04281
Elevation a.s.l. (m) 3162160153
1 World reference base (WRB); 2 Change in slope in gradient direction, negative values indicate convex, positive values concave surfaces; 3 a.s.l.: above sea level.
Table 2. Particle-size fractions, texture class, bulk density, porosity, water retention capacity: permanent wilting point (PWP), field capacity (FC), plant available water (PAW) of the catenae in Vindum (Denmark), Rostock (Germany), Rogalow (Poland) and Pikareinu (Estonia).
Soil Depth (cm)Clay (%)Silt (%)Sand (%)Texture ClassBulk Density (g·cm−3)Porosity (vol.%)Water Retention Capacity (v/v) (vol.%)
FC (pF 1.7)PWP (pF 4.2)PAW
Vindum
Shoulderslope0–3032374Loamy sand1.434627819
30–60122068Sandy loam1.7633281117
Backslope0–3092368Sandy loam1.623926918
30–60132562Sandy loam1.743427720
Footslope0–3052570Sandy loam1.564129821
30–6042571Sandy loam1.564128820
Rostock
Shoulderslope0–3062965Sandy loam1.344933627
30–6062866Sandy loam1.594030723
Backslope0–3043264Sandy loam1.514331724
30–6063064Sandy loam1.514329623
Footslope0–3022969Sandy loam1.514331724
30–6023068Sandy loam1.574129623
Rogalow
Shoulderslope0–3037522Silt loam1.215440436
30–6027622Silt loam1.384841437
Backslope0–3037423Silt loam1.275237532
30–6037621Silt loam1.434639534
Footslope0–3047125Silt loam1.464540635
30–6057223Silt loam1.454540535
Pikareinu
Shoulderslope0–3073558Sandy loam1.285227522
30–6083656Sandy loam1.574133528
Backslope0–3073558Sandy loam1.325028524
30–6063559Sandy loam1.643824630
Footslope0–3043462Sandy loam1.374835531
30–6033661Sandy loam1.484436432
Table 3. pH value, C-, N-, and S-concentrations, C:N ratio, C stock, total phosphorous concentration (Pt), cation exchange capacity (CEC) of the catenae in Vindum (Denmark), Rostock (Germany), Rogalow (Poland) and Pikareinu (Estonia).
Soil Depth
(cm)
pH
(in KCl)
C
(g·kg−1)
N
(g·kg−1)
C:N RatioC Stock
(kg·m−2)
Σ C Stock 0–60 cm
(kg·m−2)
S
(g·kg−1)
Pt
(mg·kg−1)
CEC
(cmol(+)·kg−1)
Vindum
Shoulderslope0–306.010.41.19.54.55.40.195337.37
30–605.21.70.35.70.9 0.16017.61
Backslope0–305.56.10.78.73.03.80.15138.45
30–604.71.60.35.30.8 0.074108.92
Footslope0–306.112.71.39.85.9120.186138.59
30–606.712.81.210.76.0 0.166439.61
Rostock
Shoulderslope0–305.414.11.87.85.78.50.225987.46
30–605.55.90.87.42.8 0.095207.21
Backslope0–305.86.60.88.33.05.40.144987.65
30–605.85.20.68.72.4 0.114987.35
Footslope0–305.49.31.18.54.29.10.166418.56
30–605.810.41.28.74.9 0.155718.04
Rogalow
Shoulderslope0–306.69.21.09.23.46.10.185336.76
30–606.26.60.88.32.7 0.145075.74
Backslope0–306.18.40.99.33.25.70.134616.24
30–605.75.70.78.12.5 0.094386.19
Footslope0–305.310.61.19.64.78.90.225606.63
30–604.19.61.09.64.2 0.124876.55
Pikareinu
Shoulderslope0–306.413.21.58.85.1120.1856010.71
30–606.613.51.59.06.4 0.1549011.03
Backslope0–306.111.81.39.14.78.50.154579.93
30–605.87.70.98.63.8 0.14477.53
Footslope0–306.716.51.79.76.8150.4652511.3
30–606.617.71.89.87.9 0.249811.03
Table 4. Abundance of compound classes determined by pyrolysis-field ionization mass spectrometry in % TII (total ion intensity) in the catenae in Vindum (Denmark), Rostock (Germany), Rogalow (Poland) and Pikareinu (Estonia).
Soil Depth (cm)CarbohydratesPhenols + Lignin MonomersLignin DimersLipids 1AlkylaromaticsN-Compounds 2SterolsAmides 3SuberinFree Fatty Acids 4
Vindum
Shoulderslope0–30 cm3.36.43.25.89.51.64.34.00.21.6
30–60 cmn.d.n.d.n.d.n.d.n.d.n.d.n.d.n.d.n.d.n.d.
Backslope0–30 cm7.112.01.95.113.73.50.65.80.00.4
30–60 cmn.d.n.d.n.d.n.d.n.d.n.d.n.d.n.d.n.d.n.d.
Footslope0–30 cm3.47.23.16.19.91.74.43.80.21.3
30–60 cm2.35.53.66.48.71.26.23.10.32.0
Rostock
Shoulderslope0–30 cm6.011.82.24.412.13.30.35.70.00.4
30–60 cm7.113.12.04.312.94.20.16.30.00.2
Backslope0–30 cm6.112.51.94.312.33.50.36.00.00.4
30–60 cm6.713.21.84.212.63.90.26.20.00.3
Footslope0–30 cm5.510.72.34.311.13.10.75.80.00.7
30–60 cm5.710.62.34.211.23.30.76.00.10.5
Rogalow
Shoulderslope0–30 cm4.07.53.35.310.12.32.84.70.11.4
30–60 cm4.58.13.45.911.12.53.24.70.11.2
Backslope0–30 cm6.310.52.45.111.83.31.45.70.20.6
30–60 cm8.112.72.25.213.74.30.56.40.00.2
Footslope0–30 cm4.57.73.55.410.62.12.64.70.11.3
30–60 cm4.37.63.66.511.42.23.54.30.11.1
Pikareinu
Shoulderslope0–30 cm6.610.31.94.410.83.51.26.40.00.8
30–60 cm6.010.22.14.811.43.40.95.90.00.6
Backslope0–30 cm5.89.92.35.111.63.11.15.60.00.6
30–60 cm9.412.81.74.812.45.10.27.50.00.3
Footslope0–30 cm3.56.63.35.610.12.22.94.40.21.1
30–60 cm3.16.73.45.59.91.92.34.10.21.2
1 lipids: alkanes, alkenes, alkanoic acids, alkyl ester; 2 N-containing compounds: aromatic N-heterocyclic compounds and nitriles; 3 Amides: nonaromatic amides (peptides, amino sugars) and free amino acids; 4 Free fatty acids: n-alkanoic acids from n-C16 to n-C34, n.d.: not determined.
Table 5. Increase or decrease of compound classes (% TII) along the catenae in Vindum, Rostock, Rogalow and Pikareinu between shoulderslope (SS) vs. backslope (BS), backslope (BS) vs. footslope (FS), and shoulderslope (SS) vs. footslope (FS), each at 0–30 cm and 30–60 cm, as well as a comparison of topsoil to subsoil. Significant differences are indicated by * p < 0.05, ** p < 0.01, and *** p < 0.001 (n = 3).
Top: SubVindum Rostock Rogalow Pikareinu
SSBSFSSSBSFSSSBSFSSSBSFS
Carbohydrates--> **< ** < *< ** < *
Phenols + lignin monomers--> **< **< * < *< * < **
Lignin dimers-- > *
Lipids 1--< ** > *< ** < ***
Alkylaromatics--> **< * < **< ** < *< **
N-compounds 2--> ***< *< * < ** < **
Sterols--< ** > *< * > ***> *
Amides 3--> **< ** < **
Suberin--< * > ** > ***
Free fatty acids 4--< **> *** > ** > *> **
Low masses--> * > *< *> * < **
0–30 cmVindum Rostock Rogalow Pikareinu
SS vs. BSBS vs. FSSS vs. FSSS vs. BSBS vs. FSSS vs. FSSS vs. BSBS vs. FSSS vs. FSSS vs. BSBS vs. FSSS vs. FS
Carbohydrates< *> * > *> **< **> ** > ***> **
Phenols + lignin monomers< ***> ***< * > *> **< *> ** > ***> **
Lignin dimers> ***< ** > *< ** > **< ** < **< ***
Lipids 1 > *< ** < * < **
Alkylaromatics< *> *< * > ***> **< * < *> ***> *
N-compounds 2 > * < **> ** > **> ***
Sterols> ***< *** < **< **> **< ** < **< ***
Amides 3< *> * < *> * > **> **
Suberin> **< ** < * > **> ***
Free fatty acids 4> *< *** < **< ***> **< * > **> **
30–60 cmVindum Rostock Rogalow Pikareinu
SS vs. BSBS vs. FSSS vs. FSSS vs. BSBS vs. FSSS vs. FSSS vs. BSBS vs. FSSS vs. FSSS vs. BSBS vs. FSSS vs. FS
Carbohydrates--- > *> *< ***> *** < *> **> **
Phenols + lignin monomers--- > *> *< ***> *** < **> ***> **
Lignin dimers--- < * > **< ** < ***< **
Lipids 1--- > **< **< * < *< *
Alkylaromatics--- > *> *< ***> *** < **> ***> **
N-compounds 2--- > *> *< ***> *** < **> ***> **
Sterols---< * > ***< ***< *> **< ***< ***
Amides 3--- < **> *** < **> ***> ***
Suberin--- > **< * < *< *
Free fatty acids 4---< *< **< ***> **< *** > *< **< **
1 lipids: alkanes, alkenes, alkanoic acids, alkyl ester; 2 N-containing compounds: aromatic N-heterocyclic compounds and nitriles; 3 amides: nonaromatic amides (peptides, amino sugars) and free amino acids; 4 free fatty acids: n-alkanoic acids from n-C16 to n-C34.
Table 6. Increase or decrease of the thermostability of soil samples and their compound classes along catenae in Vindum, Rostock, Rogalow and Pikareinu between shoulderslope (SS) vs. backslope (BS), backslope (BS) vs. footslope (FS), and shoulderslope (SS) vs. footslope (FS), each at 0–30 cm and at 30–60 cm, as well as a comparison of topsoil to subsoil. Significant differences are indicated by * p < 0.05, ** p < 0.01, and *** p < 0.001 (n = 3).
Top: SubVindum Rostock Rogalow Pikareinu
SSBSFSSSBSFSSSBSFSSSBSFS
TII--
Carbohydrates-- < *
Phenols + lignin monomers-- < * < *< * < *
Lignin dimers-- < * < **< * < **
Lipids 1-- < *< *< *< *< * < *
Alkylaromatics-- < *< *
N-compounds 2--
Sterols-- > * > **
Amides 3-- < * < *
Suberin--
Free fatty acids 4--> *< * < * < *
0–30 cmVindum Rostock Rogalow Pikareinu
SS vs. BSBS vs. FSSS vs. FSSS vs. BSBS vs. FSSS vs. FSSS vs. BSBS vs. FSSS vs. FSSS vs. BSBS vs. FSSS vs. FS
TII > *> ** < **> *> **
Carbohydrates > ** < * < **
Phenols + lignin monomers< *> ** > *> **> ** > *< * < **< **
Lignin dimers > *> ** < * < **< **
Lipids 1< **> ** > **> **< * < ** < *
Alkylaromatics > *** < * < **< **
N-compounds 2 > * > *
Sterols
Amides 3 > * > ** < **< *< ***
Suberin < ** < *< *
Free fatty acids 4< **> * > **
30–60 cmVindum Rostock Rogalow Pikareinu
SS vs. BSBS vs. FSSS vs. FSSS vs. BSBS vs. FSSS vs. FSSS vs. BSBS vs. FSSS vs. FSSS vs. BSBS vs. FSSS vs. FS
TII---
Carbohydrates--- > *> **
Phenols + lignin monomers---> * > *
Lignin dimers---> * > * < *< *> *
Lipids 1--- > *< **> *** < *> **
Alkylaromatics--- > *
N-compounds 2--- > *
Sterols---> *
Amides 3--- < *
Suberin---
Free fatty acids 4---> *> *> **< ***> ***< *< *> **> *
1 lipids: alkanes, alkenes, alkanoic acids, alkyl ester; 2 N-containing compounds: aromatic N-heterocyclic compounds and nitriles; 3 amides: nonaromatic amides (peptides, amino sugars) and free amino acids; 4 free fatty acids: n-alkanoic acids from n-C16 to n-C34.

