Article

Comparison of Soil–Water Characteristic Curves in One-Dimensional and Isotropic Stress Conditions

by
Paul Habasimbi
* and
Tomoyoshi Nishimura
Department of Civil Engineering, Ashikaga University, Omae Ashikaga Tochigi 326-8558, Japan
*
Author to whom correspondence should be addressed.
Soil Syst. 2018, 2(3), 43; https://doi.org/10.3390/soilsystems2030043
Submission received: 11 May 2018 / Revised: 21 July 2018 / Accepted: 25 July 2018 / Published: 26 July 2018

Abstract

:
Understanding unsaturated soil behavior is key to the design of foundations and embankment structures. Geotechnical engineers have applied net normal stress and matric suction to these engineering problems. Water retention activity in soils is used to predict seepage problems and stability of slope failures. Soil–Water Characteristic Curve (SWCC) tests contribute largely to matric suction interpretation. Determination of SWCCs in the laboratory is usually done using a pressure plate apparatus where vertical or confining stress cannot be applied. Mathematical models of SWCC though commonly accepted in geotechnical engineering practices, do not take into consideration stress conditions such as the difference between a one-dimensional condition and isotropic confining conditions. This study conducted SWCC tests of a silt soil under one-dimensional and isotropic confining stress conditions and focused on the differences between these types of SWCC data sets. Vertical and isotropic confining stresses ranging from 100 to 600 kPa were applied under both stress conditions. SWCCs appears to be affected by the influence of different stress conditions. Lateral pressure and confinement on an isotropic compression condition caused the soil specimen to become dense in void structure and consequently, soil moisture flow movement decreased. This probably induced high retention activities in the silt soil specimen. The study further suggests that the current SWCC models require further development to take into consideration the effect of different stress conditions.

1. Introduction

Soils that exist above the water table are normally in unsaturated conditions. The mechanical behaviors of these soils have a greater influence on the stability of geotechnical structures such as foundations, road pavements, dams or even nuclear waste disposal sites. Geotechnical engineers have applied two stress state variables (i.e., net normal stress and matric suction) to the above-mentioned engineering problems [1]. One of the key features in unsaturated soil mechanics is water retention activity in soils which is used to predict the stability or seepage problems in the ground. The Soil–water Characteristic Curve (SWCC), which represents a soil’s ability to store and release water as it is subjected to various soil suctions, is defined as the relationship between the suction and the degree of saturation or gravimetric water content for unsaturated soils. It reflects the behavior of unsaturated soils with regard to its hydraulic conductivity, shear strength, and volume change behavior [2]. Therefore, accurate determination of SWCCs under stress conditions similar to those in the field is key for interpretation of the mechanical behavior of unsaturated soils. Many researchers have investigated factors affecting SWCCs including stress; however, the influence of stress conditions such as the difference between one-dimensional condition and isotropic confining stress conditions have not received great attention [3,4]. This paper seeks to address the limited number of experimental data on the differences in these types of SWCCs. The study compares SWCCs obtained through experimental testing performed on a silty soil under one-dimensional and isotropic confining stress conditions for both drying and wetting directions. The SWCCs were measured under vertical and confining stresses ranging from 100 to 600 kPa allowing assessment of the differences in these types of SWCCs. In order to approach the target of this research, three testing methods were utilized. The microporous membrane [5] with an air entry value of 250 kPa was used for controlling relatively low matric suction (i.e., less than 20 kPa) which is one of the latest testing methods in SWCC tests. The membrane technology has the advantage of improving the time required in order to reach matric suction equalization in SWCC tests. The pressure plate technique with a 500 kPa high air entry ceramic disc was used to control matric suctions between 20 and 500 kPa. For control of matric suctions beyond 500 kPa, the vapour equilibrium technique was employed.
To improve on the understanding of hydro-mechanical behavior of unsaturated soils, it is vital to investigate stress effects on soil–water characteristic curves [6]. It is also understandable that stress effects have not been taken into account and have rarely been studied. Recent work by Vanapalli et al. [7] has found that the stress history and soil fabric have significant influence on the measured SWCCs of a compacted till. The SWCCs were determined on over-consolidated soil specimens under zero net normal stress, simulating the effects of over-consolidation. More recently, the effects of one-dimensional (1D) stresses on SWCCs were investigated and found to have a significant influence on the SWCCs of a sandy silt/clay and hence on transient seepage and slope stability [8]. Moreover, determination of soil-water characteristic curve tests using traditional instruments cannot apply stress and hence some researchers are now developing suction controlled triaxial apparatus, by which soil-water characteristic curve tests are performed under different stress states [9]. For instance, Tavakoli et al. [10] designed an experimental program to investigate the effect of confining stress on the air entry and air expulsion values of the drying and wetting portions of the SWCC. For this purpose, a novel miniature pressure plate apparatus was designed to determine the soil–water retention curves (SWRCs) under different net stresses. Seboong et al. [11] also examined the effect of confining stress on the SWRC using a silty sand. A soil normally experiences some kind of stress due to its depositional history in the field. A number of researches have also revealed that the stress state of a soil has some influence on the SWCC [12]. The stress state has a remarkable influence on the compressibility of soils. Consideration of this decrease on the compressibility to evaluate the settlement of soils is very essential. Therefore, the difference of the stress condition applied has a significant influence on the soil deformation, and the related water retention activity in engineering practice.

2. Experimental Study

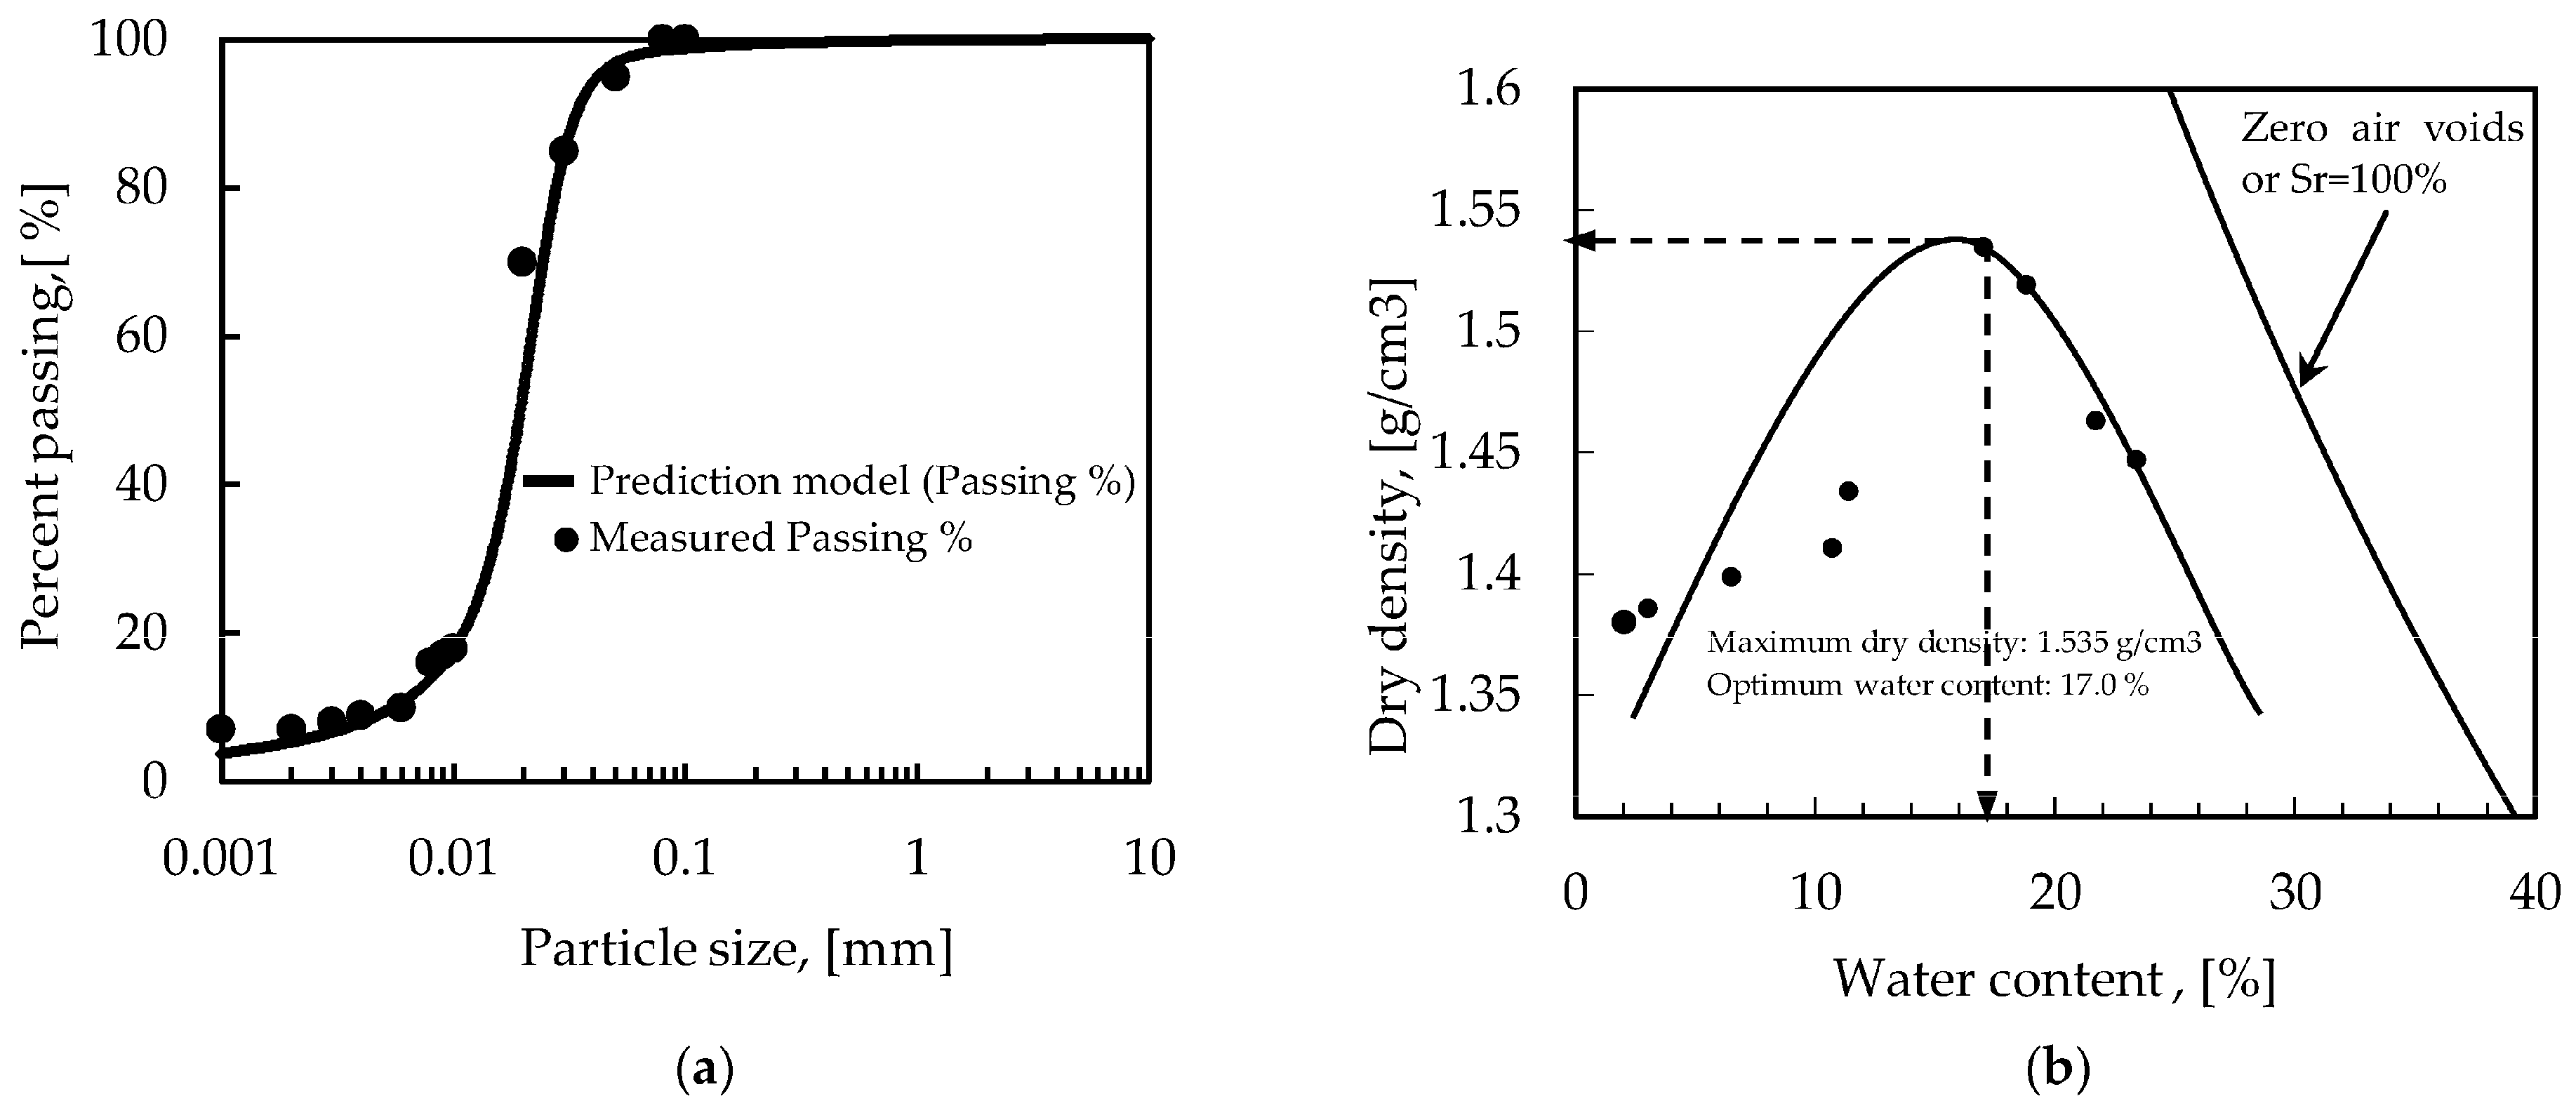
2.1. Soil Material and Specimens
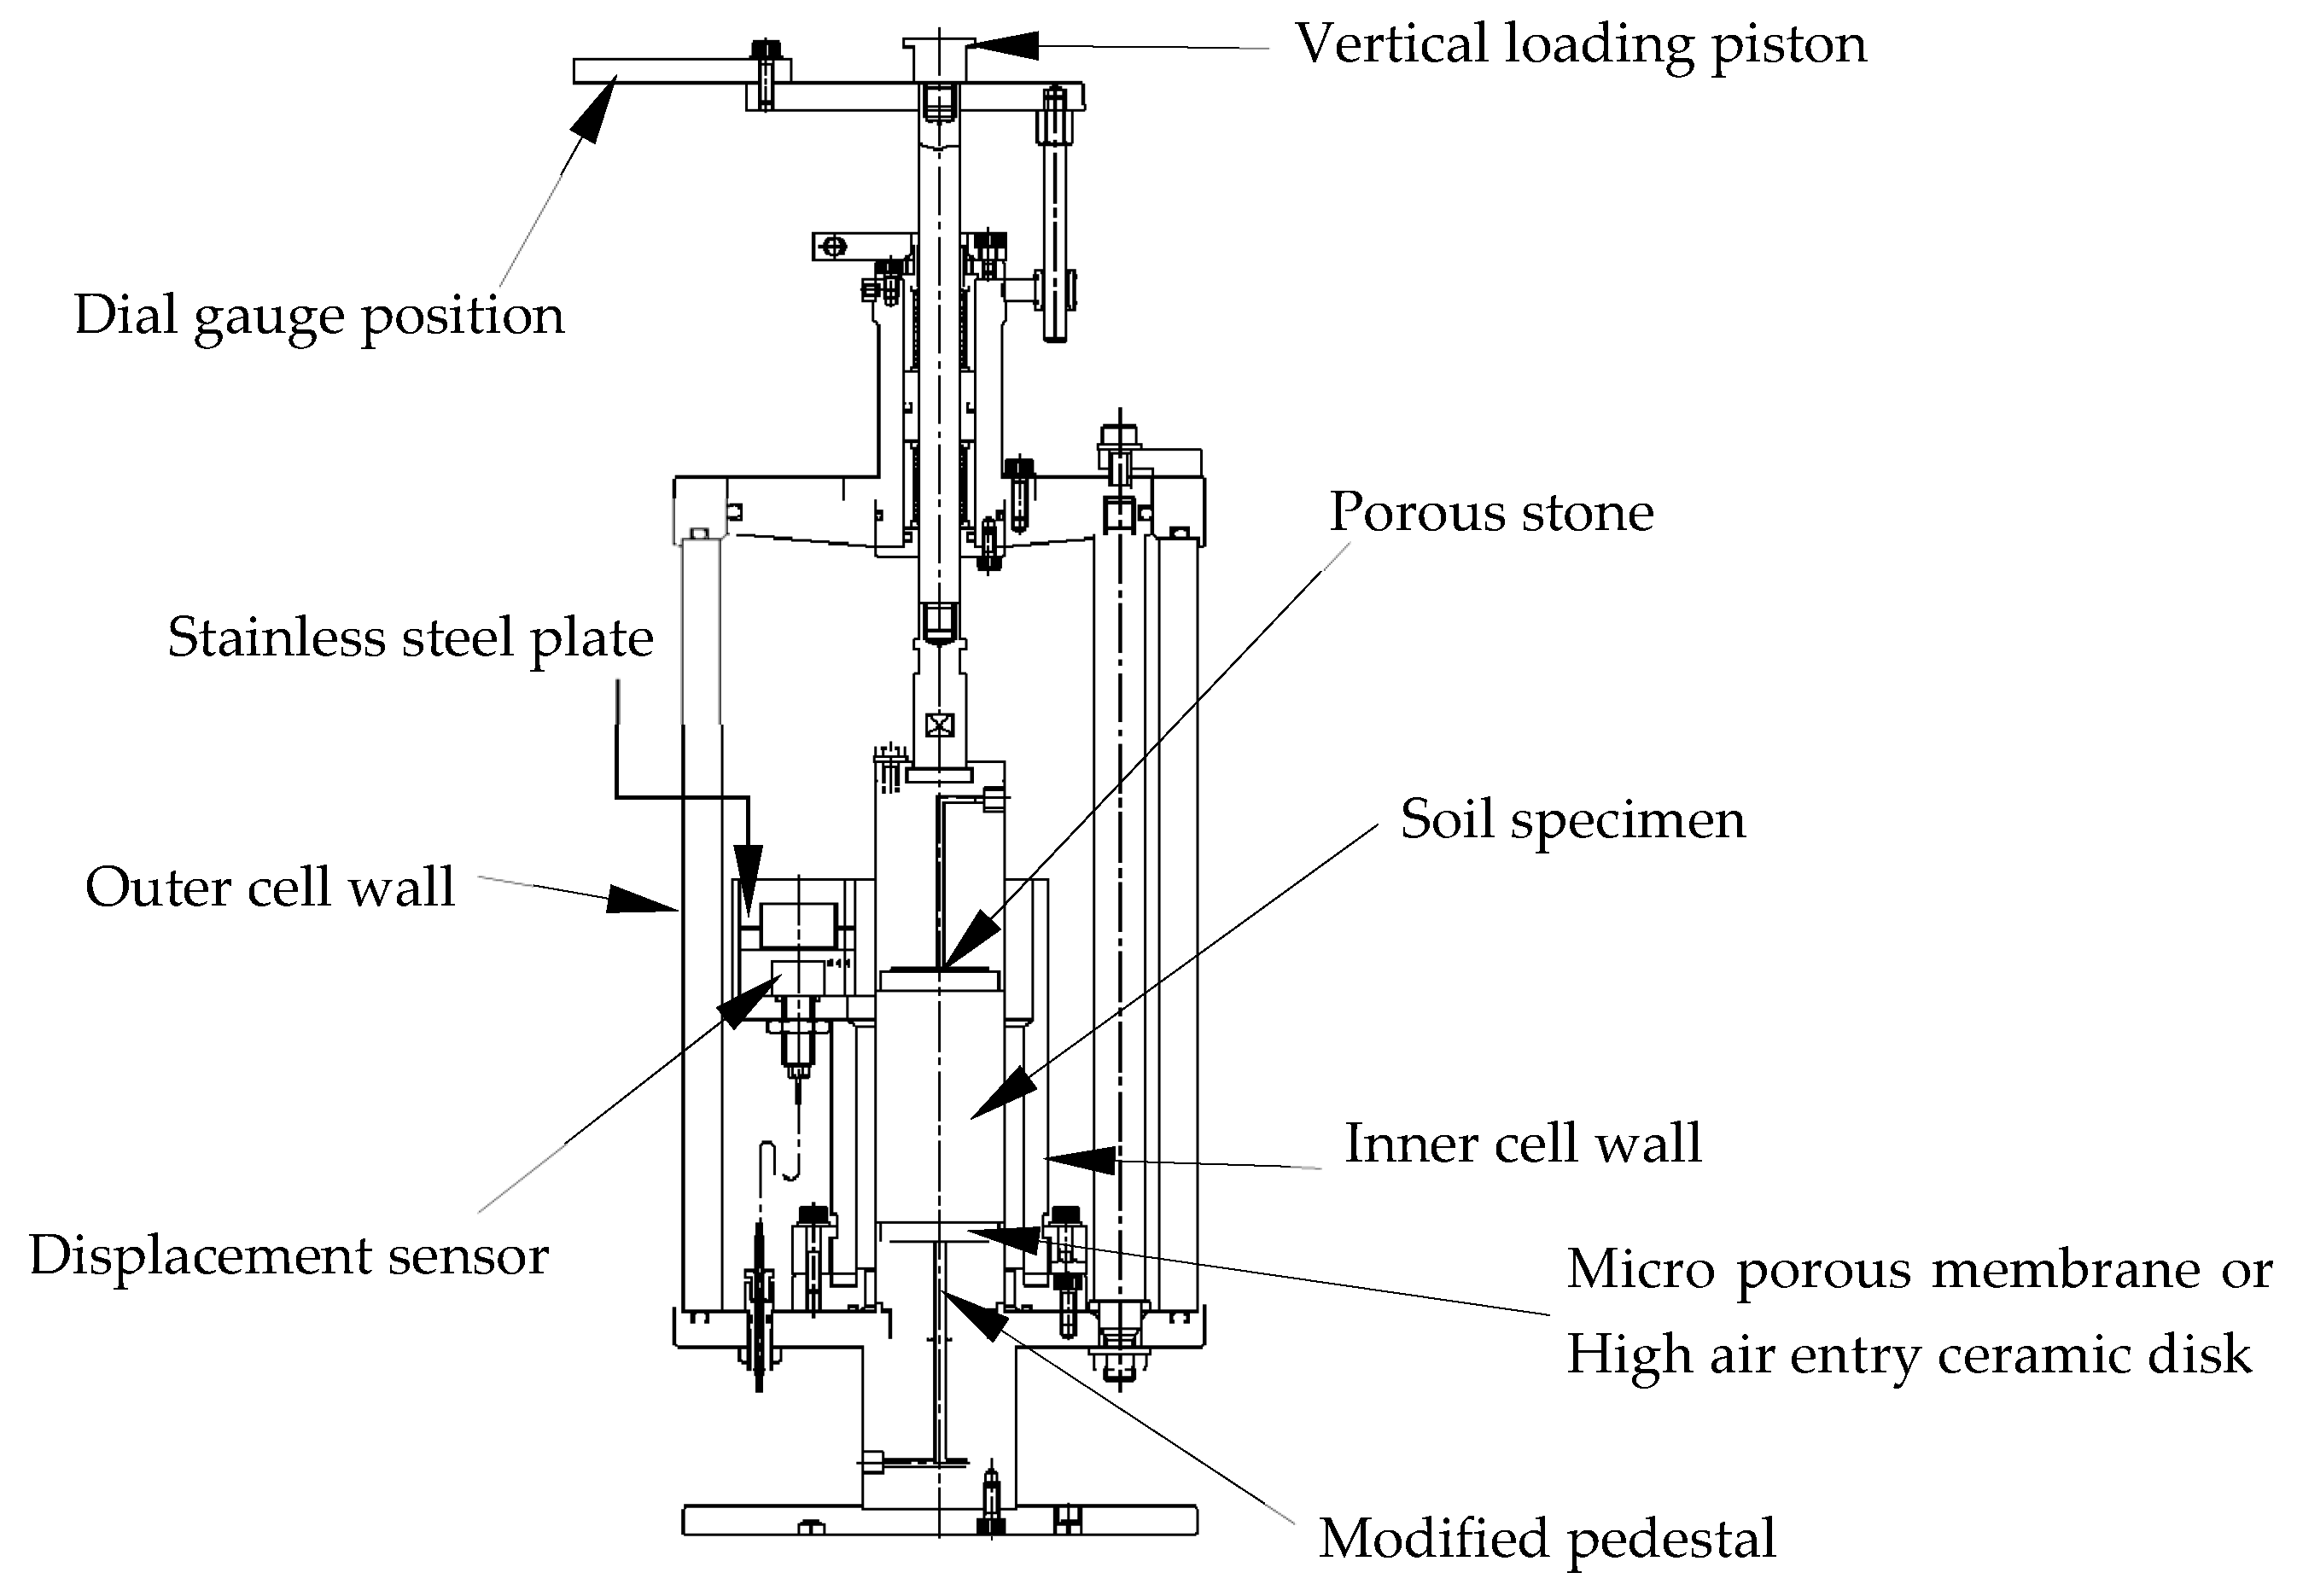
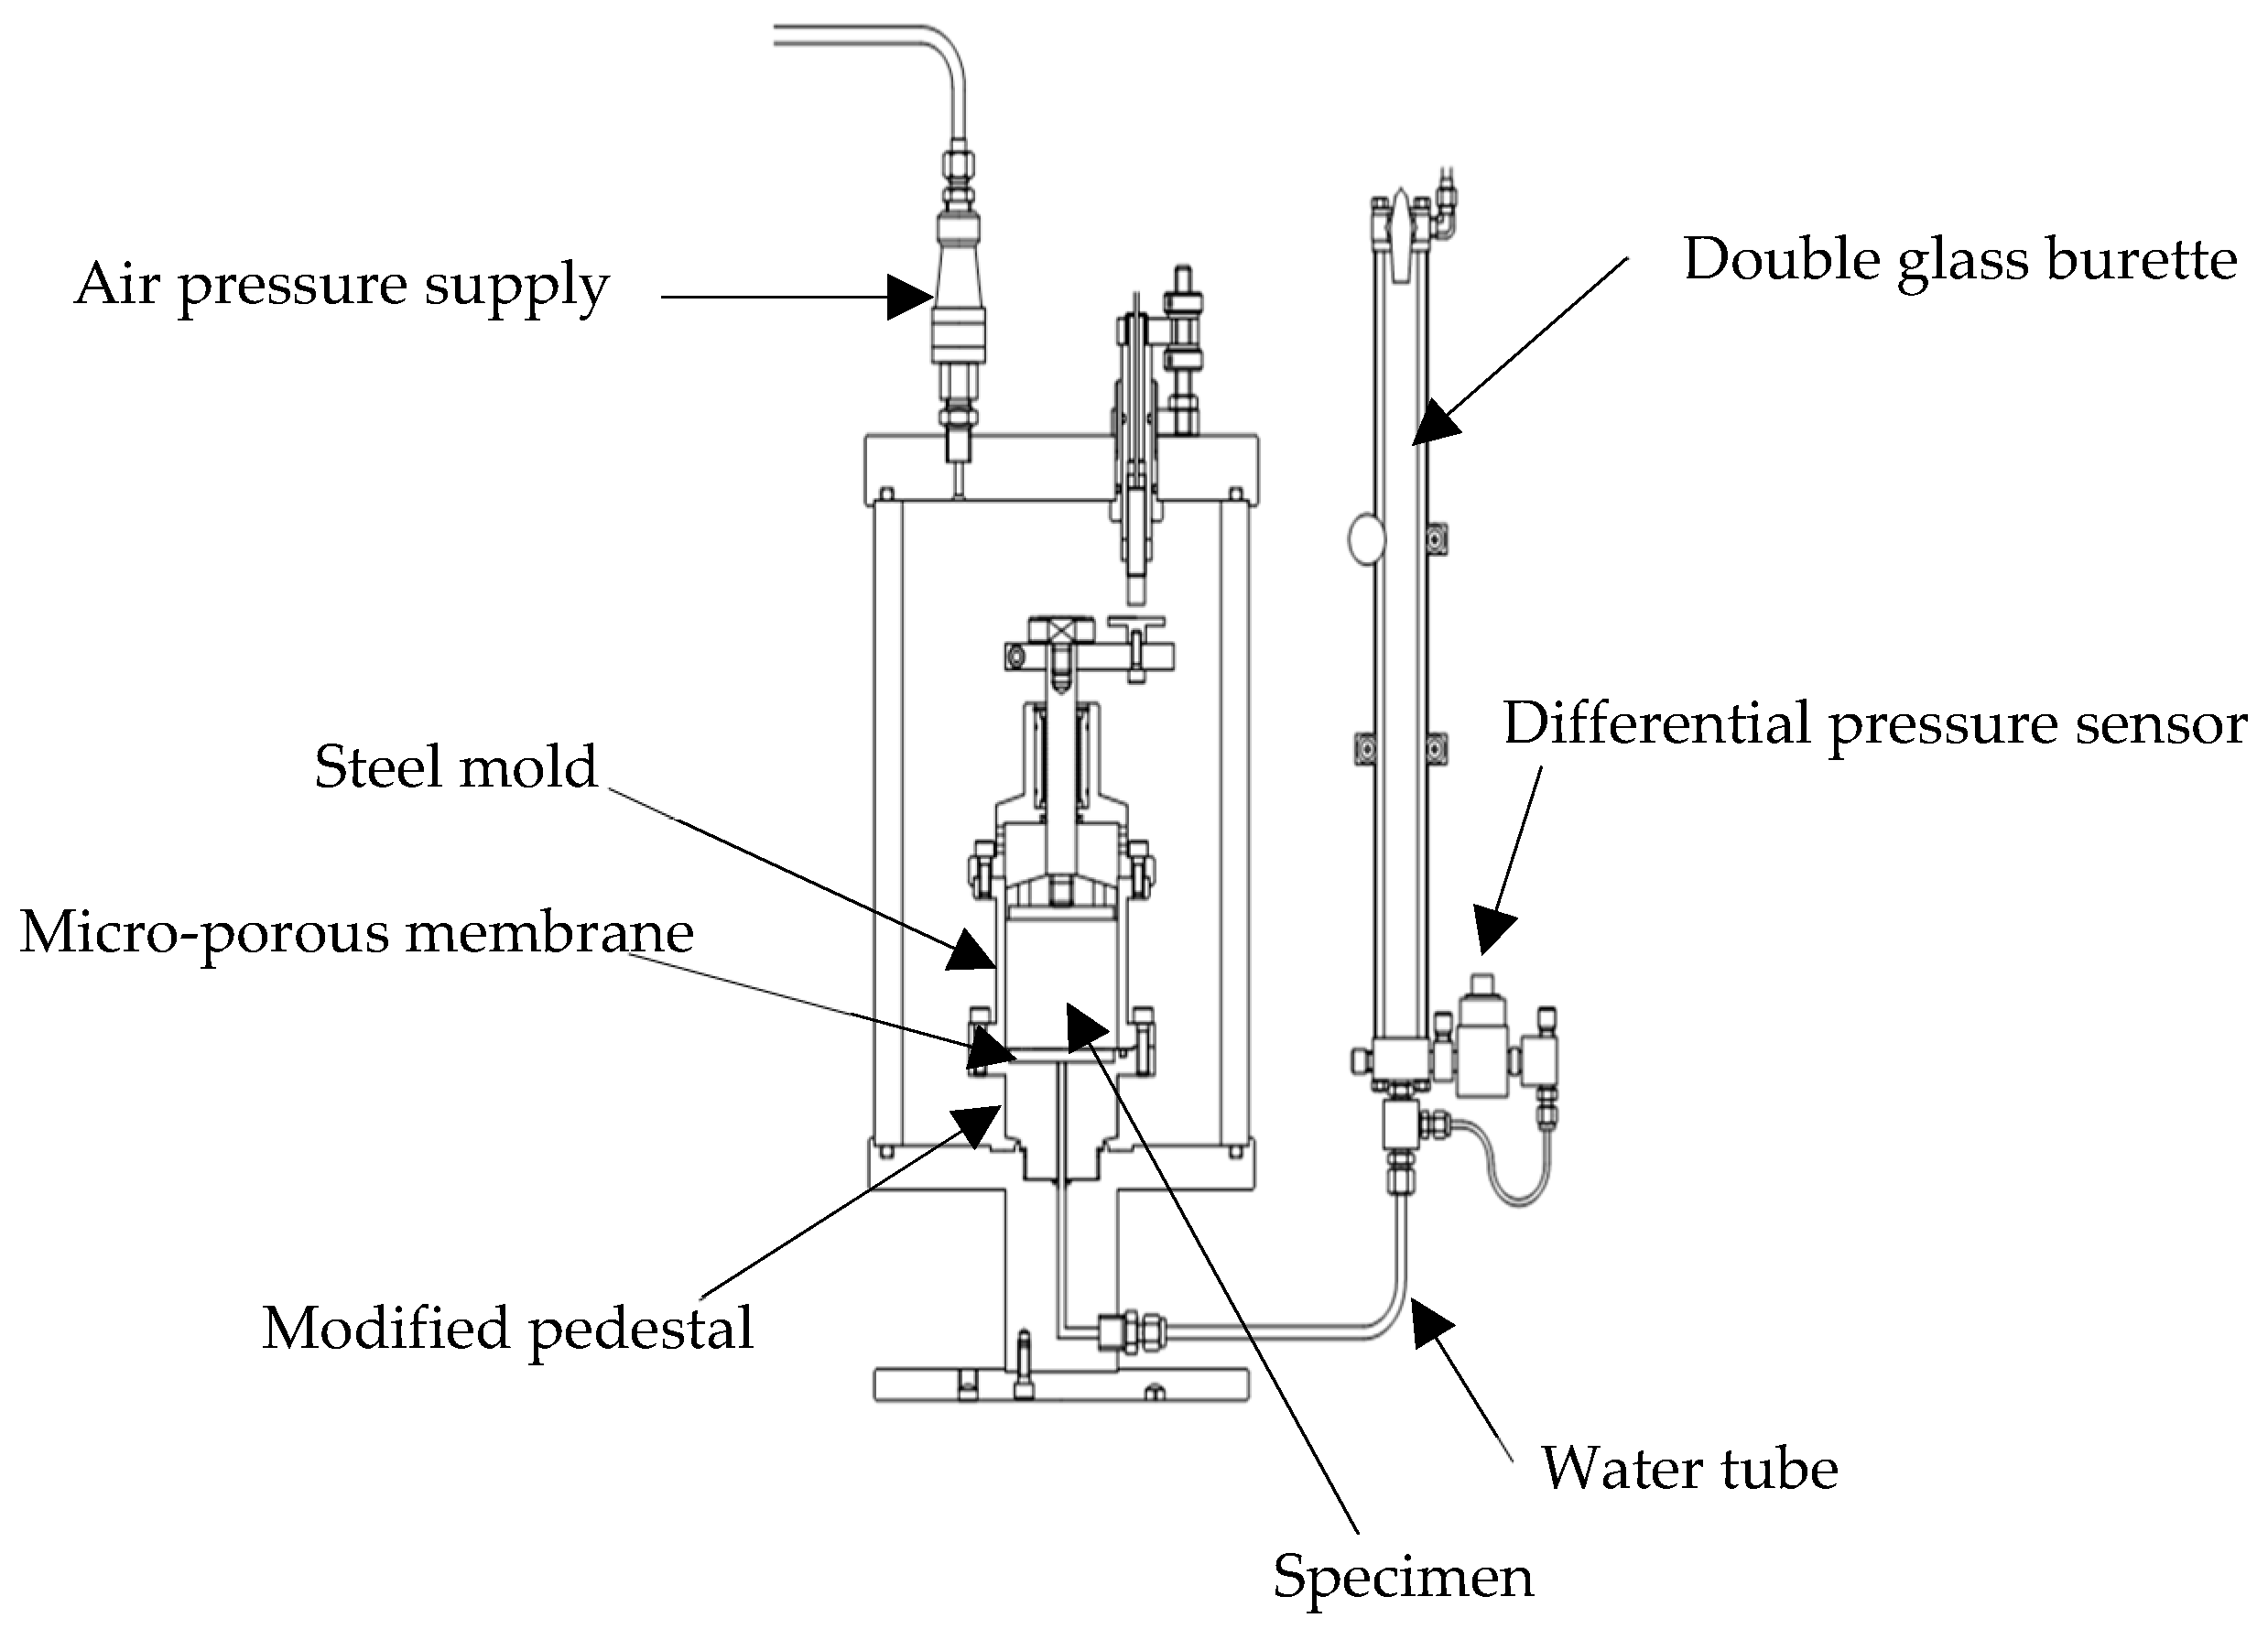
The soil material used in this testing is a silt soil known as DL-clay in Japan with a relatively uniform grain size distribution as shown in Figure 1a. The soil material was chosen because it has low degree of saturation and is non-plastic. DL-clay had a fine content of 99.0% (particles smaller than 0.075 mm in diameter) by dry weight. Some of its properties such as soil particle density, void ratio and mean grain diameter of silt (D50) are given in Table 1. The material behaves poorly under standard compaction methods and hence compacted specimens were prepared using a compaction steel mould intended specially for static compaction. The results of the standard proctor compaction test indicated a maximum dry density of 1.535 g/cm3 at an optimum water content of 17%. Figure 1b, shows the relationship between water content and dry density as compaction curve of the soil.
Soil specimens with different dimensions were prepared for SWCC tests. For one-dimensional condition, a diameter of 60 mm and height of 65 mm specimen was prepared. Furthermore, a diameter of 50 mm and height of 100 mm was prepared for the isotropic condition testing. Two additional specimens of diameter 6 cm and height 2 cm were also prepared and placed in the glass desiccator for SWCC test using the Vapour Pressure Technique (VPT).

2.2. Apparatus

In this study, new SWCC apparatus as shown in Figure 2 and Figure 3 were utilized to conduct SWCC test in one-dimensional and isotropic stress conditions respectively. For one-dimensional condition testing, a modified steel mould was placed in the triaxial cell. The apparatus consisted mainly of a pedestal, a steel mould, a triaxial chamber, and a double glass burette which was connected to a differential pressure transducer. The dimensions of the steel mould had an inside diameter of 60 mm and a height of 65 mm. The modified triaxial apparatus was used to perform SWCC tests using the micro porous membrane and pressure plate techniques. The apparatus had an inner and outer cell. A gap sensor installed into the inner cell was used to measure the volume change of the soil specimen. The gap sensor essentially measures voltage changes which can also be converted to volume changes of the specimen. The pedestal attached to the triaxial base plate had a porous stone and an O-ring on the upper surface that was fastened to the base of the triaxial apparatus.
In both test setups, the modified triaxial apparatus used had the supply systems for cell pressure, pore-water pressure and pore-air pressure regulated separately. Soil–water was allowed to flow into the glass burettes by means of a water compartment connected to the porous stone. To measure SWCCs beyond the air entry value of the microporous membrane, a pressure plate apparatus installed with a ceramic disk was used. The pedestal was installed with a high air entry ceramic disk in place of the microporous membrane. The size of the ceramic disk had a thickness of 7 mm, a pore size of 0.5 μm and an air entry value of 500 kPa.
To obtain the suction versus water content relationship beyond 500 kPa (i.e., 500–296,000 kPa), the vapour equilibrium or relative humidity technique was used which essentially uses the vacuum glass desiccator apparatus. This apparatus was used for equilibrating silt specimens in a constant relative humidity environment above a controlled salt solution. In this test setup, seven different salt solutions were utilized to conduct SWCC tests of the silt soil specimens.

3. Test Methodology

The testing methods adopted in this study involved establishing SWCC in both low and high matric suction ranges. Essentially 14 No. SWCC tests were conducted using the micro porous membrane technique with application of stress ranging from 25 to 600 kPa under one-dimensional and isotropic compression conditions. Another SWCC test in isotropic compression conditions at a confining stress of 300 kPa was conducted using a 5 bar ceramic disc. The range of matric suction applied was from 20 to 500 kPa. Two specimens of diameter 6 cm and height 2 cm were further placed in the glass desiccator for SWCC test using the vapour pressure technique. In this test, seven different saturated chemical solutions were used to control relative humidity and eventually for the determination of total suctions. The mass, height and diameter of the specimens were measured every three weeks with the assumption that equilibrium of the specimens was achieved with respect to suction values. The test procedures and suction ranges adopted in the present study are summarized in Table 2 below and detailed explanation of the test procedures adopted are outlined in Section 3.1, Section 3.2 and Section 3.3.

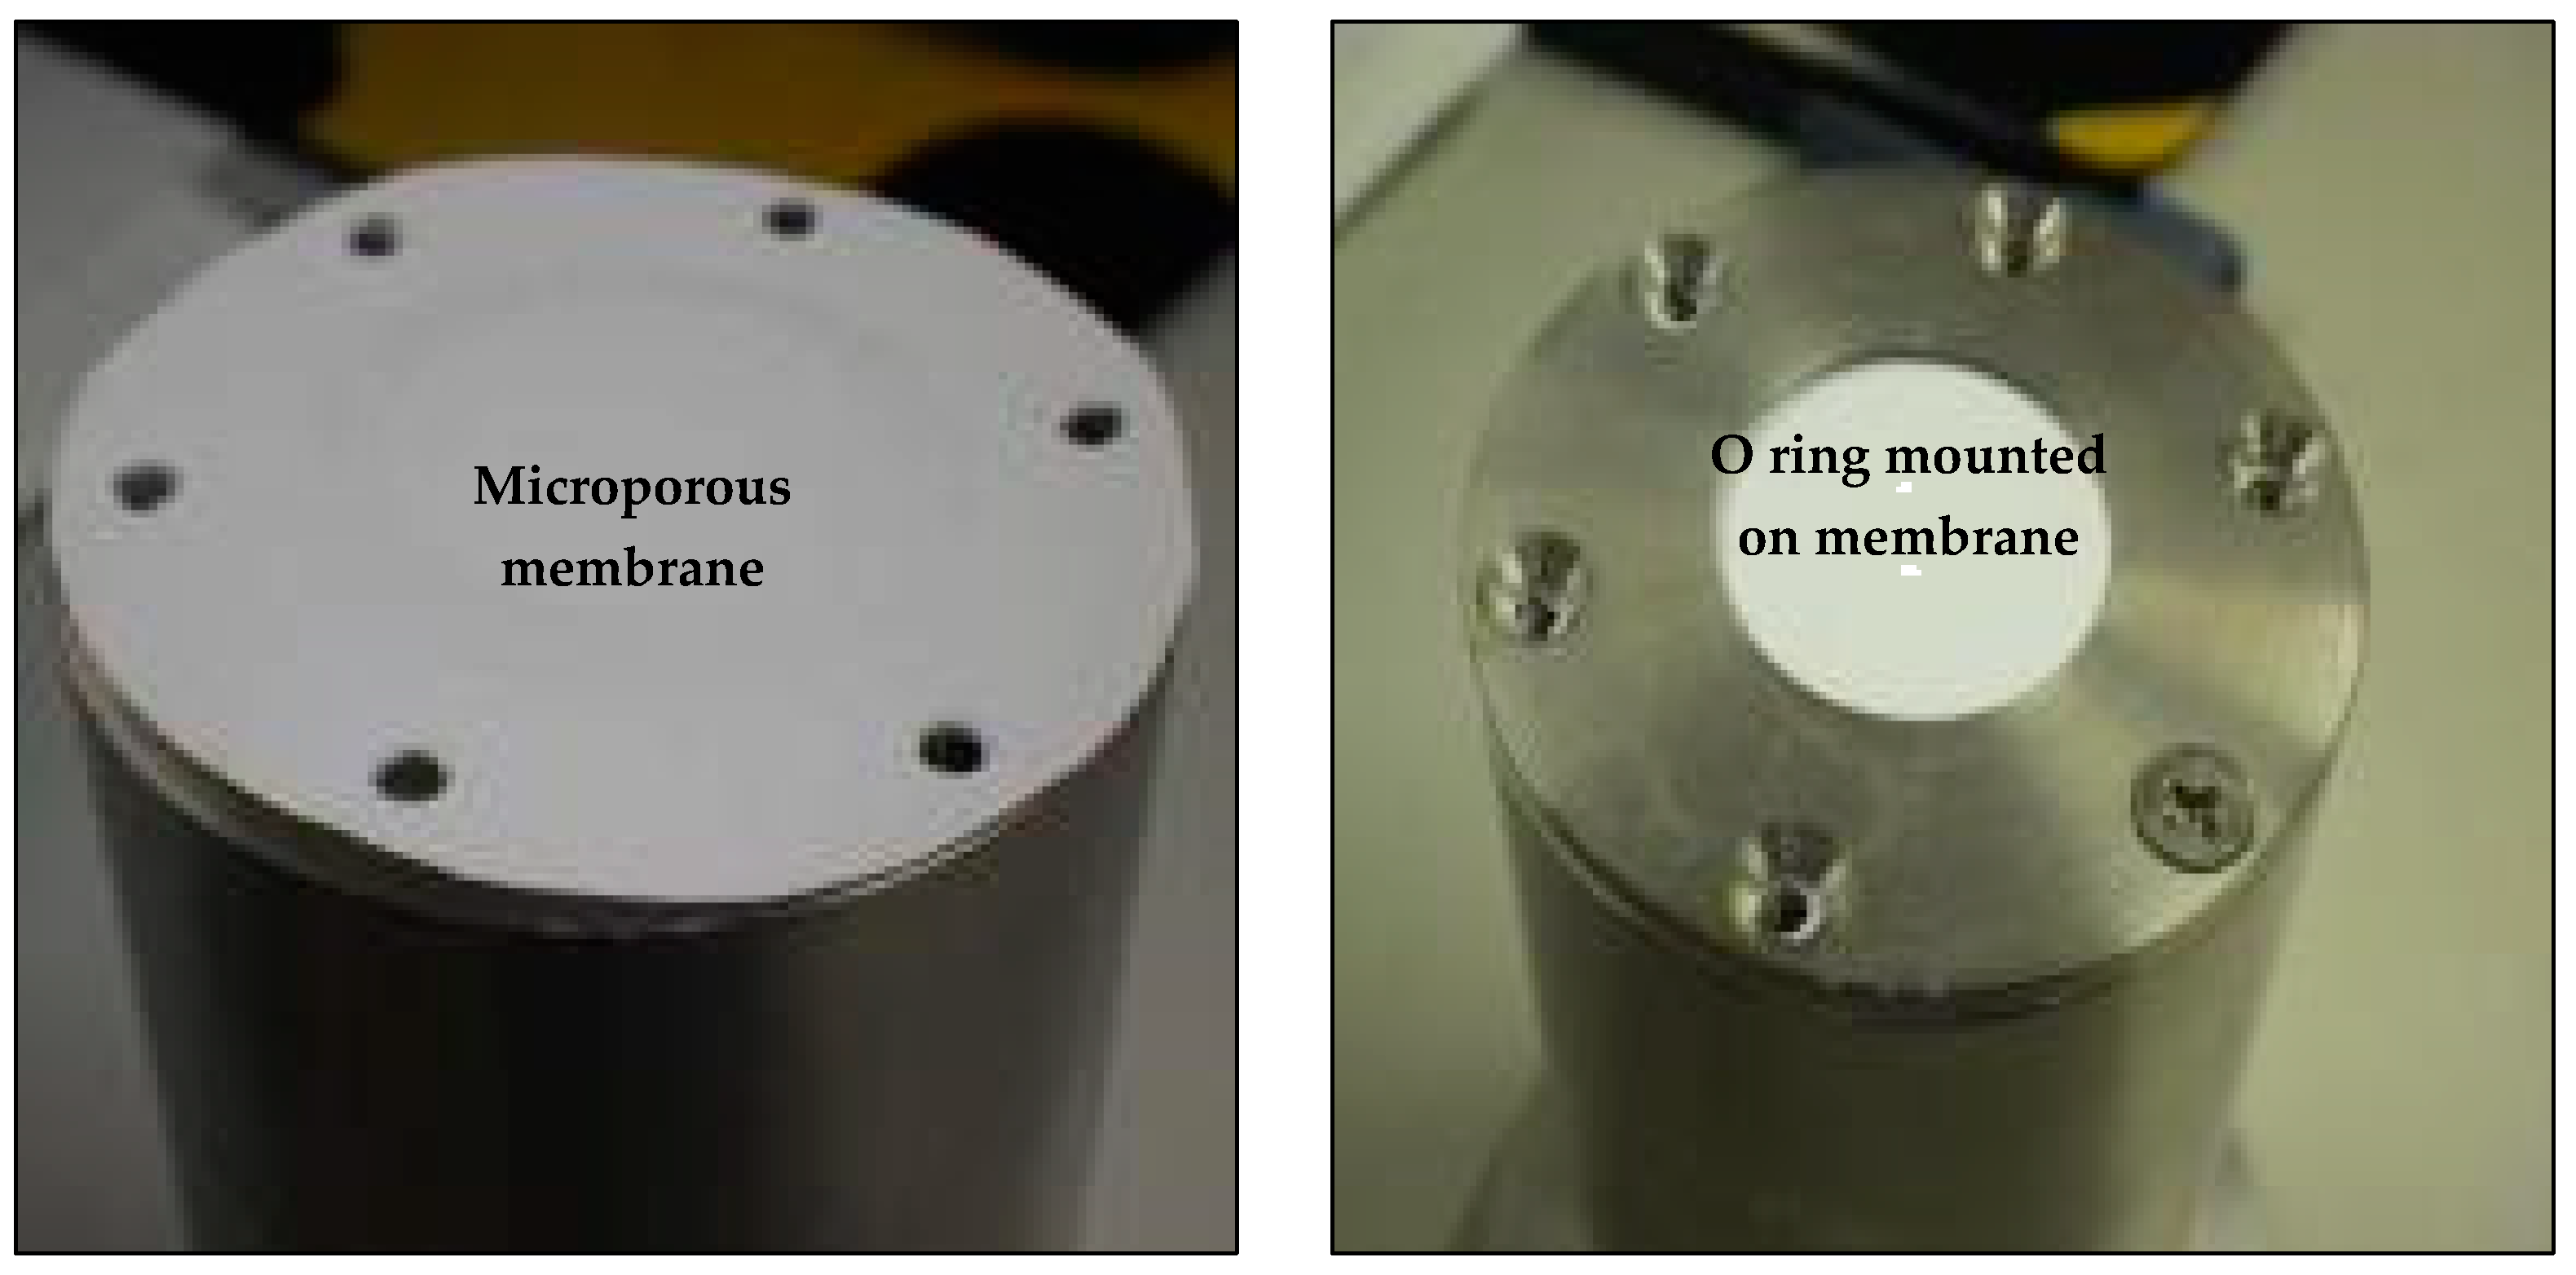
3.1. Microporous Membrane Filter Technique

In geotechnical engineering practice, high air entry ceramic disks have been used for the control of matric suction and measurement of the soil-water characteristic curve [13]. However, high air entry ceramic disks consume too much time for equilibrium conditions to be established across the disk. Nishimura et al. 2012, introduced the micro porous membrane filter technique for the measurement of soil-water characteristic curves. The membrane filter (Figure 4) is a thin and microporous filter paper made from a hydrophilic acrylic copolymer. The membrane works on the same principle as the ceramic disk except that the amount of time required for establishing suction equilibrium is considerably reduced. The membrane controls matric suction up to 25 kPa and its AEVs (i.e., air-entry values) ranges from 40 to 250 kPa. Several studies have revealed that the equilibrium time required for the SWCC measurements using the microporous membrane is much shorter. Thus far, the membrane technique has been introduced to the simple shear and triaxial apparatuses for monotonic or cyclic loading tests [14,15,16].
To obtain the SWCC in the low matric suction range in the present study, the microporous membrane technique was utilized. The pedestal of the modified SWCC apparatus was mounted with a Supor 450 saturated microporous membrane with an air entry value of 250 kPa. For every SWCC conducted, a fresh Supor 450 saturated microporous membrane was utilized. Table 3 shows details of the Supor 450 saturated microporous membrane used for testing in this study. The testing program essentially allowed performing the test under a maximum matric suction of 20 kPa using the axis translation technique. An initial vertical and confining stress of 100 kPa was applied to the soil specimens under both stress conditions. As already stated in the apparatus description section, cell pressure, pore-air and pore-water pressures were regulated separately. The stress state applied to the soil specimen was maintained throughout each test duration while establishing the desired matric suctions. Prior to commencement of the SWCC test, the soil specimens were first saturated through seepage from the bottom and this essentially released the initial matric suction of the specimens to zero. Drying and wetting paths of SWCC were established by progressively increasing and decreasing matric suction. Essentially air pressure in the chamber was regulated in order to establish the desired matric suctions. Thus, to obtain the drying path of the SWCC, matric suctions were progressively increased from zero to 20 kPa. Subsequently, the wetting process was performed by following the path of decreasing matric suction until the final applied matric suction was around zero. During the testing process, soil–water moved in response to the externally applied suction and this accumulated in the double burette with elapsed time. The registered changes in the voltage on the differential pressure transducer of the modified triaxial apparatus were eventually translated into changes in the amount of water in the soil specimen. When the wetting process of the SWCC test was completed, the water content of the soil specimen was measured by oven-drying. This water content together with soil specimen changes in the amount of water recorded by the differential pressure transducer were used to back-calculate the water content corresponding to each applied suction value during drying and wetting process of the SWCC test. This procedure was repeated for the remaining soil specimens to obtain the SWCC in both drying and wetting conditions until the target of the research was realized.

3.2. Pressure Plate Technique

To measure the SWCC using the pressure plate technique, a 5-bar high air entry (HAE) ceramic disc was utilized. The steps adopted to establish SWCCs using the membrane technique in Section 3.1 were also utilized to conduct the SWCC test using the pressure plate technique except that the high air entry ceramic disk was installed onto the pedestal in place of the microporous membrane. Before application of suction, seepage to the bottom of the soil specimen was applied using a conventional porous stone until the specimen was assumed to reach apparent saturation condition (i.e., a degree of saturation less than 100%). Seepage was applied in order to delete the initial suction in the specimen. Immediately the specimen was assumed to reach apparent saturation, a ceramic disk with air entry value of 500 kPa was installed. The soil sample was sandwiched between the ceramic disk and porous stone. A confining stress of 300 kPa was applied before the start of SWCC test. Matric suction ranging from 20 to 500 kPa was then progressively increased during the drying process. After the application of the maximum matric suction, the wetting process was performed following the path of decreasing matric suction. The amount of water that drained from the soil specimen and the total volume change of the specimen during drying and wetting were recorded using a computer connected to the testing apparatus. Equalisation of matric suction was assumed to be complete when there was negligible water from either into or out of the soil specimen. The adsorption of water allowed the measurement of the wetting SWCC.

3.3. Vapour Pressure Technique

The Vapour Pressure Technique (VPT) which is used for controlling total suction was adopted to measure the SWCC in the high suction range (2.8–296 MPa). The control of humidity by achieving vapour pressure equilibrium has been employed in geotechnical research by many researchers [17,18,19,20]. The technique uses chemical solutions, such as saturated salt solutions, to generate constant total suction conditions in a closed space such as a sealed container. In this approach, the soil specimen is placed in a glass desiccator where an aqueous solution results in a controlled vapour pressure generated by the salt solution. The soil specimen therefore undergoes water exchange with the vapour until the suction in the specimen is in equilibrium with the partial vapour pressure.
In this test setup, two soil specimens were compacted in a steel mould to a specified height and diameter. The specimens prepared in both dry and wet conditions were then suspended above a specific salt solution inside a totally closed glass desiccator. Seven different saturated chemical solutions (i.e., K2SO4, KNO3, NH4H2PO4, NaCl, Mg(NO3)2·6H2O, MgCl2·6H2O, Licl) recommended by JGS0151-2000: Japanese test standard of Japanese Geotechnical Society) were prepared to control relative humidity (VPT) and eventually for the determination of total suctions. Table 4 provides details of the above salt solutions adopted in the study and their corresponding suction values. The mass, height and diameter of the specimens were measured every three weeks with the assumption that equilibrium of the specimens was achieved with respect to suction values. For the wetting process, specimens were first stored in the chamber with the lowest relative humidity (RH) salt solution (i.e., Lithium Chloride with RH 11% which corresponds to a suction value of 296 MPa). After equilibrium of the specimens were achieved (i.e., after 3 weeks), salt solutions were progressively changed until the wetting process was complete. After testing for both dry and wet process was complete, soil specimens were taken out of the glass desiccator and oven-dried in order to determine the water content at equilibrium condition. Essentially, when the testing process was complete, parameters such as the water content, void ratio and degree of saturation of the soil specimens at equilibrium conditions were calculated to determine their relations with respect to suction of the soil specimens.

4. Results and Discussion

From the experimental data, relationships among suction, water content, degree of saturation and void ratio were obtained to describe the soil–water characteristic curves under one-dimensional and isotropic stress conditions. The following sections provides an analysis of the SWCCs with different stress conditions.

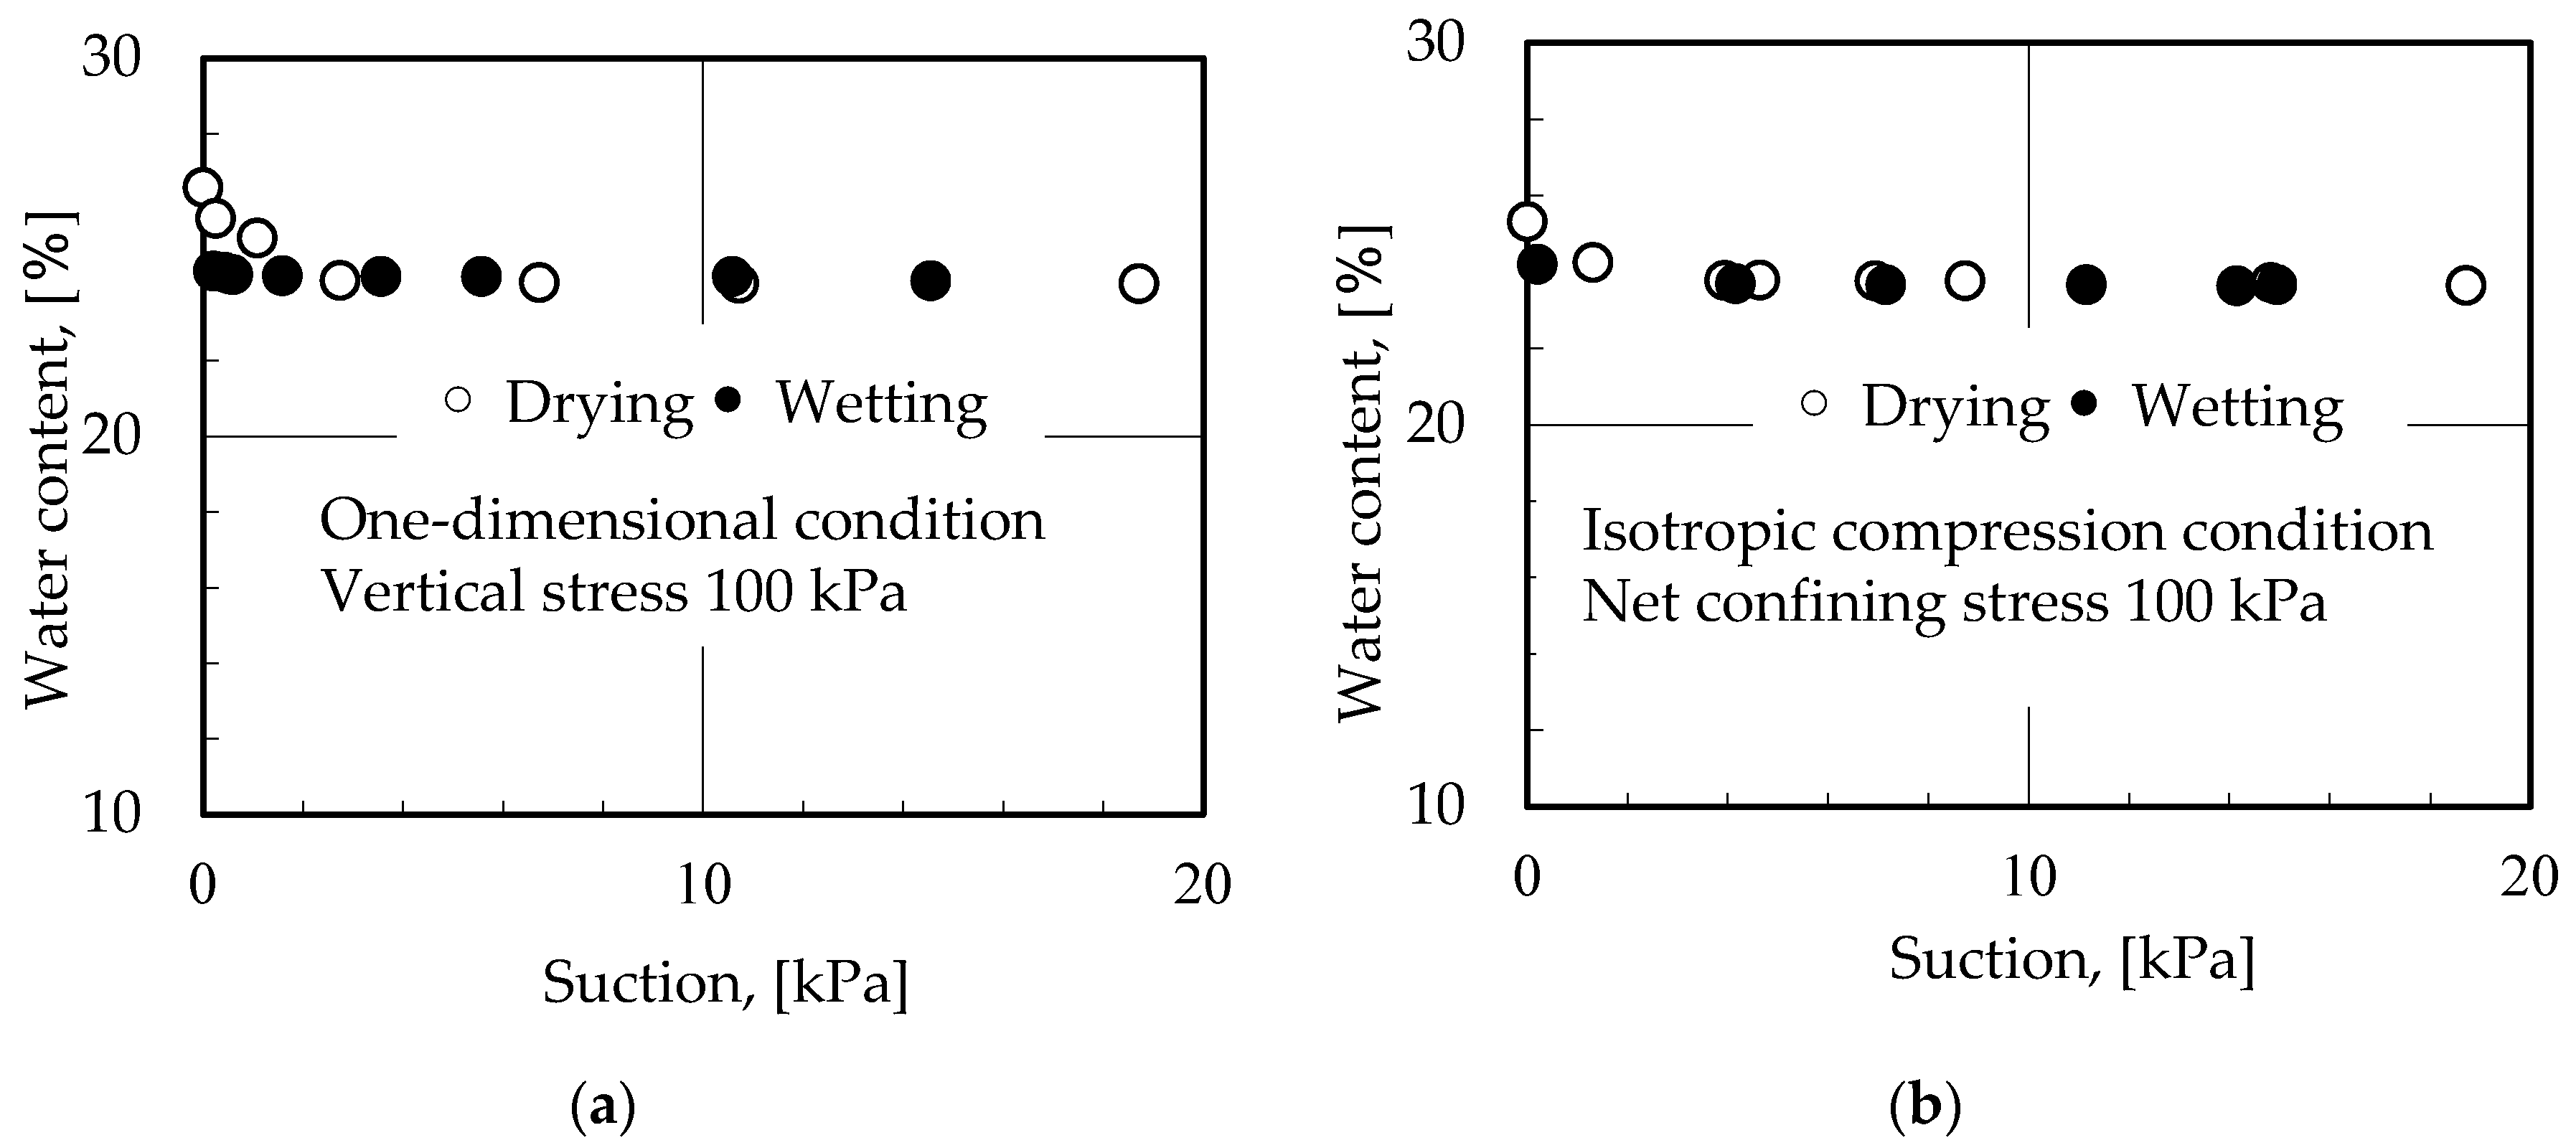
4.1. Relationship between Suction and Water Content of DL-Clay at 100 kPa Stress Conditions

Figure 5 shows the relationship between suction and water content for DL-clay during drying and wetting under both one-dimensional and isotropic stress conditions. A vertical and confining stress of 100 kPa was applied to the respective stress conditions. It can be seen from the results obtained that there are some small differences in the soil–water characteristic curves obtained in one-dimensional and isotropic stress conditions. The results show that the water content obtained for the specimen under one-dimensional stress condition in the drying process was higher than that under isotropic stress conditions when the suction is less than 4 kPa. Equilibrium conditions were attained much faster for the specimen tested in isotropic stress conditions compared to that in one-dimensional stress conditions. The water content in one-dimensional stress conditions became constant at a suction of 4 kPa. For the isotropic stress condition, this was achieved at a suction of less than 2 kPa. This variation in water content could be caused by the micro and macro structure of the soil specimen. At a suction more than 4 kPa, the quantity of free water existing inside the inter-aggregate pores of the soil specimen is reduced. Perhaps the difference in the water volume of the inter-aggregate and intra-aggregate pores of the soil specimen could also contribute to this difference observed. In addition, the change in suction could also have induced the variation in water content in the inter-aggregate and intra-aggregate pores of the soil specimen.
On the other hand, when suction was less than 4 kPa, there was a quick drop in the water content between the drying and wetting curves observed in the one-dimensional stress condition until equilibrium conditions was attained. Additionally, hysteresis was clearly observed between the drying and wetting branches of the soil specimen in one-dimensional stress conditions when the suction was less than 4 kPa. However, the specimen in isotropic stress condition showed negligible hysteresis between drying and wetting curves for the entire suction range. In terms of the size of hysteresis loops between the drying and wetting curves, it was observed that the size of hysteresis reduced as suction increased. This was more evident in the one-dimensional stress condition.

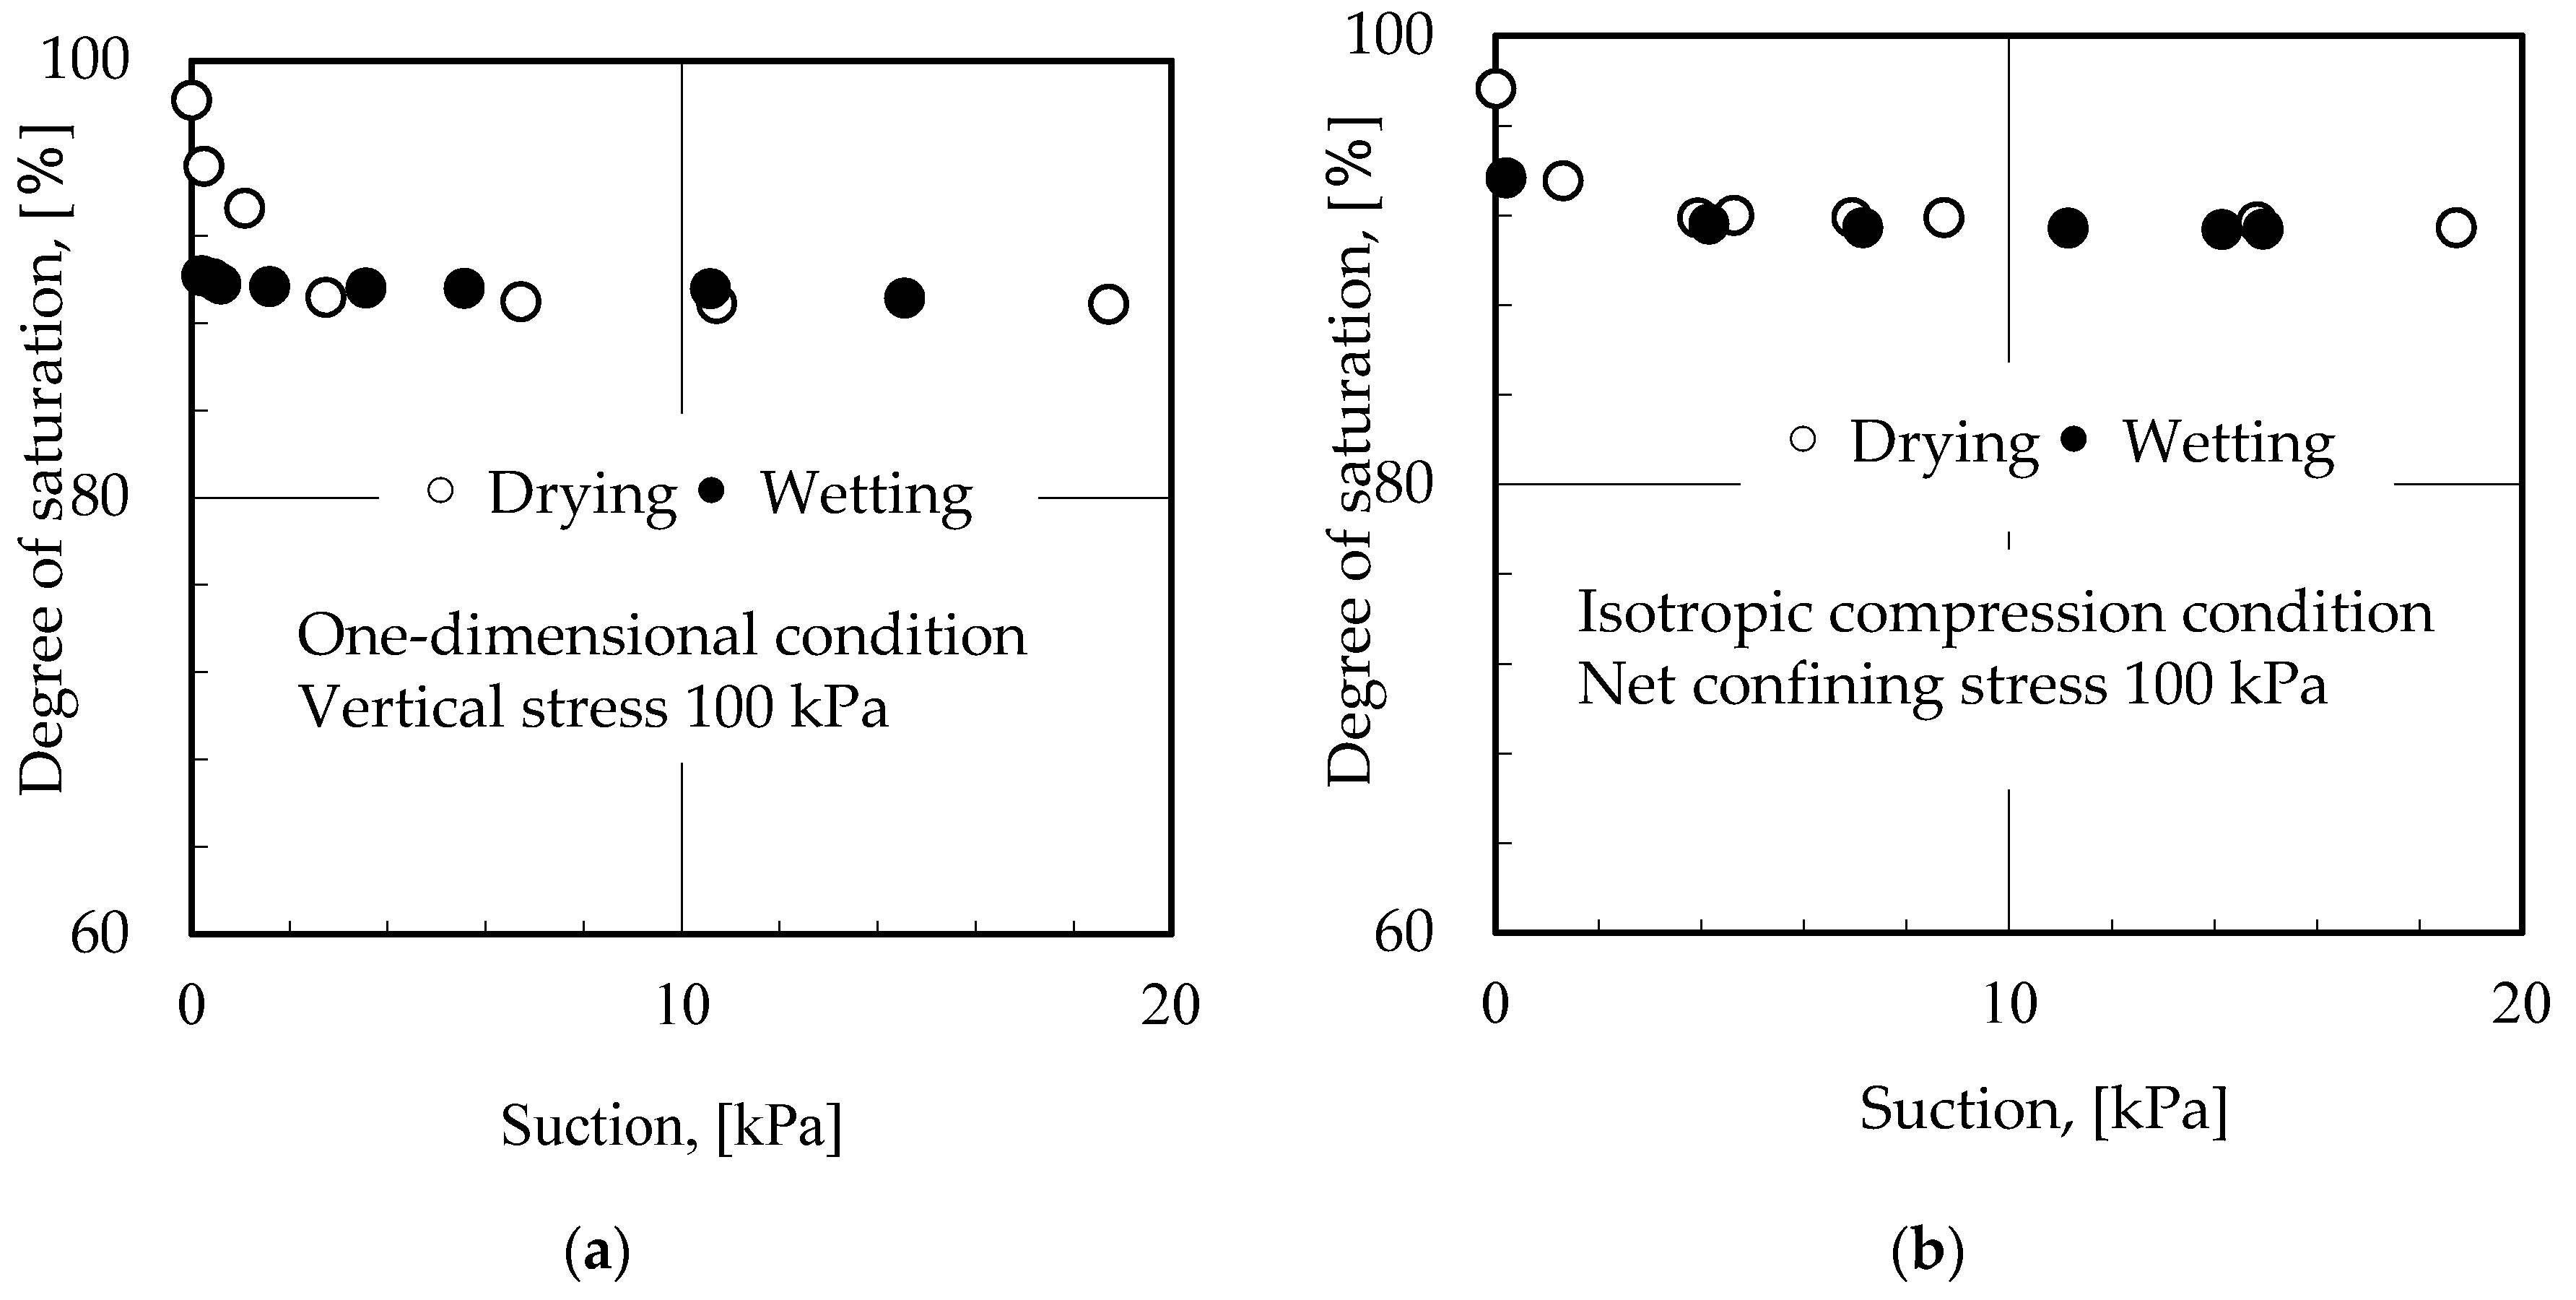
4.2. Relationship between Suction and Degree of Saturation of DL-Clay at 100 kPa Stress Conditions

A comparison of the relationship between matric suction changes and degree of saturation of the specimens at an applied vertical and confining stress of 100 kPa is also presented in Figure 6. It was observed that the degree of saturation for the specimen tested in one-dimensional stress condition was lower than that obtained for the isotropic stress condition in the drying and wetting process. The increase in the degree of saturation recorded for isotropic conditions seem to have been induced by lateral pressure. This is as one result of confining the specimen under isotropic conditions thereby causing high retention activities in the soil specimen. Isotropic stress caused the soil specimen to become dense in void structure and thereby decreasing soil moisture flow movement. The difference in the degree of saturation for both stress conditions could also have been caused by the change in suction and the difference in void ratio between drying and wetting branches of SWCC. As suction was increased, changes in both void ratio and degree of saturation were induced. This phenomenon probably suggests that void ratio may have an influence on the relationship between suction and degree of saturation.
Hysteresis was visible between the drying and wetting process of the soil specimen in one-dimensional stress conditions when the suction was less than 4 kPa. However, this was not the case for the specimen in isotropic stress conditions. The size of the hysteresis loop in isotropic stress conditions was smaller perhaps due to lateral pressure which could have caused the specimen to become stiffer thereby reducing moisture flow movement. When the suction is less than 4 kPa, the change in degree of saturation between drying process and wetting process is mainly caused by the change in void ratio. Therefore, it can probably be concluded that the observed hysteresis in one-dimensional stress conditions could be attributed to the change in suction and the difference in void ratio between drying and wetting branches of soil–water characteristic curves.

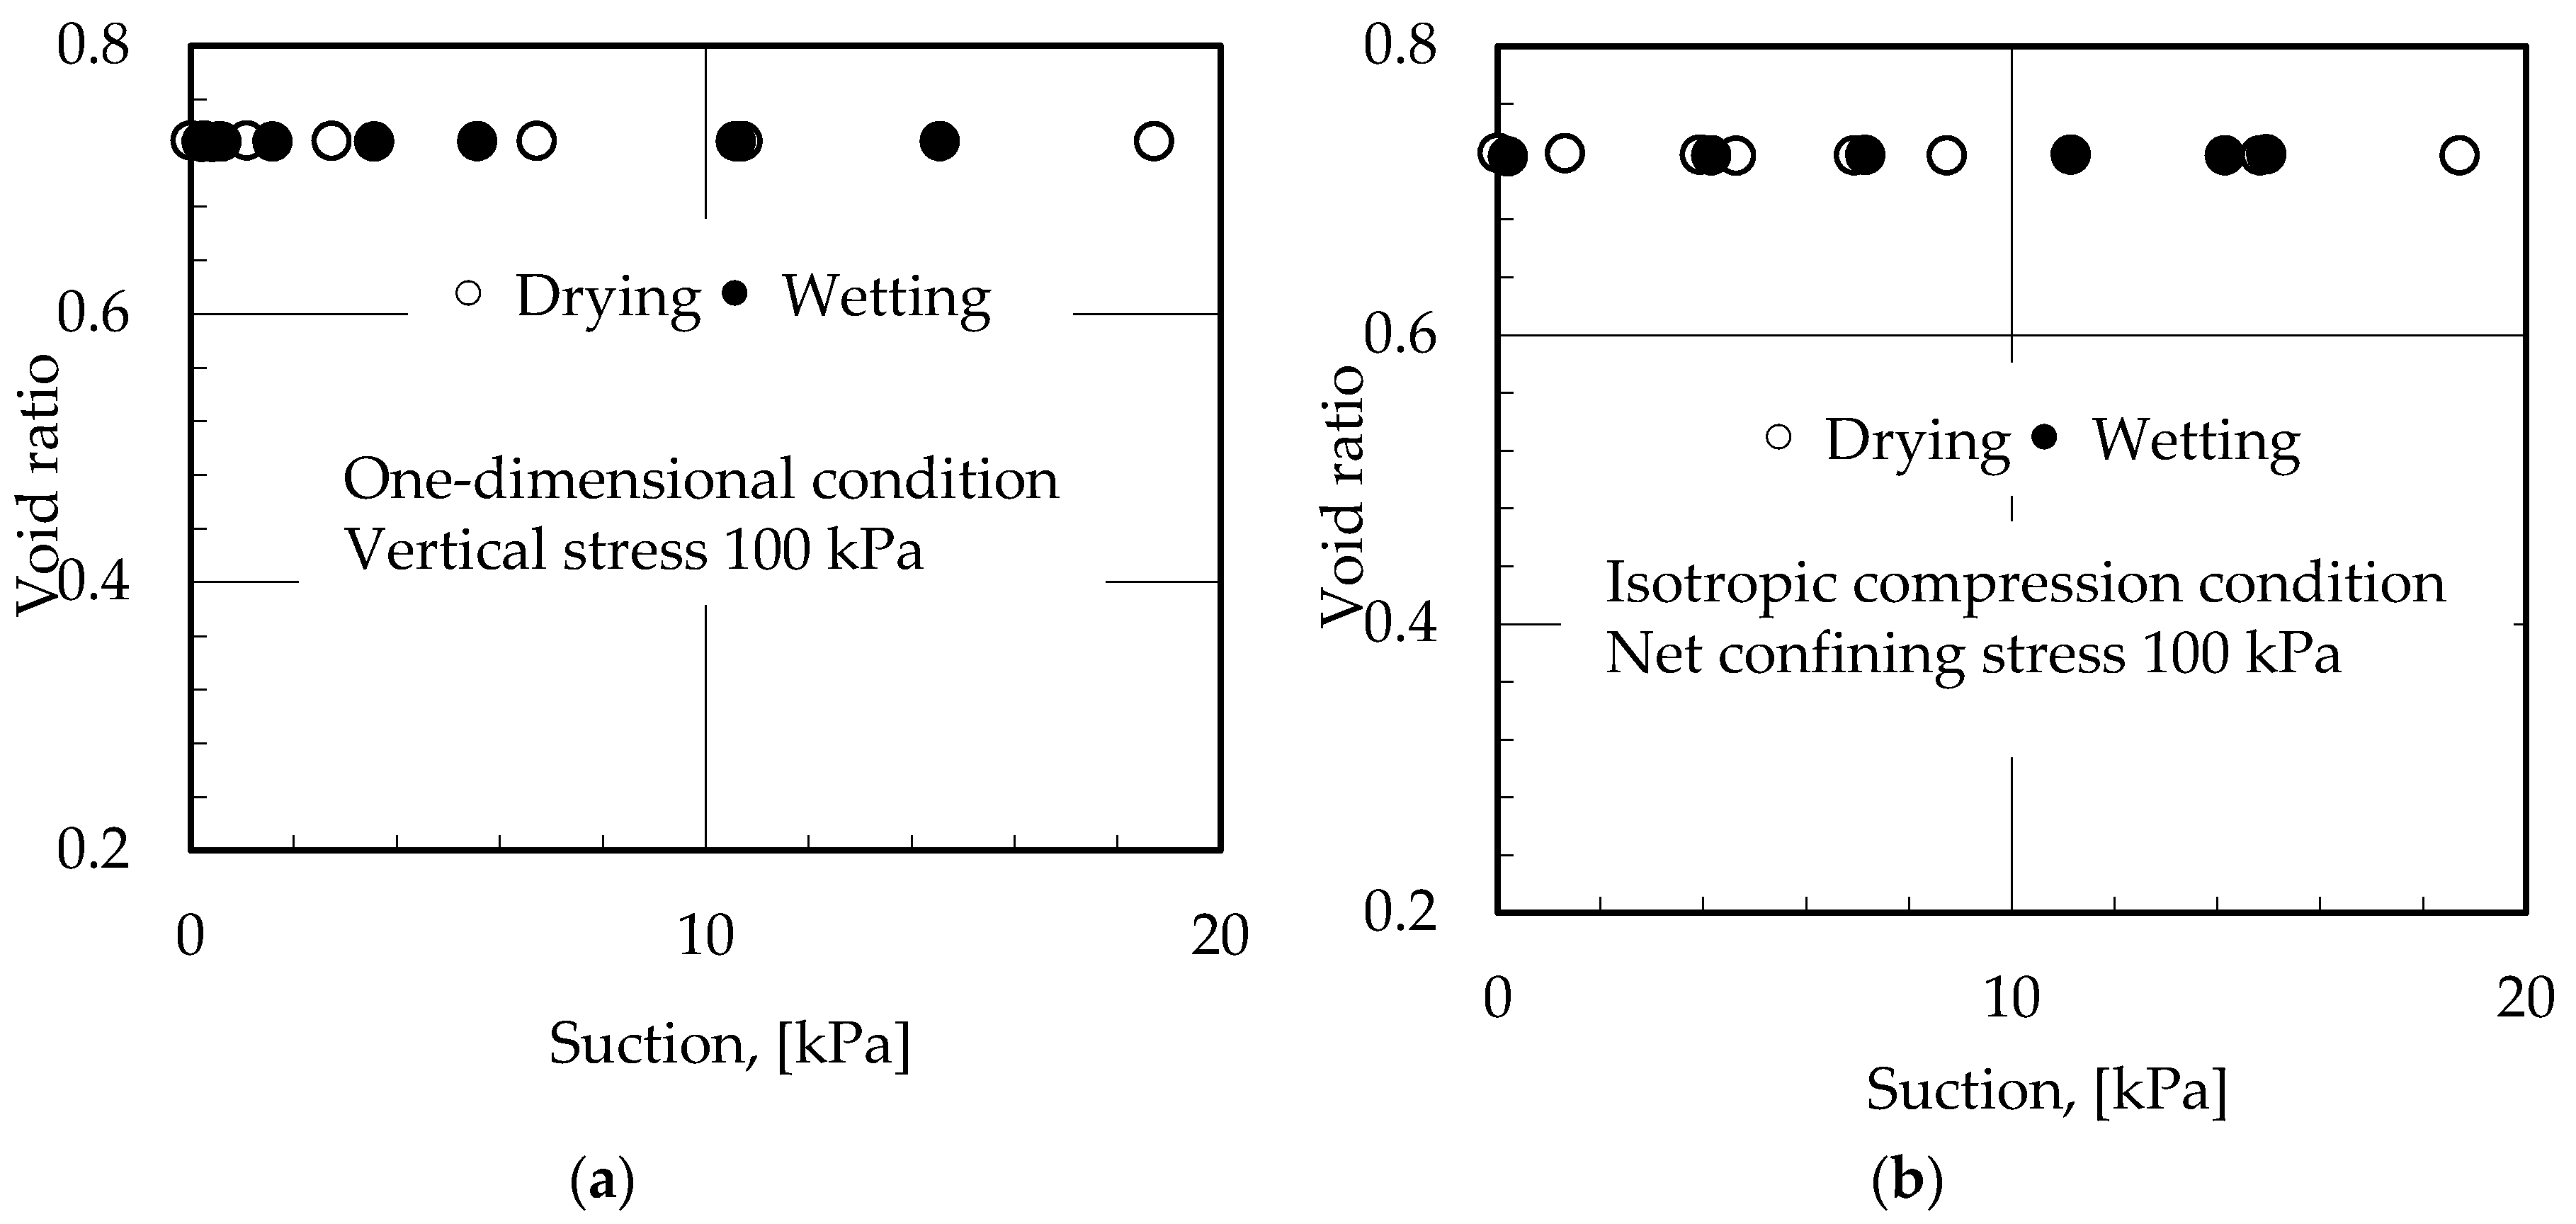
4.3. Relationship between Suction and Void Ratio of DL-Clay at 100 kPa Stress Conditions

It was further worth noting that the relationship between matric suction and void ratio took a form similar to that of a soil–water characteristic curve as can be seen in Figure 7. DL-clay underwent both drying process and wetting process in both stress conditions and it can be seen that void ratio was decreasing with increase in suction. However, there was no significant change in void ratio in both stress conditions for the matric suction range from zero to 20 kPa. Therefore, void ratio seems to have no effect on the shape of the soil–water characteristic curves in both stress conditions. Additionally, since statically compacted specimens are relatively stiff and resistant to shrinkage, the change in void ratio is not considered to have a significant effect on the soil–water characteristic curves [21]. This effect may however have an impact on the air-entry value of the soil specimen. In short, a higher amount of suction maybe required for the soil to experience a transition from the saturated regime to the unsaturated regime. Additionally, the slight change in void ratio is also related to the increase in degree of saturation recorded in the data sets for isotropic stress conditions. The results obtained further suggests that void ratio has an influence on the relationship between suction and degree of saturation. Furthermore, literature has revealed that application of stress may not only affect the void ratio of the specimen but also the pore structure, as has been shown by scanning electron microscopy conducted by Delage and Lefebvre [22]. The rearrangement of pore structure as a result of stress application may also result in variations in the pore size distribution, pore shape and the pore orientations in the soil specimen. This phenomenon perhaps explains why the obtained SWCCs in one-dimensional and isotropic stress conditions are different despite having the same initial void ratio. However, the effect of stress on pore structure and the soil–water characteristic curve behaviour are not fully understood and may require the use of mercury intrusion porosimetry (MIP) and environmental scanning electron microscopy (ESEM) examinations which are usually not common tests conducted in geotechnical engineering practice and hence beyond the scope of this study [23].

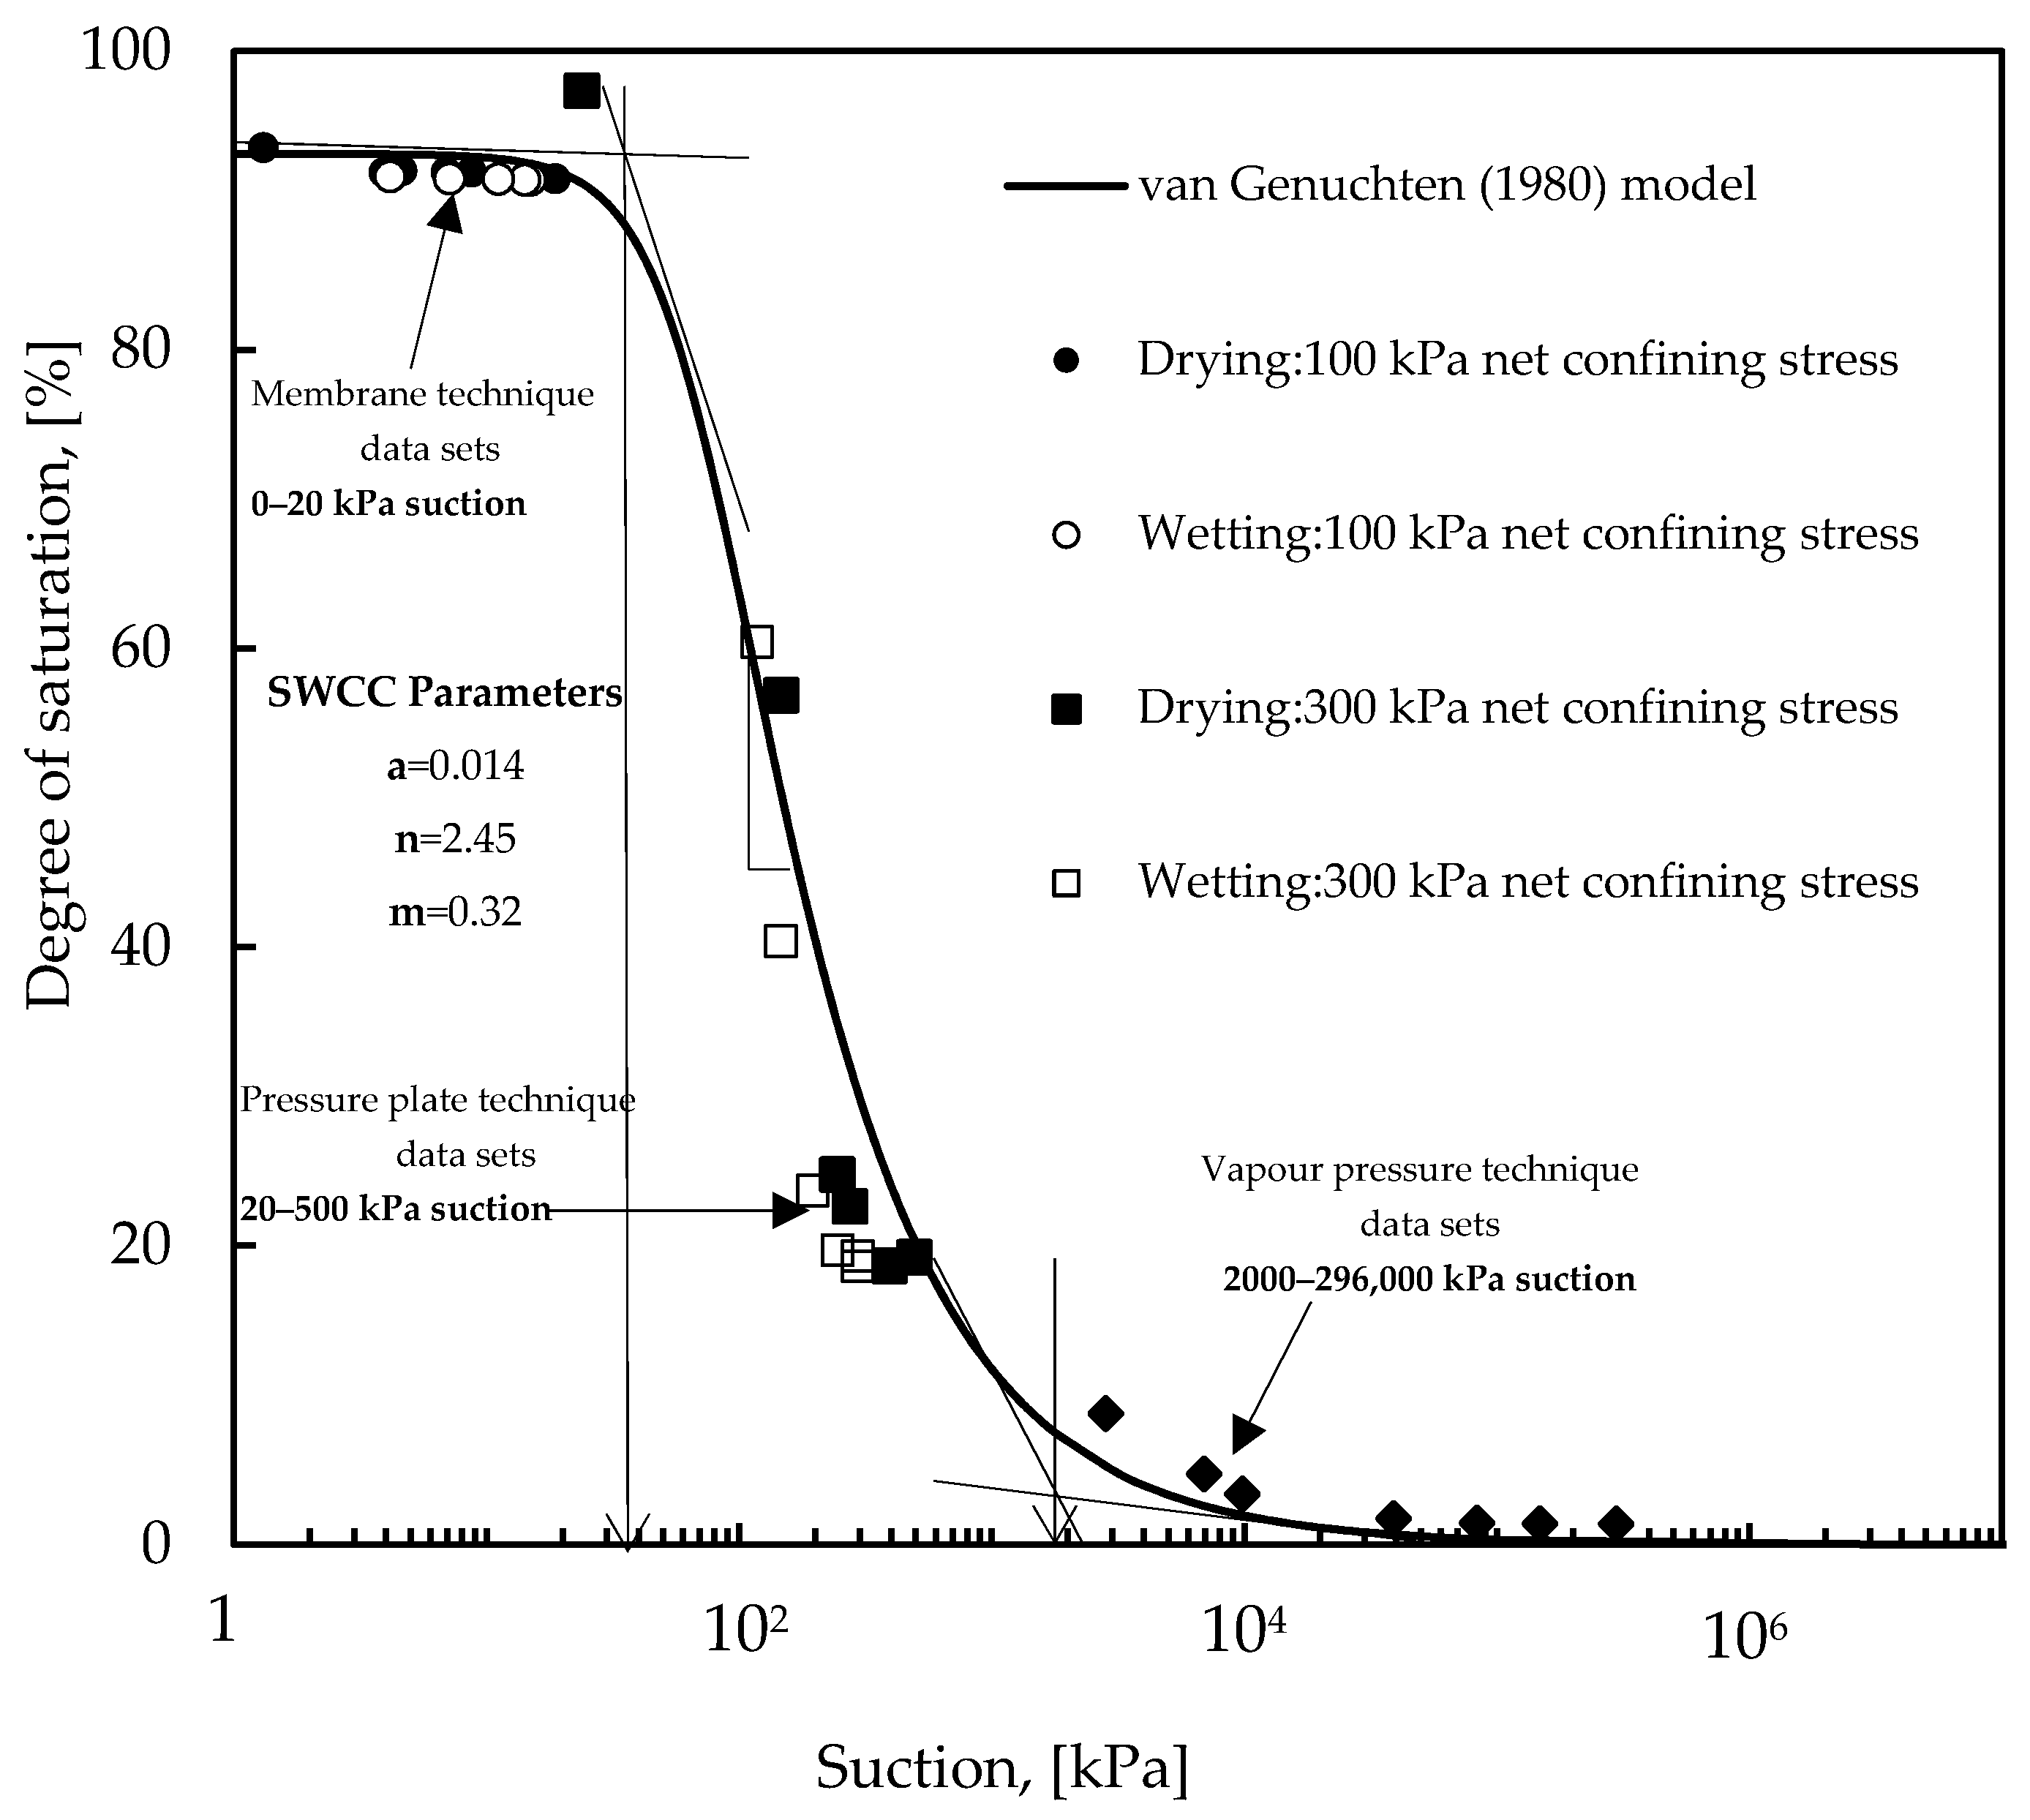
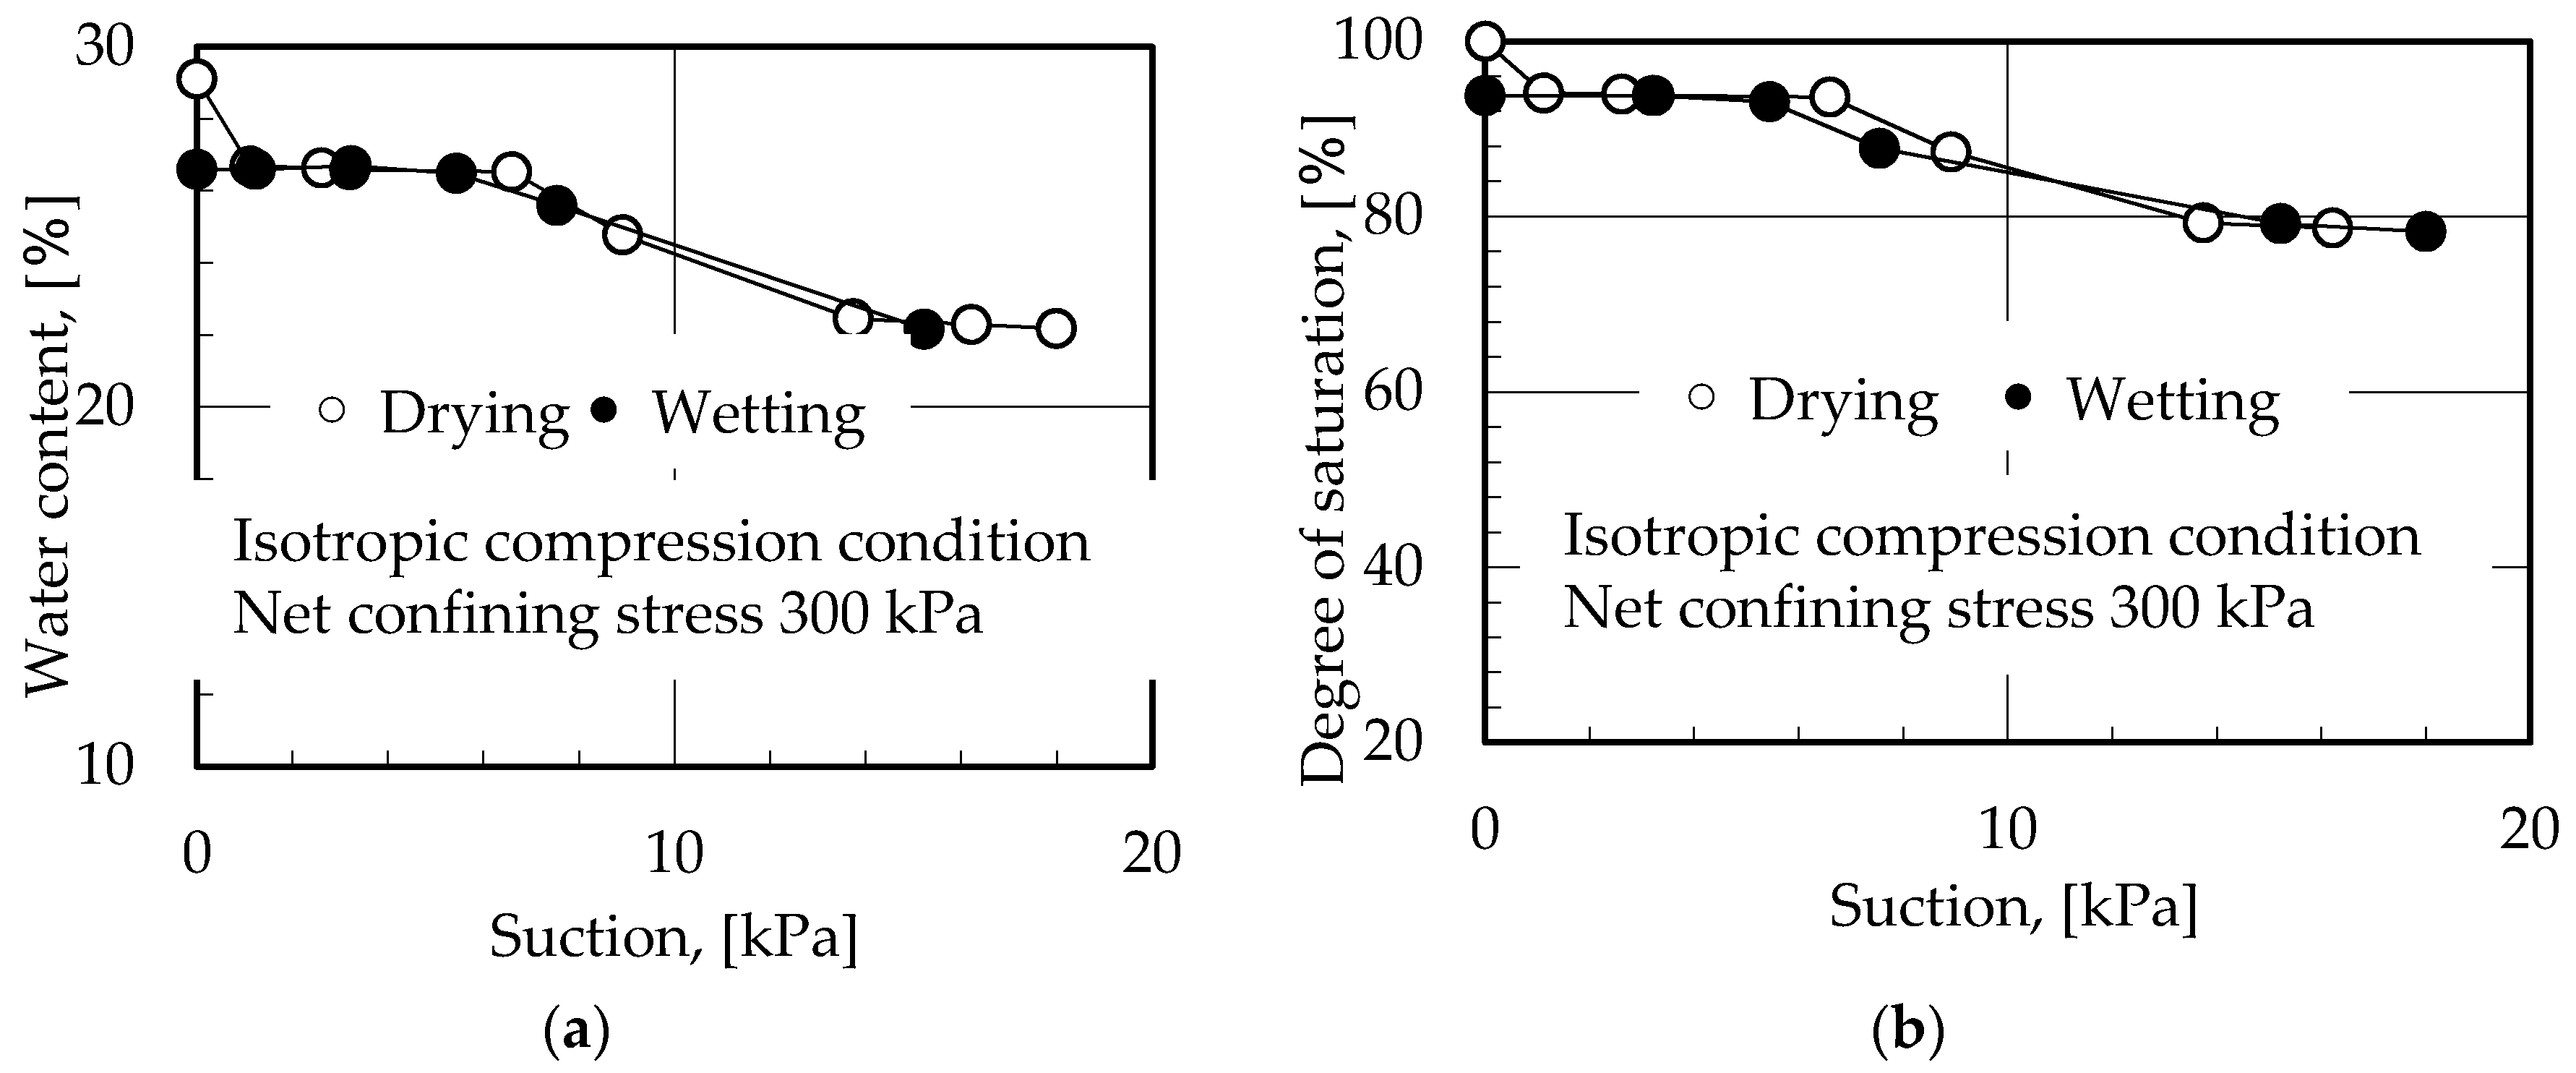
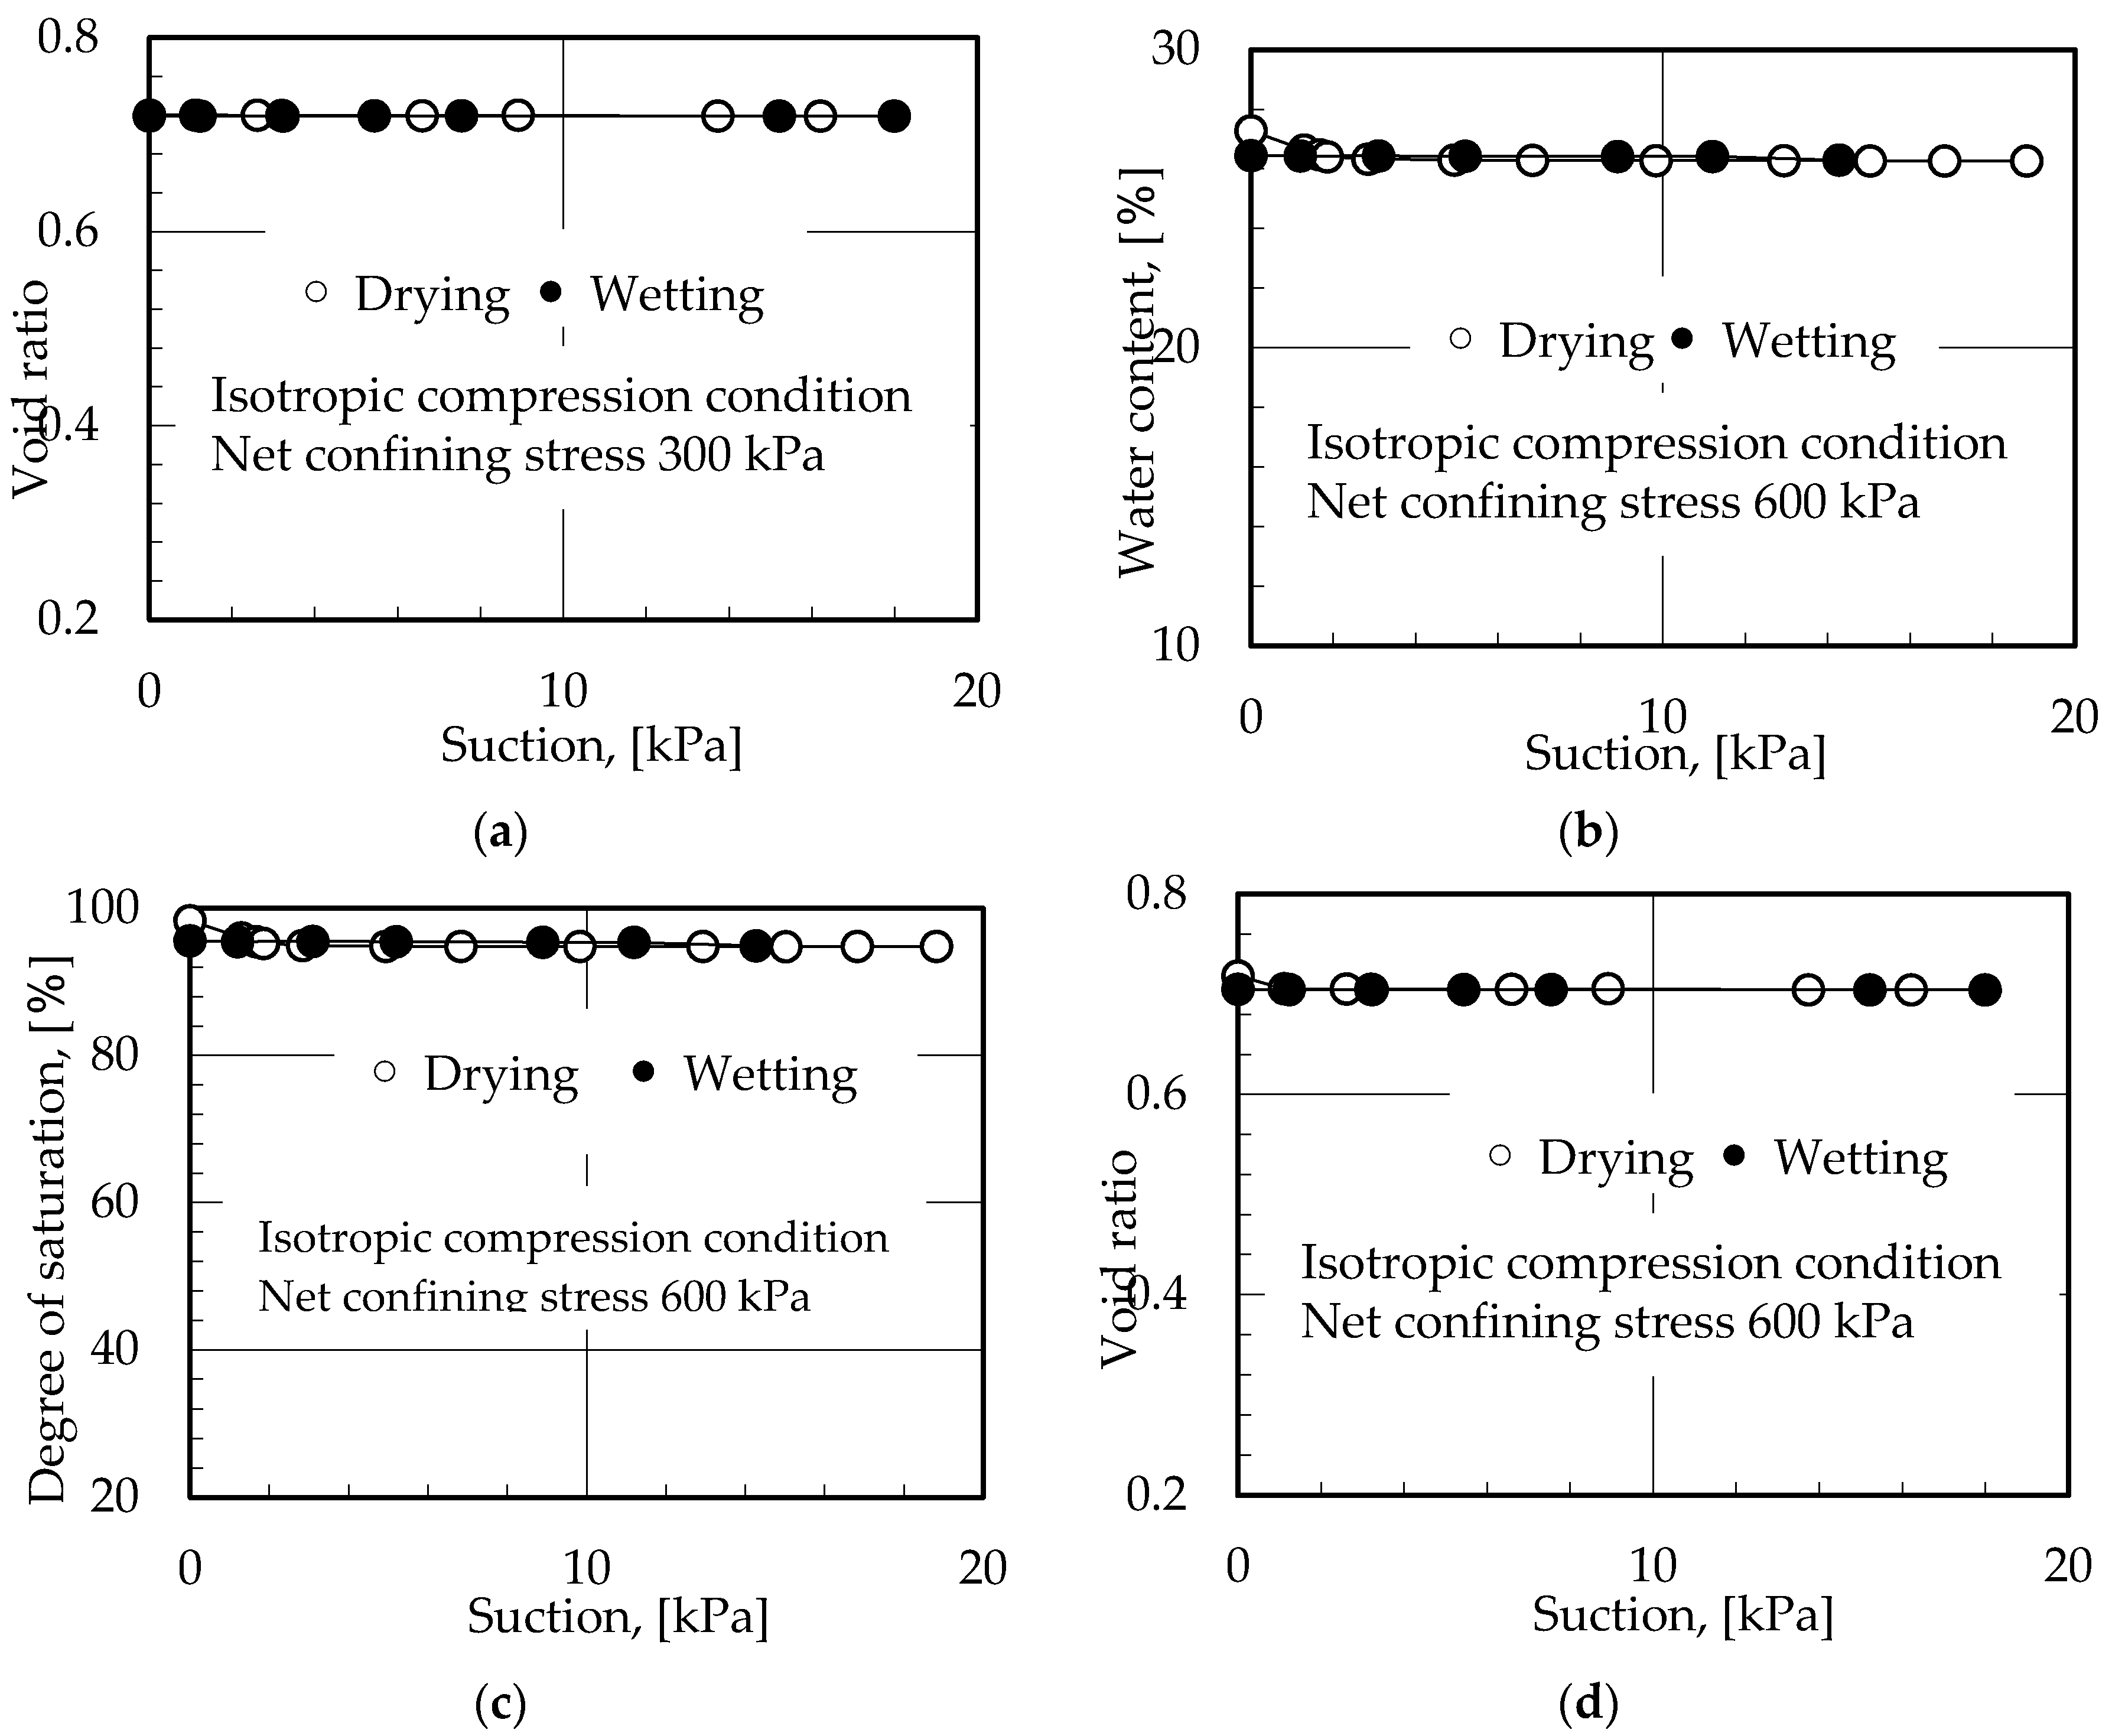
4.4. Soil–Water Characteristic Curves of DL Clay at 300 kPa and 600 kPa Confining Stress Conditions

Figure 8 and Figure 9 contain soil–water characteristic curves obtained in isotropic stress conditions conducted at a net confining stress of 300 kPa and 600 kPa, respectively. This was done to compare the nature of soil–water characteristic curves in this suction range at higher confining stress conditions. The results appear to show negligible hysteresis between drying process and wetting process for the entire suction range as confining stress increased. This is because lateral pressure had an influence on the void structure of the specimen which also directly caused reduction in soil moisture flow movement in the specimen. When net confining stress is increased, the soil specimen became stiffer perhaps due to reduction in the macro porosity (void ratio) of the specimens. As confining stress increased, void ratio was observed to decrease. However, the change in void ratio for these soil–water characteristic curves at these confining stress conditions was negligible. Another point of interest is that as confining stress increased, the soil–water characteristic curves seem almost identical. This could be attributed to the fact that the change in void ratio was quite minimal under these stress conditions.

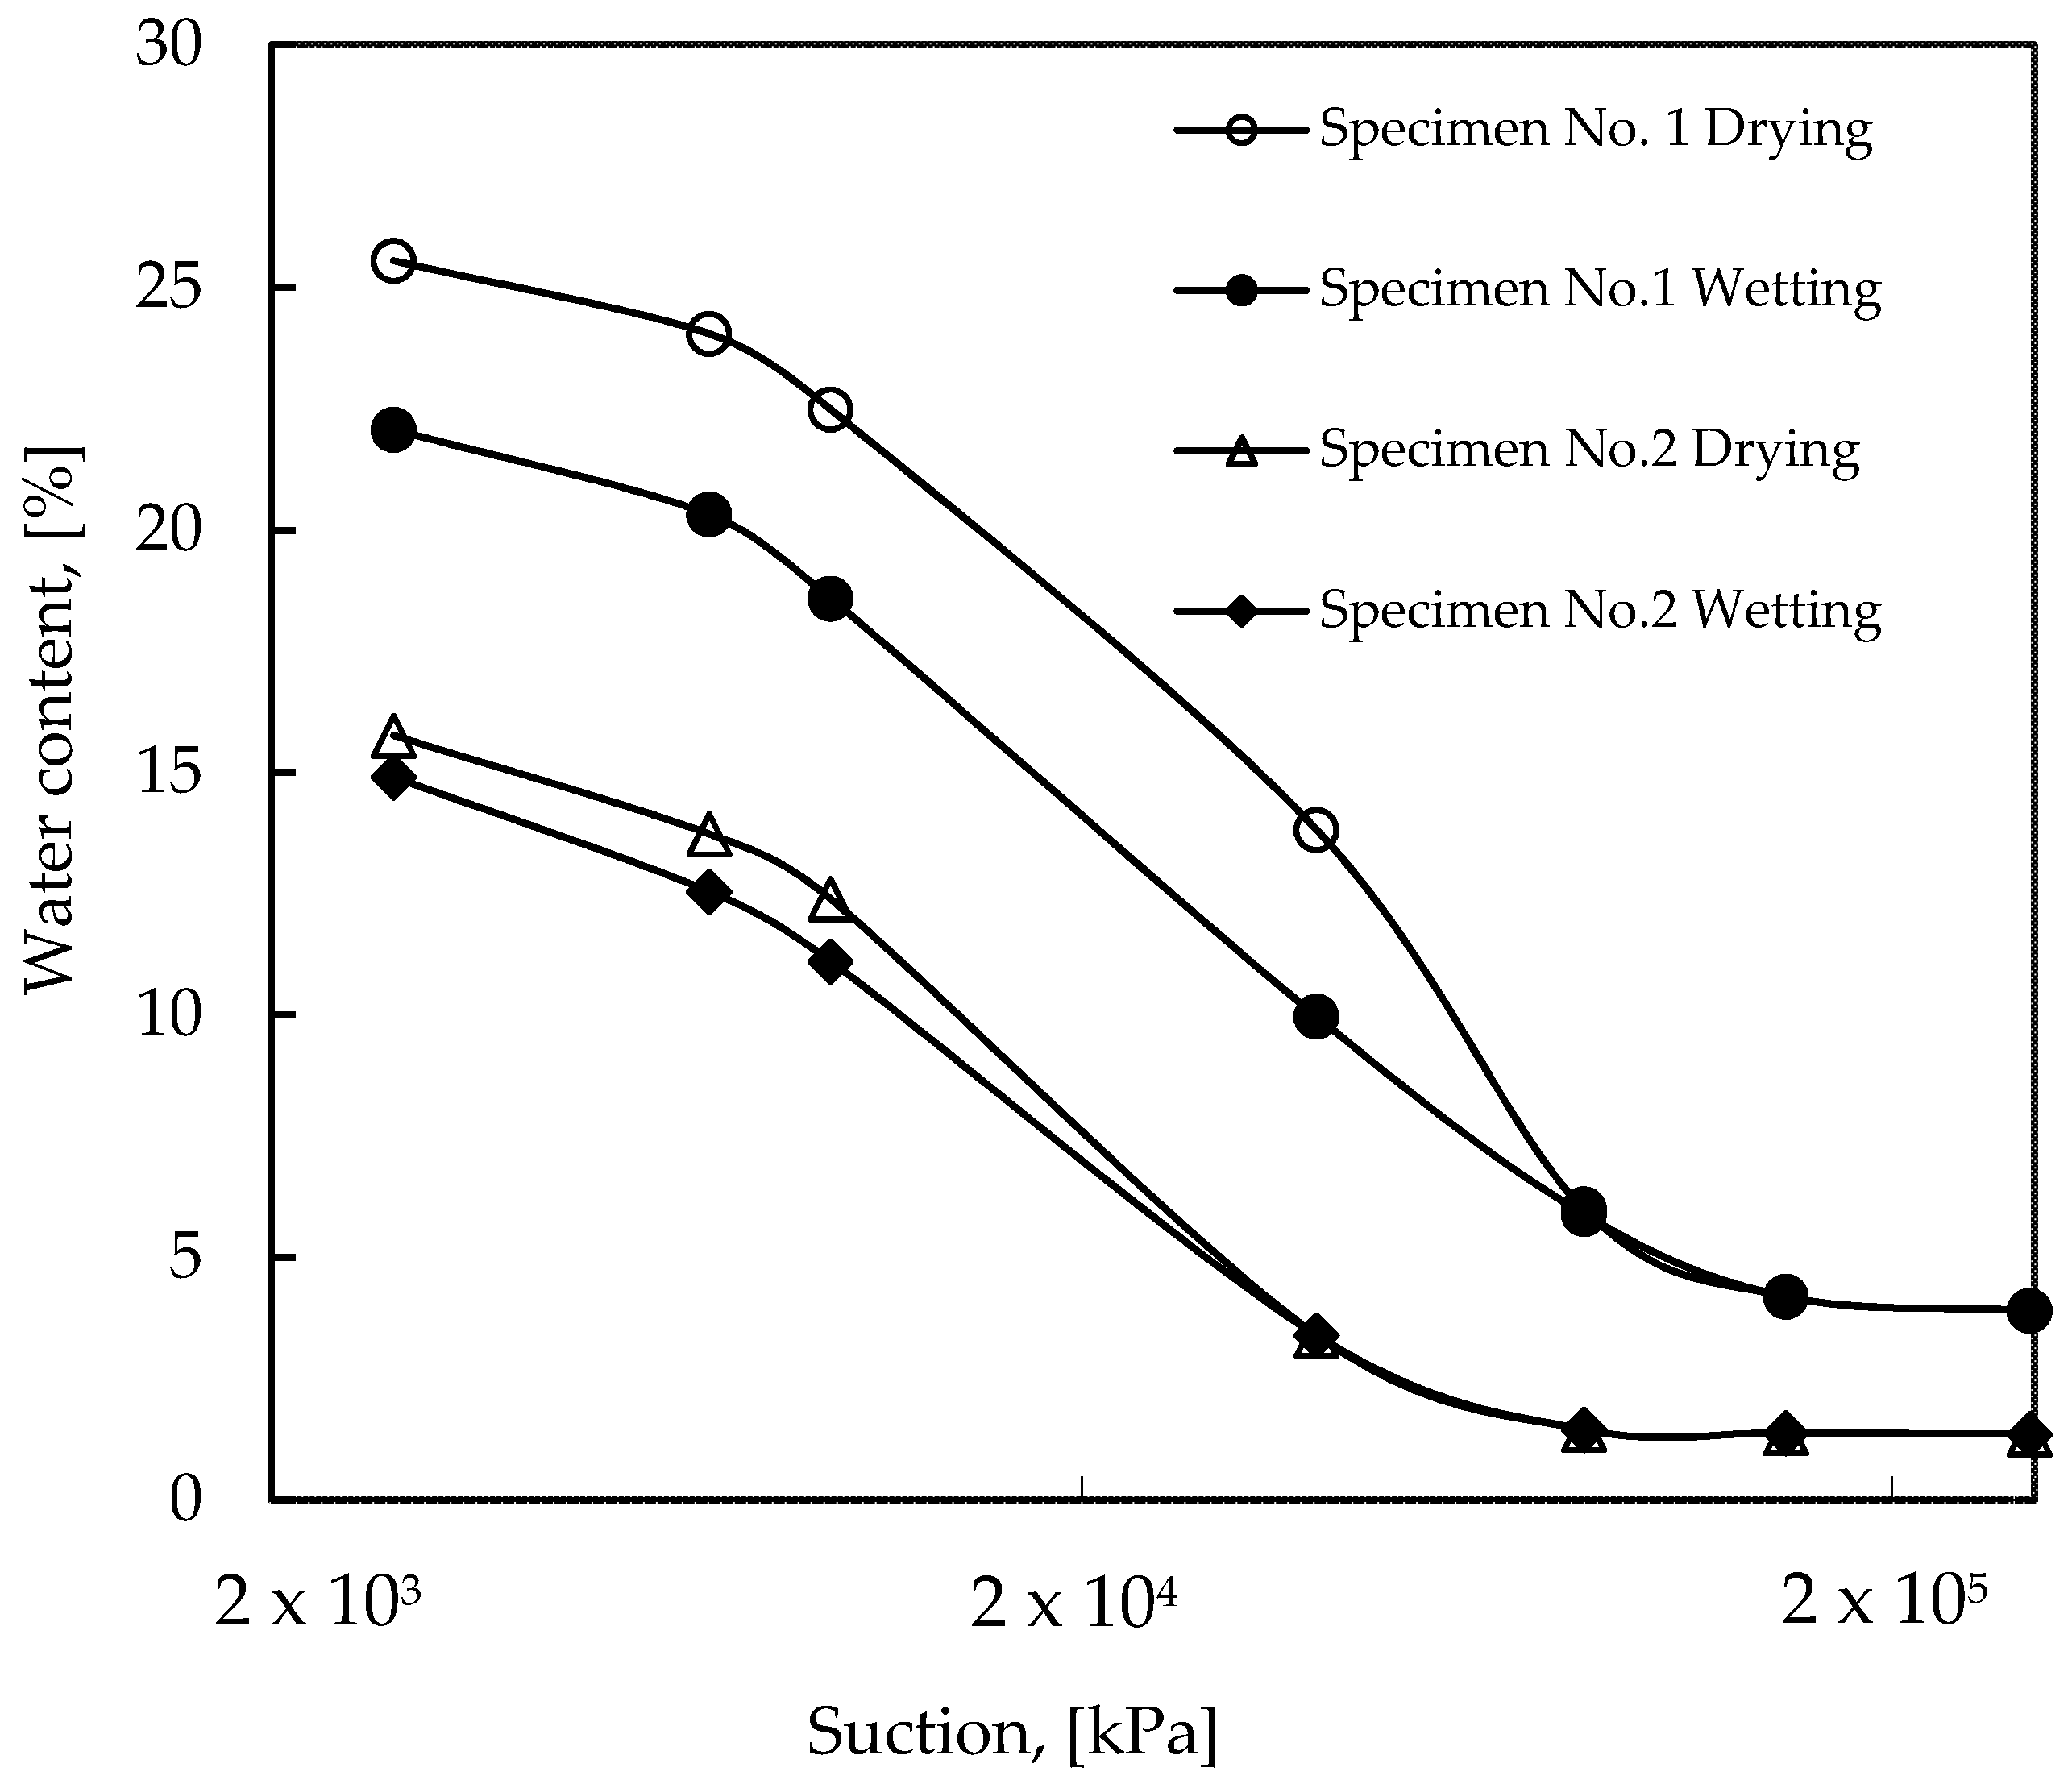
4.5. Soil–Water Characteristic Curves of DL Clay Independent of Stress Conditions

Figure 10 shows soil–water characteristic curve test results of the soil specimens placed in the vacuum glass desiccator apparatus using the Vapour Pressure Technique (VPT). The SWCCs were measured with no application of stress. The two soil specimens were prepared under dry and wet conditions as mentioned in Section 3.3. For specimen No. 1, the soil sample was compacted and soaked in water for approximately 7 days before it was placed in the glass desiccator. The initial water contents of the two specimens were calculated as 27.40% for specimen No. 1 and 17.0% for specimen No. 2. As can be seen from the test results in Figure 10, both specimens underwent the drying and wetting process as saturated salt solutions were exchanged in the glass desiccator. The results show that the water content in drying process for both specimens is higher than that in wetting process at the same suction when the suction is less than 60 MPa. Water content was obviously higher for the specimen soaked in water compared to the specimen with no soaking conditions. The drying and wetting curves for both specimens showed reasonable hysteresis up to 60 MPa of suction. Hysteresis was not apparent as suction increased beyond this magnitude of suction. Therefore, hysteresis had no effect on the test results as suction was increased beyond 60 MPa in both test specimens. It is further worth noting that the size of hysteresis loop for the specimen in wet conditions was larger than the specimen in dry conditions between a suction less than 60 MPa.
Data sets obtained using the pressure plate technique with suction ranging from 20 to 500 kPa and vapour pressure techniques with suction from 500 to 296,000 kPa were joined together with the membrane technique data sets to complete the entire soil–water characteristic curve. Thereafter, the soil–water characteristic curves were best-fit over the entire range of matric suction using the prediction model suggested by van Genuchten M.Th (1980). The best-fit curve of the SWCC for various stress conditions and for the entire range of matric suction adopted in this study is as shown in Figure 11.
With regard to the DL-clay soil sample used in this research, the correspondence between measured SWCC data sets and the van Genuchten M.Th (1980) model matched well several points save for the vapour pressure technique data sets where hysteresis was observed. The van Genuchten M.Th (1980) model still gave relatively good and realistic fits. In the geotechnical engineering practice, the key parameters of the SWCC are the air-entry value (ψi), the residual water content (ψr) and the slope of the straight line portion of the drying branch. From the figure above, parameters of the soil–water characteristic curve were deduced and these are as shown in Table 5. Through numerous iterations, parameters a, n and m were also established. It was clearly observed during iterations that the parameter ‘a’ had little effect on the shape of the soil–water characteristic curve, but it was observed to move the curve towards the higher or lower suction regions depending on the value inputted. A smaller value of ‘m’ on the other hand created a smooth slope in low suction range and a steeper slope in high suction range. Finally, as the values of ‘n’, increased, the slope of the SWCC was observed to become steeper.
In order to perfectly take into consideration the effect of different stress conditions to soil–water characteristic curve data sets, Tarantino (2009) and Gallipoli (2012) proposed a modified van Genuchten equation for obtaining the suction versus degree of saturation relation. It is worth mentioning that the van Genuchten M.Th (1980) model required some modifications to take good fittings with these experimental data sets. In order to curve fit the experimental data sets perfectly, the mathematical expression of the model was modified to take into consideration the effort of different stress conditions. Details of the modifications of the model are beyond the scope of this paper.

5. Conclusions

This study experimentally examined the differences in soil–water characteristic curves obtained under one-dimensional and isotropic stress conditions through a silt soil. Laboratory measurements of SWCCs were conducted using the micro porous membrane and pressure plate techniques on the new modified triaxial apparatus and the vapour pressure technique using a glass desiccator. In this investigation, different stresses ranging from 100 to 600 kPa were applied to the soil specimens under one-dimensional and isotropic stress conditions in order to compare the SWCCs for each drying and wetting process. Key issues drawn from this study include;
(1)
The obtained soil–water characteristic curves appears to be affected by the influence of stress conditions (i.e., one-dimensional and isotropic stress conditions). Lateral pressure and confinement of the soil specimen probably induced high retention activities in the soil specimens. Isotropic stress caused the specimen’s void structure to become dense and hence soil moisture flow movement also decreased.
(2)
There was negligible hysteresis of the soil–water characteristic curves obtained between void ratio and suction in both stress conditions. Therefore, void ratio seems to have no effect on the shape of the SWCC in both stress conditions. However, void ratio had a significant influence on the relationship between suction and degree of saturation. Furthermore, different stress conditions may not only affect void ratio but also affect the pore structure, pore size distribution, pore shape and pore orientation of the soil specimen. This may have an influence on the soil–water characteristic curves measured.

Author Contributions

This paper was completed under the guidance of T.N. P.H. performed the experiments, analysed the data and wrote the paper. T.N. is the copyright owner of the membrane filter technology used in the experiments. T.N. provided all the testing materials/analysis tools and designed the experiments.

Acknowledgments

The authors acknowledge and appreciate the financial support of Japan International Cooperation (JICA). Special thanks to Ashikaga University for their support in providing the necessary apparatus used to undertake this research.

Conflicts of Interest

The authors declare no conflict of interest.

References

  1. Fredlund, D.G.; Rahardjo, H. Measurement of soil suction. In Soil Mechanics for Unsaturated Soils; John Wiley & Sons: Hoboken, NJ, USA, 1993; Chapter 4; pp. 64–106. [Google Scholar]
  2. Leong, E.C.; Rahardjo, H. Review of soil-water characteristic curve equations. J. Geotech. Geoenviron. Eng. ASCE 1997, 123, 1106–1117. [Google Scholar] [CrossRef]
  3. Escario, V.; Saez, J. The shear strength of partly saturated soils. Geotechnique 1986, 36, 453–456. [Google Scholar] [CrossRef]
  4. Li, B.; Chen, Y. Influence of dry density on soil-water retention curve of unsaturated soils and its mechanism based on mercury intrusion porosimetry. Trans. Tianjin Univ. 2016, 22, 268–272. [Google Scholar] [CrossRef]
  5. Nishimura, T.; Koseki, J.; Fredlund, D.G.; Rahardjo, H. Microporous membrane technology for measurement of soil-water characteristic curve. Geotech. Test. J. 2012, 35, 201–208. [Google Scholar]
  6. Ng, C.W.W.; Wang, B. A new triaxial apparatus for studying stress effects on soil-water characteristics of unsaturated soils. In Proceedings of the 15th International Conference on Soil Mechanics and Geotechnical Engineering, Istanbul, Turkey, 27–31 August 2001; pp. 611–614. [Google Scholar]
  7. Vanapalli, S.K.; Fredlund, D.G.; Pufahl, D.E. The influence of soil structure and stress history on the soil-water characteristics of a compacted till. Geotechnique 1999, 49, 143–159. [Google Scholar] [CrossRef]
  8. Ng, C.W.W.; Pang, Y.W. Influence of stress state on soil water characteristics and slope stability. J. Geotech. Geoenviron. 2000, 126, 157–166. [Google Scholar] [CrossRef]
  9. Chen, Y.L.; Huang, D. Influence of pore structure characteristics on soil-water characteristic curves under different stress states. Chin. J. Eng. 2017, 39, 147–154. [Google Scholar]
  10. Tavakoli, D.M.H.; Habibagahi, G.; Nikooee, E. Effect of confining stress on soil water retention curve and its impact on the shear strength of unsaturated soils. Vadose Zone J. 2014, 13, 1–11. [Google Scholar]
  11. Oh, S.; Lu, N. Uniqueness of the suction stress characteristic curve under different confining stress conditions. Vadose Zone J. 2014, 13. [Google Scholar] [CrossRef]
  12. Zhou, J.; Yu, J.L. Influences affecting the soil-water characteristic curve. J. Zhejiang Univ. Sci. 2005, 6, 797–804. [Google Scholar] [CrossRef]
  13. Nishimura, T.; Fredlund, D.G. Failure envelope of a desiccated, unsaturated silty soil. In Proceedings of the 15th International Conference on Soil Mechanics and Geotechnical Engineering, Istanbul, Turkey, 27–31 August 2001; Volume 1, pp. 615–618. [Google Scholar]
  14. Uchimura, T.; Gizachew, G.; Wang, L.; Nishie, S.; Seko, I. Deformation and water seepage observed in a natural slope during failure process by artificial heavy rainfall. In Proceedings of the 18th International Conference for Soil Mechanics and Geotechnical Engineering, Paris, France, 2–6 September 2013; pp. 2273–2274. [Google Scholar]
  15. Ishikawa, T.; Zhang, Y.; Tokoro, T.; Miura, S. Medium-size triaxial apparatus for unsaturated granular subbase course materials. Soils Found. 2014, 54, 67–80. [Google Scholar] [CrossRef]
  16. Wang, H.; Koseki, J.; Sato, T.; Chiaro, G.; Tan, T.J. Effect of saturation on liquefaction resistance of iron ore fines and sandy soils. Soils Found. 2016, 56, 732–744. [Google Scholar] [CrossRef]
  17. Wenjing, S.; De’an, S.; Lei, F.; Shiqing, L. Soil-water characteristics of Gaomiaozi bentonite by vapour equilibrium technique. J. Rock Mech. Geotech. Eng. 2014, 6, 48–54. [Google Scholar]
  18. Oteo, M.C.; Saez, A.; Esteban, F. Laboratory tests and equipment with suction control. In Proceedings of the 1st International Conference on Unsaturated Soils, Paris, France, 6–8 September 1995; Volume 3, pp. 1509–1515. [Google Scholar]
  19. Delage, P.; Romero, E.E.; Tarantino, A. Recent developments in the techniques of controlling and measuring suction in unsaturated soils. In Proceedings of the 1st European Conference on Unsaturated Soils, Durham, UK, 2–4 July 2008; pp. 33–52. [Google Scholar]
  20. Nishimura, T.; Fredlund, D.G. A new triaxial apparatus for high total suction using relative humidity control. In Proceedings of the 12th Asian Regional Conference on Soil Mechanics and Geotechnical Engineering, Singapore, 4–8 August 2003; pp. 65–68. [Google Scholar]
  21. Vanapalli, S.K.; Sillers, W.S.; Fredlund, M.D. The meaning and relevance of residual water content to unsaturated soils. In Proceedings of the 51st Canadian Geotechnical Conference, Edmonton, AB, Canada, 4–7 October 1998; pp. 101–108. [Google Scholar]
  22. Delage, P.; Lefebvre, G. Study of the structure of a sensitive Champlain clay and of its evolution during consolidation. Can. Geotech. J. 1984, 21, 21–35. [Google Scholar] [CrossRef]
  23. Zhou, C.; Ng, C.W.W. A new and simple stress-dependent water retention model for unsaturated soil. Comput. Geotech. 2014, 62, 216–222. [Google Scholar] [CrossRef]
Figure 1. Grain size Distribution and compaction curve of silt (a) Grain size distribution for silt soil; (b) Compaction curve for silt soil.
Soilsystems 02 00043 g001
Figure 2. Schematic diagram of modified Soil Water Characteristic Curve apparatus for one-dimensional stress condition.
Soilsystems 02 00043 g002
Figure 3. Schematic diagram of modified triaxial apparatus for isotropic stress condition.
Soilsystems 02 00043 g003
Figure 4. Illustration of Supor 450 saturated microporous membrane on porous stone.
Soilsystems 02 00043 g004
Figure 5. Relationship between suction and water content (a) Suction vs. water content in one dimensional stress condition; (b) Suction vs. water content in isotropic stress condition.
Soilsystems 02 00043 g005
Figure 6. Relationship between suction and degree of saturation (a) Suction vs. degree of saturation in one dimensional stress condition; (b) Suction vs. degree of saturation in isotropic stress condition.
Soilsystems 02 00043 g006
Figure 7. Relationship between suction and void ratio (a) Suction vs. void ratio in one dimensional stress condition; (b) Suction vs. void ratio in isotropic stress condition.
Soilsystems 02 00043 g007
Figure 8. Soil–water characteristic curves at 300 kPa net confining stress (a) Suction vs. water content at 300 kPa net confining stress; (b) Suction vs. degree of saturation at 300 kPa net confining stress.
Soilsystems 02 00043 g008
Figure 9. Soil–water characteristic curves at 300 kPa and 600 kPa net confining stress (a) Suction vs. void ratio at 300 kPa net confining stress; (b) Suction vs. water content at 600 kPa net confining stress. (c) Suction vs. degree of saturation at 600 kPa net confining stress; (d) Suction vs. void ratio at 600 kPa net confining stress.
Soilsystems 02 00043 g009
Figure 10. Suction vs. water content for vapour pressure technique data sets.
Soilsystems 02 00043 g010
Figure 11. Curve fitting of soil–water characteristic curve data sets with different stress conditions.
Soilsystems 02 00043 g011
Table 1. Soil classification data of statically compacted silt sample.
Specific gravity2.65
Percentage of sand fraction %1.00
Percentage of silt fraction %87.00
Percentage of clay fraction %12.00
Fine component %99.00
Mean grain diameter of silt D50 mm0.02
Void ratio0.726
Liquid limit %24.70
Plastic limit %22.80
Plasticity index1.90
Unified Soil Classification SystemML
Maximum dry density g/cm31.53
Optimum water content %17.00
ML = Low plastic silt.
Table 2. Test method and suction ranges.
Measurement MethodAuthorsSuction Range (kPa)Total Number of Tests Conducted
Membrane Filter TechniqueNishimura et al. 20120–2014
Pressure Plate TechniqueFredlund & Rahardjo, 199320–5001
Vapour Pressure Technique, VPTDelage et al. 19982000–296,0001
Table 3. Summary of properties of Supor 450 saturated membrane and it’s AEV.
Membrane TypeMembrane Pore Size (μm)Membrane Thickness (μm)Provided AEV (kPa)Supplied Air Pressure (kPa)Enduring Time (h)
Supor 4500.4514025020240
Table 4. Relative Humidity summary and suction.
Salt Solution NameChemical NameReal RH% at Atmospheric TempReal RH% at VacuumSuction in Theory kPaSuction in Theory MPa
Potassium SulphateK2SO4998128302.83
Potassium NitrateKNO3999469406.94
Ammonium DihydrogenphosphateNH4H2PO4484598009.8
Sodium ChlorideNaCl895139,00039
Magnesium NitrateMg(NO3)2·6H2O665983,40083.4
Magnesium ChlorideMgCl2·6H2O3938148,000148
Lithium ChlorideLiCl4021296,000296
Table 5. SWCC parameters.
Name of SoilInitial Water Content (%)Residual Water Content (%)Air Entry Value, ψi (kPa)Residual Suction, ψr (kPa)
Silt17210002200

