Abstract
Sandwich panels are widely used in industrial roofing due to their lightweight and thermal insulation properties; however, their structural fire resistance remains insufficiently understood. This study presents a data-driven approach to predict the mid-span deformation of glass wool-cored sandwich roof panels subjected to ISO 834-5 standard fire tests. A total of 39 full-scale furnace tests were conducted, yielding 1519 data points that were utilized to develop deep learning models. Feature selection identified nine key predictors: elapsed time, panel orientation, and seven unexposed-surface temperatures. Three deep learning architectures—convolutional neural network (CNN), multilayer perceptron (MLP), and long short-term memory (LSTM)—were trained and evaluated through rigorous 5-fold cross-validation and independent external testing. Among them, the CNN approach consistently achieved the highest accuracy, with an average cross-validation performance of , and achieved on the external test set. These results highlight the robustness of CNN in capturing spatially ordered thermal–structural interactions while also demonstrating the limitations of MLP and LSTM regarding the same experimental data. The findings provide a foundation for integrating machine learning into performance-based fire safety engineering and suggest that data-driven prediction can complement traditional fire-resistance assessments of sandwich roofing systems.
1. Introduction
Sandwich panels are widely employed as roofing and façade components in industrial and commercial buildings owing to their lightweight properties, excellent thermal insulation, and construction efficiency [1]. These composite elements consist of thin face sheets bonded to an insulating core, achieving high structural efficiency with reduced material consumption. Consequently, they are commonly adopted in warehouses, logistics centers, and prefabricated facilities. Despite these advantages, sandwich panels remain critically vulnerable under fire as core decomposition and adhesive failure can induce rapid deformation and collapse [2]. Organic-core panels are particularly hazardous due to high flammability, releasing heat, smoke, and toxic gases, while hidden flames within the core accelerate fire spread and threaten roof stability [2]. The adhesive layer may debond at relatively low temperatures (130–350 °C), causing a loss of bending strength; without lateral restraint, sudden collapse can occur [3]. Such failures, especially in ceiling-level fires, may not be immediately visible, thereby heightening risks to firefighters [2,3].
The previous studies on sandwich panels under fire exposure have mainly addressed heat transfer, fire resistance, and thermal bowing behavior [4]. Thermal bowing, caused by temperature differentials between panel faces, introduces additional curvature and nonlinear effects that amplify deformation. Other works investigated buckling and nonlinear responses under combined thermal and mechanical loading, with an emphasis on degradation of core stiffness at elevated temperatures [5]. While these studies advanced the understanding of the fundamental mechanisms, their predictive capacity remains limited. Most rely on finite element modeling (FEM) or empirical correlations [6]. FEM, although widely used, requires extensive calibration of temperature-dependent core properties, suffers from mesh sensitivity, and is computationally expensive when nonlinearities and debonding are considered [7]. This reduces its practicality for real-time assessment of structural behavior during a fire.
Moreover, fire-induced deformation mechanisms are highly complex. In addition to bending, transverse shear deformation becomes significant as the core loses integrity [8,9]. Classical plate theories (e.g., Reissner’s model [8]) emphasize shear effects in thick or compliant-core panels. Once adhesive debonding or thermal degradation occurs, local shear-driven failures may dominate global deformation [3]. Traditional approaches, which typically reduce fire response to average temperature effects, often overlook such heterogeneous damage evolution, creating a gap between theoretical predictions and experimental observations [2,3].
To overcome these limitations, artificial intelligence (AI) and machine learning (ML) have emerged as efficient alternatives for modeling complex physical phenomena [6]. Unlike numerical simulations, ML models identify relationships directly from data, enabling fast and accurate generalization. For instance, U-Net-based convolutional neural networks (CNNs) predicted stress fields about 500 times faster than FEM with comparable accuracy [10]. Other ML models have been applied successfully to classification, fracture prediction, and lifetime estimation of composites [1]. In fire engineering, ML has achieved prediction accuracies of up to 99.9% for the fire-resistance time of steel beams, presenting a cost-effective complement to standard testing [7]. These advances highlight ML’s potential to accelerate computation and provide reliable alternatives to experimental or regulatory procedures.
Nevertheless, the application of ML to fire-induced deformation of sandwich panels has received limited attention. Recent works have demonstrated the potential of ML for predicting the mechanical response of sandwich structures: Sheini Dashtgoli et al. [11] compared GRNN, ELM, and SVR models for bio-based sandwich composites under quasi-static loading, and Sahib and Kovács [12] developed an ANN framework validated against FEM and experiments to capture the bending behavior of composite sandwich structures. These studies highlight the growing role of ML in modeling complex sandwich panel responses. However, fire exposure involves strongly localized spatio-temporal degradation, requiring models that capture both spatial thermal gradients and temporal evolution. CNN architectures are promising for processing multi-sensor thermal data, while recurrent networks such as long short-term memory (LSTM) models can incorporate sequential dependencies. A comparative evaluation of these architectures can clarify their ability to capture the coupled dynamics of fire scenarios.
In this study, we develop a deep learning regression framework to predict the mid-span vertical deflection of glass wool-cored sandwich roof panels subjected to fire. The approach is based on the insight that local damage, including shear deformation, can be inferred from unexposed-surface temperature patterns. Nine input features are used: seven unexposed-surface temperatures (CH1–CH7), elapsed time, and panel orientation. Three architectures are compared: multilayer perceptron (MLP), LSTM, and one-dimensional CNN. The performance was validated through 5-fold cross-validation and an independent test set. The CNN achieved the best accuracy (), effectively capturing spatial and temporal effects, consistent with physical mechanisms where localized gradients and time-dependent progression dominate over average temperature effects.
The significance of this study is that it provides a unique large-scale experimental dataset from 39 ISO 834-5 full-scale fire-resistance tests and shows, through a comparative evaluation of CNN, MLP, and LSTM, that data-driven models can predict fire-induced deformation with reasonable accuracy. In particular, CNN was found to be not only statistically superior but also physically consistent with shear-dominated thermo-mechanical mechanisms. These results strengthen confidence in applying machine learning approaches to the fire safety assessment of sandwich roof panels.
2. Methodology
The experimental data were obtained from a total of 39 fire-resistance tests conducted in accordance with ISO 834-5 Fire-Resistance Tests—Elements of Building Construction: Specific Requirements for Loadbearing Horizontal Separating Elements [13]. The specimens measured 3000 mm in width and 4700 mm in length. To replicate the actual installation conditions, H-beams with a cross-section of 100 mm × 100 mm and a length of 4700 mm were positioned along the edges of the roof panels, and four C-beams were employed to form the purlins. The installed roof panel system is shown in Figure 1. The specimens were simply supported on a horizontal furnace with internal dimensions of 3000 mm × 4000 mm, with each end resting 350 mm on the furnace edge. For temperature monitoring, thermocouples were attached at seven locations on the unexposed surface. In addition, a dial gauge was installed at the center to measure deflection. All sensors complied with the specifications of ISO 834-5, and the data acquisition interval was set to one minute.
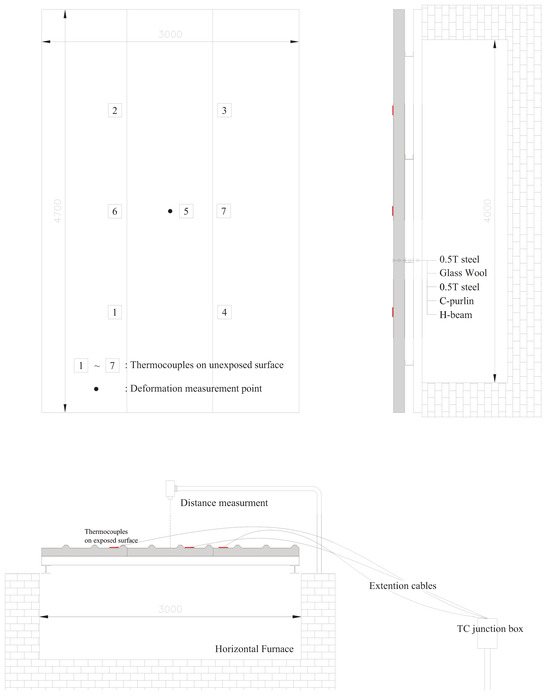
Figure 1.
Experimental setup showing the arrangement of sandwich panels, deformation measurement location, and supporting members.
The specifications of the 39 tested specimens are summarized in Table 1. The core material was identical for all specimens, consisting of glass wool. Other common specifications were described previously, while Table 1 categorizes the specimens according to core thickness, core density, sheet thickness, panel thickness, and panel orientation. The information presented in the table can also be visually confirmed in Figure 2 and Figure 3. As illustrated in Figure 3, panel orientation was classified into roof-type and deck-type. Roof-type refers to panels with ridges on the upper (unexposed) surface, whereas deck-type refers to panels with ridges on the lower (exposed) surface. The classification of panel orientation was necessary because previous studies have demonstrated that roof-type exhibits significantly higher load-bearing capacity compared with deck-type. Although those earlier studies investigated residual strength after fire exposure, while the present study focuses on load-bearing performance under thermal loading during fire, the distinction of this feature was also considered essential in this research.

Table 1.
Panel configuration summary. Test set specimens ( 1, 8, 16, 22, 28, and 36) are highlighted in bold.
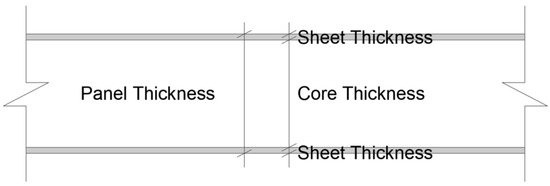
Figure 2.
Panel configuration.

Figure 3.
Panel orientation: (a) roof-type; (b) deck-type.
As illustrated in Figure 4, a total of 39 full-scale fire-resistance tests were conducted in-house in accordance with the ISO 834-5 standard [13]. Each test was performed for a duration of up to 30 or 60 min, during which measurements were recorded at one-minute intervals, resulting in the collection of a substantial dataset comprising 1519 data points.
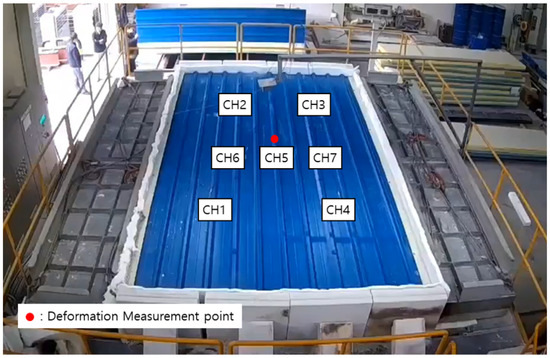
Figure 4.
Panel configuration.
The dataset was partitioned for model development and evaluation. A training dataset was composed of 1294 entries from 33 of the tests, which were used for model training and validated via 5-fold cross-validation. An independent untouched external test set was created using the remaining 225 data entries from 6 tests. This division resulted in a training-to-validation ratio of approximately 0.85 to 0.15, ensuring the assessment of the model’s generalization capabilities under identical laboratory conditions.
2.1. Feature Selection
Feature selection was performed to reduce redundancy, mitigate the risk of overfitting, and retain only the most relevant predictors of fire-induced deformation. The experimental dataset initially contained 15 candidate features: core thickness, core density, sheet thickness, panel thickness, panel orientation, elapsed time, seven unexposed-surface temperatures (CH1–CH7), and average temperature. From these, a total of 9 input features were ultimately selected.
As illustrated in Figure 5, correlation analysis revealed that deformation exhibited strong correlations with time- and temperature-related variables (CH1–CH7, average temperature), while geometric variables such as core thickness, core density, and panel thickness showed relatively weak direct correlations. More importantly, the influence of these geometric properties was already indirectly reflected in the unexposed-surface temperature responses (CH1–CH7). In other words, the temperature measurements inherently capture the effects of material composition and heat transfer characteristics. Including geometric variables in addition to the temperature responses would therefore increase redundancy and potentially exacerbate overfitting without improving predictive performance.
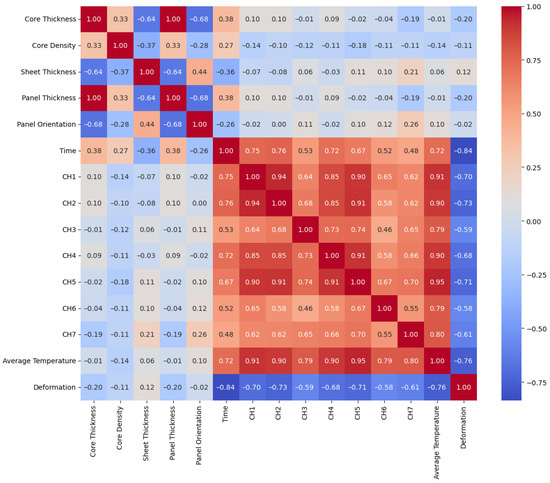
Figure 5.
Pearson correlation heatmap.
For the same reason, the average temperature was also excluded. Although it exhibited high correlation with deformation, it is simply a linear aggregation of CH1–CH7, providing no additional independent information. Moreover, using the average value can obscure local thermal gradients, which are critical drivers of thermal bowing and shear deformation. Since the deep learning models are able to infer average trends directly from CH1–CH7, including the explicit average temperature feature would only increase redundancy and the risk of overfitting.
Based on these considerations, nine final input features were selected: elapsed time, panel orientation, and the seven unexposed-surface temperatures (CH1–CH7). All features were normalized to the range [0, 1] using Min–Max scaling. For deep learning models, the normalized features were transformed into tensor structures suitable for convolutional processing.
2.2. Model Architectures
We compared three deep learning architectures summarized in Table 2. All models were trained to regress the mid-span deformation () from the nine selected inputs.

Table 2.
Simplified comparison of the three deep learning models.
2.2.1. CNN
For CNN, the nine inputs were treated as a one-dimensional sequence of length 9 with a single channel (shape ). Three convolutional stages extracted local patterns along this ordered feature sequence:
- –BatchNorm–LeakyReLU;
- –BatchNorm–LeakyReLU;
- –BatchNorm–LeakyReLU;
- GlobalAveragePooling1D;
- –ReLU–Dropout (0.30);
- (linear output).
2.2.2. MLP
The multilayer perceptron operated on the 9-dimensional input vector. The baseline consisted of three fully connected hidden layers with LeakyReLU activations, batch normalization, and dropout:
- –BN–LeakyReLU–Dropout (0.30);
- –BN–LeakyReLU–Dropout (0.30);
- –BN–LeakyReLU–Dropout (0.20);
- (linear output).
An kernel regularizer () was used in the first layer, consistent with the training script.
2.2.3. LSTM
To test a recurrent alternative, we reshaped the input to a short sequence of length 9 with one channel and used
- –Dropout (0.30);
- –ReLU;
- (linear output).
Although the sequence length corresponds to the feature count (rather than a long time window), this configuration allows LSTM to model ordered interactions among inputs.
2.3. Training Strategy
All models were trained to predict the mid-span deflection using the nine input features. Prior to training, both input features and target values were scaled to the range by Min–Max normalization. For each fold in the cross-validation procedure, normalization parameters were estimated using the training split and subsequently applied to the validation and test splits. Predictions were then inverse-transformed to restore the original scale of the response variable for error metric computation.
The optimization was performed with the Adam optimizer using mean squared error (MSE) as the loss function. To mitigate overfitting, several regularization strategies were employed: batch normalization (when applicable), dropout with a rate between 0.2 and 0.3, and weight decay where specified. The training process adopted an early stopping strategy with a patience of 20 epochs, restoring the best weights observed on the validation set. Additionally, learning rate reduction on plateau (reduction factor = 0.5; patience = 10 epochs) was applied to facilitate stable convergence.
Model performance was evaluated with 5-fold cross-validation using three representative regression metrics: the coefficient of determination (), mean absolute error (MAE), and root mean square error (RMSE). Finally, after cross-validation, each model was retrained on the full training set and externally tested to confirm generalization capability.
Batch sizes of 32–64 (chosen by validation) and up to 200–300 epochs were used with early stopping and LR scheduling, as described above. For each fold, scalers were fit on the training portion only; metrics were computed on inverse-scaled predictions. After cross-validation, a final model was trained on the full training set and evaluated on the held-out external test set to report , MAE, and RMSE. Full layer configurations and hyperparameters are provided in Table 3, while the end-to-end training and evaluation workflow is illustrated in Figure 6.

Table 3.
Hyperparameters and layer layouts for each model.
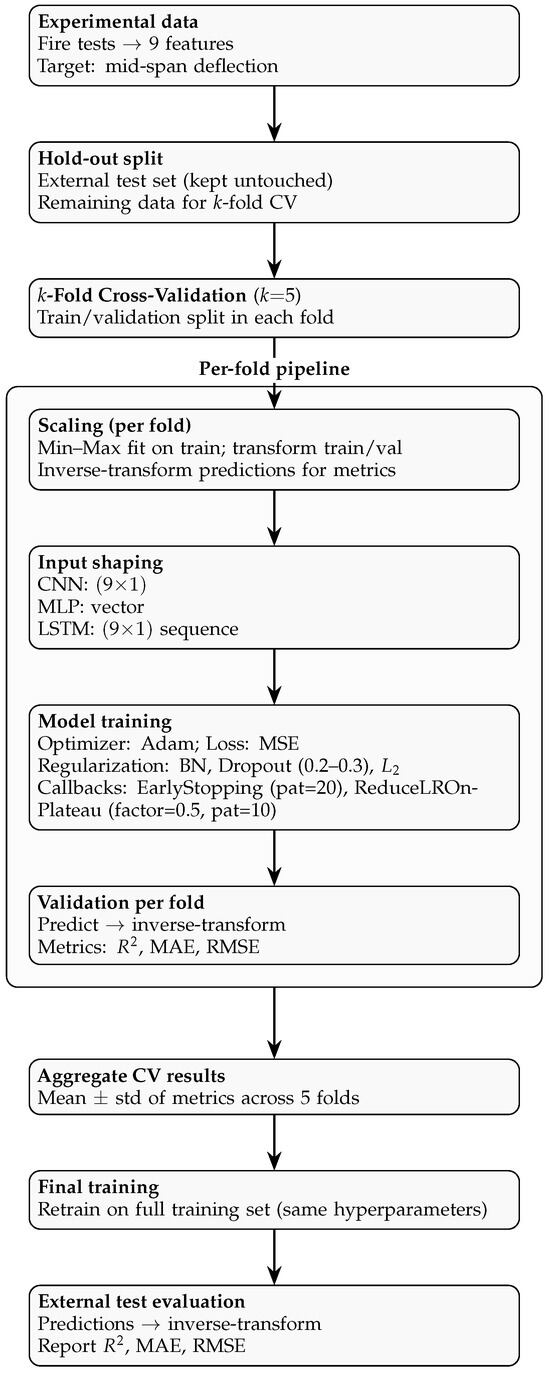
Figure 6.
Training strategy pipeline: external hold-out, 5-fold CV with per-fold scaling → input shaping → model training → validation, metric aggregation, final training, and external test evaluation.
3. Results
3.1. Cross-Validation Results
As presented in Table 4, the predictive performance of the three deep learning models (CNN, MLP, and LSTM) was quantitatively assessed using , MAE, and RMSE across 5-fold cross-validation. The CNN consistently outperformed the other models, achieving an average of 0.91, MAE of 4.40 mm, and RMSE of 6.42 mm. In contrast, MLP and LSTM obtained lower predictive accuracy, with average values of 0.84 and 0.70, and larger errors (MAE = 5.91 mm, RMSE = 8.48 mm for MLP; MAE = 8.41 mm, RMSE = 12.04 mm for LSTM). These differences demonstrate the superior accuracy and robustness of CNN in capturing the nonlinear relationships between fire test features and mid-span deflection.

Table 4.
Performance comparison of CNN, MLP, and LSTM across 5-fold cross-validation. Metrics are reported as , MAE, and RMSE (rounded to two decimals).
As illustrated in Figure 7, the distribution of performance across folds further highlights this trend. CNN not only achieved the highest median values but also exhibited the narrowest interquartile range, indicating stable learning and reduced variance across different data splits. Conversely, MLP and LSTM displayed greater variability, with broader box plots for both MAE and RMSE, reflecting less reliable generalization. Taken together, these results confirm that CNN provides both higher predictive accuracy and more stable generalization compared to the other architectures.

Figure 7.
Cross-validation performance comparison of CNN, MLP, and LSTM using , MAE, and RMSE as the metrics. The box plots show the distribution of performance across K-fold cross-validation, where higher values and lower MAE and RMSE values indicate superior performance. The CNN model demonstrates both higher median values and smaller variance for while showing lower median values and smaller variance for MAE and RMSE compared to the other models.
3.2. Prediction–Observation Comparison
As shown in Table 4, CNN achieved the highest overall accuracy, with average cross-validation values exceeding 0.90, and it maintained strong generalization capability on the independent test set (). In contrast, MLP achieved moderate accuracy (), while LSTM produced relatively poor results (). These results suggest that CNN was the most effective model for capturing the nonlinear fire-induced deformation patterns of sandwich roof panels.
Figure 8 directly compares the predicted and observed mid-span deflections. The CNN predictions align closely with the 1:1 reference line across both small and large deformation ranges, with most residuals lying within ±10 mm. By contrast, MLP and LSTM exhibited greater scatter, particularly at larger deformation magnitudes, where the prediction errors often exceeded ±20 mm. This indicates that CNN better captured not only the overall magnitude but also the nonlinear growth trends of deformation under fire exposure.
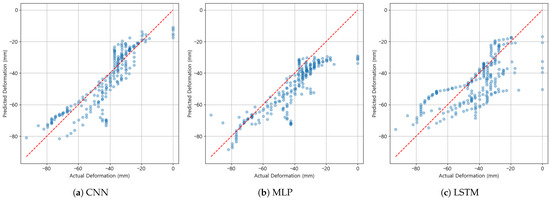
Figure 8.
Predicted vs. observed mid-span deflection for CNN, MLP, and LSTM models. The red dashed line represents the 1:1 reference line.
In addition, Figure 9 presents the time-history of predicted versus observed deflections for representative fire tests. CNN reproduced both the global deformation trends and the sharp local changes over time, faithfully tracking the peak magnitudes and slopes. In contrast, the MLP predictions systematically lagged behind during rapid deformation phases, whereas LSTM consistently underestimated the overall deformation magnitudes, failing to follow steep gradients. These discrepancies highlight the superior dynamic tracking ability of CNN in sequential prediction tasks.

Figure 9.
Time-history of observed (solid) vs. predicted (dashed) deflection.
The residual error analysis, shown in Figure 10, further supports these findings. The CNN residuals were narrowly distributed around zero (mostly within ±20 mm), indicating low bias and variance. The MLP residuals revealed a systematic positive bias, implying consistent underestimation, while the LSTM residuals exhibited a wider spread with negative skewness, reflecting overestimation tendencies. This comparative residual behavior underscores the structural limitations of MLP and LSTM in modeling nonlinear thermo-mechanical responses.

Figure 10.
Residual error distributions for CNN, MLP, and LSTM models. CNN shows the narrowest spread centered around zero.
Taken together, the cross-validation metrics, prediction–observation alignment, time-series dynamics, and residual error distributions consistently demonstrate that CNN provides the most accurate and stable framework for predicting fire-induced mid-span deflections of sandwich roof panels.
Table 5 presents the numerical prediction results of deformation obtained from the three deep learning models for the independent test dataset, together with the corresponding input features. Although the raw data were collected at one-minute intervals, representative values are reported at ten-minute intervals in the table for clarity and readability. Specimen 1, designed for a 60 min fire resistance rating, was terminated at 47 min due to unexpected flame occurrence that could not be detected by CH1–CH7 sensors. Similarly, Specimens 16 and 22, both designed for a 30 min fire resistance rating, were interrupted at 26 min because of a rapid temperature rise observed at CH7. In contrast, Specimen 8 (60 min rating) and Specimens 28 and 36 (30 min rating) successfully completed their tests for the full intended duration without premature termination. These results show that the independent test dataset included both prematurely terminated and fully completed fire tests, providing diverse scenarios for model evaluation. It is also notable that CH7 consistently exhibited the steepest temperature increases in the prematurely terminated cases, highlighting its strong influence on deformation progression.

Table 5.
Comparison of actual and predicted deformation for the test specimens.
The quantitative performance evaluation of these predictions is summarized in Table 6. Using , MAE, and RMSE as metrics, the CNN demonstrated the best overall performance (, MAE = 6.52 mm, and RMSE = 8.62 mm), clearly outperforming both the MLP (, MAE = 8.60 mm, and RMSE = 11.27 mm) and LSTM (, MAE = 11.27 mm, and RMSE = 13.27 mm) models. In particular, the CNN consistently showed lower MAE and RMSE values, indicating not only higher accuracy but also greater stability across the test dataset.

Table 6.
Performance metrics (, MAE, and RMSE) of CNN, MLP, and LSTM for each test block and the overall test dataset.
At the specimen level, CNN consistently outperformed or at least matched the other models in most cases. For example, in Specimen 22, the CNN achieved an value of 0.91, which was higher than the 0.82 recorded by both the MLP and LSTM models. Similarly, in Specimens 16 and 36, CNN also showed higher coefficients of determination than the other models. These specimens correspond to tests in which CH7 recorded relatively steep temperature rises and that were terminated earlier than the nominal fire resistance duration, yet CNN maintained comparatively better agreement with the observed deformation.
On the other hand, negative values were observed in some specimens (e.g., Specimen 1 and Specimen 36). Such cases were associated with premature termination of the tests or abnormal conditions such as flame occurrences that were not detected by CH1–CH7 sensors. In these situations, the reduced amount of data and irregular progression of deformation made accurate regression more difficult for all the models. Nevertheless, when the overall dataset is considered, CNN provided the most accurate and stable predictions among the three architectures.
4. Discussion
The results presented in Section 3 demonstrate that, among the three deep learning models considered, CNN consistently outperformed both MLP and LSTM in predicting fire-induced deformation of sandwich roof panels. In this section, we provide a detailed discussion of the physical and methodological reasons underlying these outcomes, their implications for structural fire safety assessment, and the potential limitations of the current study.
4.1. Physical Consistency of CNN Predictions
The superior performance of CNN is physically consistent with the deformation mechanisms of sandwich panels under fire (Figure 11). Panel deflection is governed not only by the average unexposed-surface temperature but also by localized thermal gradients and their temporal progression. As the temperature increases, differential thermal expansion between steel facings and degradation of the insulating core lead to combined bending and transverse shear deformation [3,5]. Classical theoretical frameworks, including Timoshenko’s shear deformation plate theory [14] and Plantema’s comprehensive analysis of sandwich construction [15], emphasize that transverse shear becomes dominant as the core softens at elevated temperatures.
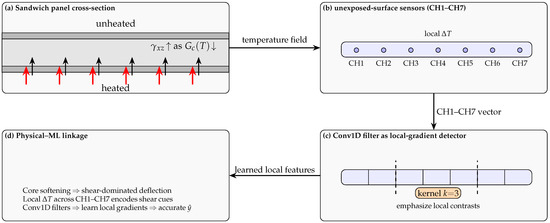
Figure 11.
Physical–ML analogy: (a) fire-side heating from the bottom softens the core and increases shear strain (); (b) unexposed-surface sensors (CH1–CH7) capture local temperature gradients; (c) Conv1D kernels (e.g., ) emphasize local contrasts; (d) learned local gradients explain CNN accuracy.
Importantly, as the core shear modulus decreases with temperature, transverse shear strains begin to dominate the overall deflection response. Convolutional filters, by emphasizing local contrasts among adjacent sensor channels (CH1–CH7), can emulate this shear-sensitive mechanism, as schematically illustrated in Figure 11, where kernels act as local-gradient detectors across the temperature field. This physical analogy explains CNN’s superior ability to reproduce both the deformation magnitude and the evolution of curvature under fire exposure.
This physical consistency is also supported by the quantitative results in Table 6. In particular, Specimens 16, 22, and 36, all of which experienced abrupt temperature rises at CH7, showed higher values for CNN compared to MLP and LSTM. For instance, in Specimen 22, the CNN approach achieved an of 0.91 with an RMSE of only 4.92 mm, whereas LSTM yielded an RMSE as high as 21.84 mm under the same condition. These results confirm that the CNN predictions were more consistent with deformation responses governed by localized thermal gradients. By contrast, the MLP approach tended to smooth out such localized effects due to its global learning strategy, while LSTM focused on sequential dependencies that did not align with abrupt shear-driven responses, leading both models to produce larger residual errors.
4.2. Comparison with MLP and LSTM
The moderate performance of MLP is consistent with its global learning strategy, which is less sensitive to localized variations in the input temperature fields (Table 2). As a result, the MLP tended to smooth out abrupt gradients, leading to underestimation of deformation during periods of rapid growth and larger residuals at peak stages.
LSTM, designed to capture long-term sequential dependencies, also underperformed in this study. Although panel deformation increases monotonically with time, its instantaneous rate is governed by abrupt phases of core degradation and adhesive debonding [3,5] rather than by gradual long-range memory effects. This explains why LSTM produced scattered results in the independent test set; for example, in Specimen 22, where CH7 exhibited a sudden temperature rise, the LSTM model yielded an RMSE of mm, far larger than CNN’s mm under the same condition (Table 6). Similar observations have been reported in recent ML studies on sandwich structures [11,12], where models emphasizing local feature sensitivity were found to outperform those focused on global or sequential trends.
It is also noteworthy that, despite their lower overall performance, MLP and LSTM occasionally provided final deformation values closer to the experimental observations than CNN. For instance, in Specimen 1, the LSTM prediction (−68.4 mm) was nearer to the measured value (−42.4 mm) than CNN (−72.7 mm) or MLP (−81.1 mm). Similar tendencies appeared in Specimens 8 and 16, and in Specimen 22 both CNN and LSTM produced nearly identical terminal predictions (−72.2 mm and −72.3 mm, respectively). These cases suggest that, while CNN is superior in reproducing the full deformation trajectory and minimizing residuals, other models may occasionally align more closely with terminal magnitudes. Further research with broader datasets is needed to determine whether this reflects intrinsic model behavior or dataset-specific characteristics.
4.3. Advantages over Conventional Approaches
Traditional methods such as finite element modeling (FEM) require detailed characterization of temperature-dependent core and adhesive properties, and they are computationally expensive under nonlinear and debonding conditions [4,9]. By contrast, CNN provided predictions with negligible computation time once trained and achieved a test-set of 0.76, demonstrating practical potential for near real-time structural integrity assessment. This suggests that CNN-based models can serve as efficient surrogates to supplement experimental testing and reduce reliance on computationally expensive FEM simulations. Such data-driven approaches also offer scalability for rapid fire safety evaluations in real buildings, particularly when integrated with distributed temperature sensing systems.
Notably, reliance on average temperature obscures local gradients, which are the true drivers of thermal bowing and shear-induced instability. The superior CNN performance underscores that fire-induced deflection is not a simple function of mean temperature but of differential heating across the panel width, directly captured by the CH1–CH7 sensor distribution that encodes localized thermal gradients.
4.4. Implications for Fire Safety
The ability to predict panel deformation in near real time has important implications for fire safety. Roof panel collapse in large-span industrial facilities poses significant hazards to occupants and firefighters, especially because such failures may occur suddenly and without visible warning. A CNN-based predictive model, driven by unexposed-surface sensor data, could provide early warnings of impending collapse, thereby improving evacuation strategies and firefighter safety.
It is important to note that unexposed-surface temperatures can be reasonably predicted using heat transfer models or FEM, whereas deformation is far more difficult to estimate due to the combined influence of core softening, transverse shear, adhesive debonding, and orientation effects. Figure 1 highlights the furnace configuration and sensor layout that enable such deformation predictions, directly supporting the physical rationale for CNN’s superior performance. As summarized in Table 2, CNN is more sensitive to localized gradients than MLP or LSTM, which explains its ability to capture sudden deformation increments associated with shear-dominated responses. Similar observations have been reported in recent ML studies on sandwich structures [11,12], confirming the importance of local feature sensitivity for structural fire prediction.
The orientation effect (roof vs. deck) further supports the physical validity of the CNN framework. Roof-type panels, with ridges on the unexposed face, distribute thermal bowing more effectively and delay local shear concentration, consistent with previous residual-strength studies [2]. The CNN model captured these orientation-dependent patterns more reliably than MLP or LSTM, underscoring its suitability for integration into real-time structural fire safety monitoring systems.
Taken together, this study—based on 39 ISO 834-5 full-scale fire tests and a comparative evaluation of CNN, MLP, and LSTM—demonstrates both the empirical feasibility and physical validity of applying ML approaches to structural fire safety assessment. The framework can be extended to include variations in panel thickness, joint configuration, and core type, offering broad applicability for fire safety design and monitoring.
4.5. Limitations and Future Work
Despite the promising results, this study has several limitations that suggest directions for future research.
First, the current model was developed and validated only for glass wool-cored panels under ISO 834-5 furnace conditions, which limits its generalizability to other materials and fire scenarios. Future work should extend the framework to include polyurethane, PIR, and other core materials with distinct fire behaviors [3], as well as validation under full-scale or natural fire exposures.
Second, while the CNN approach effectively captured spatial patterns in temperature fields, it did not explicitly model the temporal evolution of deformation. This limits its ability to reproduce abrupt dynamic changes in real fire scenarios. Hybrid architectures such as ConvLSTM or transformer-based models could overcome this limitation by combining convolutional spatial processing with temporal sequence learning.
Third, the dataset size and diversity remain limited. Although an independent test set was employed, the relatively small number of specimens and scenarios constrains the robustness of the conclusions. Future studies should incorporate larger datasets covering different panel geometries, joint configurations, and boundary conditions to improve generalizability.
Finally, the interpretability of CNN predictions remains a challenge as the model behaves largely as a black box. This may hinder trust and adoption in practical fire safety engineering. Future research should apply explainable AI techniques such as saliency mapping or SHAP analysis to clarify which sensor inputs drive predictions and to enhance transparency for end-users in fire safety applications.
5. Conclusions
This study developed and evaluated deep learning models for predicting the mid-span vertical deflection of glass wool sandwich roof panels subjected to fire by using unexposed-surface temperature distributions and structural parameters as inputs. Three architectures—CNN, MLP, and LSTM—were compared through 5-fold cross-validation and an independent test set. The following key conclusions can be drawn:
- CNN achieved the best performance among the three models, with the cross-validation values exceeding 0.90 and a test-set of 0.76 (Table 6). Its ability to learn localized spatial patterns from multi-sensor temperature data yielded robust predictions of fire-induced deformation.
- MLP attained moderate accuracy, whereas LSTM showed the weakest overall performance. These results suggest that instantaneous spatial temperature distributions influence the deformation response more strongly than long-term sequential dependencies, which helps to explain the advantage of CNN’s local filtering over LSTM’s memory mechanism.
- The superior CNN performance is consistent with the known physical mechanisms of sandwich panels under fire. As the core shear modulus decreases with temperature, transverse shear effects become more important; convolutional filters can act as local-gradient detectors across CH1–CH7, aligning with this shear-sensitive behavior. In addition, relying on mean temperature alone can obscure critical local gradients, supporting the view that deflection is governed by differential heating across the panel rather than by global averages.
- Panel orientation (roof vs. deck) emerged as a meaningful predictor. Roof-type panels, with ridges on the unexposed face, showed delayed shear concentration and improved deformation resistance; the CNN model captured these orientation-dependent patterns in a manner consistent with prior residual-strength studies [2].
- Compared with conventional FEM or empirical correlations, the proposed CNN-based approach provides a computationally efficient data-driven alternative: once trained, it enables near real-time prediction of structural integrity during fire exposure. Such models are promising for integration with sensor networks as early warning systems, supporting resilience-based fire safety design in industrial and commercial buildings.
Overall, the findings indicate that convolutional neural networks offer a powerful framework for predicting the complex thermo-mechanical responses of sandwich roof panels in fire. Importantly, this study is distinguished by the use of a unique large-scale dataset derived from 39 ISO 834-5 full-scale fire-resistance tests. These elements strengthen both the empirical foundation and practical relevance of the proposed deep learning framework for future fire-safety engineering applications.
Author Contributions
Conceptualization, B.L. and M.K.; methodology, B.L.; software, B.L.; validation, B.L. and M.K.; formal analysis, B.L.; investigation, B.L.; resources, M.K.; data curation, B.L.; writing—original draft preparation, B.L.; writing—review and editing, M.K.; visualization, B.L.; supervision, M.K.; project administration, M.K.; funding acquisition, M.K. All authors have read and agreed to the published version of the manuscript.
Funding
This work was supported by Chungbuk National University NUDP program (2025).
Data Availability Statement
The experimental data supporting the findings of this study are available from the first author (B.L.) upon reasonable request.
Acknowledgments
The authors gratefully acknowledge SY Panel and Younghwa Panel for their valuable support in manufacturing the test specimens required for the experiments conducted in this study.
Conflicts of Interest
The authors declare no conflicts of interest.
References
- Sheth, V.; Tripathi, U.; Sharma, A. A Comparative Analysis of Machine Learning Algorithms for Classification Purpose. Procedia Comput. Sci. 2022, 215, 422–431. [Google Scholar] [CrossRef]
- Lim, B.; Seo, H.; Lee, J.; Jung, D.; Lee, H.; Kim, M. Analysis of Post-Fire Residual Strength of Sandwich Panels Based on Core Type and Sectional Shape. Int. J. Sustain. Build. Technol. Urban Dev. 2025, 16, 58–69. [Google Scholar]
- Cooke, G.M. Stability of Lightweight Structural Sandwich Panels Exposed to Fire. Fire Mater. 2004, 28, 299–308. [Google Scholar] [CrossRef]
- Pozo-Lora, F.; Maguire, M. Thermal Bowing of Concrete Sandwich Panels with Flexible Shear Connectors. J. Build. Eng. 2020, 29, 101124. [Google Scholar] [CrossRef]
- Frostig, Y.; Thomsen, O. Buckling and Nonlinear Response of Sandwich Panels with a Compliant Core and Temperature-Dependent Mechanical Properties. J. Mech. Mater. Struct. 2007, 2, 1355–1380. [Google Scholar] [CrossRef]
- Maurizi, M.; Gao, C.; Berto, F. Predicting Stress, Strain and Deformation Fields in Materials and Structures with Graph Neural Networks. Sci. Rep. 2022, 12, 21834. [Google Scholar] [CrossRef] [PubMed]
- Džolev, I.; Kekez-Baran, S.; Rašeta, A. Fire Resistance of Steel Beams with Intumescent Coating Exposed to Fire Using ANSYS and Machine Learning. Buildings 2025, 15, 2334. [Google Scholar] [CrossRef]
- Reissner, E. On Bending of Elastic Plates. Q. Appl. Math. 1947, 5, 55–68. [Google Scholar] [CrossRef]
- Yuan, W.; Wang, X.; Song, H.; Huang, C. A Theoretical Analysis on the Thermal Buckling Behavior of Fully Clamped Sandwich Panels with Truss Cores. J. Therm. Stress. 2014, 37, 1433–1448. [Google Scholar] [CrossRef]
- Khorrami, M.S.; Mianroodi, J.R.; Siboni, N.H.; Goyal, P.; Svendsen, B.; Benner, P.; Raabe, D. An Artificial Neural Network for Surrogate Modeling of Stress Fields in Viscoplastic Polycrystalline Materials. npj Comput. Mater. 2023, 9, 37. [Google Scholar] [CrossRef]
- Sheini Dashtgoli, D.; Taghizadeh, S.; Macconi, L.; Concli, F. Comparative Analysis of Machine Learning Models for Predicting the Mechanical Behavior of Bio-Based Cellular Composite Sandwich Structures. Materials 2024, 17, 3493. [Google Scholar] [CrossRef] [PubMed]
- Sahib, M.M.; Kovács, G. Using Artificial Neural Networks to Predict the Bending Behavior of Composite Sandwich Structures. Polymers 2025, 17, 337. [Google Scholar] [CrossRef] [PubMed]
- ISO 834-5:2000; Fire Resistance Tests—Elements of Building Construction Part 5: Specific Requirements for Loadbearing Horizontal Separating Elements. International Organization for Standardization: Geneve, Switzerland, 2000.
- Timoshenko, S. On the correction for shear of the differential equation for transverse vibrations of prismatic bars. Philos. Mag. 1921, 41, 744–746. [Google Scholar] [CrossRef]
- Plantema, F.J. Sandwich Construction: The Bending and Buckling of Sandwich Beams, Plates and Shells; John Wiley & Sons: New York, NY, USA, 1966. [Google Scholar]
Disclaimer/Publisher’s Note: The statements, opinions and data contained in all publications are solely those of the individual author(s) and contributor(s) and not of MDPI and/or the editor(s). MDPI and/or the editor(s) disclaim responsibility for any injury to people or property resulting from any ideas, methods, instructions or products referred to in the content. |
© 2025 by the authors. Licensee MDPI, Basel, Switzerland. This article is an open access article distributed under the terms and conditions of the Creative Commons Attribution (CC BY) license (https://creativecommons.org/licenses/by/4.0/).