Article

Evaluating and Predicting Wildfire Burn Severity Through Stand Structure and Seasonal NDVI: A Case Study of the March 2025 Uiseong Wildfire

National Institute of Ecology, Seochon-gun 33657, Republic of Korea
*
Author to whom correspondence should be addressed.
Fire 2025, 8(9), 363; https://doi.org/10.3390/fire8090363
Submission received: 23 July 2025 / Revised: 2 September 2025 / Accepted: 5 September 2025 / Published: 11 September 2025

Abstract

This study examined the structural and ecological drivers of burn severity during the March 2025 wildfire in Uiseong County, Republic of Korea, with a focus on developing a predictive framework using the differenced Normalized Burn Ratio (dNBR). Seventeen candidate variables were evaluated, among which the forest type, stand age, tree height, diameter at breast height (DBH), and Normalized Difference Vegetation Index (NDVI) were consistently identified as the most influential predictors. Burn severity increased across all forest types up to the 4th–5th age classes before declining in older stands. Coniferous forests exhibited the highest severity at the 5th age class (mean dNBR = 0.3069), followed by mixed forests (0.2771) and broadleaf forests (0.2194). Structural factors reinforced this pattern, as coniferous and mixed forests recorded maximum severity within the 5–11 m height range, while broadleaf forests showed relatively stable severity across 3–21 m but declined thereafter. In the final prediction model, NDVI emerged as the dominant variable, integrating canopy density, vegetation vigor, and moisture conditions. Notably, NDVI exhibited a positive correlation with burn severity in coniferous stands during this early-spring event, diverging from the generally negative relationship reported in previous studies. This seasonal anomaly underscores the need to interpret NDVI flexibly in relation to the forest type, stand age, and phenological stage. Overall, the model results demonstrate that mid-aged stands with moderate heights and dense canopy cover are the most fire-prone, whereas older, taller stands show reduced susceptibility. By integrating NDVI with structural attributes, this modeling approach provides a scalable tool for the spatial prediction of wildfire severity and supports resilience-based forest management under climate change.

1. Introduction

Wildfire activity is increasingly influenced by climate-induced changes in atmospheric and ecological conditions, leading to more frequent, intense, and spatially extensive fire events worldwide. Prolonged droughts, high wind speeds, and elevated temperatures act synergistically to escalate fire risk, particularly in landscapes with flammable vegetation and steep terrains. These conditions not only intensify direct threats to human and ecological systems but also contribute to large-scale greenhouse gas emissions, ecosystem degradation, and biodiversity loss [1,2,3].
Multiple recent studies show that climate change has already lengthened the wildfire season and increased the wildfire frequency and burned area through warmer springs, longer summer dry seasons, and drier soils [4,5]. Research also demonstrates that the warmer and drier conditions associated with climate change have doubled the number of large fires in western North America and that a 1 °C increase in temperature could increase the burned area by up to 600% in some forest types [6,7,8,9]. Large and severe fires are associated with warm and dry conditions, which are projected to occur more often in a warming climate, leading to an increased frequency and extent of fires [10]. Globally, wildfires were estimated to generate approximately 2170 megatons of carbon emissions in 2023, highlighting the significant contribution of fires to atmospheric carbon [11,12].
In Korea, the frequency and scale of large spring wildfires have risen markedly in recent years. Damage patterns are shaped not only by extreme meteorological conditions but also by forest structural and ecological characteristics [13,14,15]. Fire propagation and severity are determined by the interplay of the vegetation type, canopy density, stand age, fuel moisture, and topographic exposure, underscoring the need for spatially explicit models that integrate diverse environmental variables to improve the predictions of wildfire impacts [16,17].
Remote sensing indicators, particularly the Normalized Difference Vegetation Index (NDVI), have been widely used to monitor vegetation vigor, density, and moisture availability [11,12,13,14,15,16,17,18,19,20]. However, the relationship between NDVI and burn severity—typically measured using the differenced Normalized Burn Ratio (dNBR)—is not consistent. Seasonal vegetation dynamics, the species composition, and the stand developmental stage can alter the direction and strength of the NDVI–dNBR relationship, yet these conditional dependencies remain insufficiently quantified in Korean forest contexts.
The March 2025 wildfire in Uiseong-gun, Gyeongsangbuk-do, which produced the most extensive wildfire damage on record in the Republic of Korea, provides a critical case study for addressing this gap. The event was driven by both extreme weather conditions and forest structural traits. During the fire, prevailing west-northwesterly winds averaged 3.5 m/s with gusts reaching 7–13 m/s, while the mean temperature was 6.4–14.2 °C above the climatological average. In total, the wildfire affected an area of approximately 1159 km2, highlighting its unprecedented scale and severity.
Accordingly, this study aims to evaluate the contributions of forest environmental variables—including the species composition, stand age, tree height, crown closure, and NDVI—to post-fire severity, as represented by the dNBR. A machine-learning–based modeling framework is employed to capture both the main effects and variable interactions and to test the robustness of the NDVI as a predictive feature under early-spring fire conditions.
We hypothesize that burn severity in Korean forests is strongly determined by structural attributes and vegetation indices. Specifically, severity is expected to peak in intermediate-aged stands due to high fuel continuity, while older, mature stands will exhibit reduced susceptibility. The NDVI is anticipated to be the most influential predictor, although its relationship with burn severity will vary across forest types and seasons—showing a positive correlation in evergreen conifers during early spring and a negative correlation in deciduous forests prior to leaf-out. Finally, by integrating the NDVI with forest structural and ecological variables, we expect that a machine-learning–based model will outperform approaches relying solely on meteorological or vegetation indices, thereby enhancing both the accuracy and spatial resolution of wildfire severity predictions.

2. Materials and Methods

Uiseong-gun is a mountainous region located in Gyeongsangbuk-do, Republic of Korea, characterized by a diverse forest landscape consisting of coniferous forests, broadleaf forests, mixed forests, and bamboo groves. The area affected by the wildfire in Uiseong-gun covered approximately 1159 km2. Among the vegetation types in the affected area, coniferous forests accounted for the largest proportion at 594.95 km2, followed by broadleaf forests (371.61 km2), mixed forests (161.48 km2), bamboo forests (0.176 km2), and non-forested areas and grasslands (31.04 km2). Within the coniferous forests, pine forests comprised approximately 80% of the area. The mixed forests consisted of both coniferous and broadleaf species, forming a transitional zone that reflects the structural and ecological complexity of the region. Figure 1 shows the study area and the wildfire perimeter.

2.1. Data

In this study, satellite imagery acquired before and after the wildfire was used to calculate the dNBR, an index that reflects changes in vegetation cover. To estimate forest fire damage, NDVI values derived from Sentinel-2 satellite imagery were employed. Forest resource survey data were utilized to classify forest types—such as coniferous forests, broadleaf forests, mixed forests, and bamboo forests—as well as stand attributes including the age class, diameter class, and tree height.
To estimate wildfire damage intensity based on the forest type, age class, diameter class, and species composition, we referred to the 2023 forest type map provided by the Korea Forest Service (2023).
The wildfire prediction model was developed to assess the extent of damage caused by the wildfire that occurred in Gyeongbuk Province on 21 March 2025. The dNBR was used as a quantitative measure of fire severity derived from satellite imagery captured before and after the event. The NBR was calculated using the reflectance characteristics of vegetation and burned areas, specifically utilizing near-infrared (NIR) and shortwave infrared (SWIR) bands, as shown in Equation (1). The dNBR was then computed as the difference between pre-fire and post-fire NBR values, as expressed in Equation (2).
N B R = N I R S W I R N I R + S W I R
d N B R = N B R p r e f i r e N B R p o s t f i r e
In addition, the dataset used for model development included the Forest Type Map (Korea Forest Service, 2023), elevation data, and Above Ground Mass data from 2021, which were utilized to construct the predictor variables. To delineate the spatial extent of the wildfire that occurred in Gyeongsangbuk-do on 21 March 2025, we employed real-time fire location data provided by NASA FIRMS (Fire Information for Resource Management System). FIRMS data from 14 March to 31 March 2025 were used in the analysis, and false-color composite imagery from Sentinel-2 (dated 31 March 2025) was additionally utilized to visualize the burned area following the fire event. A detailed list of the data sources and geospatial inputs used in this study is presented in Table 1.

2.2. Burn Severity Classification

The severity of wildfire damage was classified into four levels based on the dNBR, a widely used normalized burn index [10]. First, areas with dNBR values below 0.1 were categorized as ‘Unburned’, indicating little to no observable signs of fire damage. Areas with dNBR values between 0.1 and 0.27 were classified as ‘Low’ severity, typically reflecting minor canopy damage or light surface burns. Regions with dNBR values ranging from 0.27 to 0.44 were designated as ‘Moderate’ severity, suggesting substantial canopy loss and noticeable ecological disturbance caused by the fire. Lastly, areas with dNBR values above 0.44 were categorized as ‘High’ severity, representing the most intense level of wildfire damage, characterized by complete canopy destruction and the significant structural loss of vegetation.

2.3. XGBoost Methodology for Wildfire Burn Severity Prediction

Extreme Gradient Boosting (XGBoost) is a tree-based ensemble learning algorithm that has shown remarkable performance in classification and regression tasks. It was developed to improve the computational efficiency and generalization ability of the traditional Gradient Boosting Machine (GBM) [21]. In the field of fire risk prediction, XGBoost has been widely applied, demonstrating strong capability to model nonlinear relationships among meteorological, vegetation, and topographical variables [22].
The core of XGBoost lies in the regularized objective function, which balances model fit and complexity. The objective function is expressed as follows:
L ϕ = i = 1 n l y i , y i ^ + k = 1 K Ω f k
where l y i , y i ^ represents the loss function, f k is the k-th regression tree, and Ω f k is the regularization term that controls model complexity:
Ω f = γ T + 1 2 λ | w | 2
XGBoost leverages a second-order Taylor expansion to approximate the loss function. At iteration t , the objective can be written as follows:
L t i = 1 n g i f t x i + 1 2 h i f t x i 2 + Ω f t
Here, g i = y t 1 ^ l y i , y t 1 ^ is the first-order gradient, and h i = y t 1 ^ 2 l ! y i , y t 1 ^ is the second-order gradient (Hessian).
By incorporating both gradient and Hessian information, the method facilitates more robust and efficient model training.
The optimal weight for leaf j can be obtained as follows:
w j * = i I j g i i I j h i + λ
The split gain, which determines the quality of a split, is given by the following:
G a i n = 1 2 i I L g i 2 i I L h i + λ + i I R g i 2 i I R h i + λ i I g i 2 i I h i + λ γ
I L , I R : the sets of samples in the left and right leaves
γ : split regularization parameter

2.4. Independent Predictor Variables

To identify the key factors influencing burn severity (dNBR) in the wildfire-affected area of Uiseong County in March 2025, we developed a predictive model using 17 independent variables. These variables were selected based on a comprehensive review of prior studies [23,24,25,26,27], focusing on those most frequently cited as determinants of wildfire behavior and impact.
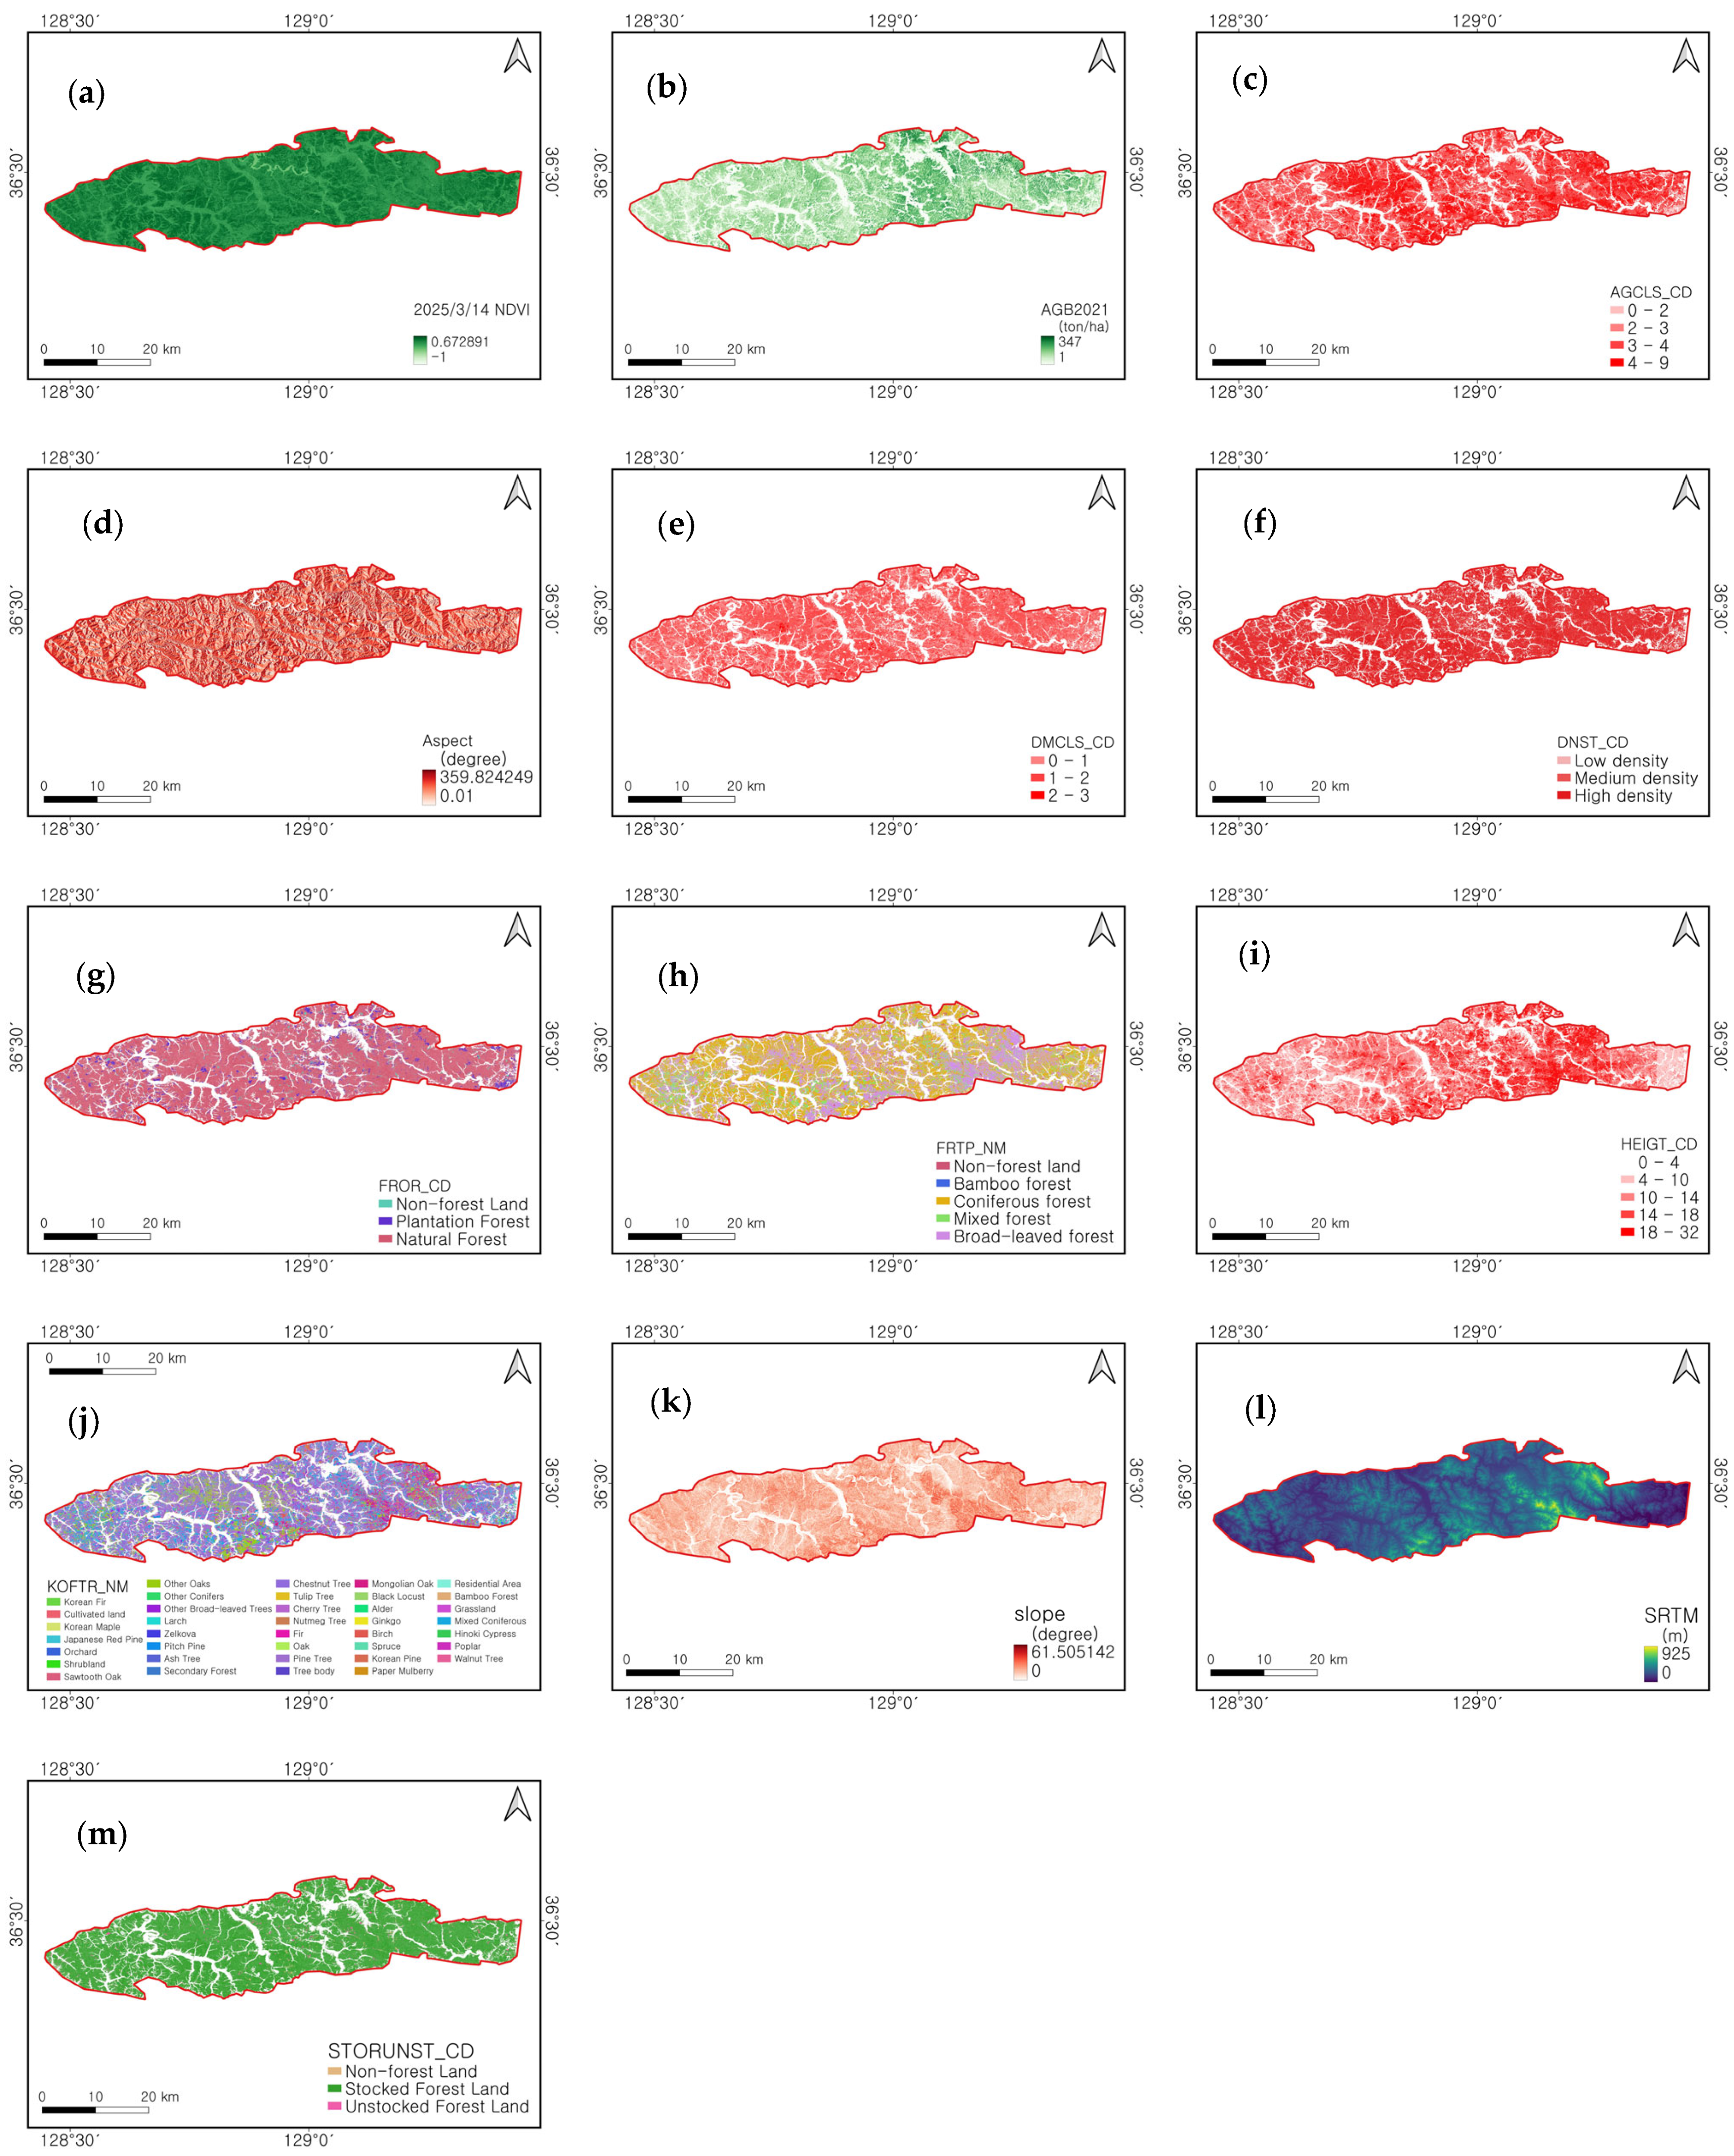
Table 1 and Figure 2 provide an overview of the 17 factors considered in developing the model. The predictor variables were categorized into five primary groups: (1) canopy structure, (2) topography, (3) growth and fuel characteristics, (4) landscape configuration, and (5) geographic position. These include the stand age, diameter class, tree height, forest type, NDVI, biomass, elevation, slope, aspect, patch area, perimeter length, and spatial coordinates (latitude and longitude). This classification system was designed to comprehensively capture the biophysical and structural properties of forest landscapes that directly or indirectly interact with wildfire dynamics.
Stand-level attributes such as the tree height, age class, and diameter class were particularly emphasized due to their relevance in representing vertical fuel continuity and accumulation. These variables are known to influence fire propagation and intensity, as denser and more connected canopies tend to facilitate crown fire spread. Additional categorical variables such as the forest type, dominant species, and density code were also included to reflect species-specific combustion traits and structural diversity.
Topographic features—elevation, slope, and aspect—were derived from a 30 m-resolution Digital Elevation Model (DEM). These terrain variables significantly influence microclimatic conditions such as the temperature, wind exposure, and fuel desiccation, thereby affecting the spatial heterogeneity of fire behavior. Landscape context variables, including the patch area and edge length, were used to represent forest fragmentation and exposure, which are important for assessing fire accessibility and spread potential.
The NDVI and aboveground biomass were used as proxies for vegetation vigor and available fuel load. The NDVI, in particular, has been widely adopted in both domestic and international fire research as a reliable indicator of pre-fire vegetation health and density. In this study, NDVI values were extracted for March 2025, just before the wildfire event, using remote sensing imagery. This ensured that the vegetation conditions and fuel readiness at the time of the fire were adequately reflected.
All variables were derived from trusted public data sources, including the Forest Type Map and Forest Resource Inventory from the Korea Forest Service, as well as open-access remote sensing datasets and geospatial layers. These predictors were subsequently integrated into the machine learning model to evaluate their relative importance in determining wildfire burn severity across the study area.

3. Results

3.1. Burn Severity by Forest Type

The wildfire in Uiseong County affected a total of approximately 1159 km2. Among the vegetation types, coniferous forests accounted for the largest proportion (594.95 km2), followed by broadleaf forests (371.61 km2), mixed forests (161.48 km2), and bamboo groves (0.176 km2), with an additional 31.04 km2 classified as non-forested areas and grasslands. This distribution provided a baseline for assessing burn severity and structural vulnerability by forest type. Burn severity, quantified using mean dNBR values, varied notably across vegetation types. Bamboo groves exhibited the highest severity (0.3352), but given their minimal spatial extent, their overall influence was negligible. Excluding bamboo, coniferous forests recorded the most severe fire impacts (0.2943), followed by mixed forests (0.2682) and broadleaf forests (0.2044).
These findings highlight the pronounced susceptibility of coniferous forests to wildfire, a pattern consistent with earlier work [23]. Their study demonstrated that Pinus densiflora stands along Korea’s eastern coast are particularly vulnerable due to structural characteristics such as dense understory shrubs, persistent leaf litter, and dead branches that serve as ladder fuels, thereby facilitating vertical flame spread. In addition, the thin bark and structural continuity of young pine stands were identified as factors that exacerbate fire damage. Taken together, the present results confirm that pine-dominated coniferous forests constitute the most fire-prone forest type in Korea, a conclusion supported both by their wide spatial distribution, as observed in Uiseong County, and by their intrinsic ecological and structural properties, as documented in previous research.

3.2. Fire Damage in Relation to Stand Age and Tree Height

In Table 2, burn severity across all forest types increased with stand age up to the 4th or 5th age class and then declined gradually in older stands. In coniferous forests, most fire damage was concentrated between the 3rd and 5th classes, peaking in the 5th class with a mean dNBR of 0.3069. Mixed forests showed a similar pattern, with the highest severity also in the 5th class (mean dNBR = 0.2771). Broadleaf forests followed the same trajectory but reached maximum severity earlier, in the 4th class (mean dNBR = 0.2194), after which severity decreased progressively. Average dNBR values across different forest types are shown in the data, as shown in Figure 3.
These results indicate that forest stands at intermediate developmental stages are most vulnerable to wildfire, likely due to high biomass accumulation and increased fuel continuity during these ages. This age-dependent susceptibility closely parallels the findings of [24], who analyzed pre- and post-fire aerial imagery in Douglas-fir plantations in south-western Oregon. Their study identified stand age as the most significant predictor of crown damage, with severity peaking around 15 years post-planting, remaining high until about 25 years, and then declining. Taken together, both studies highlight a consistent and cross-regional pattern: stand age plays a critical role in determining burn severity, with mid-aged stands showing peak vulnerability and older stands exhibiting comparatively greater resilience.
In Table 3, coniferous and mixed forests showed the highest burn severity within the 5–11 m range. As tree height increased, fire severity declined. In contrast, broadleaf forests exhibited relatively consistent burn severity across a wider height range (3–21 m), but similar to other forest types, severity tended to decrease beyond this range. These observations indicate that lower to mid-range tree heights—often corresponding to dense mid-aged stands—are associated with a higher fire risk, while taller and older stands may provide greater structural resistance to fire spread.

3.3. Influence of DBH and Stand Density on Burn Severity

Burn severity also varied significantly across different diameter at breast height (DBH) classes in Table 4. In coniferous forests, the small-diameter class (6–16 cm) recorded the highest mean dNBR of 0.3424, indicating a strong susceptibility to fire in younger, denser stands. In contrast, mixed and broadleaf forests exhibited the greatest burn severity in the medium-diameter range (18–28 cm), with corresponding mean dNBR values of 0.2774 and 0.2216, respectively.
Additionally, a positive relationship was observed between stand density and burn severity in Table 5. As the canopy density increased, so did the severity of fire damage. This trend suggests that denser stands—particularly those with tightly packed vertical and horizontal fuel structures—are more prone to intense fire behavior. These findings underscore the importance of the forest structure, including DBH and density, as key factors influencing wildfire vulnerability.

3.4. Structural Interactions Driving Burn Severity

An integrated analysis of stand age, tree height, diameter at breast height (DBH), and crown density revealed consistent structural patterns associated with elevated burn severity. In coniferous forests, the highest severity was observed in stands belonging to the 3rd, 4th, and 5th age classes. These stands were primarily composed of small-to-medium-diameter trees, with average tree heights ranging between 12 and 17 m and exhibiting moderate crown density.
In mixed forests, burn severity peaked in the 4th and 5th age classes as well. These stands typically displayed moderate to high crown density and average tree heights of 16–18 m. Similarly, broadleaf forests showed the highest severity in the 4th and 5th age classes and were largely composed of medium-diameter trees with average heights also ranging from 16 to 18 m. Crown density in these stands was generally moderate.
These patterns suggest that forest structural attributes—particularly stand age, height, DBH, and crown density—play a critical role in determining wildfire vulnerability. Stands in the 4th and 5th age classes appear especially susceptible, representing a convergence of fuel accumulation, canopy closure, and connectivity that facilitates fire spread. Importantly, these structural characteristics are not isolated but interact synergistically to amplify burn intensity and spatial extent.
Furthermore, a substantial proportion of each forest type in the study area fell within these high-risk age classes: 85.6% of coniferous, 85.7% of mixed, and 76.4% of broadleaf forests were classified as the 4th or 5th age class. This indicates that the majority of burned forests—regardless of species composition—were structurally predisposed to higher fire severity. Notably, the 3rd through 5th age classes currently dominate the forest age distribution in Republic of Korea, which may help explain the large-scale damage caused by recent wildfires.

3.5. Model Performance and Classification Accuracy

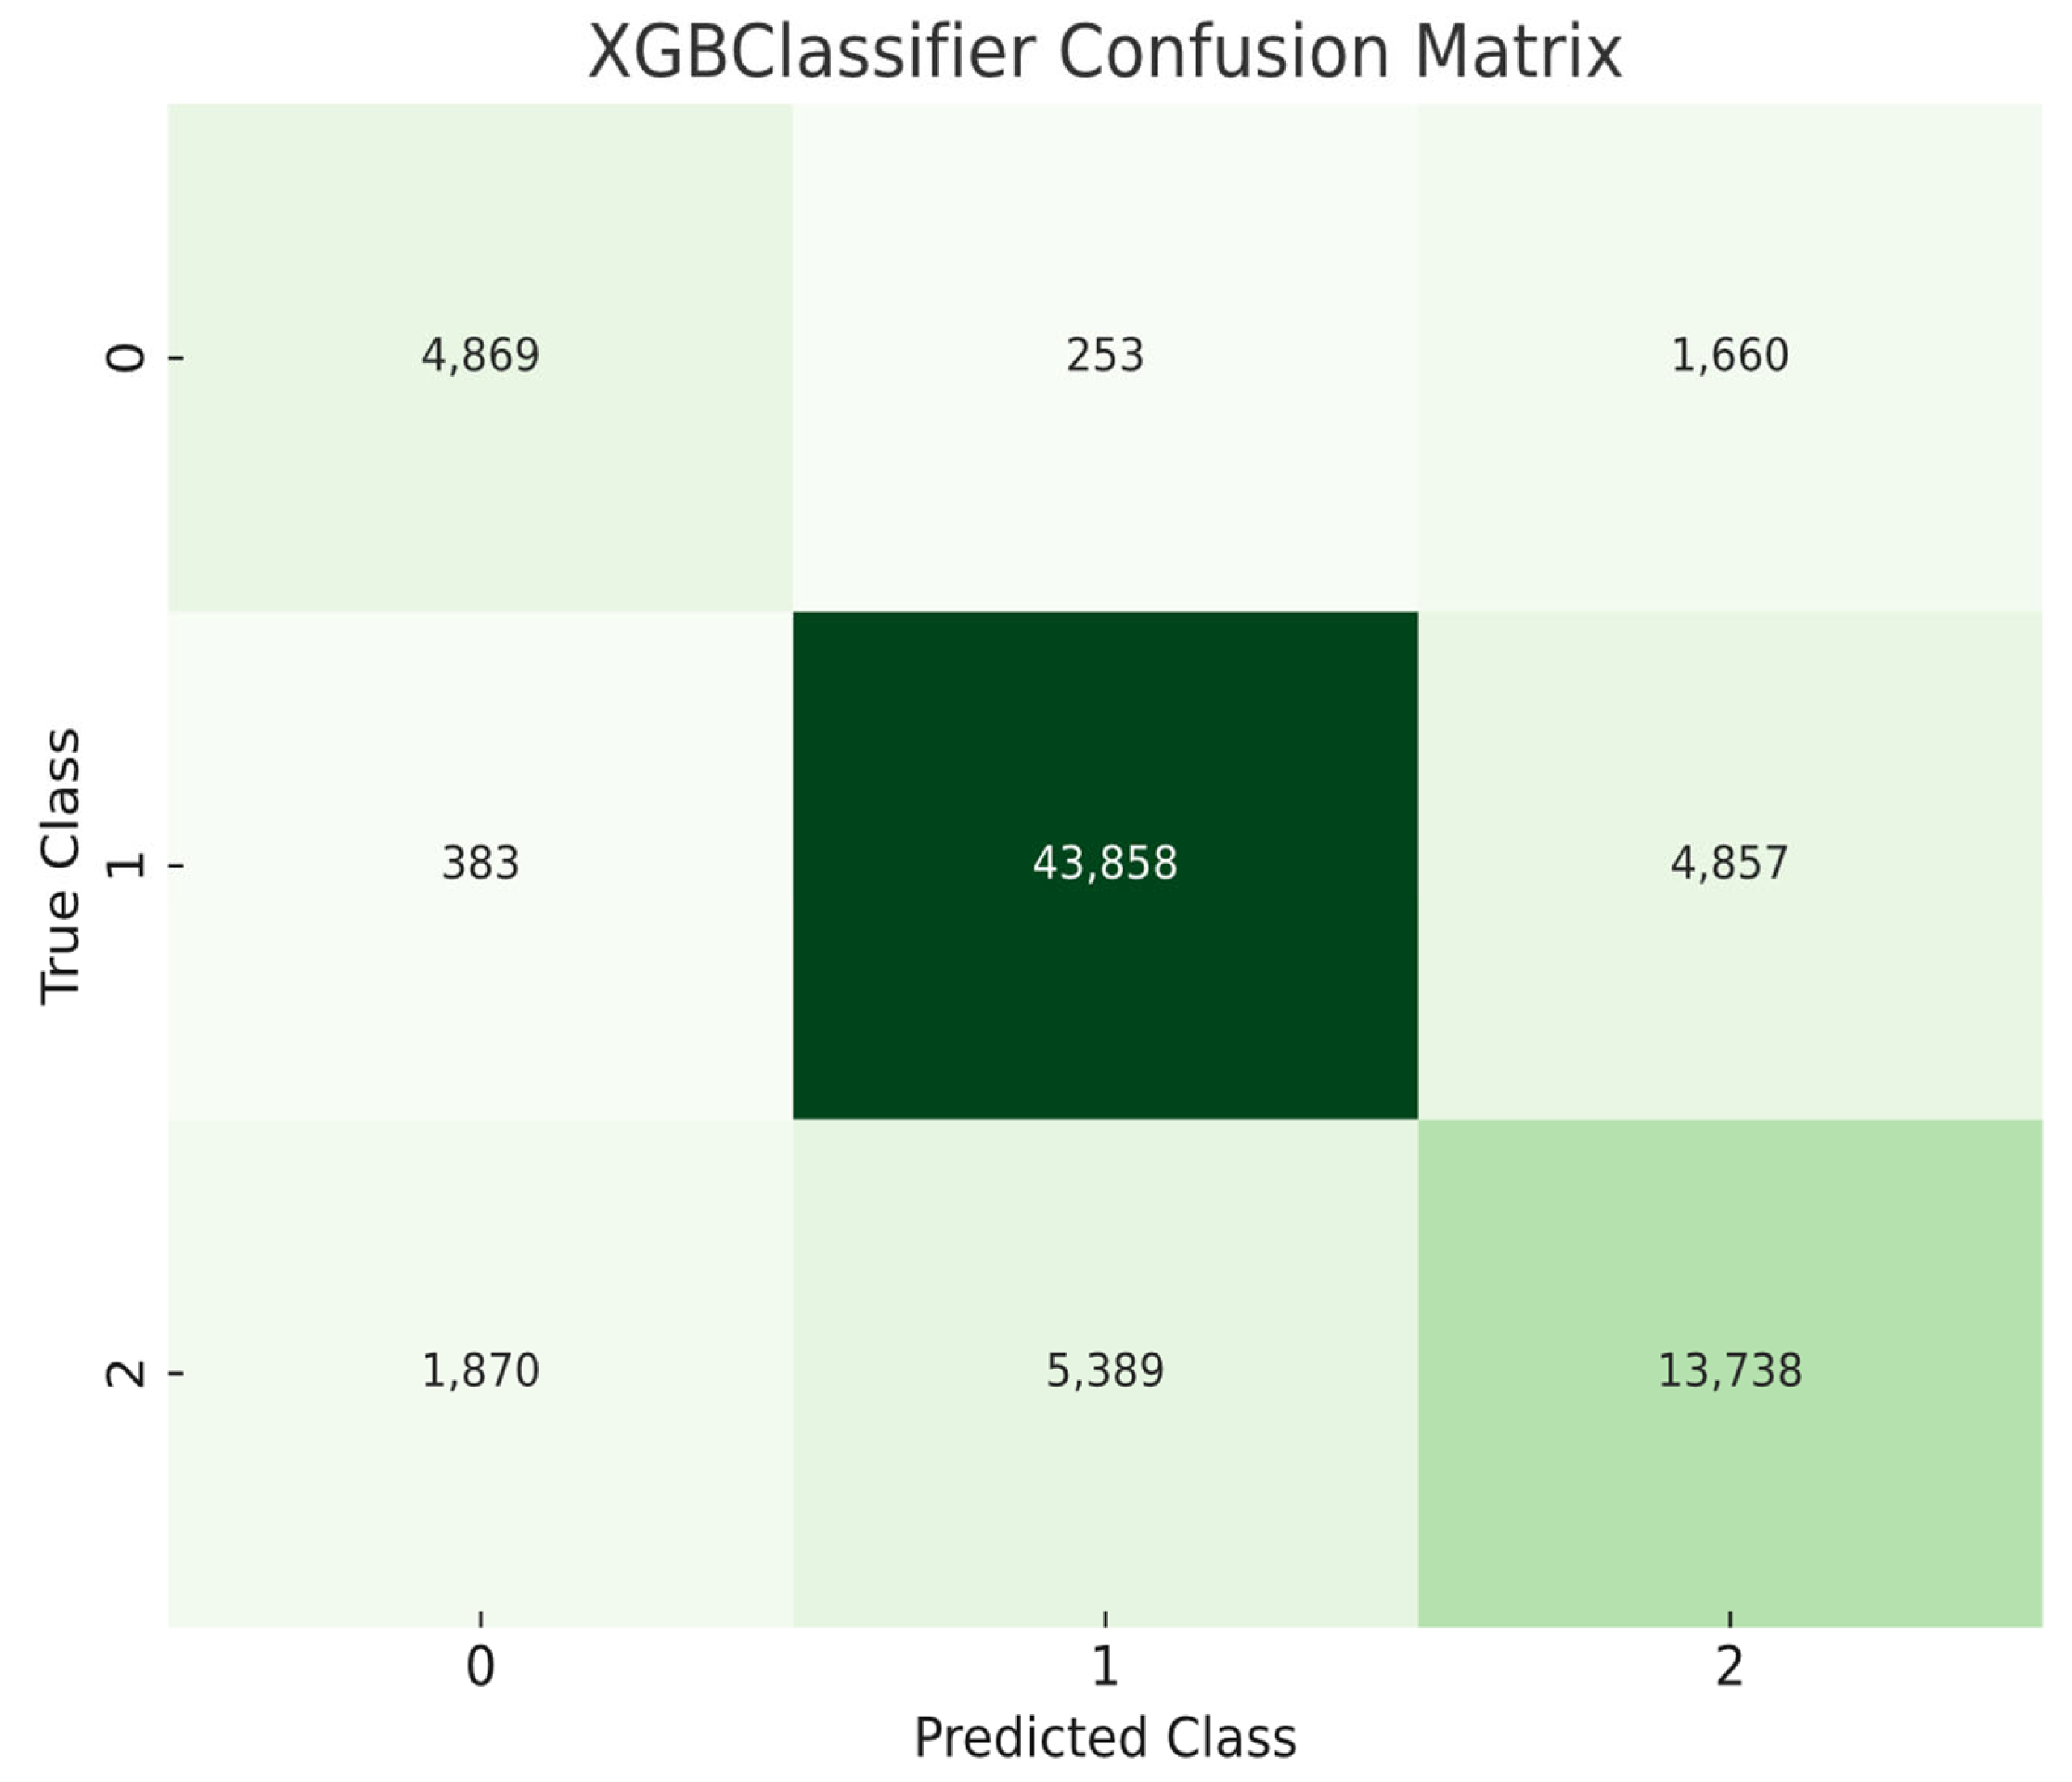
Based on the analysis of key variables influencing wildfire burn severity, we selected a total of 17 predictor variables (Table 1) to construct a predictive model for identifying areas at high risk of severe fire damage. The ROC curves for the test dataset are presented in Figure 4, with a higher AUC score indicating a more accurate model. The confusion matrix presented in Figure 5 summarizes the classification performance of the XGBoost-based model developed in this study, comparing predicted burn severity classes against observed outcomes. Evaluation metrics—including the precision, recall, and F1-score—were calculated to assess the classification accuracy and misclassification patterns across severity categories.
The model exhibited variable performance across the three burn severity levels (“Low,” “Moderate,” and “High”). Classification accuracy was highest for the “Moderate” severity class, with 43,858 out of 49,098 cases correctly predicted. This corresponded to a recall of approximately 89.3% and an F1-score of 0.89, indicating that the model effectively learned the conditions associated with intermediate burn severity. This may reflect strong correlations between input variables and observed outcomes within this class.
In contrast, the “Low” severity class demonstrated lower performance, with a precision of 68.5% (4869 out of 7102) and a recall of 71.8% (4869 out of 6782). Notably, 1660 samples in this class were misclassified as “High.” The “High” severity class also showed moderate classification performance, with a precision of 66.7% and recall of 65.5%; a substantial number of samples (5389 cases) were instead classified as “Moderate.”
These results suggest that several factors—such as the ambiguity of class boundaries, differential explanatory power among predictors, and potential imbalance in the training data—may have contributed to the observed classification errors. To improve model performance in future applications, enhancements such as nonlinear feature transformations, refined variable selection, ensemble learning strategies, or the integration of auxiliary classifiers should be considered.
In conclusion, the proposed model achieved high predictive accuracy for moderate burn severity, while performance for the “Low” and “High” classes remains an area for refinement and future methodological improvement.

3.6. Feature Importance from the Machine Learning Model

Figure 6 illustrates the feature importance scores derived from the machine learning model used to predict wildfire burn severity (dNBR). The model was trained using 17 independent variables, and the relative contribution of each variable to model performance was evaluated. Overall, the model achieved a high classification accuracy of 81.93%, demonstrating reliable predictive capability.
Among all predictors, the NDVI measured on March 14 emerged as the most influential variable, accounting for approximately 40% of the model’s total explanatory power. This result is consistent with previous studies [16,26,27], which have highlighted the strong link between the NDVI and the spatial distribution of burn severity. These studies found that fire impacts are closely associated with local biomass levels and fuel availability, both of which are effectively captured by the NDVI. As an index reflecting the vegetation vigor, canopy density, and moisture content, the NDVI plays a central role in identifying areas of elevated fire risk. In the context of the March wildfire analyzed in this study, the NDVI likely captured a complex interplay of seasonal and species-specific vegetation characteristics that strongly influenced fire behavior.
The second most important variable was forest type, which influenced model predictions due to its relationship with the fuel composition and combustion dynamics. Different vegetation types—such as coniferous, broadleaf, and bamboo forests—exhibit varying levels of flammability and structural vulnerability, making forest type a key determinant of burn severity.
Other notable contributors included spatial coordinates (X, Y), which helped capture regional variations in fire spread, and variables such as crown density (DMCLS_CD), elevation (SRTM), and species name (KOFIR_NM), which reflect the ecological and topographic heterogeneity of the landscape. Although stand structure variables—such as aboveground biomass (AGB2021), tree height (HEIGT_CD), and stand age class (AGCLS_CD)—showed relatively lower importance scores, they contributed to the model’s ability to capture fine-scale variations in burn severity across the landscape.
In summary, the NDVI and forest type were the dominant drivers of fire severity prediction, while topographic, structural, and locational variables played complementary roles. These findings reinforce the importance of vegetation vigor and fuel properties in determining fire behavior and highlight the utility of integrating remote sensing and forest inventory data in wildfire risk modeling.

3.7. Comparison of Observed and Predicted dNBR Values by Key Variables

Figure 7 compares the distributions of observed and predicted burn severity indices (dNBR) across various environmental variables. Overall, the predicted values tended to be higher than the observed values across most categories, while the magnitude of burn severity exhibited clear variation depending on the predictor.
Among all variables, the NDVI showed the strongest and most consistent relationship with the dNBR. In areas with a low NDVI, burn severity remained low, whereas NDVI values above 0.4 were associated with marked increases in the dNBR, indicating more severe fire impacts. This pattern reinforces the role of vegetation vigor and density in determining fire susceptibility.
In terms of forest type, mixed coniferous forests exhibited the highest levels of the observed and predicted dNBR, suggesting that these stands experienced the most intense fire damage. Moderate severity was observed in broadleaf and mixed forests, while dry coniferous and dry broadleaf forests generally showed lower burn severity. In most forest categories, the predicted values slightly overestimated the observed dNBR, with the discrepancy being particularly pronounced in coniferous forests.
Overall, the model effectively captured spatial and ecological variations in fire severity based on key environmental variables. The strong alignment between observed and predicted values across multiple predictors—especially the NDVI—demonstrates the robustness and reliability of the model in assessing wildfire damage.

3.8. Distributional Differences Between Predicted and Observed dNBR Values

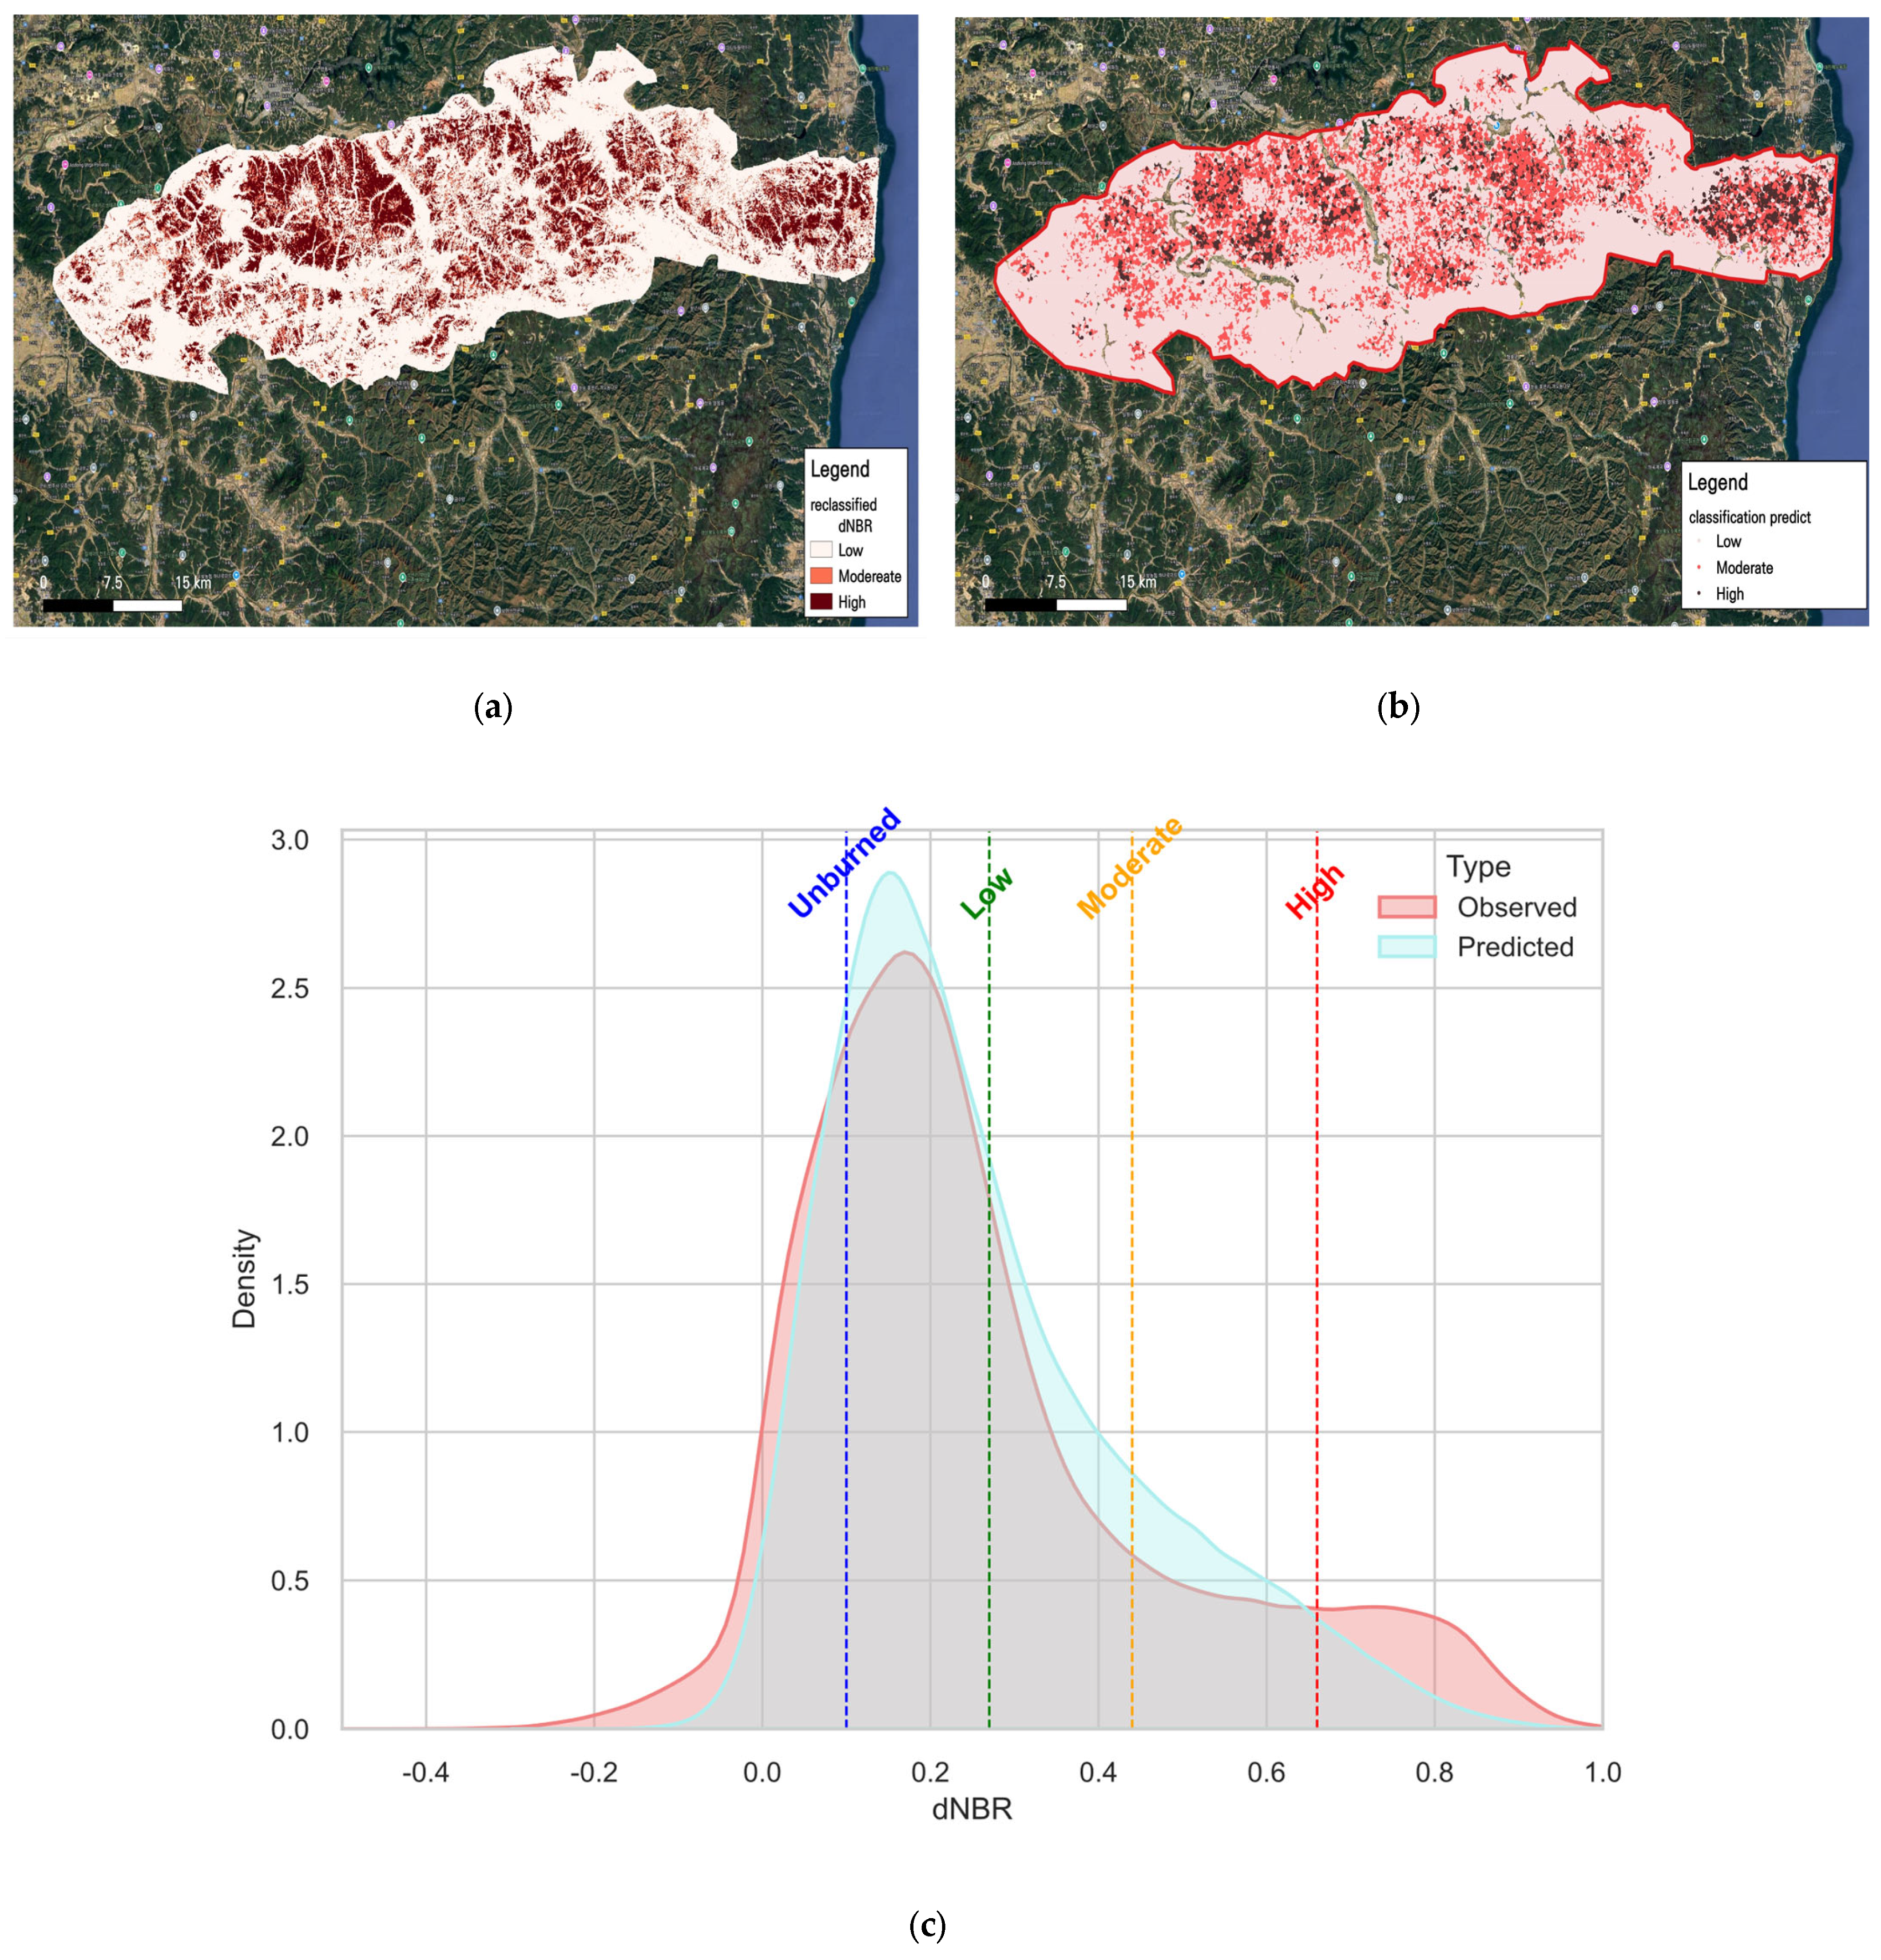
Figure 8 provides a visual comparison between the distributions of model-predicted and observed dNBR values. While the two distributions exhibited generally similar shapes, notable differences emerged in specific burn severity intervals. The predicted dNBR values were slightly right-skewed compared to the observed values, indicating a tendency of the model to estimate slightly higher severity levels overall.
In the low (0.1–0.27) and moderate (0.27–0.66) severity ranges, the predicted values demonstrated higher density than the observed values. In contrast, the high severity range (dNBR > 0.66) showed a higher density in the observed data, suggesting some underestimation by the model in extreme cases.
In the unburned to low range (dNBR < 0.27), which represents areas with negligible or minor fire damage, the difference between the predicted and observed distributions was minimal. Both distributions showed peak density within this range, indicating relatively high predictive accuracy in low-impact areas.
This pattern may be partly attributable to the characteristics of the NDVI, a key input variable in the model. Areas with a high NDVI typically correspond to vigorous vegetation and accumulated fuel loads. The model may have conservatively interpreted such conditions as indicative of higher fire susceptibility, thus slightly overestimating burn severity in those zones.
The model was applied to the Jirisan region of Korea, where a wildfire occurred in March 2025. The study area encompasses 49.9 km2. As illustrated in Figure A1 and Figure A2, the results were consistent with those obtained for the Gyeongbuk wildfire. The observed and predicted dNBR distributions aligned well with the burn severity classes, demonstrating the validity of the model.

4. Discussion

4.1. Structural Characteristics of Forests and Fire Damage Severity

The high wildfire damage intensity observed in coniferous forests and bamboo stands appears to be attributed to their unique structural and biochemical characteristics. Coniferous forests are generally rich in resin compounds and possess dense canopies and needle-like foliage, all of which make them highly flammable and prone to facilitating rapid flame spread and sustained combustion [28,29]. As forest stands mature and accumulate more biomass, these traits become even more pronounced, rendering coniferous ecosystems increasingly susceptible to high-intensity fires.
Fuel characteristics such as the chemical composition, organic matter content, and the arrangement of live and dead fuels strongly influence fire behavior; dense forests with continuous vertical fuels (ladder fuels) enable fires to spread from surface to canopy and promote high-intensity crown fires. Recent research shows that dense, spatially homogeneous forests with high ladder fuel loads are more likely to burn at high severity, and that extreme weather magnifies the effect of the stand density and ladder fuels, underscoring the need for management interventions to reduce fuel continuity [30,31].
Recent spaceborne LiDAR analysis from the NASA GEDI mission showed that metrics capturing vertical fuel continuity (ladder fuels) consistently predict wildfire severity across varying topographic and weather conditions, whereas canopy volume metrics may become decoupled from severity patterns in extreme environments [32].
Similarly, bamboo stands exhibit structural characteristics that heighten their sensitivity to fire. They are marked by rapid growth and high stem density, forming vertical and horizontal fuel ladders that promote fire propagation. In particular, mature bamboo with hollow stems may increase airflow and thereby intensify flame spread and combustion severity.
In addition to vegetation traits, the structural distribution of Korean forests also contributes to the increased risk of wildfire damage. As of 2023, approximately 76% of Republic of Korean forests comprise stands of age class IV or higher [33], providing conditions conducive to extensive wildfire damage. [34] advocated for the establishment of firebreak forests and landscape-scale management strategies, as well as natural or assisted succession to improve stand structure. Structurally mature forests, characterized by greater height, thicker stems, and higher biomass accumulation, tend to be less vulnerable to fire, underscoring the importance of structural development in fire resistance.
However, active forest management practices, such as thinning and logging, may sometimes impede succession from early-stage coniferous stands to late-stage deciduous forests. Young, densely packed forests with low canopies and small diameters tend to accumulate fine fuels and exhibit high vertical fuel continuity, increasing the risk of crown fires. In contrast, older forests with taller canopies, thicker trunks, and more open vertical structures show reduced fuel connectivity and lower fire propagation potential. Such structural transitions may also mitigate local microclimatic conditions, further reducing fire behavior intensity.
For example, a case study of the 2021 Bootleg Fire in Oregon found that broadcast burning (prescribed fire) resulted in more than 80% of the area burning at low severity, whereas thinning-only and untreated stands were dominated by moderate and high severity fire, highlighting the importance of fuel treatments in reducing burn severity [34].
These findings are consistent with previous studies showing that stand maturity and succession can enhance resistance to fire. For instance, [34] reported that mixed forests with a higher proportion of deciduous species exhibited greater resistance to wildfire. This underscores the importance of forest management plans that promote species diversity and structural complexity to address increasing fire risks under climate change.
In the present study, deciduous and mixed forests also showed a decline in fire damage severity with increasing age and tree height. Even coniferous forests, despite their inherent flammability, exhibited reduced damage at later stages of maturity. These results support the role of successional development in enhancing fire resistance. Nevertheless, species-specific traits such as the resin content and leaf morphology should also be considered, as they can influence fire behavior independently.
Mature forests of age class IV and higher play critical ecological roles in biodiversity conservation, soil stabilization, and ecosystem resilience. Structurally, their taller canopies, thicker stems, and accumulated biomass help suppress fire spread. Therefore, forest management strategies should aim to enhance structural diversity, promote mixed forest formation, and allow or facilitate natural succession. Especially in countries like Republic of Korea, where conifer plantations dominate, facilitating transitions toward deciduous or mixed forests can enhance both ecological value and fire protection capacity.
In summary, structural attributes such as stand age, tree height, and DBH play a crucial role in mitigating fire severity. Integrating these scientific insights into wildfire management and ecological restoration strategies can help build resilience in temperate forest ecosystems amid climate change. In addition, failure to allow succession—due to the repeated harvesting of stands in age class III or IV for carbon stock purposes or structural disruption from plantation activities—may exacerbate fire impacts. Thus, preserving and expanding mature stands of age class V or higher is a vital strategy for wildfire mitigation.

4.2. Wildfire Damage Prediction Model

This study identified the NDVI as the most important predictor in estimating wildfire damage severity. The NDVI, derived from satellite imagery, quantifies vegetation vigor, leaf area, and moisture content—key biophysical traits influencing fire behavior. As such, the NDVI serves as a powerful environmental indicator for the spatial prediction of wildfire risk and for identifying high-risk areas in advance.
Generally, higher NDVI values are associated with greater vegetation health and moisture content, leading to reduced fire damage. Therefore, the NDVI is often negatively correlated with fire severity indices like the dNBR, especially during the leaf-on seasons when deciduous forests exhibit high NDVI values and greater fire resistance.
However, the March 2025 wildfire in Uiseong County showed a different pattern. In early spring, deciduous trees have not yet leafed out, resulting in relatively low NDVI values. In contrast, coniferous forests maintain consistently high NDVI values year-round due to their evergreen nature. Accordingly, the March NDVI values were highest in coniferous forests, followed by mixed and deciduous forests—mirroring the pattern in dNBR values.
The NDVI also varied by stand age. In coniferous forests, the NDVI gradually increased with age class, plateauing at around age class III–VI, then temporarily declined at age class VII before rising again. In deciduous and mixed forests, the NDVI peaked at around age class III–V and then declined slightly in older stands. This suggests that mid-age stands show peak canopy development and physiological activity.
Notably, the NDVI and dNBR distributions showed similar patterns across most stand types, except coniferous stands in age classes VIII and IX. This indicates a positive correlation between the NDVI and fire severity in this case, suggesting that in early spring, the NDVI may reflect fuel accumulation more than fire resistance.
These results emphasize that the NDVI is not merely a static index of vegetation cover but a dynamic indicator that reflects seasonal, structural, and species-specific traits. In early spring, when vegetation is not fully developed, the NDVI may show a positive correlation with fire damage—a departure from the typical negative correlation observed during summer.
Our summer NDVI analysis showed that deciduous forests in age classes III–V had the highest NDVI values, supporting the hypothesis that these forests maintain a high leaf area and moisture content even during hot and dry periods. This reaffirms the traditional negative NDVI–dNBR correlation during the growing season.
In conclusion, while the NDVI remains a central predictor of fire severity, its interpretation requires an integrated consideration of the seasonal context and forest structure. The NDVI may exhibit either positive or negative correlations with fire severity depending on the phenological stage, vegetation type, and stand age.

5. Conclusions

This study quantified burn severity patterns during the March 2025 Uiseong wildfire and highlighted the critical role of the stand age, structure, and vegetation type. Across all forest types, severity increased with age up to the 4th–5th age classes before declining in older stands. Coniferous forests exhibited the highest vulnerability, with burn severity peaking at the 5th age class (mean dNBR = 0.3069). Mixed forests followed a similar trajectory, reaching maximum severity in the 5th age class (mean dNBR = 0.2771). Broadleaf forests recorded their greatest severity in the 4th age class (mean dNBR = 0.2194), after which susceptibility declined progressively. These patterns indicate that intermediate-aged stands, characterized by high fuel continuity and biomass accumulation, are disproportionately vulnerable to wildfire.
Structural attributes further reinforced this trend. In coniferous and mixed forests, burn severity was greatest within the 5–11 m tree height range, whereas broadleaf forests showed relatively stable severity across a broader height spectrum (3–21 m) but declined at greater heights. Collectively, these results demonstrate that mid-aged stands with small to medium DBH and moderate canopy height are most prone to fire damage, while taller, older stands exhibit increased resistance.
By integrating the NDVI with these structural attributes, the predictive model consistently identified the NDVI, stand age, tree height, and DBH as dominant variables. Importantly, the NDVI displayed a positive correlation with fire severity in coniferous forests during this early-spring event, diverging from the typically negative relationship reported in prior studies. This seasonal anomaly reflects the contrast between evergreen canopies, which retain high greenness, and deciduous forests, which remain leafless in March.
Overall, these findings confirm that wildfire severity in Uiseong was shaped by a combination of stand age and structural vulnerability, with severity peaking in the 4th–5th age classes (mean dNBR up to 0.3069) and declining thereafter. Incorporating such quantitative thresholds into fire risk models can enhance the early detection of high-risk stands and support adaptive forest management strategies under future climate change scenarios.

Author Contributions

Conceptualization, T.Y.; writing—original draft preparation, T.Y.; data analysis, J.L.; visualization, J.L.; writing—review and editing, T.Y. and J.L.; supervision, T.Y.; funding acquisition, T.Y.; submission, J.L. All authors have read and agreed to the published version of the manuscript.

Funding

This research was funded by the National Institute of Ecology (NIE), grant number NIE-A-2025-01. The APC was also funded by the same institute.

Institutional Review Board Statement

Not applicable.

Informed Consent Statement

Not applicable.

Data Availability Statement

Public datasets were analyzed in this study. Forest Type Map (KFS, 2023), NASA FIRMS active fire data (2025-03-14 to 2025-03-31), Sentinel-2 imagery (2025-03-14 and 2025-03-31), SRTM DEM, and ESA Above-Ground Biomass (2021) are publicly available. Processed data and code are available from the corresponding author on reasonable request.

Conflicts of Interest

The authors declare no conflicts of interest.

Abbreviations

The following abbreviations are used in this manuscript:
NDVINormalized Difference Vegetation Index
dNBRdifferenced Normalized Burn Ratio
DBHDiameter at Breast Height
AGBAboveground Biomass
DEMDigital Elevation Model
FIRMSFire Information for Resource Management System
KFSKorea Forest Service
NIENational Institute of Ecology
MLMachine Learning

Appendix A

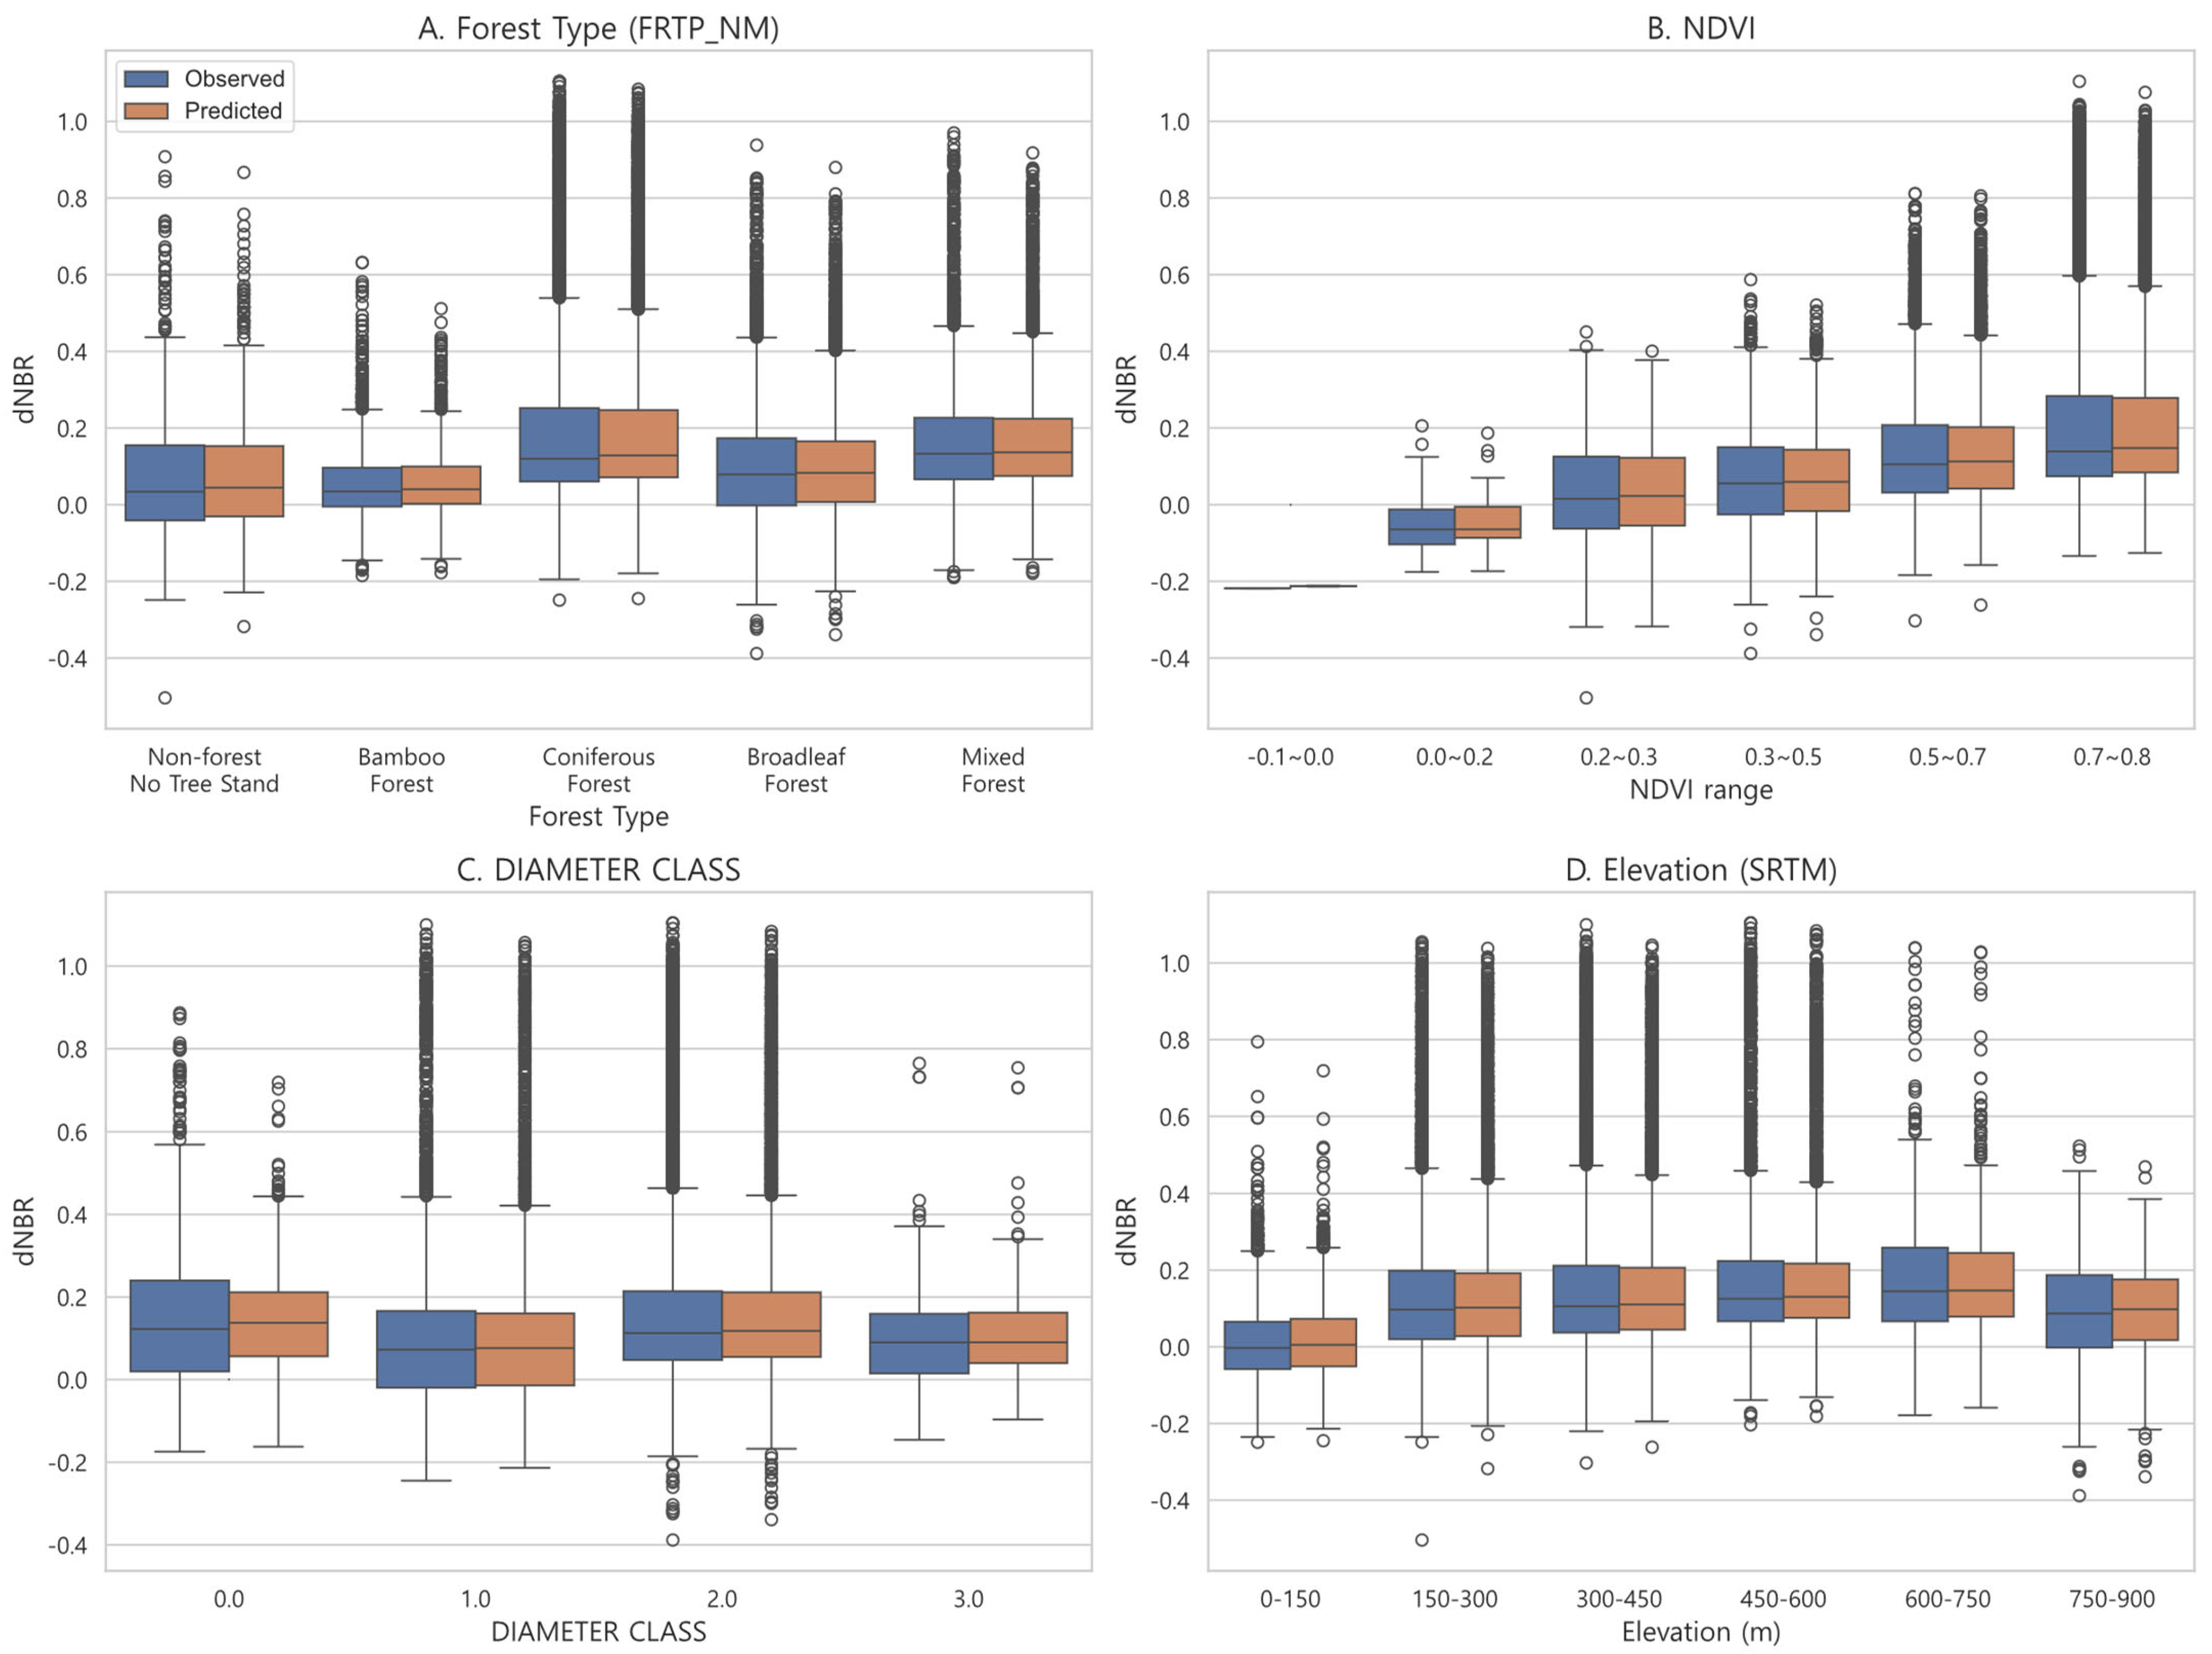
Figure A1. Boxplots of pixel-scale predicted and observed burned area in the Jirisan region of Korea among forest types (A), NDVI (B), DBH (C), and elevation (D).
Fire 08 00363 g0a1
Figure A2. Predicted wildfire damage intensity (dNBR) results; (a) observed dNBR, (b) predicted dNBR, (c) dNBR density plot with burn severity classification.
Fire 08 00363 g0a2

References

  1. Zahabnazouri, S.; Belmont, P.; Capolongo, D. Detecting Burn Severity and Vegetation Recovery After Fire Using dNBR and dNDVI Indices: Insight from the Bosco Difesa Grande, Gravina in Southern Italy. Sensors 2025, 25, 3097. [Google Scholar] [CrossRef]
  2. Lee, H.; Lee, J.-M.; Won, M.-S.; Lee, S.-W. Development and validation of Korean Composite Burn Index (KCBI). J. Korean For. Soc. 2012, 101, 163–174. [Google Scholar]
  3. Michael, Y.; Helman, D.; Glickman, O.; Gabay, D.; Brenner, S.; Lensky, I.M. Forecasting fire risk with machine learning and dynamic information derived from satellite vegetation index time-series. Sci. Total Environ. 2021, 764, 142844. [Google Scholar] [CrossRef] [PubMed]
  4. Charizanos, G.; Demirhan, H. Bayesian prediction of wildfire event probability using normalized difference vegetation index data from an Australian forest. Ecol. Inform. 2023, 73, 101899. [Google Scholar] [CrossRef]
  5. Halofsky, J.E.; Peterson, D.L.; Harvey, B.J. Changing wildfire, changing forests: The effects of climate change on fire regimes and vegetation in the Pacific Northwest, USA. Fire Ecol. 2020, 16, 4. [Google Scholar] [CrossRef]
  6. Korea Forest Service. 2023 Forest Type Map (Stand Map); Database; Korea Forest Service: Daejeon, Republic of Korea, 2023. [Google Scholar]
  7. Zhou, Y.; Fang, Y.; Ji, C. Continuous wildfires threaten public and ecosystem health under climate change across continents. Front. Environ. Sci. Eng. 2024, 18, 130. [Google Scholar] [CrossRef]
  8. US Environmental Protection Agency. Climate Change Indicators: Wildfires. U.S. Environmental Protection Agency. 2024. Available online: https://www.epa.gov/climate-indicators/climate-change-indicators-wildfires (accessed on 28 August 2025).
  9. Center for Climate and Energy Solutions (C2ES). Wildfires and Climate Change. Center for Climate and Energy Solutions. 2024. Available online: https://www.c2es.org/content/wildfires-and-climate-change/ (accessed on 28 August 2025).
  10. Bilgiç, E.; Tuygun, G.T.; Gündüz, O. Development of an emission estimation method with satellite observations for significant forest fires and comparison with global fire emission inventories: Application to catastrophic fires of summer 2021 over the Eastern Mediterranean. Atmos. Environ. 2023, 308, 119871. [Google Scholar] [CrossRef]
  11. Klimas, K.B.; Yocom, L.L.; Murphy, B.P.; David, S.R.; Belmont, P.; Lutz, J.A.; DeRose, R.J.; Wall, S.A. A machine learning model to predict wildfire burn severity for pre-fire risk assessments, Utah, USA. Fire Ecol. 2025, 21, 8. [Google Scholar] [CrossRef]
  12. Copernicus Atmosphere Monitoring Service (CAMS). 2023: A Year of Intense Global Wildfire Activity. Copernicus Atmosphere Monitoring Service. 2023. Available online: https://atmosphere.copernicus.eu/2023-year-intense-global-wildfire-activity (accessed on 28 August 2025).
  13. Lee, S.Y.; Jun, K.W.; Lee, M.W.; Chun, K.W. Mortality in pine stand and vegetation recovery after forest fire. J. Korean Soc. Hazard Mitig. 2008, 8, 71–79. [Google Scholar]
  14. Fang, L.; Yang, J.; Zu, J.; Li, G.; Zang, J. Quantifying influences and relative importance of fire weather, topography, and vegetation on fire size and severity in a Chinese boreal forest landscape. For. Ecol. Manag. 2015, 356, 2–12. [Google Scholar] [CrossRef]
  15. Bae, M.; Chae, H. Regional characteristics of forest fire occurrences in Korea from 1990 to 2018. J. Korean Soc. Hazard Mitig. 2019, 19, 305–313. [Google Scholar] [CrossRef]
  16. Korea Forest Research Institute. Long-Term Ecological Monitoring of Post-Fire Sites in Goseong and Samcheok (1997–2006); Korea Forest Service Report; Korea Forest Research Institute: Seoul, Republic of Korea, 2007. [Google Scholar]
  17. Simafranca, N.; Willoughby, B.; O’Neil, E.; Farr, S.; Reich, B.J.; Giertych, N.; Johnson, M.C.; Pascolini-Campbell, M.A. Modeling wildland fire burn severity in California using a spatial Super Learner approach. Environ. Ecol. Stat. 2024, 31, 387–408. [Google Scholar] [CrossRef]
  18. Kang, J.M.; Zhang, C.; Park, J.K.; Kim, M.G. Forest fire damage analysis using satellite images. J. Korean Soc. Geospat. Inf. Sci. 2010, 28, 21–28. [Google Scholar]
  19. Van Gerrevink, M.J.; Veraverbeke, S. Evaluating the Hyperspectral Sensitivity of the Differenced Normalized Burn Ratio for Assessing Fire Severity. Remote Sens. 2021, 13, 4611. [Google Scholar] [CrossRef]
  20. Li, J.; Zhou, G.; Chen, A.; Lu, C.; Li, L. BCMNet: Cross-layer extraction structure and multiscale downsampling network with bidirectional transpose FPN for fast detection of wildfire smoke. IEEE Syst. J. 2023, 17, 1–12. [Google Scholar] [CrossRef]
  21. Chen, T.; Guestrin, C. XGBoost: A scalable tree boosting system. In Proceedings of the 22nd ACM SIGKDD International Conference on Knowledge Discovery and Data Mining, San Francisco, CA, USA, 13–17 August 2016; pp. 785–794. [Google Scholar]
  22. Ma, X.; Cheng, L.; Yang, L. Forest fire prediction using a hybrid model based on XGBoost and deep learning. Sustainability 2020, 12, 9675. [Google Scholar]
  23. Seo, H.; Choung, Y. Enhanced vulnerability to fire by Pinus densiflora forests due to tree morphology and stand structure in Korea. J. Plant Biol. 2014, 57, 48–54. [Google Scholar] [CrossRef]
  24. Thompson, J.R.; Spies, T.A.; Olsen, K.A. Canopy damage to conifer plantations within a large mixed-severity wildfire varies with stand age. For. Ecol. Manag. 2011, 262, 355–360. [Google Scholar] [CrossRef]
  25. Park, J.; Moon, M.; Green, T.; Kang, M.; Cho, S.; Lim, J.; Kim, S.-J. Impact of tree species composition on fire resistance in temperate forest stands. For. Ecol. Manag. 2024, 572, 122279. [Google Scholar] [CrossRef]
  26. Korea Forest Service. Annual Wildfire Statistics 2022; Korea Forest Service: Daejeon, Republic of Korea, 2023. [Google Scholar]
  27. Helman, D.; Lensky, I.M.; Tessler, N.; Osem, Y. A phenology-based method for monitoring woody and herbaceous vegetation in Mediterranean forests from NDVI time series. Remote Sens. 2015, 7, 12314–12335. [Google Scholar] [CrossRef]
  28. Tawade, S.; Choudhary, R.R.; Chavan, V.S. Effects of forest fire on forest ecosystem, biodiversity and loss of plant and animal species. Int. J. Adv. Res. 2022, 10, 597–600. [Google Scholar] [CrossRef] [PubMed]
  29. Scott, J.H.; Burgan, R.E. Standard Fire Behavior Fuel Models: A Comprehensive Set for Use with Rothermel’s Surface Fire Spread Model; U.S. Department of Agriculture, Forest Service, Rocky Mountain Research Station: Fort Collins, CO, USA, 2005; 72p. [Google Scholar]
  30. Levine, J.I.; Collins, B.M.; Coppoletta, M.; Stephens, S.L. Extreme weather magnifies the effects of forest structure on wildfire, driving increased severity in industrial forests. Glob. Change Biol. 2025, 31, e70400. [Google Scholar] [CrossRef]
  31. Li, S.; Yang, Z.; Zheng, J.; Hou, G.; Liu, H.; Cui, X. Evaluation of Litter Flammability from Dominated Artificial Forests in Southwestern China. Forests 2023, 14, 1229. [Google Scholar] [CrossRef]
  32. Hakkenberg, C.R.; Clark, M.L.; Bailey, T.; Burns, P.; Goetz, S.J. Ladder fuels rather than canopy volumes consistently predict wildfire severity even in extreme topographic-weather conditions. Commun. Earth Environ. 2024, 5, 721. [Google Scholar] [CrossRef] [PubMed]
  33. KFS (Korea Forest Service). Survey of Forest Industry in 2023; KFS (Korea Forest Service): Daejeon, Republic of Korea, 2023. [Google Scholar]
  34. Sanna, A.; Chamberlain, C.; Prichard, S.J.; Cansler, C.A.; Hudak, A.T.; Bienz, C.; Moskal, L.M.; Kane, V.R. Assessing fuel treatments and burn severity using global and local analyses. Fire Ecol. 2025, 21, 44. [Google Scholar] [CrossRef]
Figure 1. Location of the wildfire-affected area in the study region. Red boundary indicates the burned area delineation.
Fire 08 00363 g001
Figure 2. Conditioning factors of major predictor variables used in the model; (a) NDVI, (b) Aboveground biomass, (c) Age Class, (d) Aspect, (e) Diameter Class, (f) Canopy Density, (g) Forest Type, (h) Forest Stand Name, (i) Stand Height, (j) Tree Species Name, (k) Slop, (l) Elevation, (m) Tree Existence Code.
Fire 08 00363 g002
Figure 3. Average dNBR values across different forest types.
Fire 08 00363 g003
Figure 4. Top-5 model (xgboost, catboost, lightgbm, RandomForest, ExtraTrees) ROC curve.
Fire 08 00363 g004
Figure 5. Three-class accuracy confusion matrix and observed vs. predicted dNBR.
Fire 08 00363 g005
Figure 6. Key factors influencing wildfire damage prediction.
Fire 08 00363 g006
Figure 7. Boxplots of pixel-scale predicted and observed burned in the study area among forest types (A), NDVI (B), DBH (C), and elevation (D).
Fire 08 00363 g007
Figure 8. Predicted wildfire damage intensity (dNBR) results. (a) Observed dNBR, (b) predicted dNBR, (c) dNBR density plot with burn severity classification. The colored density curves illustrate low, moderate, and high burn severity classes, and the vertical dashed lines mark the dNBR thresholds separating these categories.
Fire 08 00363 g008
Table 1. Major predictor variables used in the wildfire damage analysis model.
VariableDescriptionData SourceName
STORUNST_CDTree Existence Code2023 Forest Type Map (Korea Forest Service)STOCKED_OR UNSTOCKED
FOREST_CODE
FROR_CDForest TypeFOREST ORIGIN_CODE
DMCLS_CDDiameter ClassDIAMETER CLASS_CODE
AGCLS_CDAge ClassAGECLASS_CODE
HEIGT_CDStand HeightHEIGT_CODE
FRTP_NMForest Stand NameFOREST TYPE_NAME
KOFTR_NMTree Species NameKIND OF TREE GROUP_NAME
DNST_CDDensity CodeDENSITY_CODE
Shape LengthPerimeter of Vegetation PatchVegetation polygon perimeter
Shape AreaArea of Vegetation PatchVegetation polygon Area
SRTMElevationNASA SRTM
Digital Elevation Model
Shuttle Radar Topography Mission DEM
SLOPESlopeSLOPE
ASPECTAspectASPECT
XLongitudeLongitudeLongetude
YLatitudeLatitudeLatitude
AGBAboveground BiomassESA climate office
Above Ground Mass (2021)
Above Ground Mass 2021
NDVINormalized Difference Vegetation Index (NDVI)Sentinel-2 (2025.3.14)Normalized Difference Vegetation Index
(2025.3.14.)
Table 2. Mean dNBR values by forest type and stand age class.
Age ClassConiferous ForestMixed ForestDeciduous Forest
10.27700.24770.1641
20.26130.21260.1785
30.29340.21000.1758
40.28920.27550.2194
50.30690.27710.2180
60.27640.19580.1641
70.23440.01050.1269
80.25780.0083−0.0248
90.17600.03880.1749
Table 3. Average dNBR values by forest type and height class of stands.
Stand HeightConiferous ForestMixed ForestDeciduous Forest
<1 m0.2659330.2237740.161884
1 m~3 m--0.188854
3 m~5 m0.281337-0.214682
5 m~7 m0.3314990.2502390.190586
7 m~9 m0.3697880.2922690.209928
9 m~11 m0.3547630.2975930.209792
11 m~13 m0.299810.2681130.204229
13 m~15 m0.2920850.2668410.209849
15 m~17 m0.2782690.2609720.205337
17 m~19 m0.277410.2572830.209153
19 m~21 m0.2499920.2565670.202448
21 m~23 m0.2511080.2409690.193343
23 m~25 m0.2098280.247240.183911
25 m~27 m0.1847320.2233340.168423
27 m~29 m0.1087390.2147330.162872
29 m~31 m0.1210760.1082660.109958
31 m~33 m0.1103930.1170980.11102
Table 4. Average dNBR values by forest type and DBH class.
Diameter ClassConiferous ForestMixed ForestDeciduous Forest
0 (Dominant small-diameter canopy cover >51%, DBH < 6 cm)0.27700.24770.1641
1 (Dominant small-diameter canopy cover >51%, 6 cm < DBH <18 cm)0.34240.23930.1865
2 (Dominant small-diameter canopy cover >51%, 18 cm < DBH <30 cm)0.27480.27740.2216
3 (Dominant small-diameter canopy cover >51%, 30 cm < DBH)0.27980.14320.1311
Table 5. Average dNBR values according to forest type and stand density class.
Tree DensityConiferous ForestMixed ForestDeciduous Forest
Low stand density (Canopy cover ≤ 50%)0.28140.24300.1871
Moderate stand density (51% ≤ Canopy cover ≤ 70%)0.29590.25900.1933
High stand density (71% ≤ Canopy cover)0.29440.26920.2089
Disclaimer/Publisher’s Note: The statements, opinions and data contained in all publications are solely those of the individual author(s) and contributor(s) and not of MDPI and/or the editor(s). MDPI and/or the editor(s) disclaim responsibility for any injury to people or property resulting from any ideas, methods, instructions or products referred to in the content.