Article

Effect of Bend Spacing Configuration on the Vented Explosion Characteristics of Premixed Methane/Hydrogen in Pipelines with a Large Length-to-Diameter Ratio

1
School of Naval Architecture & Maritime, Zhejiang Ocean University, Zhoushan 316022, China
2
School of Petrochemical Engineering & Environment, Zhejiang Ocean University, Zhoushan 316022, China
3
National & Local Joint Engineering Research Center of Harbor Oil & Gas Storage and Transportation Technology, Zhoushan 316022, China
4
Zhejiang Key Laboratory of Pollution Control for Port-Petrochemical Industry, Zhoushan 316022, China
5
Sinochem Emergency Technical Service Co., Ltd., Zhoushan 316022, China
*
Author to whom correspondence should be addressed.
Fire 2025, 8(8), 328; https://doi.org/10.3390/fire8080328
Submission received: 17 July 2025 / Revised: 8 August 2025 / Accepted: 14 August 2025 / Published: 15 August 2025

Abstract

Mixing hydrogen into natural gas pipelines for transportation is an effective solution to the imbalance between the supply and demand of hydrogen energy. Studying the influence of bent pipes in hydrogen-mixed natural gas explosion accidents can enhance the safety of hydrogen energy storage and transportation. Through experiments and LES, the influence of pipe spacing configuration on the vented explosion of this mixed gas in pipes with a large length-to-diameter ratio was analyzed. The maximum explosion pressure (Pmax) of the straight pipe is 21.7 kPa and the maximum pressure rise rate ((dp/dt)max) is 1.8 MPa/s. After adding the double elbow, Pmax increased to 65.2 kPa and (dp/dt)max increased to 3.7 MPa/s. By increasing the distance (D1) from bent pipe-1 to the ignition source, the flame shape changes from “finger-shaped” to “concave-shaped” to “wrinkled-shaped.” When D1 is at its minimum, the explosion reaction is the most intense. However, as D1 increases, each characteristic parameter decreases linearly and the flame propagation speed significantly reduces, the flame area decays more severely, and the flame acceleration effect is also suppressed. When the distance between the two bent pipes (D2) was gradually increased, the flame transformed from “finger-shaped” to “tongue-shaped” to “wrinkled-shaped”. The flame area curve exhibited a unique evolutionary process of “hitting bottom” to “rebounding” to “large-scale flame backflow”. This paper explores the development process of various characteristic parameters, which is of great reference value for preventing explosions in hydrogen-blended natural gas pipelines in underground pipe galleries.

1. Introduction

Hydrogen energy and hydrogen blending technology have emerged as hot topics in the future energy sector, attracting significant attention and development due to their abundant resources, environmental friendliness [1], renewability [2], and storability [3]. Most of China’s large-scale alternative energy bases are concentrated in the northern regions, while energy consumption centers are mainly located in the central and eastern areas. Electrolytic hydrogen production using renewable energy in the northwest is an effective solution to the uneven distribution of energy. Against this backdrop, safe and efficient hydrogen containment and transport technologies have emerged as indispensable to the realization of hydrogen energy applications. Hydrogen has a relatively low energy density and typically requires compression or liquefaction [4], which significantly increases transportation costs. Research has demonstrated that introducing hydrogen into natural gas pipelines enables larger-scale [5], longer-reach [6], and more cost-efficient hydrogen conveyance [7]. In real-world engineering scenarios, due to structural or functional requirements and the influence of altitude, underground pipelines cannot be laid in straight lines and typically exhibit some degree of bending deformation. For example, 90° bends are the most common type.
Hydrogen has a larger flammable range and a lower minimum ignition energy, making it more likely to catch fire or explode [8,9]. During the combustion process, it exhibits a high rate of thermal diffusion, strong reactivity, and unstable flame morphology [10], which makes it more likely to experience explosion accidents during storage and transportation [11]. The research findings of Shirvill et al. [12] demonstrate the unique characteristics of hydrogen explosions, with hydrogen/air mixtures exhibiting significantly more explosions than ethane/air, methane/air, or propane/air mixtures. Additionally, Li et al. [13] conducted comparative experiments on hydrogen/air and methane/air explosions at different volume concentrations in a closed pipeline, finding that hydrogen flames are brighter and propagate faster, with hydrogen exhibiting significantly higher peak overpressure, maximum pressure rise rate, and shock wave velocity compared to methane. Chen et al. [14] conducted hydrogen explosion studies in a shock tube with an inner diameter of 70 mm and a length of 2.25 m, finding that the pressure peak was highest at a hydrogen concentration of 40%. Although higher concentrations increase the exhaust flame temperature, pressure growth is not proportional to concentration. Within the realm of methane/hydrogen mixture explosion research, the experimental models adopted by most scholars primarily feature enclosed cubic geometries. Jiang et al. [15] revealed that elevating the hydrogen mole fraction leads to an acceleration of the gas mixture’s combustion velocity, an intensification of thermal diffusivity instability, a steepening of the pressure curve, and a shortening of the isobaric period. As hydrogen content increases, Li et al. [16] learned that both external explosion pressure (Pext) and the hydroxyl radical (HO) increased, while Zhang et al. [17] observed a secondary explosion outside the pipeline, and the intensity and destructive power of the second explosion were significantly greater than those of the first explosion. He et al. [18] found that as the hydrogen concentration increases, the flame emission rate and radiant heat flux density under the ceiling all increase. Cai et al. [19] revealed that the pressure rise rate exhibited a non-monotonic trend with increasing equivalence ratio.
Considerable research has been conducted on the explosive behavior of flammable gases in enclosures with diverse geometric configurations and large dimensions [20,21,22]. Jiang et al. [15] studied methane/air explosions in rectangular pipes and found that both pressure waves and velocities increased with increasing ignition distance. Pan et al. [23] discovered that increasing the length of the downstream pipe in a Y-shaped pipe facilitates spontaneous ignition and stabilizes flame propagation. Niu et al. [24] revealed that the presence of multiple parallel branches results in a reduction of both the pressure and flame velocity. Lei et al. [25] found that after hydrogen gas was added to a methane explosion in a 20L sphere, both the overpressure peak and the rise rate peak increased. Shamsadin Saeid et al. [26] studied the flame development laws in various pipes and found that, mainly due to bending, the flame propagation weakened and the turbulence increased. However, Xiao et al. [27] compared the effects of bends and straight pipes on flames and found that the acceleration patterns of bends and straight pipes, as well as the evolution patterns of tulip flames, are consistent. With respect to pressure oscillation frequency and amplitude, Mei et al. [28] revealed that both parameters increase as the curve angle grows. Conversely, as reported by Olugbemide [29], the pressure demonstrates a decreasing trend with increasing curve angle, indicating the significant influence of geometric curvature on explosion dynamics. Wang et al. [30] studied T-shaped pipes and obtained methane explosion flame propagation dynamics data in different directions, providing a theoretical basis for preventing methane explosions.
Overall, most current studies focus on the explosive evolution laws of single flammable gases in simple geometric spaces, while the explosive characteristics of methane/hydrogen premixes in complex double-bent pipes have not yet been explored. However, in real-world underground pipe galleries, curved configurations are inherently present, which can profoundly influence the explosion dynamics in methane/hydrogen blends. Given that the proportion of hydrogen reaching 20% is a key turning point for explosion hazard [31], in this study, the equivalent ratio was set at 1 and the volume ratio of methane/hydrogen was controlled at 4: 1. The methane/hydrogen premix explosion process was experimentally and numerically simulated by changing the distance (D1) between bent pipe-1 and the ignition head and the distance (D2) between the two bends. Considering that the distance between the bent pipe-2 and the ignition head may interfere with the experimental results, the conditions designed in this experiment have clear comparability. For instance, Case 1 and Case 5 can be contrasted to analyze the influence of the relative position of the bend. This paper systematically explores the evolution laws of various characteristic parameters. The research results have important engineering application value in the field of preventing explosion accidents of hydrogen-blended natural gas pipelines in underground pipe galleries.

2. Experimental Set-Up and Methodology

2.1. Experimental Set-Up

High pressure is not only a fundamental condition for hydrogen self-ignition, but also determines the probability of ignition, flame characteristics, and protective strategies through dynamic coupling with the pipeline structure. Gong et al. [32] found through numerical simulations that there are significant differences in shock wave propagation and interaction in square, pentagonal, and circular pipelines: in square and pentagonal pipelines, inward and outward reflected shock waves are generated simultaneously and interact with each other, leading to more significant local pressure and temperature accumulation and making it easier to meet the energy conditions for spontaneous combustion; in circular pipelines, the two reflected waves alternate without interacting, resulting in weaker energy accumulation. Therefore, in the design of hydrogen energy equipment pipelines, adopting a circular cross-section can reduce shock wave amplification effects, lower the probability of spontaneous combustion triggering, and provide specific structural design guidelines for the experimental and numerical models in this study.
Figure 1 presents a schematic illustration of the experimental set-up, comprising pipelines, pressure sensors, data acquisition systems, ignition systems, gas dynamic gas mixing and dilution instruments, pressure reducing valves, methane gas cylinders, and hydrogen gas cylinders. With an inner diameter of 100 mm, the pipe is composed of 10 straight pipes, each 200 mm in length, and 2 bent pipes with a turning radius of 150 mm. Each pipe section is tightly connected by flanges and gaskets. Currently segmented into five distinct components, the pipeline comprises straight pipe-1, bent pipe-1, straight pipe-2, bent pipe-2, and straight pipe-3. The lengths of the straight pipes 1, 2, and 3 correspond to D1, D2, and D3, respectively. The experiment was divided into two groups by changing the distance from bent pipe-1 to the ignition source (D1) and the distance between the two bends (D2), and a long straight pipe was set as the control group. There are a total of nine cases. Detailed information is shown in Table 1. The CY400 pressure sensor employed in this study features a sampling rate of 200 kHz, a measurement uncertainty of ±0.25%, and a measurement span from 0 to 1 MPa. To enhance the measurement precision of combustible gas volume in the experiment, this study employed a gas dynamic mixing and dilution system (model YC-ZC200) with a flow rate accuracy of ±1.0% F.S.

2.2. Experimental Methodology

First, assemble the pipes and connect the experimental equipment to them. Second, seal the explosion vent with 0.05 mm PVC film, which mainly serves to prevent the leakage of premixed gas during the inflation stage. PVC film has a very low strength and ruptures at a pressure of 1 kPa, which is far lower than the maximum explosion pressure inside the pipes in this experiment. Therefore, the PVC film will rupture instantly after an explosion, forming a completely open explosion vent. Then, the gas dynamic gas distribution dilution instrument, pressure sensor, transient pressure acquisition system, and ignition system will be turned on, so that they are in standby mode. Finally, the hydrogen and methane cylinders will be opened and the pressure reducing valves will be tightened to allow a steady flow of hydrogen and methane to the gas dynamic distribution diluter. The gas diluter used the proportional mode, set the volume concentration of hydrogen to 20%, methane 80%, and the total flow rate to 1 L/min. Air is also automatically supplied by a gas diluter without the need for proportional adjustment, at a flow rate of 1 L/min. After the end of inflation, the cycle system was used to circulate for 5 min. Activate the ignition system and the ignition energy is 20 J. To validate the accuracy of test pressure measurements, every series of experiments was replicated at least three times per test group.

3. Numerical Methods

3.1. Control Equations for Large Eddy Simulation

Owing to the capabilities of current computer hardware, the minimum scale of the computational grid that can be practically adopted is still much larger than the scale of the smallest vortex. Therefore, current numerical simulation strategies do not allow direct simulation of the instantaneous motion of eddies over the full range of scales. The standard approach entails directly resolving the instantaneous Navier–Stokes equations by accounting for only turbulent motions larger than the computational grid scale, filtering out small-scale eddies, and incorporating a subgrid-scale model to characterize the effects of small-scale pulsations. A number of authors have used this model to reproduce the experimental process [33,34]. After processing through the filter function, the LES control equation is obtained as:
ρ t + x i ( ρ u ¯ i )   =   0 ,
t ρ u ¯ i + x j ( ρ u ¯ i u ¯ j ) = x j σ ij p ¯ x i τ ij x j ,
ρ h ¯ s t + ρ u ¯ i h ¯ s x i p ¯ t u ¯ j p ¯ x i x i λ T ¯ x i = x j ρ ( u i h ¯ s u ¯ i h ¯ s ) ,
where λ is the thermal conductivity, W/(m·K); h s is enthalpy, J/kg; ρ is density, kg/m3; p is pressure, Pa; t is time, s; u i ,   u j are velocity components, m/s; and T is temperature, K.
σ i j   is the stress tensor, defined by molecular viscosity as:
σ ij   =   μ x ¯ i x j   +   u ¯ j x i 2 3 μ u ¯ i x i δ ij ,
τ i j   is the subgrid scale stress defined as:
τ ij 1 3 τ kk δ ij   =   2 μ SGS S ¯ ij ,
where μ S G S   is the subgrid viscosity coefficient for:
μ SGS   =   ρ L S 2 ( S ij S ij ) 3 2 ( S ¯ ij S ¯ i j ) 3 2 + ( S ij S ij ) 5 4 ,
where S i j is its spin rate tensor and L s is the subgrid-scale mixing length.

3.2. Computational Model and Meshing

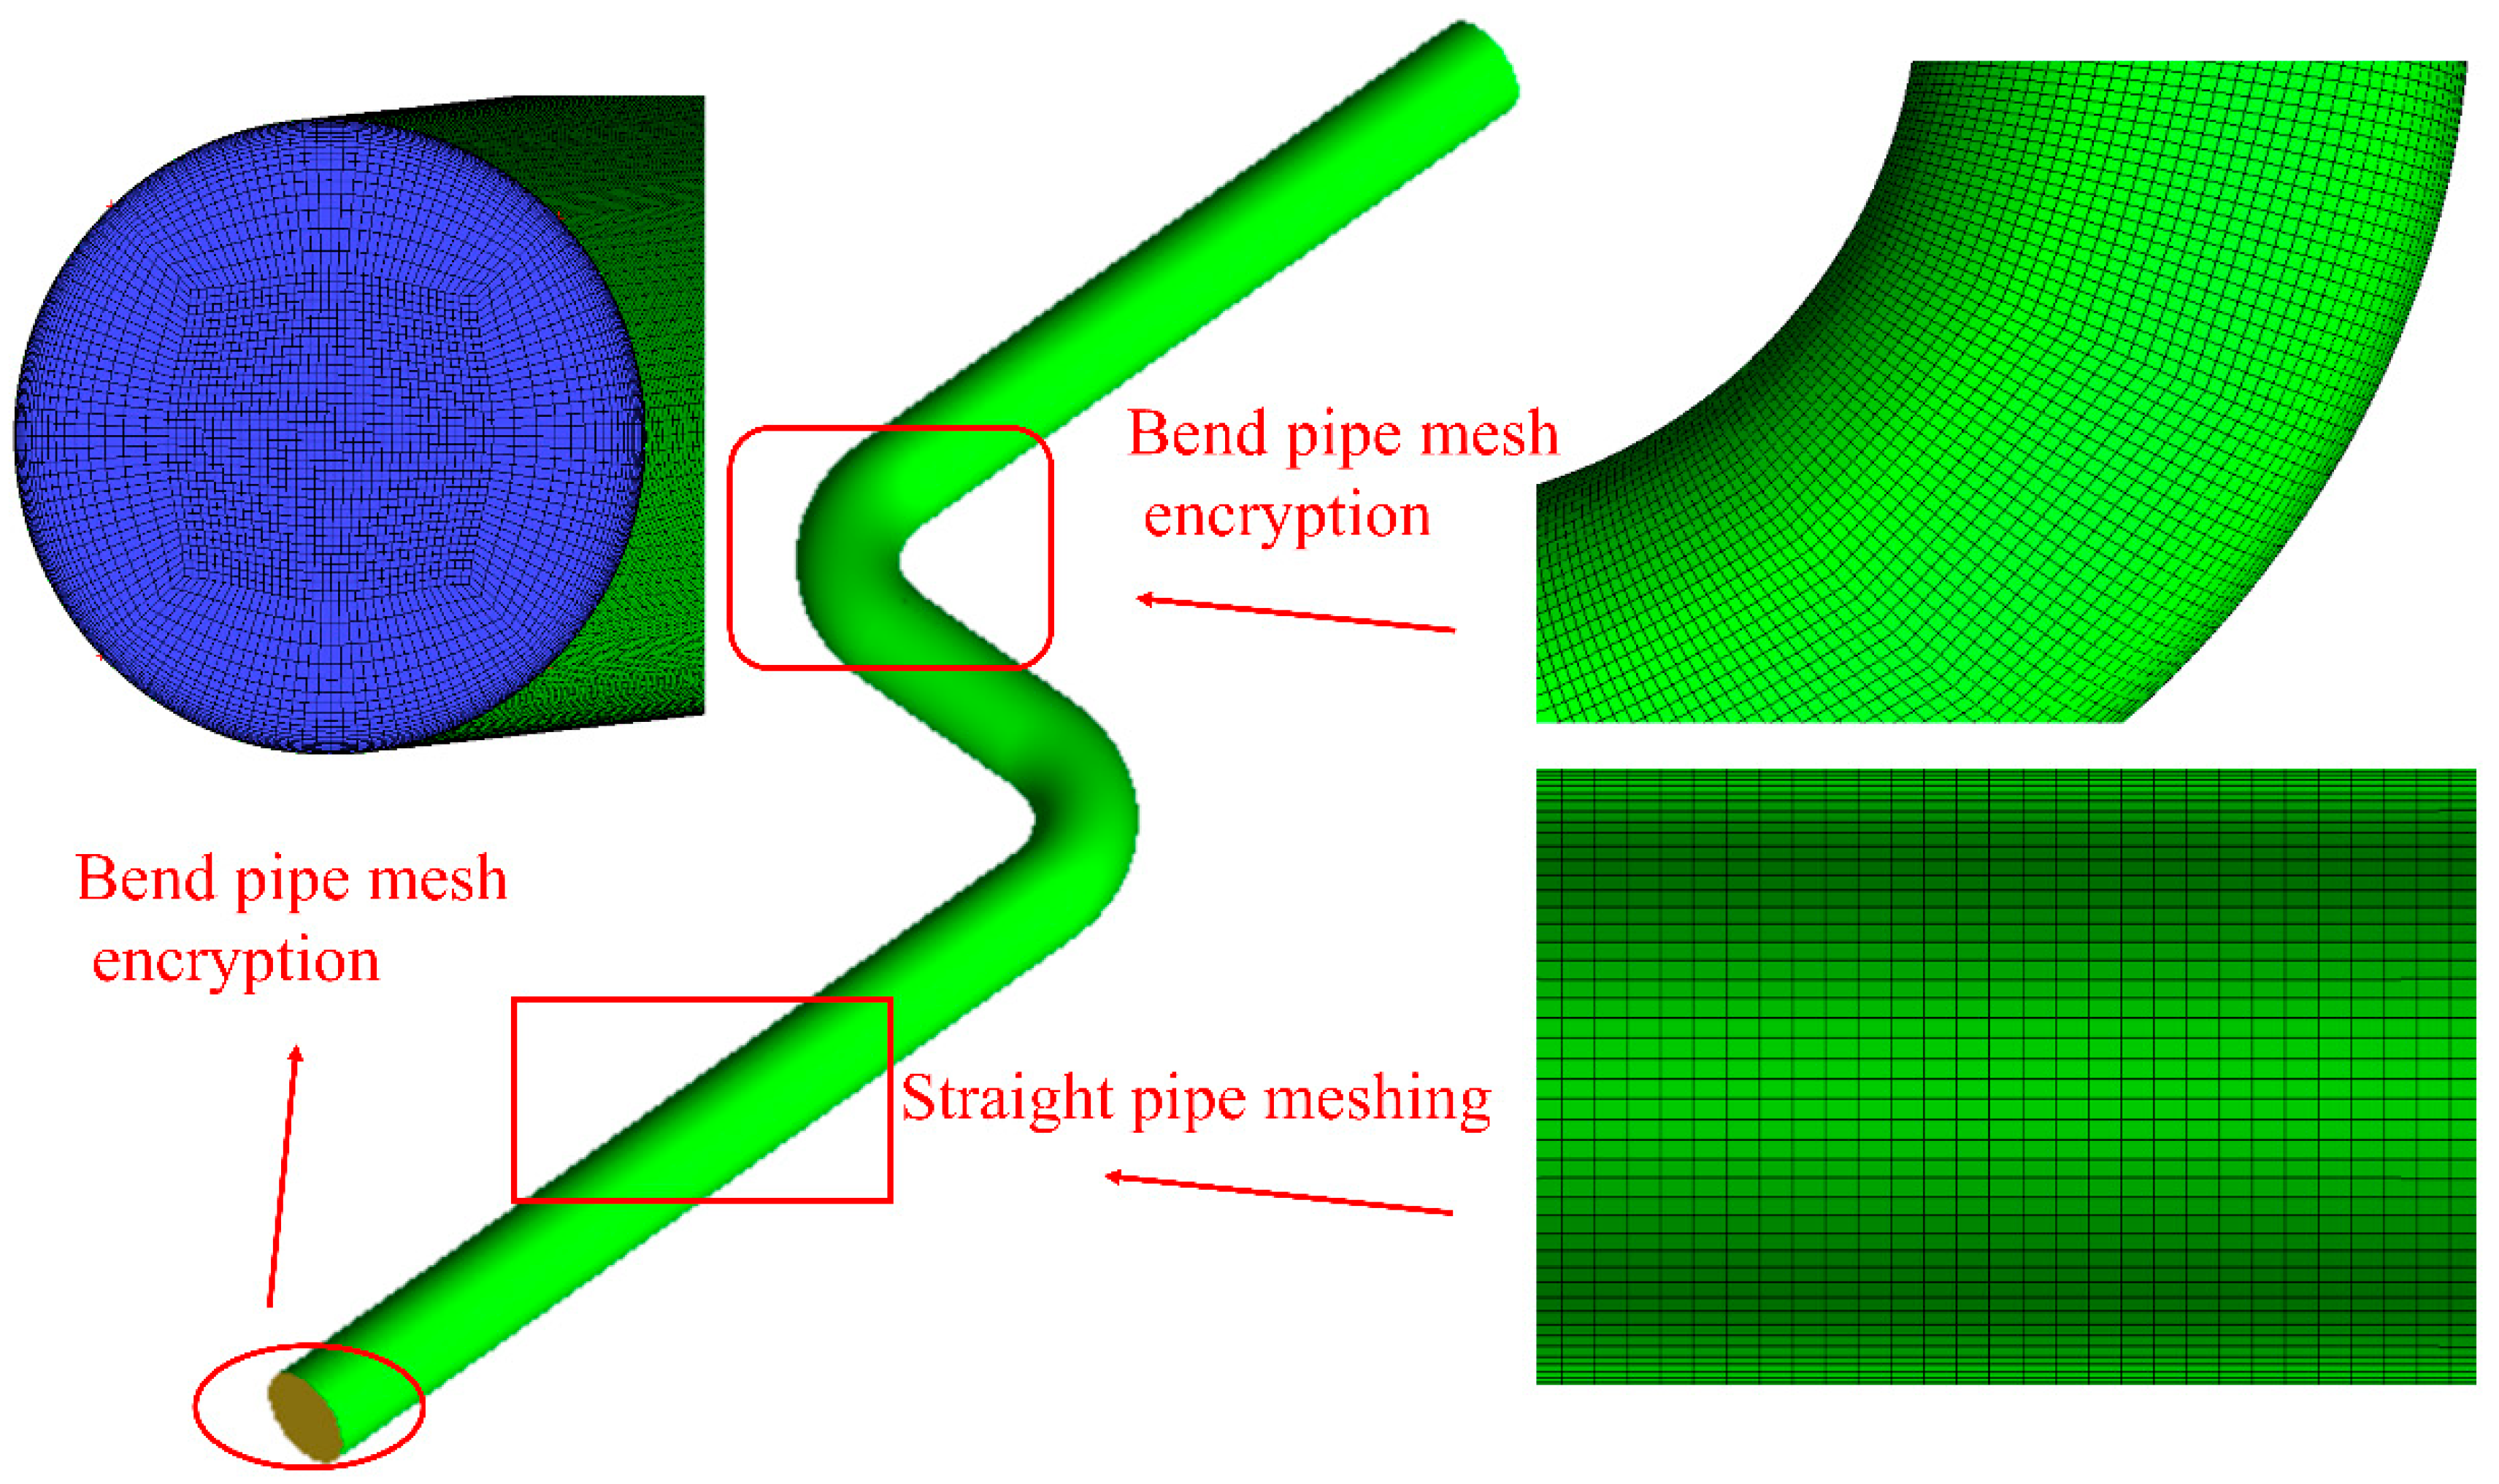
Numerical simulations were performed using ANSYS Fluent 2021 R2 software, with meshing carried out using ICEM CFD. The computational framework is based on the finite volume method for solving three-dimensional Navier–Stokes equations, combined with a subgrid-scale model for large eddy simulation (LES) to handle turbulent effects, and a second-order semi-implicit format for time integration. Figure 2 shows the model and meshing of Case 2 as an example. With the ignition point set as the origin, the positive direction of flame propagation is defined. Pressure monitoring point P1 was positioned at the concave wall surface (outer wall) of bent pipe-1, P2 at the concave wall surface of bent pipe-2, and P3 at the explosion relief port.
In large eddy simulations (LES), the physical dissipation at the subgrid-scale decreases significantly with grid encryption. Therefore, there is no strictly grid-independent solution in LES and the numerical accuracy mainly depends on how well the grid resolution matches the time step. To guarantee the validity of the simulation, our group has carried out a large number of mesh-independent verifications and found that a 2 mm mesh pair is close to the experimental results [35,36,37]. Due to computer performance and time cost constraints, this study implements a gradient mesh transition strategy using a 4 mm mesh in the straight pipe section. In addition, in this paper, an O-gridding method was applied to better handle the whole pipe [38] and a fine mesh was used at the boundaries with a mesh growth rate of 1.1 in both axial and radial directions [39]. To prevent abrupt variations in mesh size and enhance the accuracy of spatial discretization in the regions of the bends and the ignition source, an equal scale mesh (minimum size δ x   =   δ y   =   δ z   =   2.35   m m ) was used. The final number of constructed grids exceeded 520,000.
Utilizing the finite volume method, spatial discretization of the governing equations is systematically conducted, ensuring numerical stability and solution accuracy. Specifically, discretization of the diffusion term is accomplished through a second-order central differencing scheme to guarantee numerical precision, with the convection term being approximated by a second-order upwind scheme. This approach balances accuracy and stability in computational modeling. Pressure-velocity coupling is enforced through the SIMPLE algorithm and sub-relaxation techniques are employed to enhance iterative convergence [7,33,40]. The convergence criteria were set as follows: the residuals for the mass and momentum equations were reduced to less than 2 × 10⁻⁵, and the energy and reaction process variable equations reached the magnitudes of 1 × 10⁻⁶ and 1 × 10⁻³, respectively.

3.3. Numerical Validation

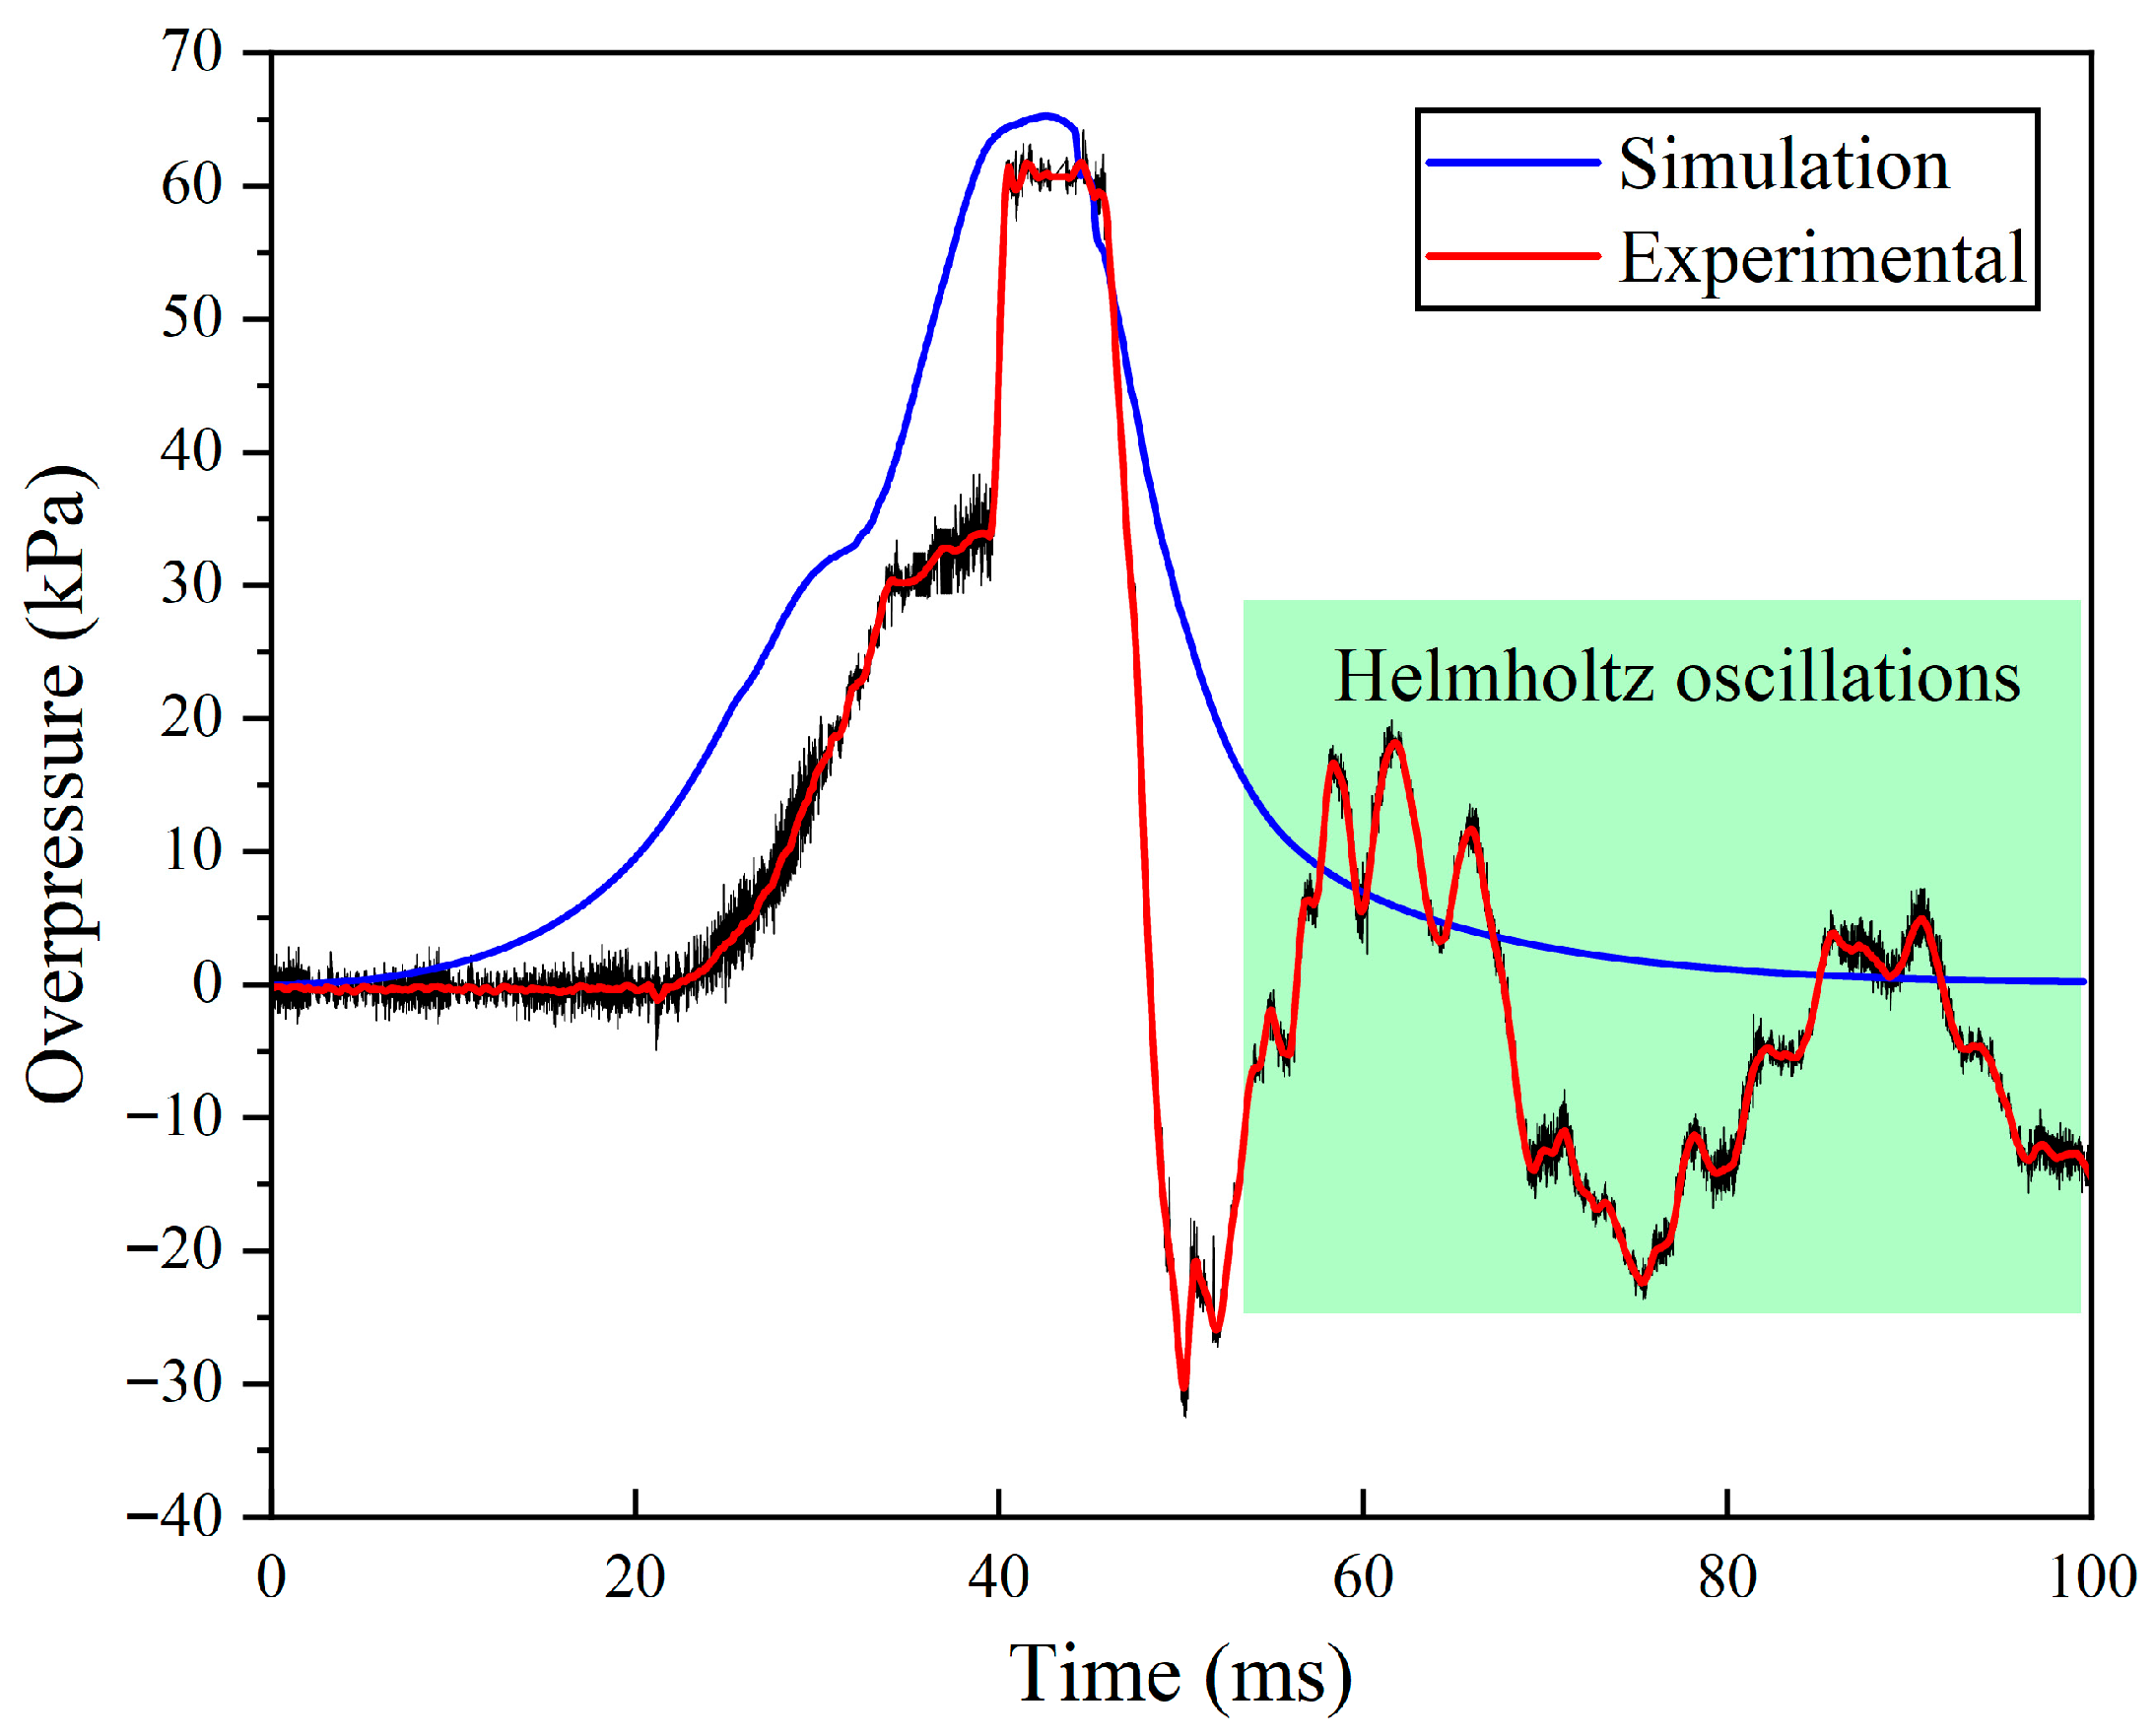
To validate the reliability of the simulation model, Figure 3 compares the overpressure curves from simulation and experiment under Operating Condition 2. The validation results are as follows: the maximum explosion pressure (Pmax) from simulation and experiment are 65.6 kPa and 62.4 kPa, respectively, with an error of only 4.90%. In engineering simulations, an error within 5% is generally considered acceptable, indicating that the model has high accuracy in predicting explosion intensity. The pressure fluctuation characteristics of both, such as the rate of pressure rise and the time of peak occurrence, are largely consistent, indicating that the model can accurately capture the dynamic evolution of the explosion process. Additionally, although the core parameters show high consistency, there are two significant differences between the two, with the specific causes and physical significance as follows: In the experiment, the pipe experienced Helmholtz resonance due to the vibration of the air column at the explosion vent, as marked by the green box in Figure 3. This is caused by the coupling between the pipe geometry and external acoustic wave excitation, causing the air column at the explosion vent to move back and forth like a piston, leading to periodic compression and expansion of the gas inside the pipe. In the simulation, to simplify the boundary conditions, the walls were set as “non-reflective boundaries,” ignoring the external acoustic wave excitation on the pipe, thus failing to reproduce this oscillation phenomenon. This difference is a minor deviation caused by the simplification of boundary conditions and does not affect the simulation of Pmax and the pressure-building stage. In the simulation, the walls were assumed to be “adiabatic boundaries,” ignoring heat loss through the walls. However, in the experiment, heat inevitably dissipates through the walls to the environment, especially during the later stages of the explosion, causing a slight decrease in actual pressure. Therefore, the simulated pressure curve is slightly higher than the experimental data overall. This discrepancy stems from the simplification of complex heat exchange processes, but its impact is small and does not alter the core trend of pressure changes.
Long et al. [41] conducted experiments at φ   =   1 and a methane/hydrogen volume ratio of 4:1. As shown in Figure 4, we numerically simulated its conditions and compared the simulated flame map with the experimentally derived flame map. The flame front structures of both configurations undergo six distinct stages—spherical flame, mushroom flame, twisted mushroom flame, finger flame, plane flame, and tulip flame—whereby the flame propagation characteristics demonstrate excellent agreement with experimental findings. This finding indicates that the numerical model employed in this study is capable of predicting methane/hydrogen explosion behaviors.
In terms of morphological characteristics, at 39.5 ms, the tulip-shaped flame front exhibits the typical morphology of “central contraction and lateral curling.” The edge of the flame front still exhibits slight fluctuations due to local turbulence, but overall maintains a symmetrical structure similar to that of a tulip flower. The angle between the flame front and the pipe wall is approximately 30°. At 50.75 ms, the slope-shaped flame: the flame front evolves into a gentle inclined interface with no obvious curling or fluctuations. The angle between the flame front and the wall increases to 70° and the brightness of the flame front significantly decreases, indicating a reduction in combustion intensity. In terms of formation mechanisms, when a tulip flame forms, the flame has already propagated to the middle to rear section of the pipe, with very little remaining unburned mixture. Local concentrations deviate from the stoichiometric ratio, leading to a decrease in overall reaction rate, changes in flame morphology, and slowed propagation speed. The “curling” of the tulip flame depends on the rapid replenishment of unburned gases in the local area, but fuel shortages in the later stages prevent this curling from being sustained, causing the flame front to flatten, resulting in a slope-shaped flame gradually. In terms of its impact on the explosion process, the tulip flame marks the transition from the “violent stage” to the “decay stage” of the explosion, indicating that combustion is entering its final phase, with energy release becoming uniform and weak, and pressure inside the pipe stabilizing. Ultimately, the flame within the pipe completes the combustion of the remaining mixture at a low rate until the explosion process concludes. From this, the evolutionary patterns of the two flame morphologies can be utilized to assess the decay characteristics of explosion intensity for methane/hydrogen mixtures in confined spaces, providing a reference for pipeline explosion-proof design.

4. Results and Discussion

4.1. Effect of Bend Distance Configuration on Pressure Characteristics

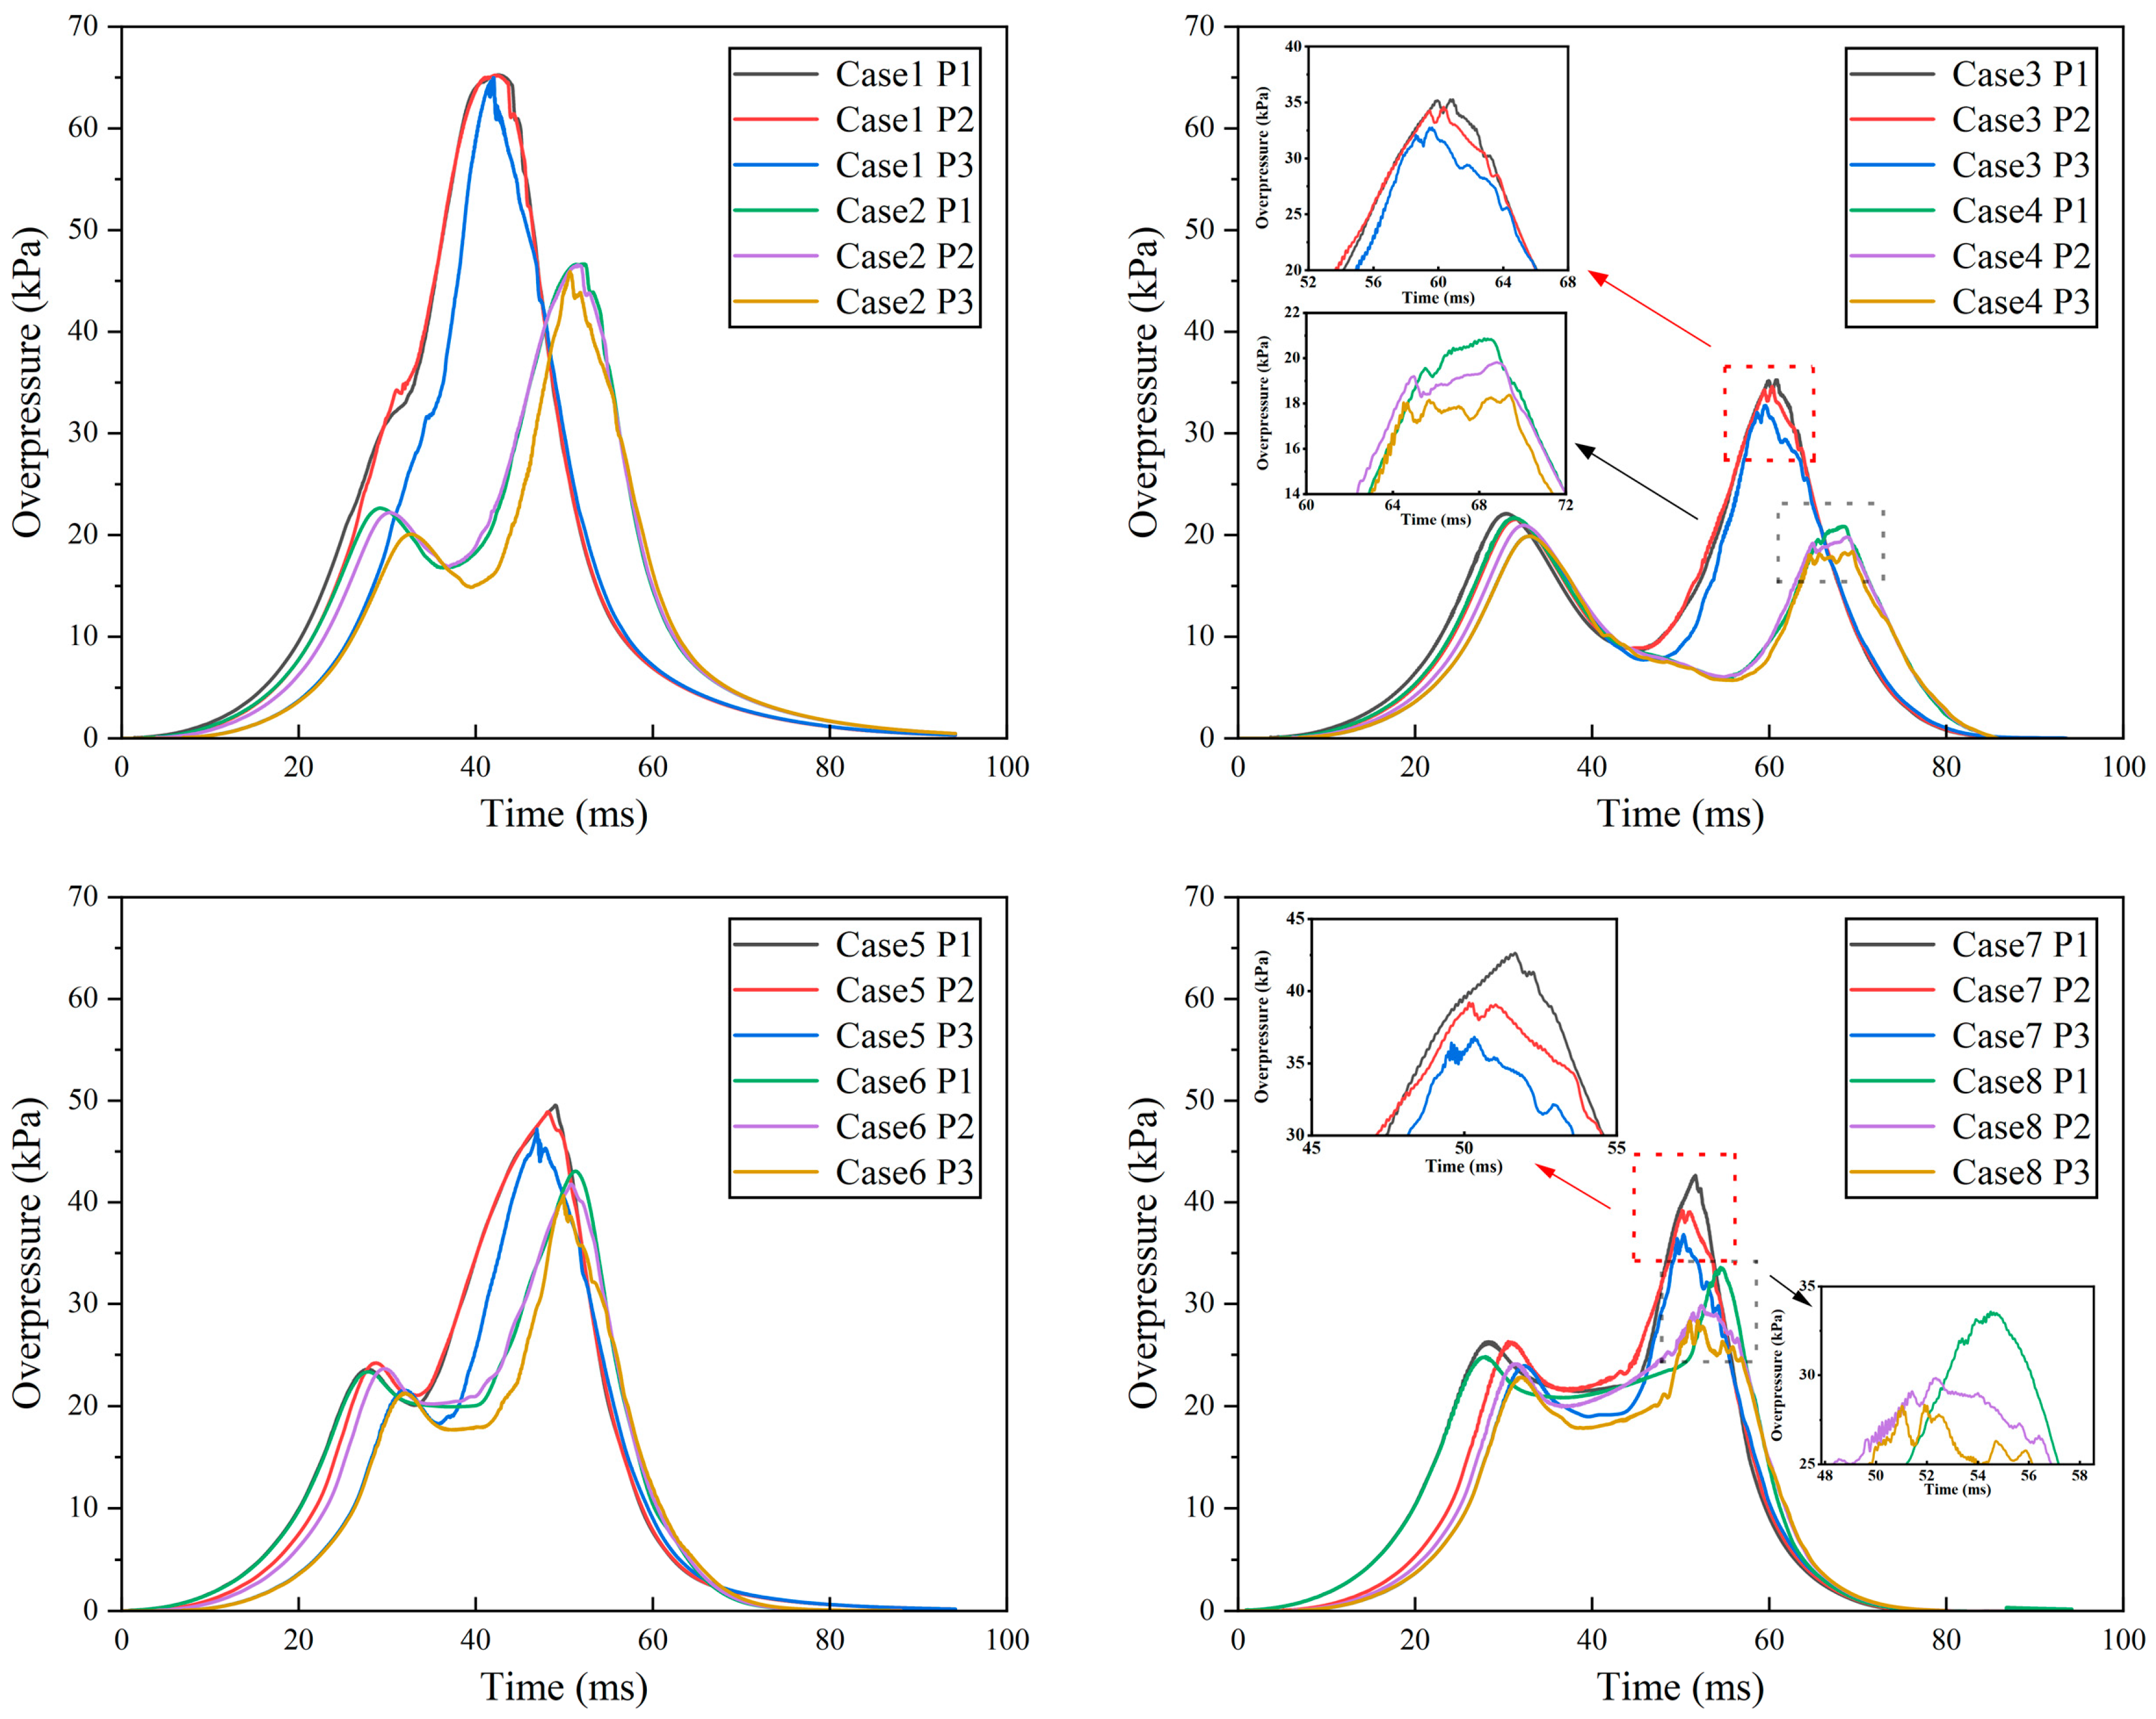
The explosion pressures obtained at the three pressure monitoring points for each operating condition are given in Figure 5. The pressure evolution patterns are overall similar, with all four phases of rapid growth, rapid decline, secondary acceleration, and secondary decline, and all have two peaks.
Upon initial ignition, a flame nucleus is generated owing to the presence of a weak flame, during which the spherical flame propagates at a slow rate and progressively expands outward. Overall, the flame remains free of collision with the sidewall and bends, with the flame front velocity exhibiting near-constant behavior during this phase [10]. As a result, the trend of pressure change for all conditions is almost the same until 25 ms. After a period of propagation, the pressure increases rapidly until it reaches a peak. We observed a small oscillation from Case 3 to Case 6 at the second peak. Upon comparison, it was found that the data differences between the three pressure monitoring points were small. Therefore, the data from monitoring point P1 will be used in the following for the specific analysis of peak pressure and explosion time.

4.1.1. Effect of Distance from Bent Pipe-1 to Ignition Source on Pressure

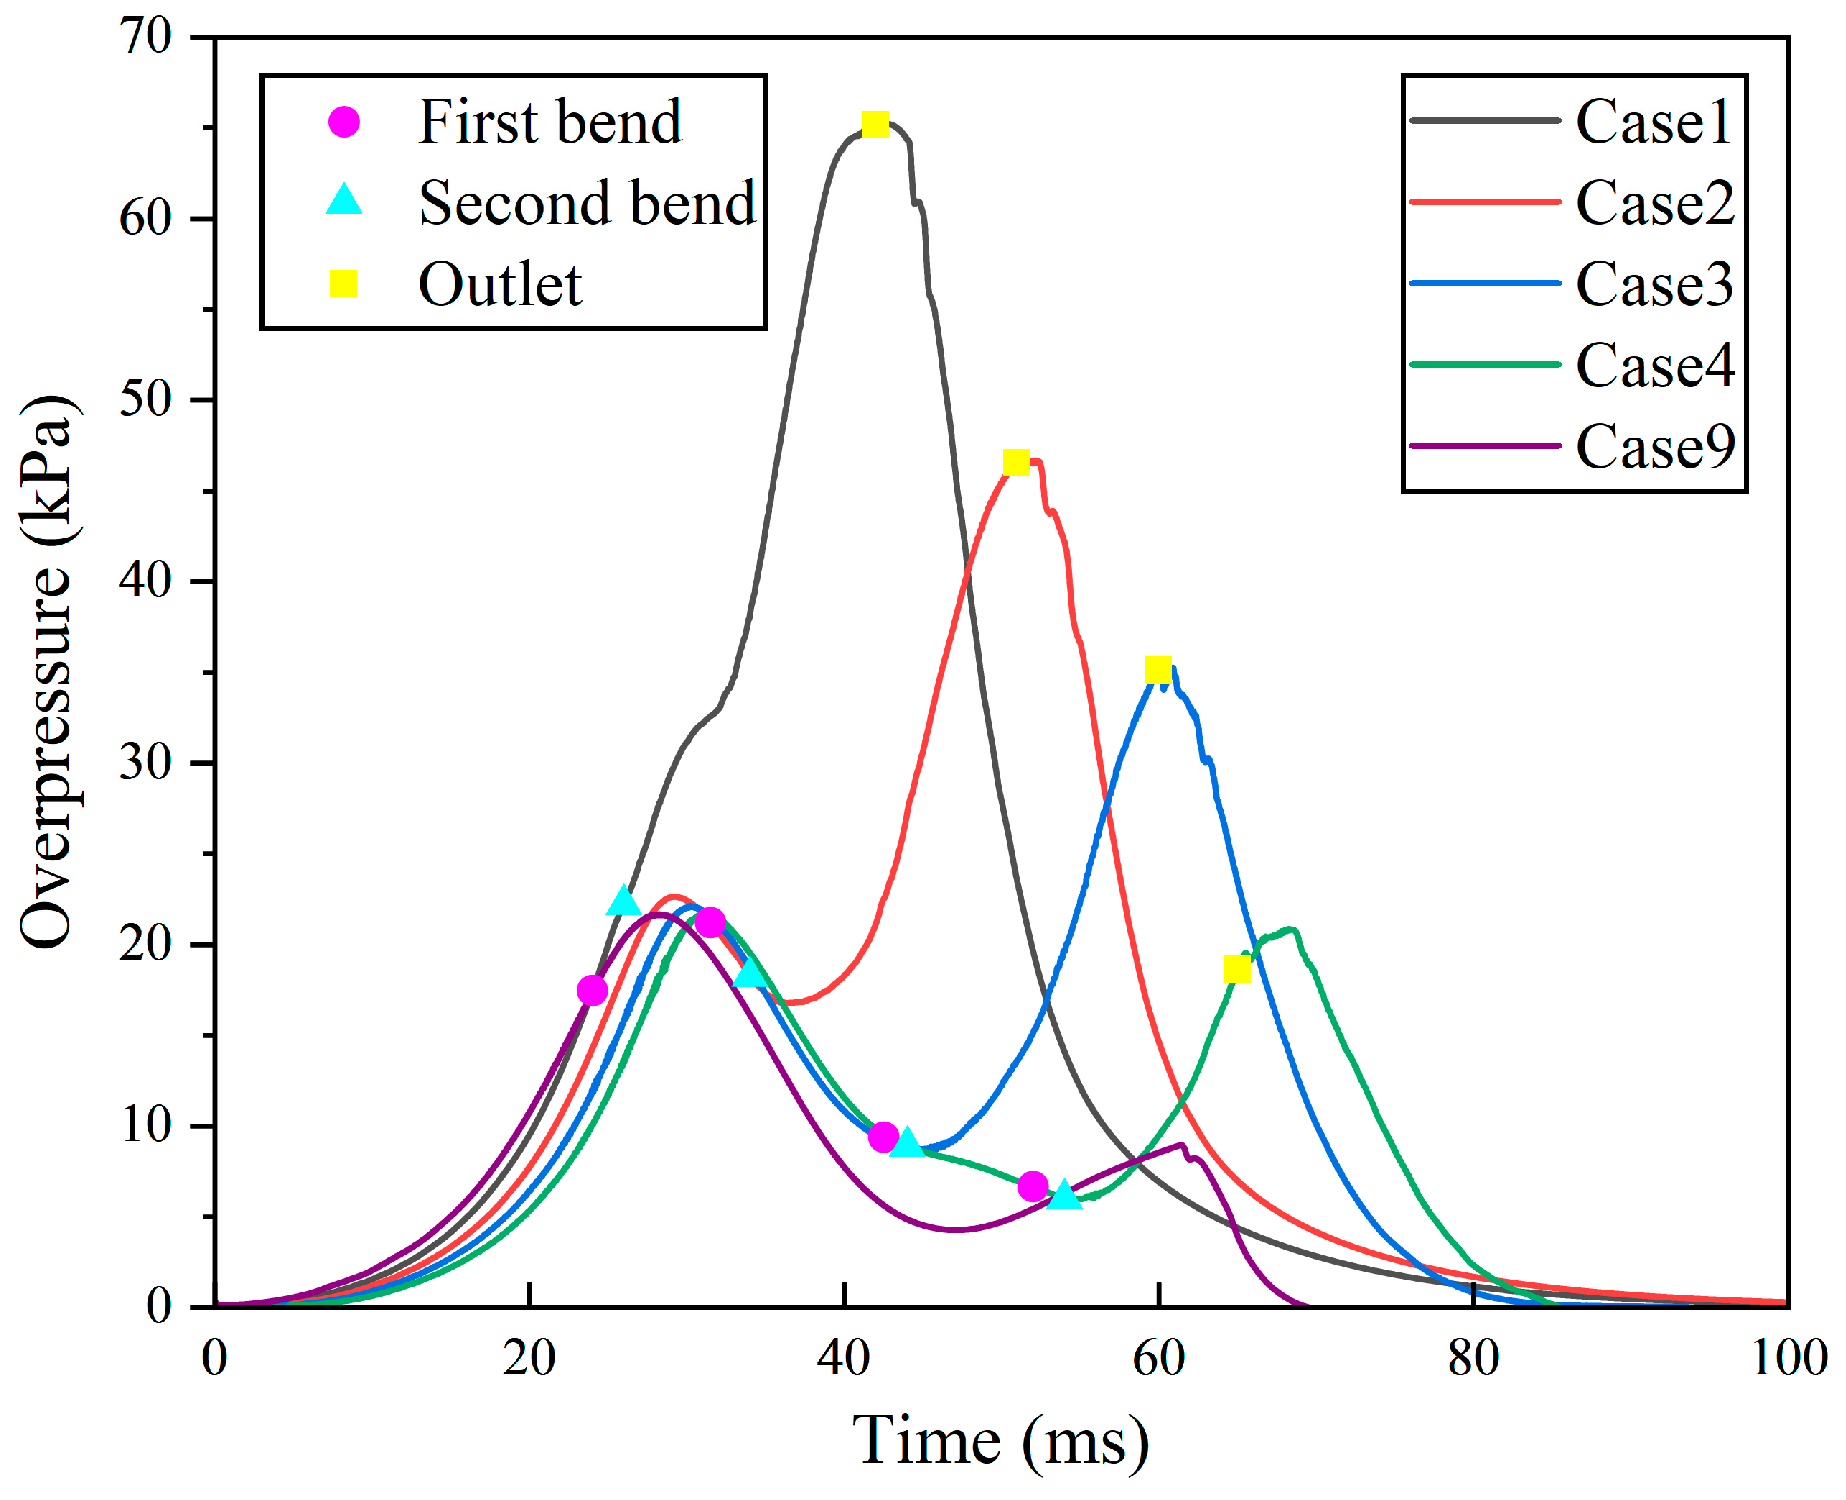
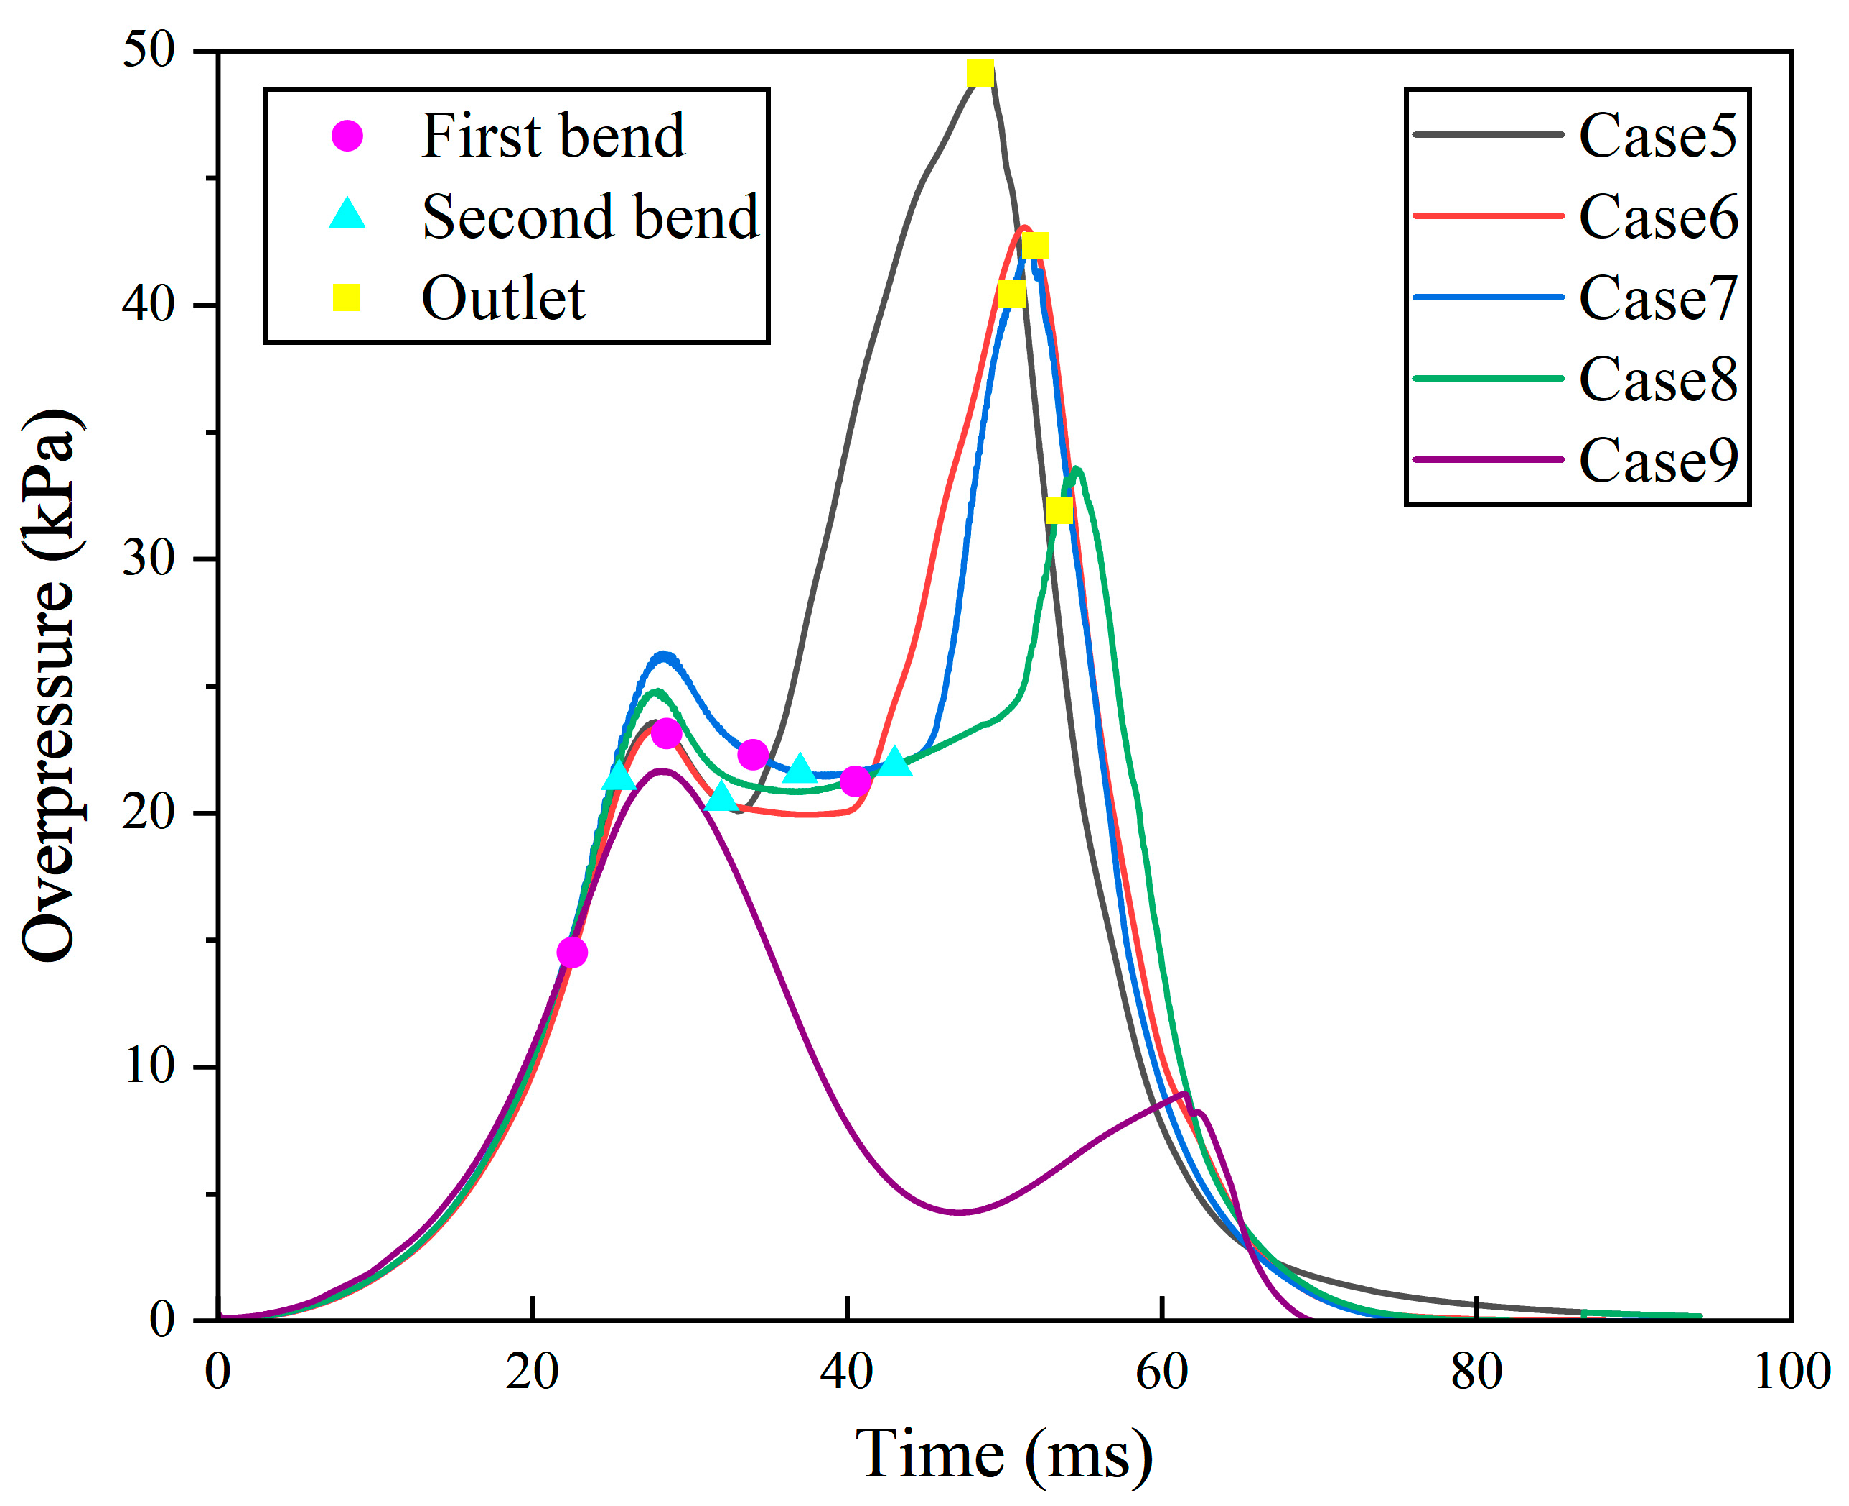
Figure 6 shows the explosion pressures at the P1 monitoring point from Case 1 to Case 4 and Case 9 obtained by the large vortex simulation. Three key points are clearly labelled in Figure 6: “First bend” (flame front arriving at bent pipe-1), “Second bend” (flame front arriving at bent pipe-2), and “Outlet” (flame front arriving at explosion relief). Pmax is the maximum explosion pressure, which can be of great interest as a key indicator of explosion hazard. The bent pipe structure significantly increases the explosion strength, with peak explosion pressure Pmax-2 increased by 625%, 431%, 300%, and 137% from Case 1 to Case 4, respectively, compared to a straight pipe. When the methane/hydrogen premixed gas was ignited, the combustion products expanded rapidly, resulting in a sharp pressure climb. During the 28 ms ≤ t ≤ 33 ms period, Cases 2 to 4 all showed a large pressure peak, in contrast to Case 1, which only showed a small peak at 24 ms ≤ t ≤ 26 ms. In addition, after the peak, the pressure in Case 1 did not decrease, but the growth rate slowed down, whereas Cases 2 to 4 all showed a large pressure drop, and with the increase of D1, the pressure drop became more and more significant and close to the pressure valley. This phenomenon suggests that Cases 2 to 4 in the flame front reach the bent pipe-1 before the explosion occurs, and the pressure quickly decreases. The first overpressure peak is attributed to exhaust port rupture or flame discharge [23]; furthermore, a larger D1 corresponds to a more pronounced pressure relief effect.
The Pmax-1 of Case 1 was 32 kPa. Compared with the Pmax-1 of Case 2 to Case 4, it is 42.4%, 45.9%, and 49.1% higher, respectively. The Pmax-2 of case 1 was 65.2 kPa, which was 40%, 86%, and 213% higher compared with the Pmax-2 of Cases 2 to 4, respectively. This is because D1 is the smallest in Case 1 and the flame can contact the bent pipe-1 and bent pipe-2 in a very short time with little heat transfer loss. This triggers more intense turbulence, resulting in much higher Pmax-1 and Pmax-2 pressures than the other conditions. Reaching the nadir at bent pipe-2, the flame front triggers ignition of the localized unburned gas, thereby intensifying the combustion reaction and inducing a subsequent pressure surge that manifests as Pmax-2 at the vent.

4.1.2. Effect of Distance Between the Bent Pipes on Pressure

Figure 7 presents the explosion pressure curves of Cases 5 to 8 obtained from the large vortex simulation at the P1 monitoring point. All four sets of cases start to deflate at the moment of 28 ms, in which Case 5 and Case 6 have the same deflagration pressure, Case 7 has a slightly higher deflagration pressure, and Case 8 has the highest deflagration pressure. This indicates that the distance configuration of Case 7 in the pre-explosion overpressure accumulation is the most advantageous. The Pmax-2 is enhanced by 463%, 389%, 385%, and 281% from Case 5 to Case 8 compared to the straight pipe. Therefore, Pmax-2 and D2 in the pipe do not show a simple positive correlation, which makes the prediction of pressure difficult. A 90° bend has been demonstrated to exhibit effects equivalent to those of baffled barriers with blockage ratios of 10–20%, as evidenced by their comparable influence on overpressure and flame propagation. At this point, the pipe is equivalent to a relatively enclosed space and some of the excitation waves are reflected as they reach the bent pipe-1 [42]. When D2 exceeds 400 mm, there is a small decrease in pressure in the pipe; on the contrary, when D2 is small, straight pipe-3 creates a longer closed acceleration space, which in turn allows Pmax-2 to reach higher values.
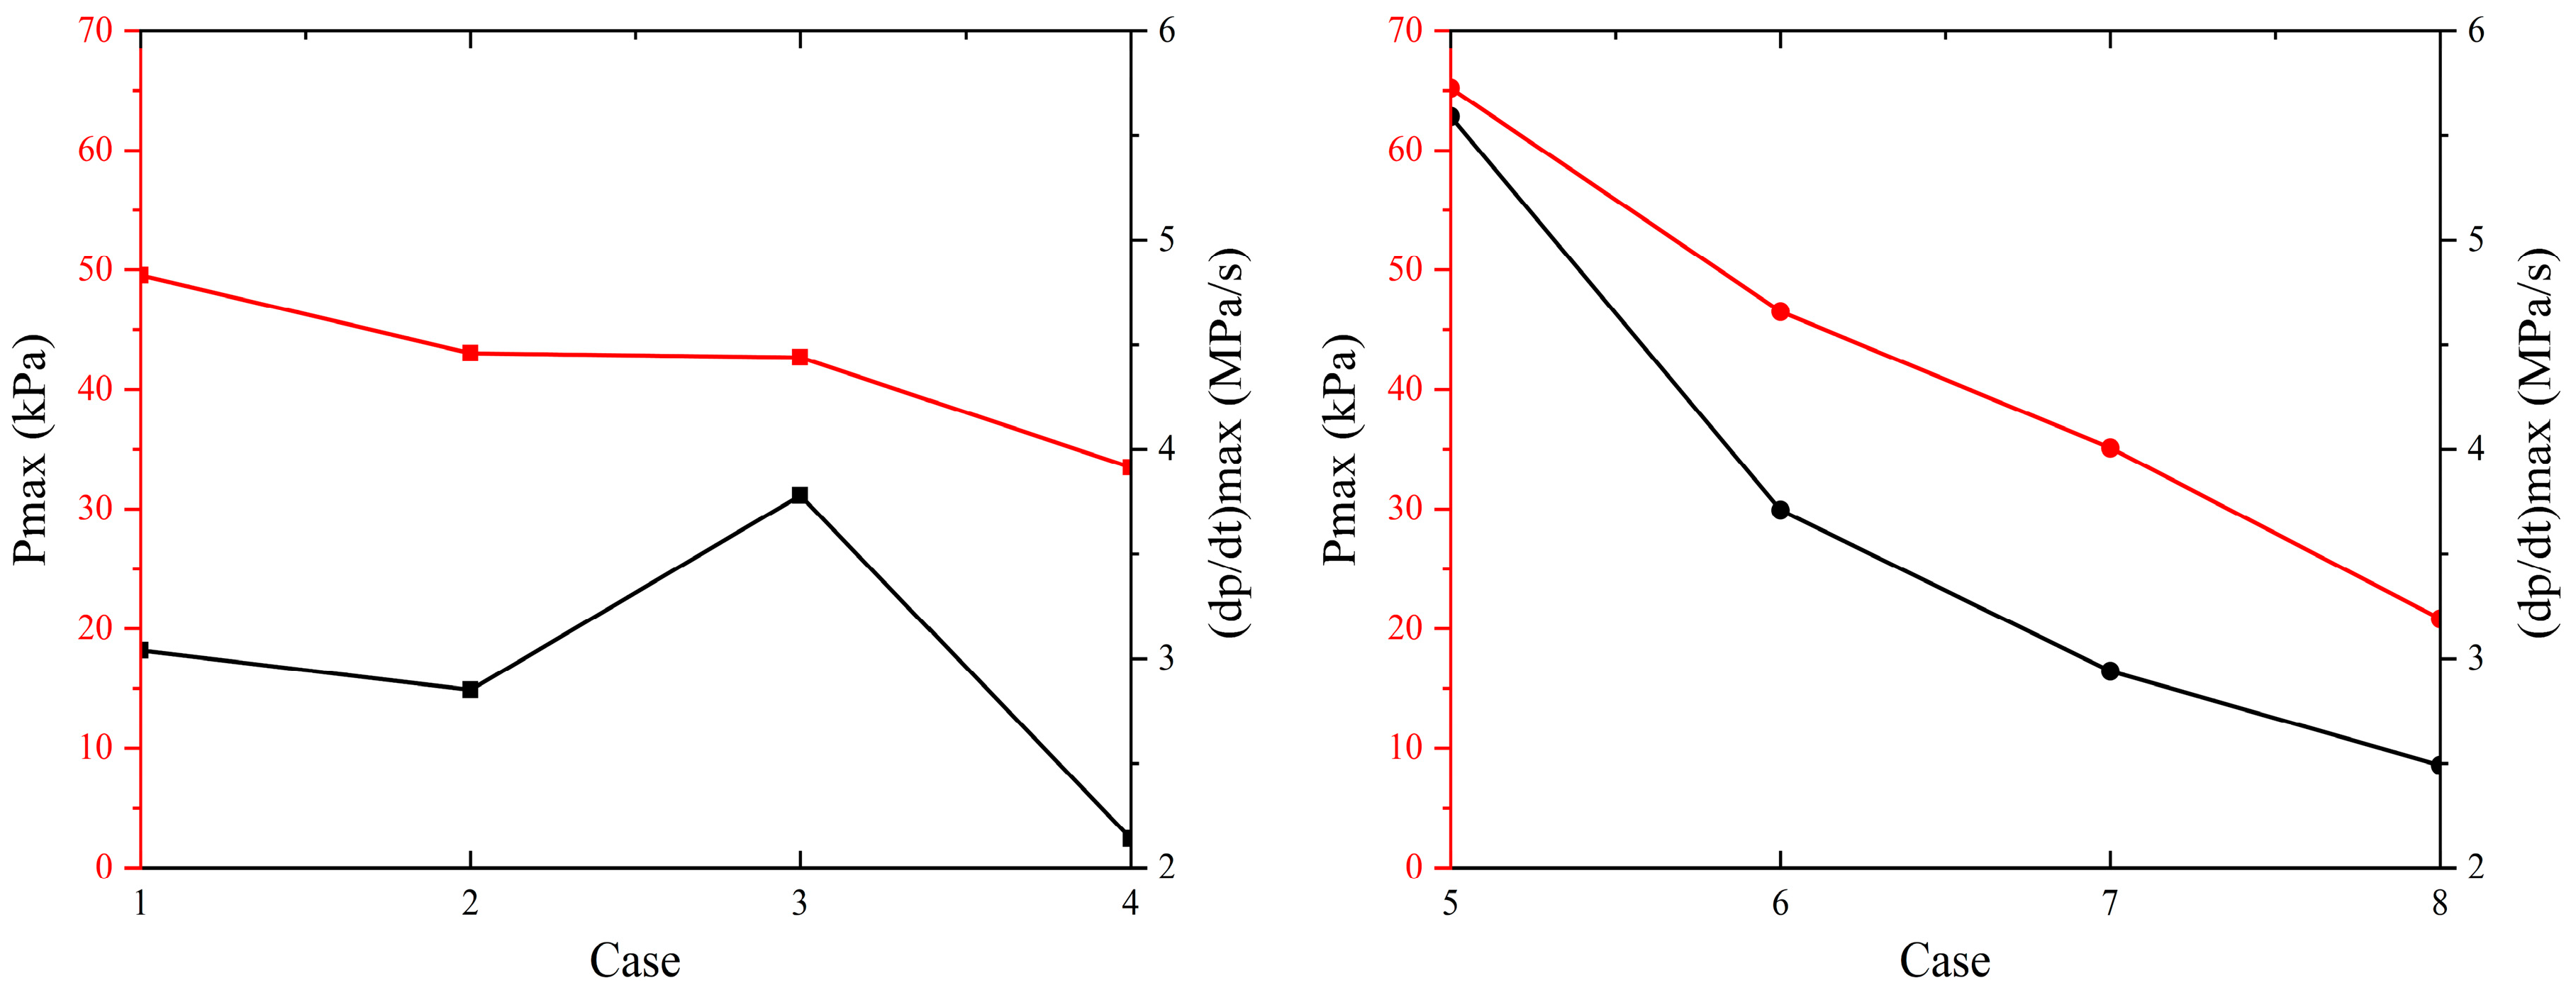
Compared to a straight pipe, the presence of a bend reduces the excitation wave reflection distance and augments both the frequency and amplitude of overpressure oscillations, thereby intensifying the dynamic loading on structural components [29]. Figure 8 shows the Pmax and (dp/dt)max at P1 for Cases 1 to 8 obtained based on large eddy simulations. Compared with the simulation results of Cases 1 to 4, the Pmax-2 of Cases 5 to 8 did not show a significant gradient change characteristic. It was found that the values of Pmax-2 from Cases 5 to 8 were 49.6, 43.1, 42.6, and 33.6 kPa, respectively. Taking the Pmax-2 of Case 5 as a reference, the Pmax-2 of Cases 6 to 8 decreased by 6.5, 6.9, and 16.0 kPa, respectively. In Case 8, the flame travelled the longest length of wall to the bent pipe-2. With most gas consumed during flame propagation along the pipe wall, the energy available for sustaining the second overpressure surge is significantly diminished, leading to reduced pressure amplification. It can be seen that increasing the length of D1 and D2 can both reduce the explosion pressure, and generally, increasing the length of D1 has a more significant pressure reduction effect.
The derivative dp/dt, denoting the rate at which pressure increases, is a parameter that pertains to temporal behavior. From Figure 8, relative to the straight pipe’s (dp/dt)max-2 of 0.45 MPa/s, Cases 1 to 8 show marked enhancements—1142%, 724%, 553%, 453%, 578%, 529%, 738%, and 371%, respectively, highlighting the significant impact of geometric modifications. Overall, the increase in (dp/dt)max was about two times that of Pmax. As D1 increased for Cases 1 to 4, the chain decay rate of (dp/dt)max showed a progressive reduction, with decline rates of 51%, 26%, and 18% observed sequentially. This phenomenon indicates that the effect of this distance factor on (dp/dt)max gradually decreases as D1 increases. Complex phenomena such as reflection, refraction, and bypassing occur when the wave propagates through a pipe and encounters a bend [29]. A shorter D1 enables the wave to gain higher initial energy, resulting in vigorous interaction with bent pipe-1 and a more significant pressure rise rate. By contrast, as D1 increases, the explosion wave inside the pipe undergoes repeated interactions with the wall and bends, leading to modifications in wave structure and energy distribution patterns. At this time, the explosion wave and the bent pipe-1 of the interaction strength gradually tend to stabilize, and thus the impact on the (dp/dt)max is also gradually reduced. The special points from Cases 1 to 4 in Figure 8 were selected for curve fitting and Figure 9 and the following equations were obtained:
Pmax = 0.036 Dis + 78.055 ,
( dp / dt ) max = 9.256 7.176 [ 1 exp ( Dis / 559.527 ) ] ,
In Equations (7) and (8), Dis represents the distance (in mm) from bent pipe-1 to the ignitor.
In Case 7, the (dp/dt)max increased abruptly and the (dp/dt)max of Case 7 was higher by 0.72 MPa/s, 0.94 MPa/s, and 1.65 MPa/s compared to Case 5, Case 6, and Case 8, respectively. Due to the higher relief pressure of Case 7, even if D2 is larger, it is still able to trigger a significant sudden change in pressure.

4.2. Effect of Bend Distance Configuration on Flame Morphology

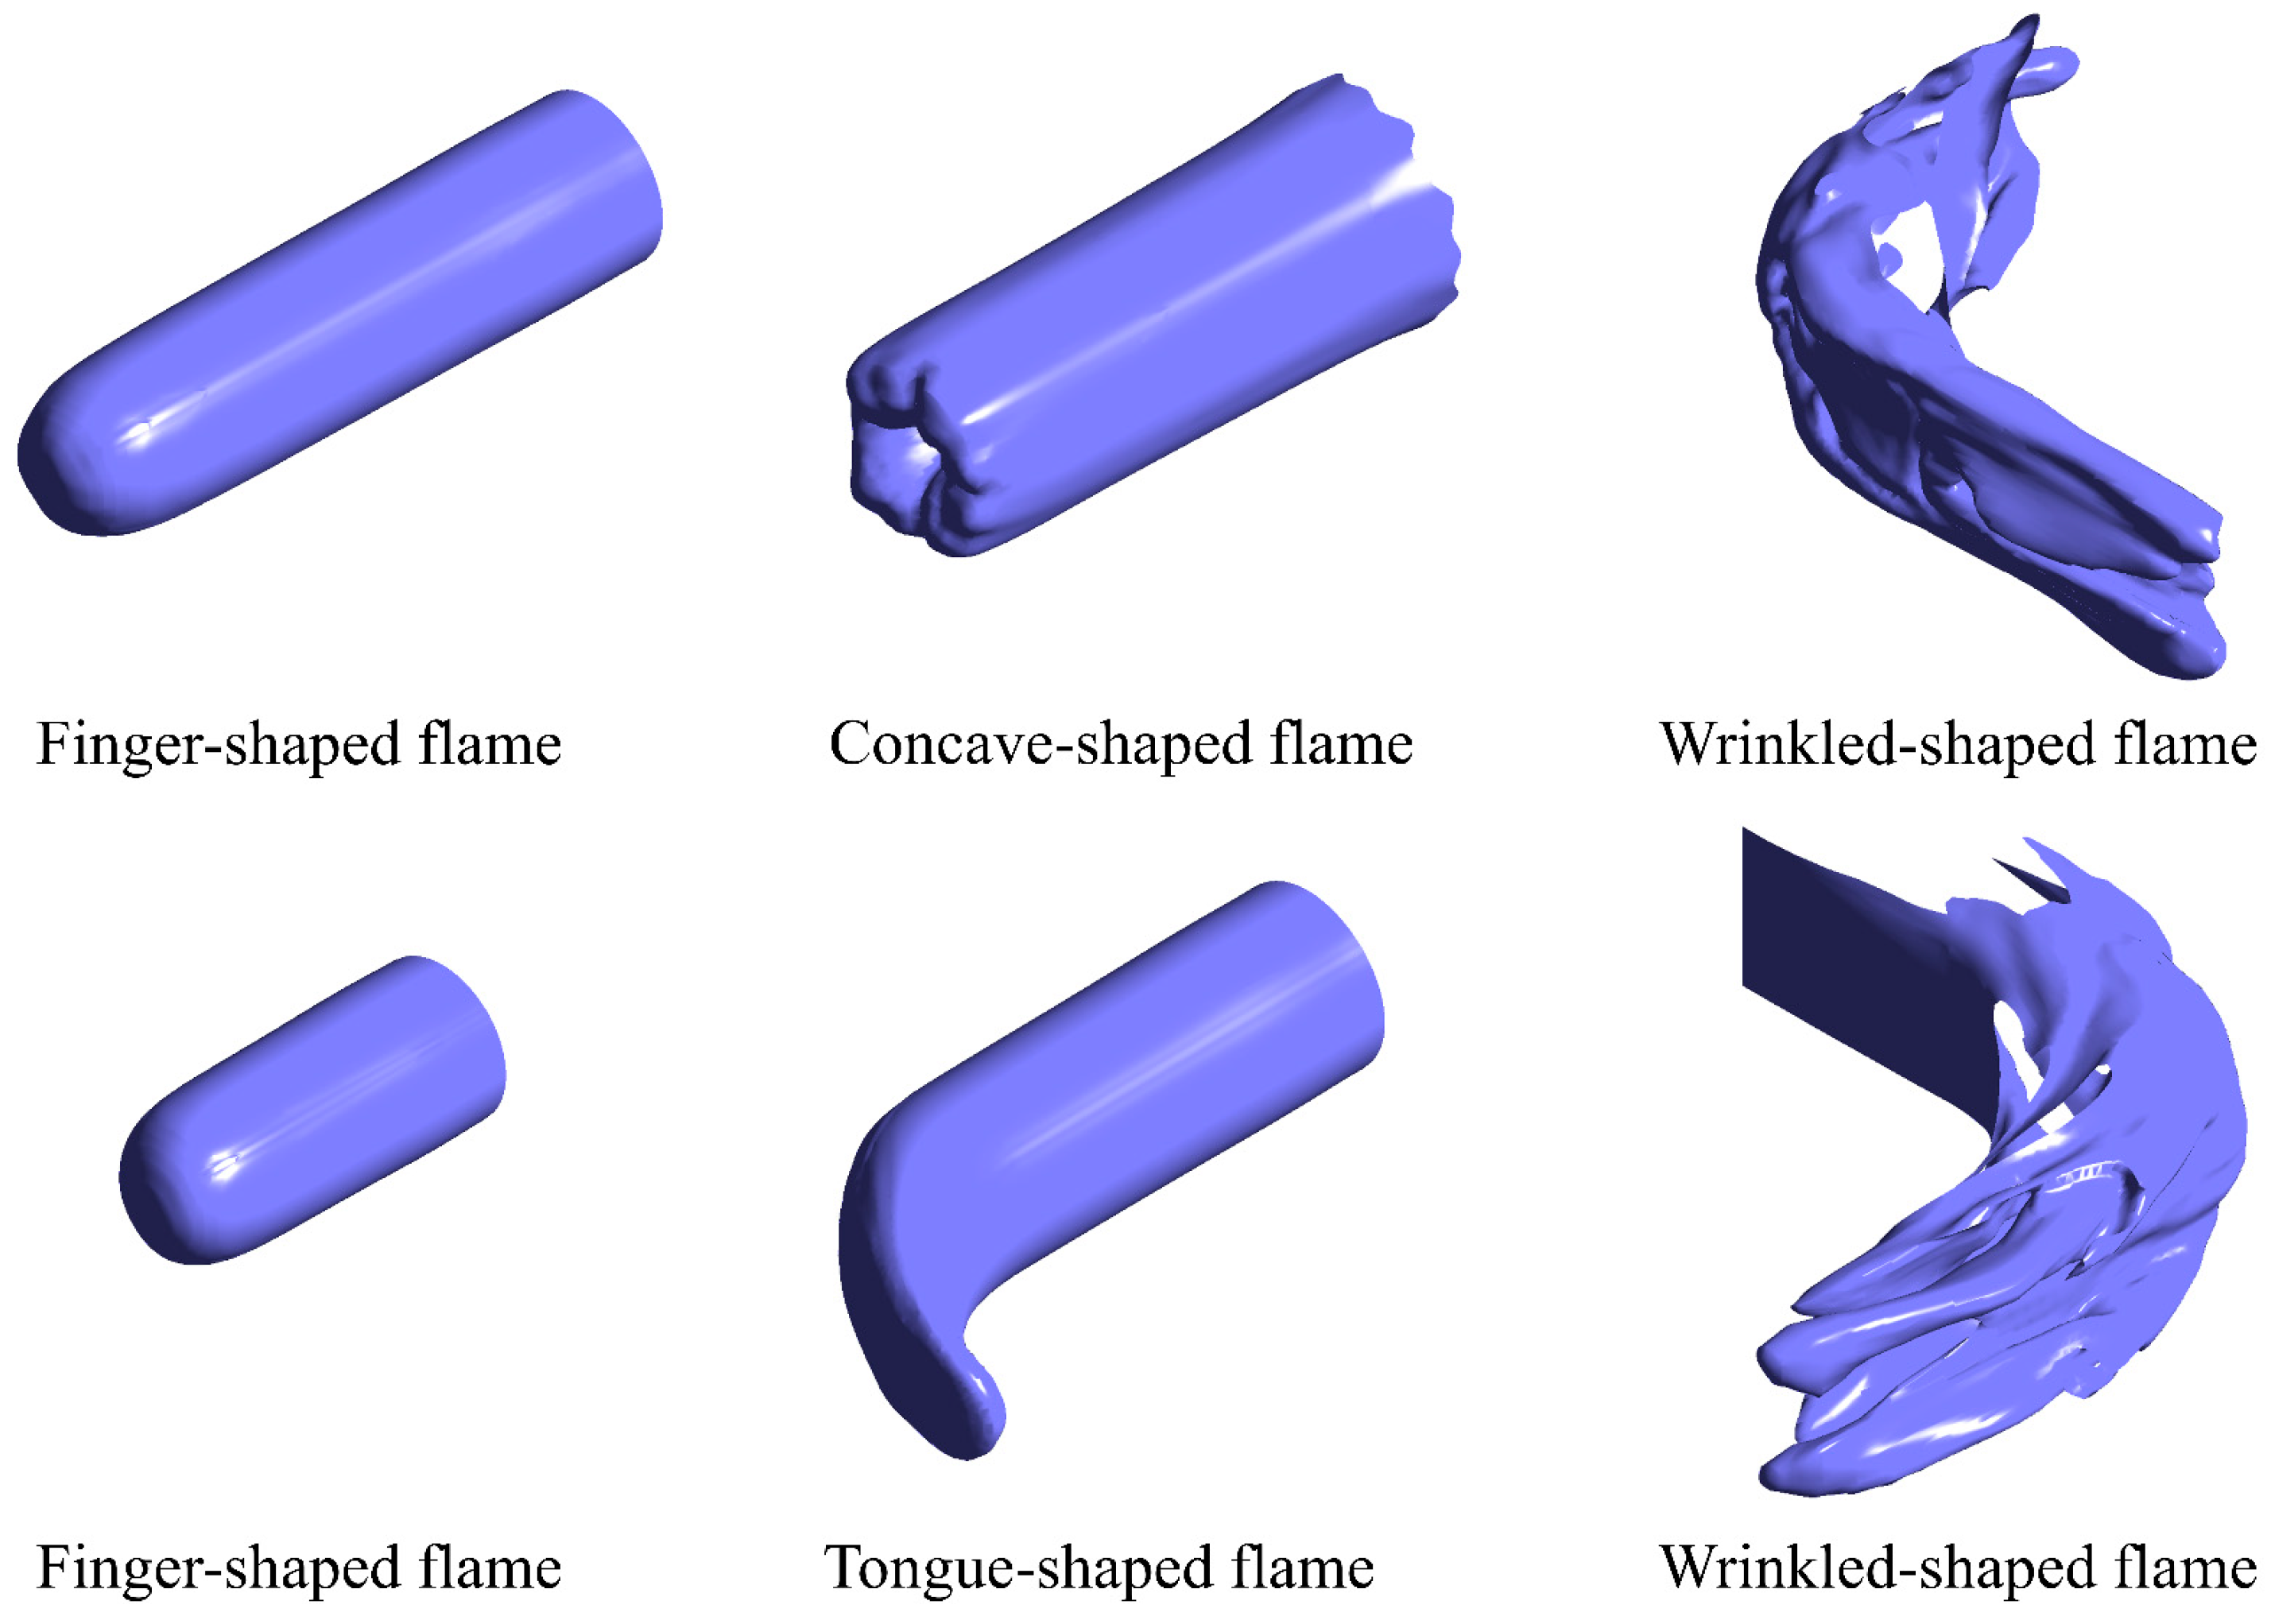
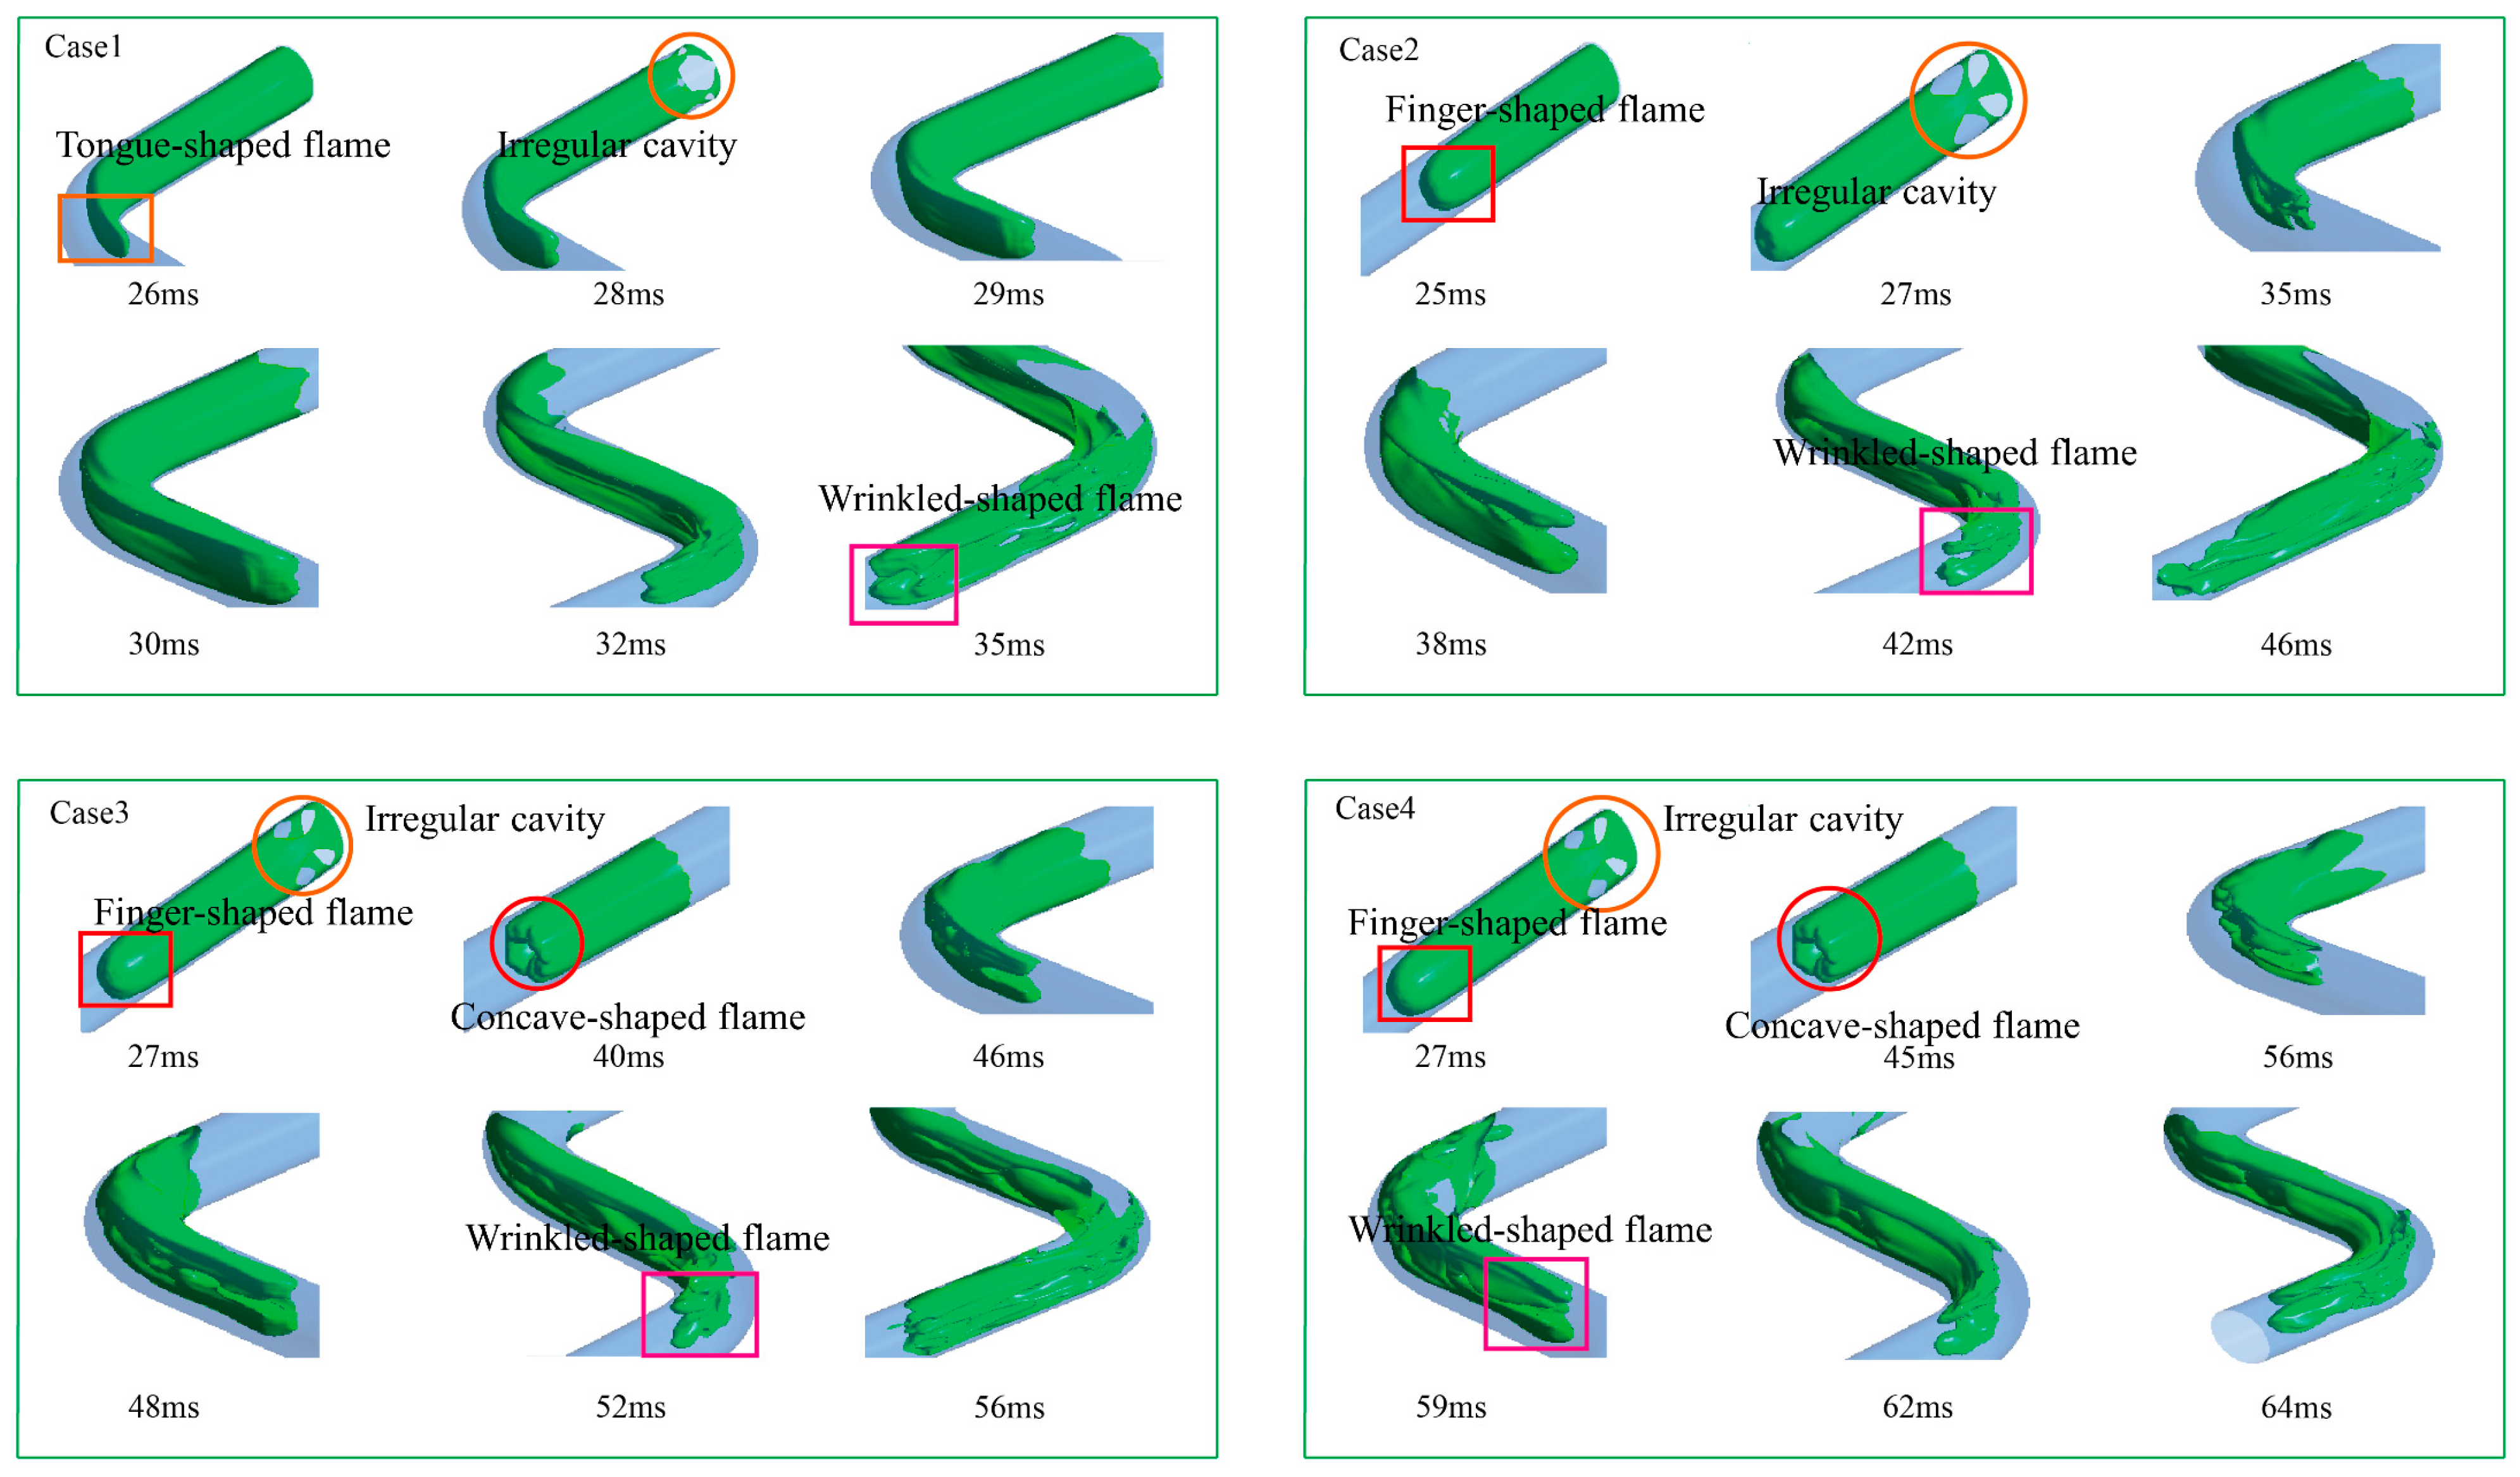
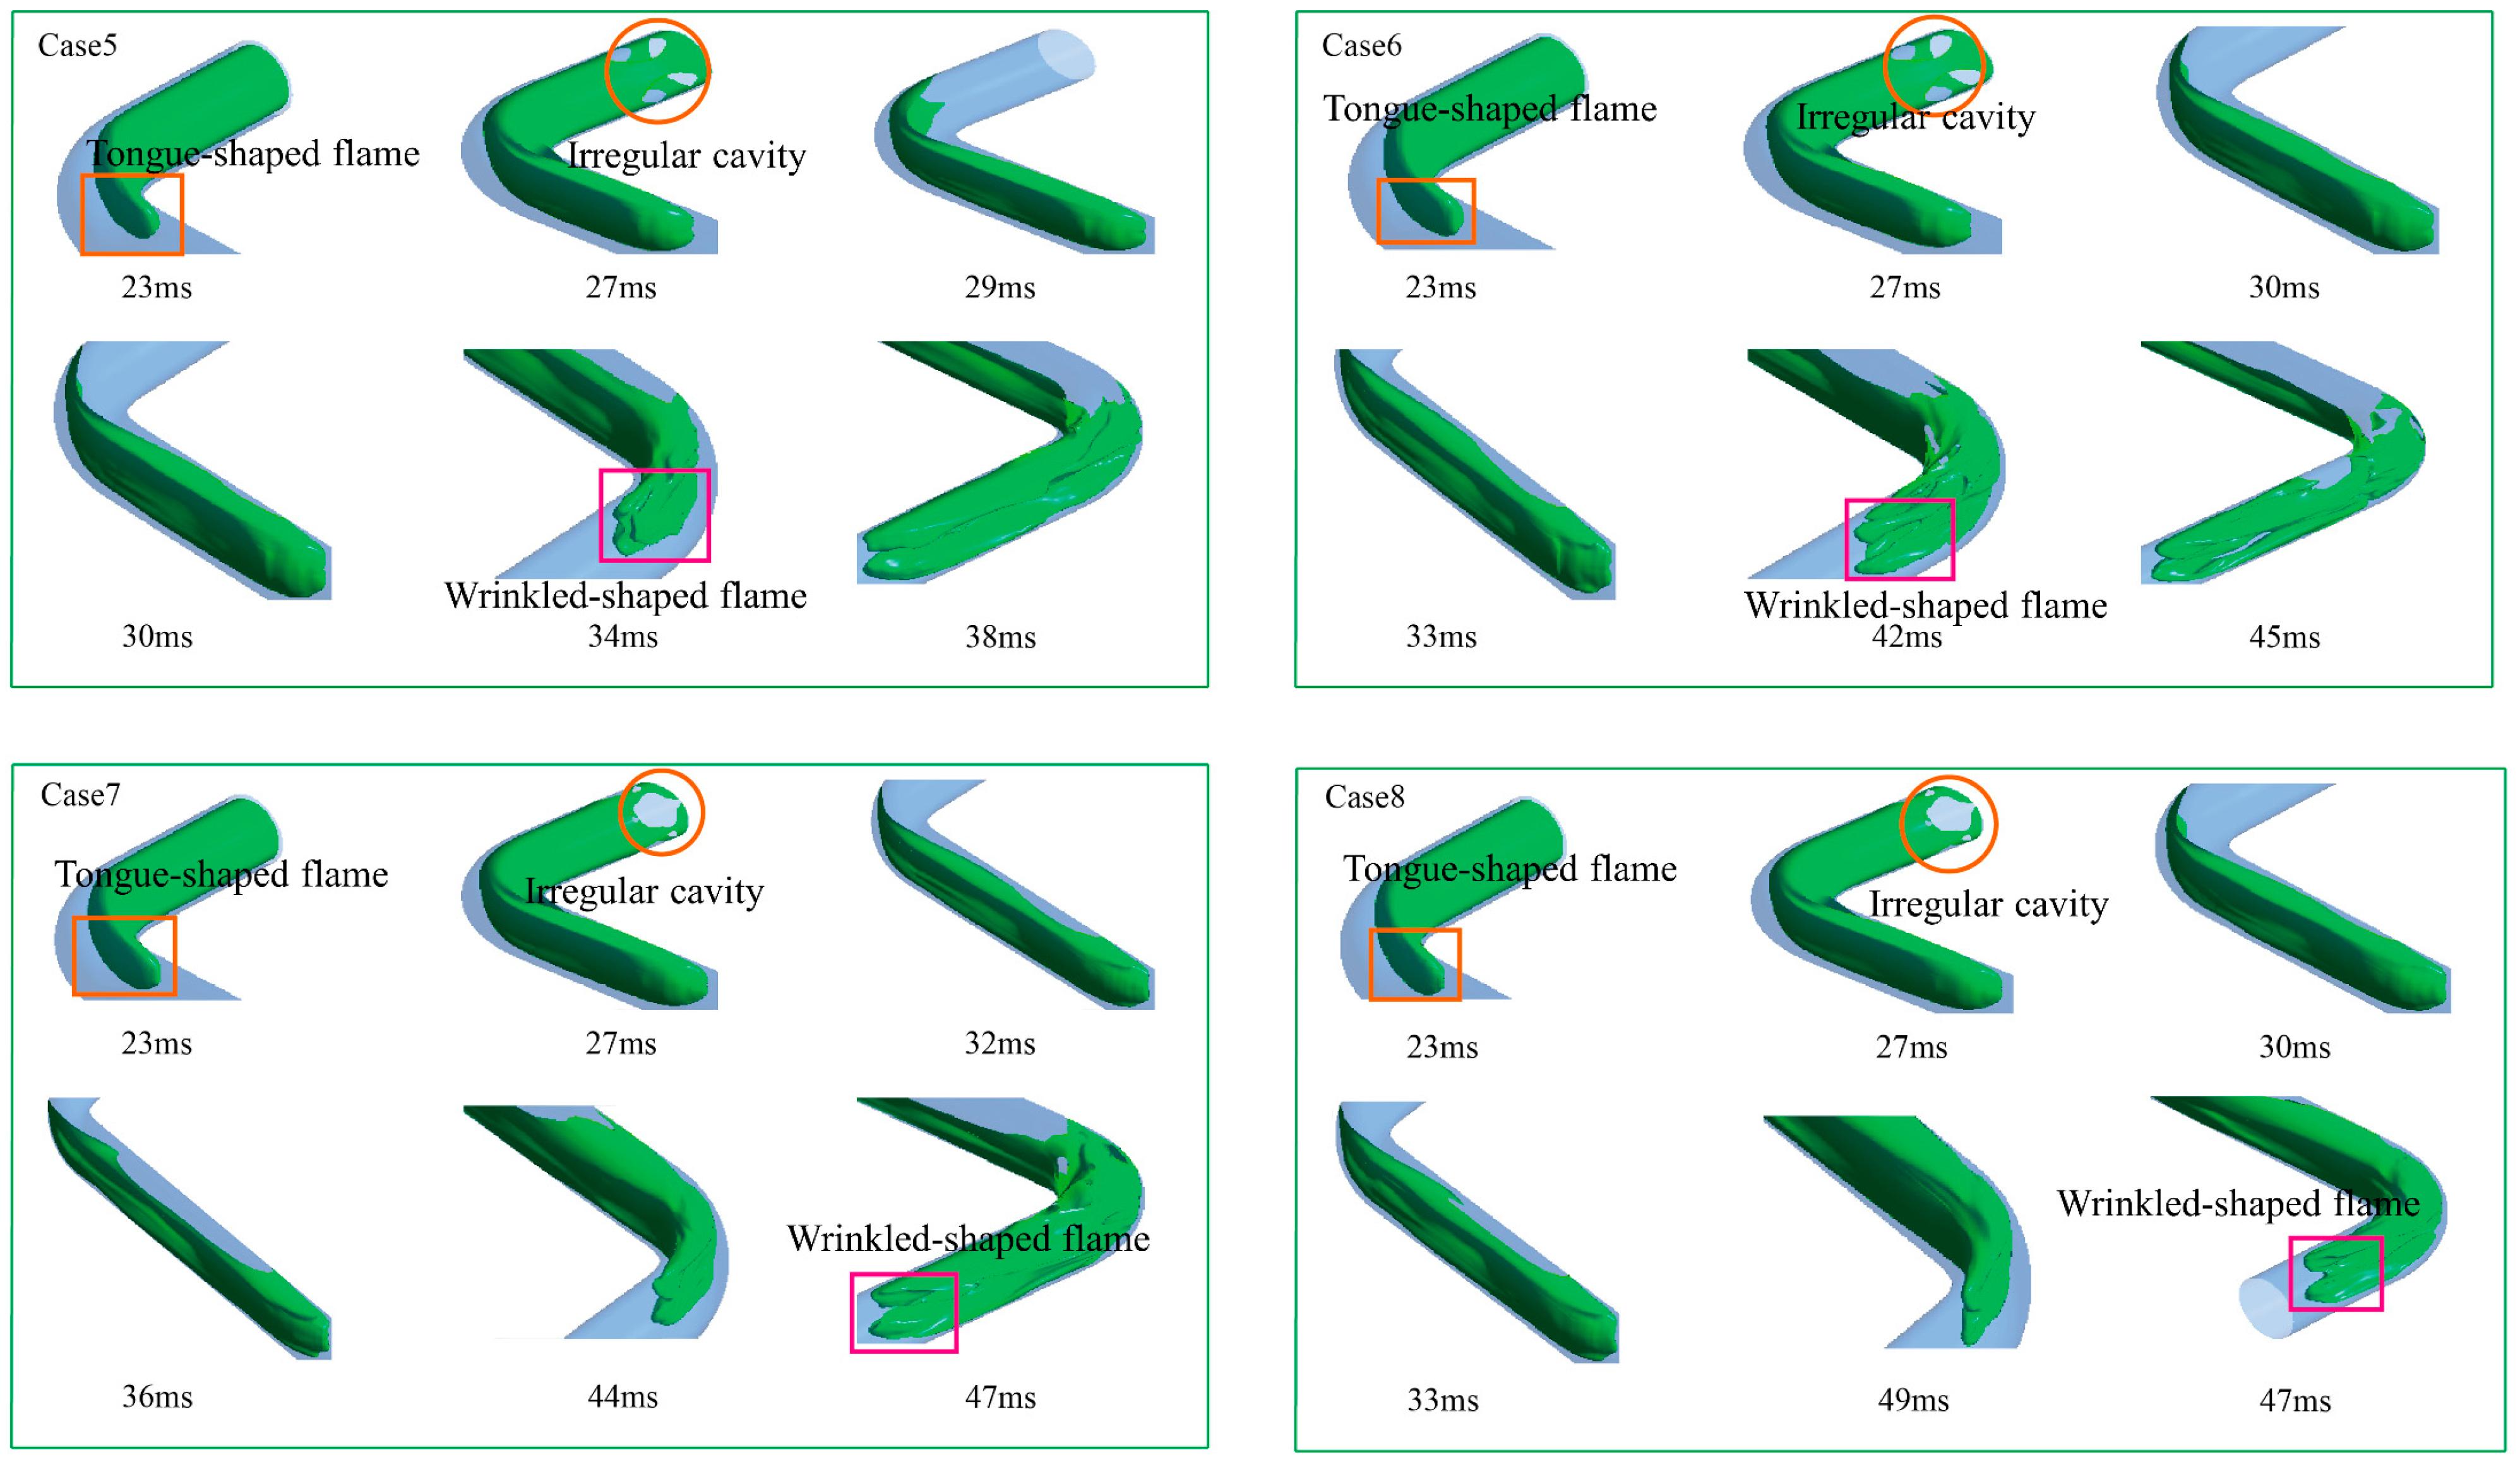
Many scholars have investigated the changes in flame morphology and found that highly inhomogeneous fuel/air mixtures ignite with a hemispherical flame that evolves to a triple flame (the flame front has three layers of flame contours). In contrast, in highly homogeneous hydrogen/methane/air mixtures, finger-like and tulip-like flames appeared sequentially [34]. In contrast, the flame structure of the mixture formed by pure syngas and air showed hemispherical, finger-like, and slope-like propagation patterns. When the methane concentrations were 30%, 50%, and 70%, respectively, the flame structure further presented flat, tulip, and twisted tulip shapes [43]. In order to see the flame transition more clearly, we removed the pipe body and retained only the flame process, as shown in Figure 10. Depicting the flame front propagation across configurations with different conditions, Figure 11 and Figure 12 illustrate the dynamic behavior of flame fronts in varied geometric set-ups. Before reaching the bent pipe-1, the flame front propagates through a straight section. During this period, the flame takes on a “finger-shaped” (Case 2, for example, is shown as a solid red rectangle and is only labelled as such to avoid redundancy), with the flame front accelerating preferentially along the centerline of the pipe attributable to the confining influence of the sidewalls [28]. “Finger-shaped” flames are the typical form during the acceleration stage of straight pipe sections. The flame front exhibits a sharp “finger-like” protrusion, with the tip extending along the pipe’s centerline, while the edges on both sides remain relatively smooth. At this stage, the angle between the flame front and the pipe wall is approximately 20°, with overall good symmetry. When the flame gradually separates from the ignition source, an “irregular cavity” appears at the ignition source (shown as a solid orange circle).
In the smaller D1 condition, the flame front propagates along the inner (convex) wall of the bend and is stretched by the bend, creating a “tongue-shaped” flame (shown as a solid orange rectangle). “Tongue-shaped” flames represent a transitional form under the stretching of the convex wall in bent pipes. The flame front spreads out in a “tongue-like” shape, with a rounded tip that curves toward the inner wall (convex wall) of the bent pipe. The overall shape resembles a tilted tongue, with high adhesion between the flame front and the convex wall, and the angle increases to 50°. Under the condition of a larger D1, flame front indentation starts to emerge as the flame front approaches the bent pipe-1. This phenomenon is attributed to bend-induced disturbance and excitation wave reflection between pipe walls, whereby the flame front is deflected toward the pipe centerline, culminating in the formation of a “concave shape” (as denoted by the red circle). A concave flame is a local suppression pattern caused by shock wave interference in bent pipes. The core feature of a concave flame is a distinct “concave” structure at the center of the flame front, where the front recedes backward near the centerline of the pipe while the edges on both sides continue to advance. The angle between the flame front and the pipe wall is asymmetrically distributed, with the central angle at approximately 20° and the angles on both sides at approximately 50°.
Additionally, for larger D1 values, the flame front propagates along the inner wall upon passing through bent pipe-1; rather than forming a “tongue-shaped” flame, it develops an inclined tip with a “crease,” as indicated by the solid magenta rectangle. This is because the flame front undergoes an acceleration process over a longer straight section of pipe before reaching the first bend. The flame combustion state evolves from laminar to turbulent regimes. The transformation of the flame into a “wrinkled-shaped” configuration is attributed to two key factors: enhanced turbulent effects and non-uniform combustion rates of the mixture [44]. The flame front is creased as it crosses the bent pipe-2 under all conditions. The primary distinction between the conditions lies in the inverse relationship: as D2 increases, the flame front exhibits fewer creases. Induced by flame front corrugation, further flame acceleration occurs alongside the formation of intense pressure waves, highlighting the coupling effect between flame morphology and pressure dynamics [45]. The “wrinkled-shaped” flame is a severely deformed form resulting from strong turbulence and shock wave reflection. The flame front is covered with irregular wrinkles, the tip is fragmented and tilted, and the edges exhibit numerous branches and curls. The angle between the flame front and the pipe wall is disordered at 70° and the overall structure exhibits high asymmetry.
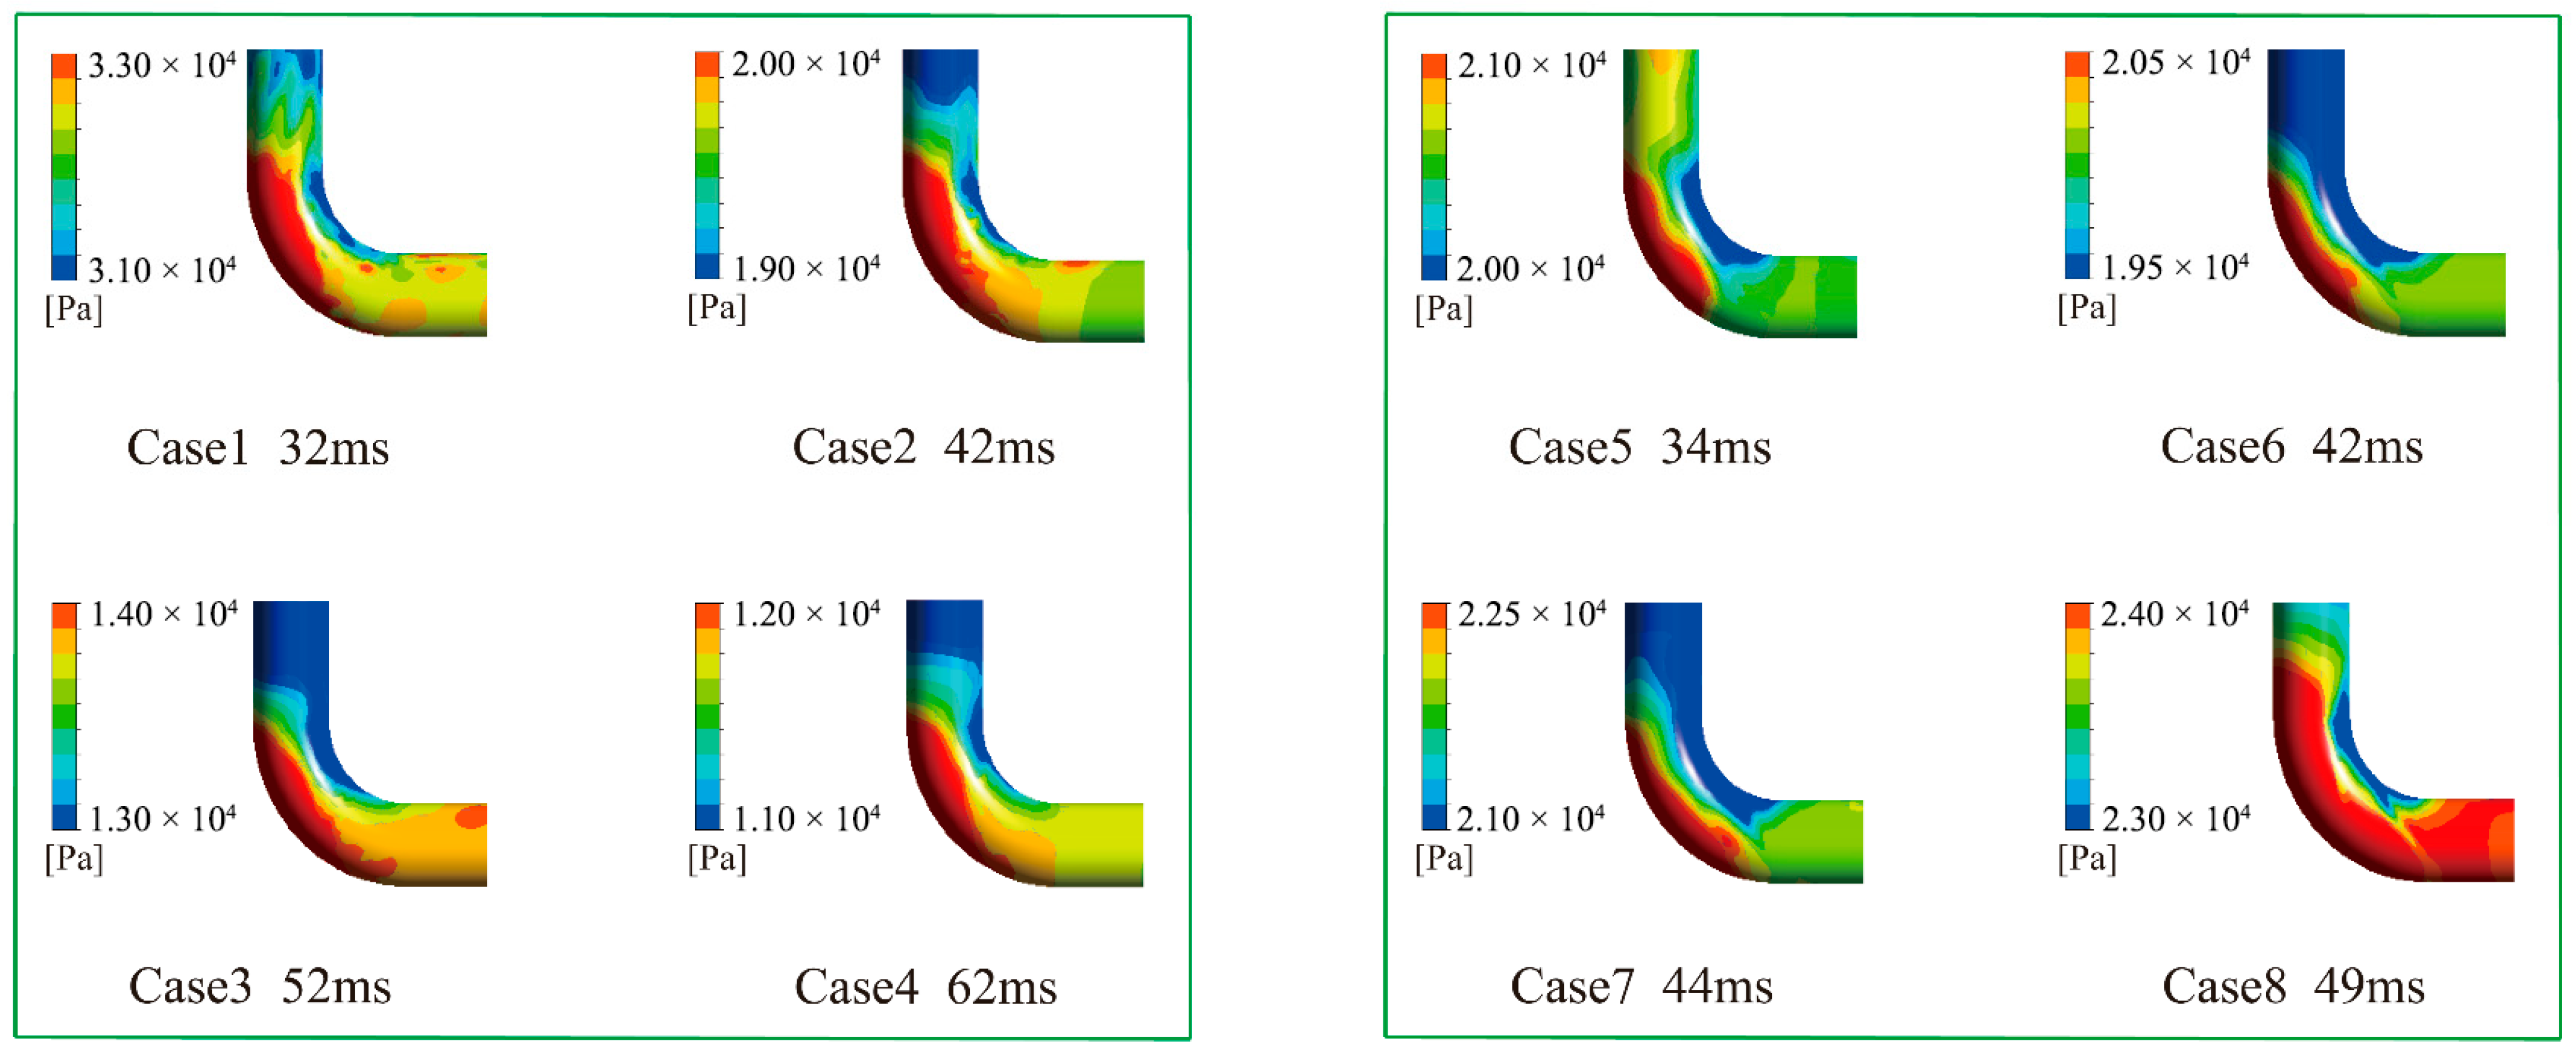
Figure 13 presents the distribution of pressure values when the flame reaches the bent pipe-2 under different operating conditions. There is a significant pressure difference at the bent pipe-2. Upon reflection of the excitation wave via collision with the outer wall, the wall pressure experiences an increase [46]. The values of pressure difference were 0.2 kPa and 0.15 kPa for Case 1 and Case 7, respectively, while all other conditions had a pressure difference of 0.1 kPa. As the flame propagates through the bend, the pressure wave encounters an obstruction from the outer wall (concave wall), thereby being compelled to reflect rather than propagate smoothly. Numerous reflected pressure waves are superimposed on each other in this limited space, which in turn enhances the pressure at the outer wall and creates a localized high-pressure area.
When the pressure wave reaches the inner wall, its unique structure causes the pressure wave to stop propagating along the pipe axis and instead diffuse in all directions along the inner wall curvature. As the pressure wave continues to disperse, the originally concentrated pressure spreads out and the dispersed reflection triggered by the inner wall’s structure leads to a low-pressure region forming near the inner wall. It is because of the simultaneous presence of localized high and localized low pressures that a significant pressure difference is formed inside the bend. In addition, this pressure difference interferes with the flow field of straight pipe-3. This gives rise to non-uniform gas flow rate distribution during flame propagation, inducing spatial variations in flame speed that ultimately lead to flame corrugation [47].

4.3. Effect of Bend Distance Configuration on Flame Propagation Dynamics

Huang et al. [48] measured the laminar combustion velocity and Marx length of a natural gas/hydrogen/air mixture at different hydrogen gas fractions and equivalence ratios in a constant-volume chamber at ambient temperature and pressure using an optical chaser and a high-speed camera. The addition of hydrogen caused the laminar combustion velocity to increase exponentially, the Marx length to decrease, and the flame instability to increase. When the hydrogen gas volume fraction was 20% and the methane volume fraction was 80%, the laminar flame velocity was 0.4 m/s. Based on the experimental data, a formula for calculating the laminar combustion velocity of this mixture was proposed. The significant increase in combustion velocity increases the risk of backfire: when the combustion velocity of the mixture exceeds the critical flow velocity within the pipeline, the flame is prone to propagate backward to upstream equipment.
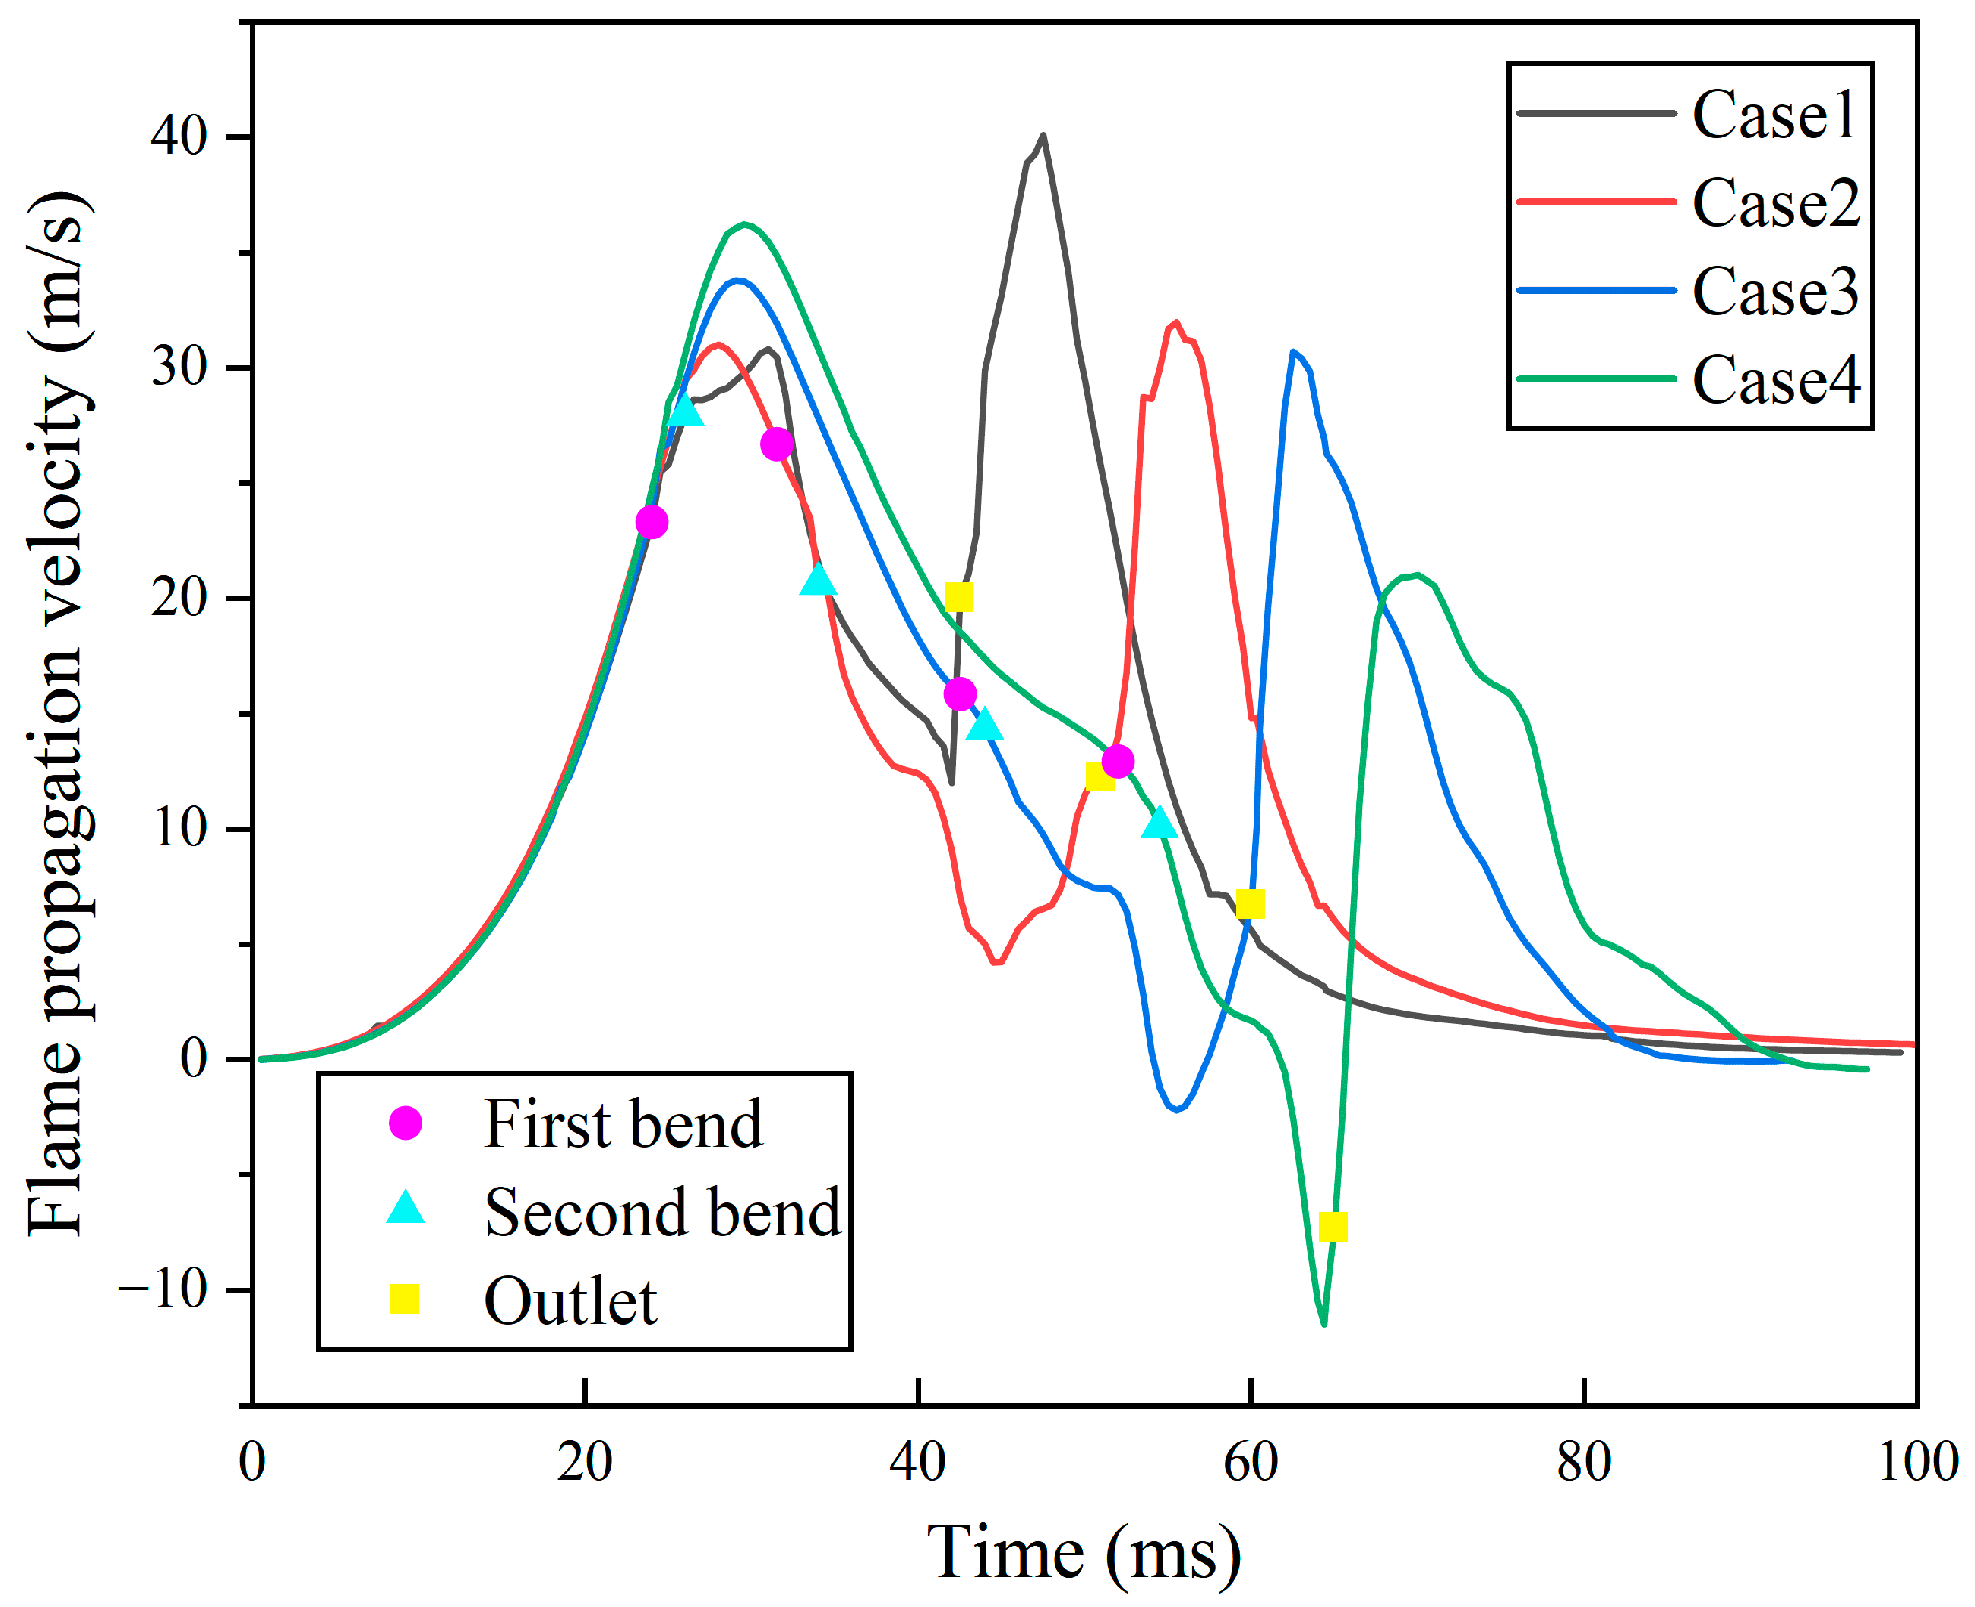
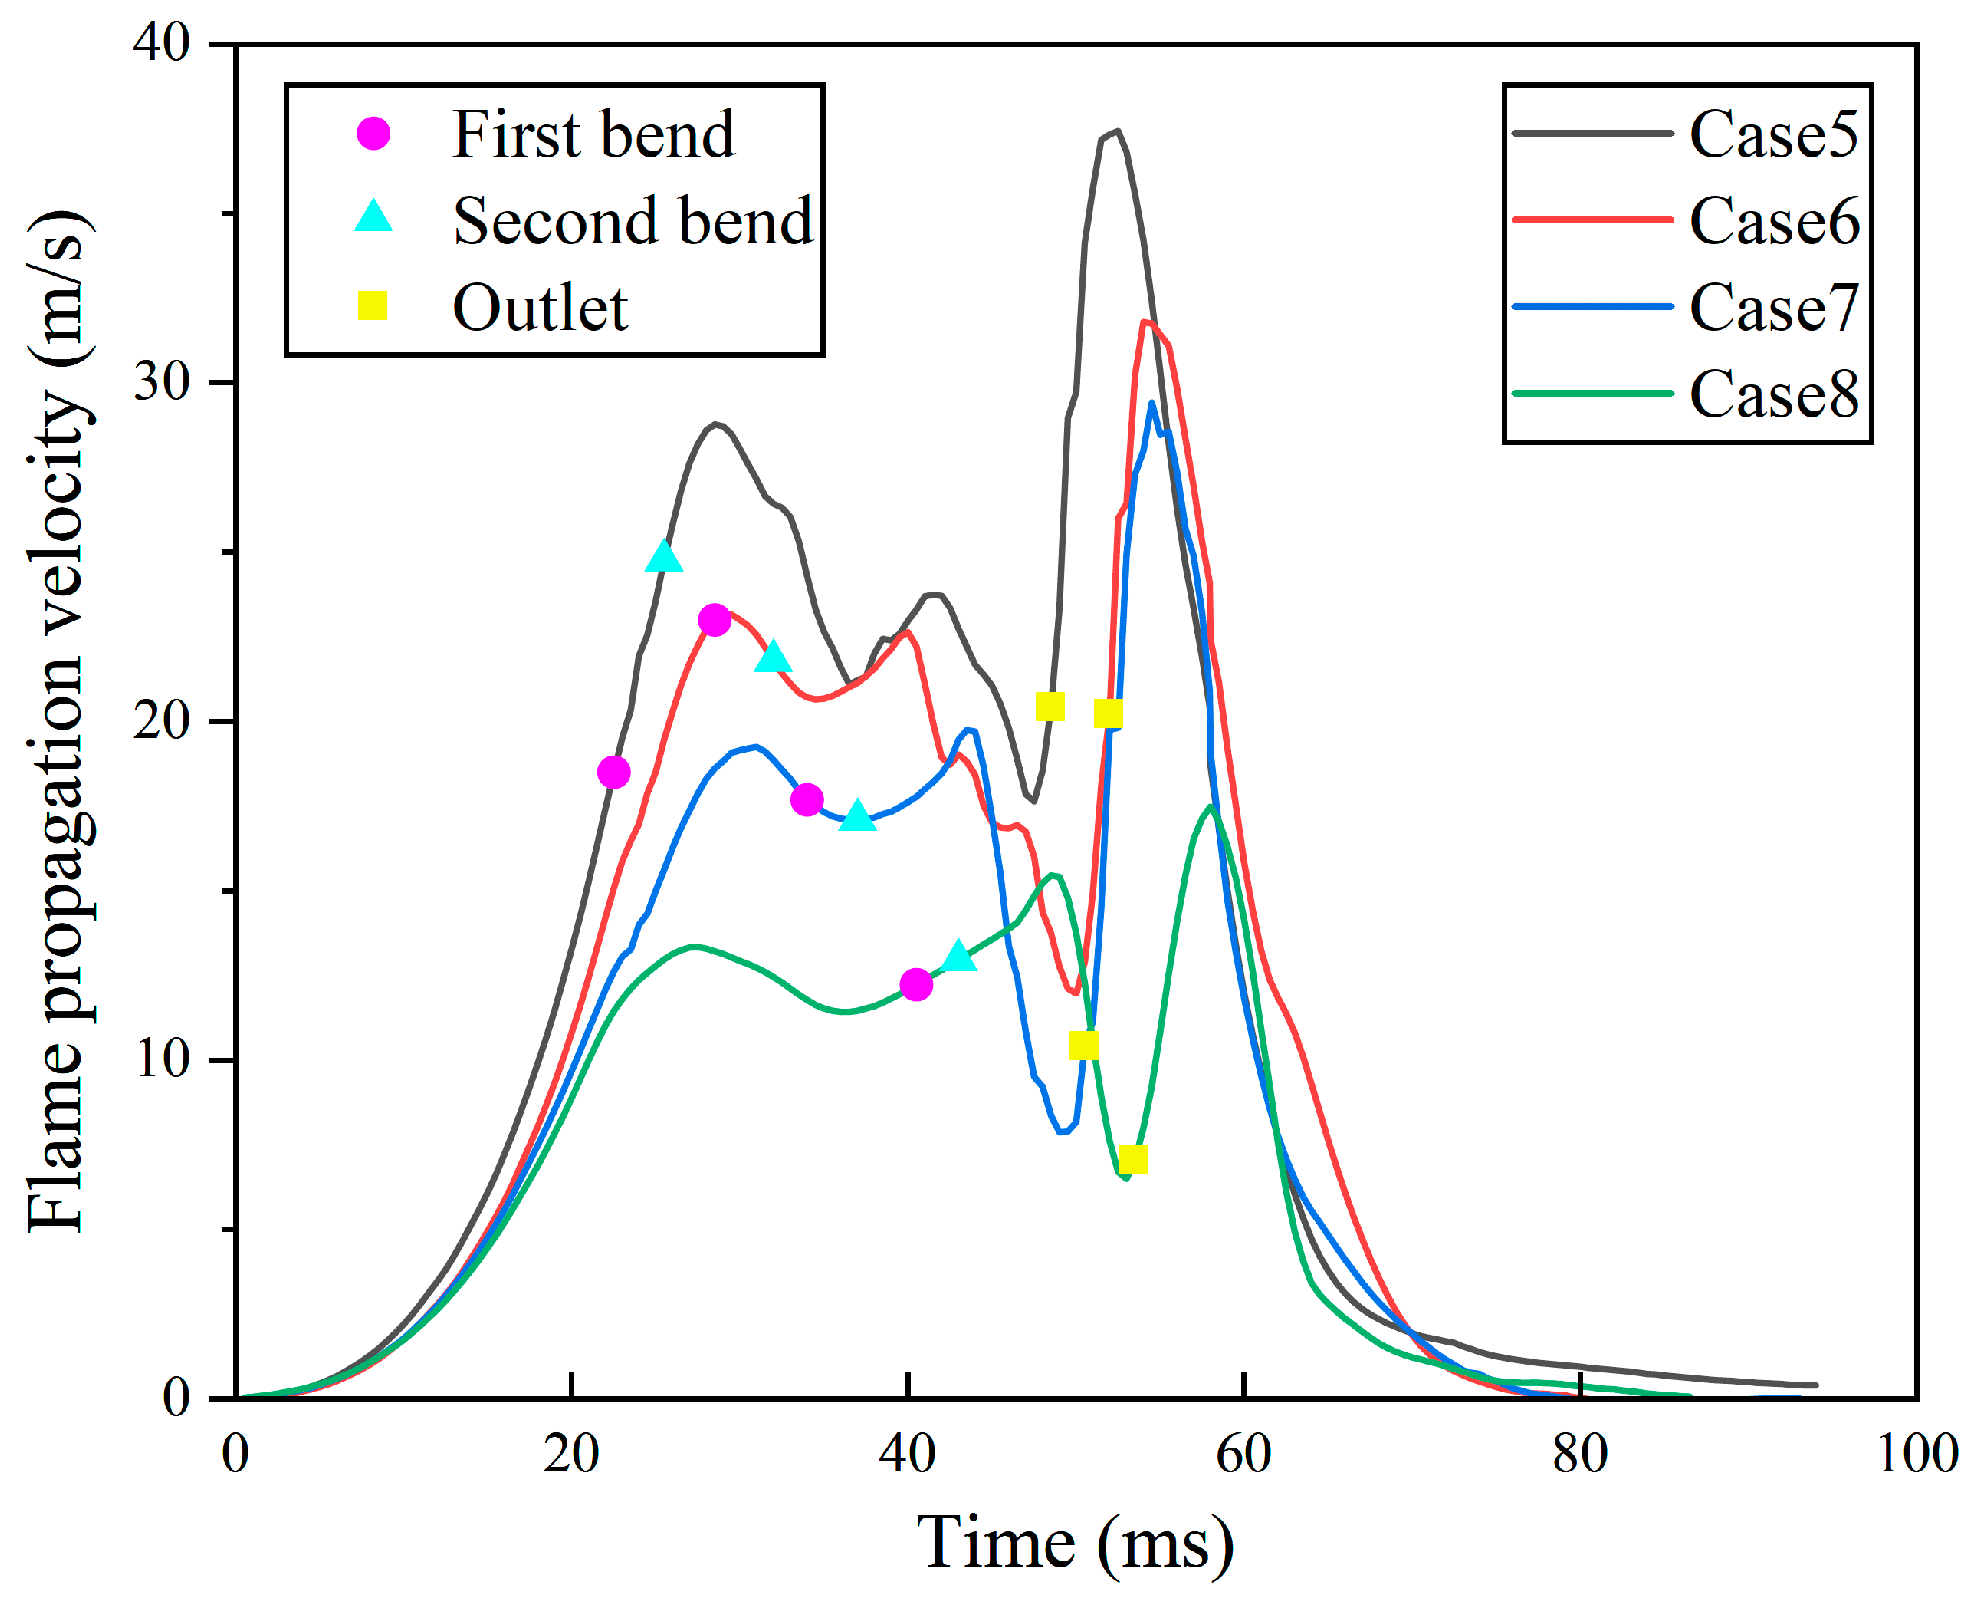
Figure 14 and Figure 15 illustrate the temporal dynamics of flame propagation speed across various experimental scenarios. In Figure 14, the flame propagation velocity curves show significant fluctuations and do not show a single increasing or decreasing trend. Depicting the temporal variation of flame propagation velocity across various conditions, Figure 14 and Figure 15 illustrate how velocity evolves under different conditions. This may be since D1 is smaller and less methane-hydrogen premixed gas needs to be consumed for short distance propagation, so the flame enters into the bent pipe-1 at a faster speed and forms a surge that continues to propagate forward. The speed peak-1 for Case 1 is 30.8 m/s and at the bent pipe-1, the speed is 23.4 m/s, which is an increase of 31.6%.
At a later stage, the flame spreads to the Outlet and a large volume of air rushes into the duct. At this point, the combustible mixture once again meets the conditions for intense combustion, releasing more energy and facilitating the flame propagation speed to increase again, forming speed peak-2. Speed peak-2 for Cases 1 to 4 was 40.0 m/s, 31.9 m/s, 30.6 m/s, 21.0 m/s, respectively. This is due to the high diffusion coefficient of hydrogen and the combustion velocity of the upper layer flow, which not only enhances the synergistic effect of fluid dynamic instability and thermal diffusion instability, but also accelerates the heating and compression of the unburned mixture by the leading shock wave, making the flame propagation velocity more sensitive to the pipeline structure [49,50,51]. In addition, speed peak-2 decreases with increasing D1 and its occurrence is gradually delayed. This indicates that combustible substances are less chemically reactive in straight pipe-1, with lower concentrations and fewer substances involved in the reaction. As the flame propagates to the two bends, the pipe direction changes, and the flow direction of the combustion products and unburnt gas mixture is forced to change, which in turn generates centrifugal force and a vortex. This causes the flame to lose energy during propagation, further decelerating its propagation speed. The flame propagation velocity for Case 2 to Case 4 is reduced by 269 per cent, 215 per cent, and 204 per cent, respectively, from the bent pipe-1 to the lowest velocity.
Observation of Figure 15 reveals that there are three distinct velocity peaks from Cases 5 to 8, dividing the flame propagation velocity into three phases: pre-, mid-, and post-. The temporal evolution of flame propagation velocity and the factors influencing it in the pre-stage and post-stage are analogous to those discussed in the preceding section, with the only divergence occurring in the mid-stage. During this intermediate phase, the flame propagation rate exhibits a declining trend as it propagates toward bent pipe-2. As the flame arrives at bent pipe-2, its propagation speed increases again and achieves speed peak-2. Stemming from a larger D2 and augmented fluid turbulence, the elevated mixing efficiency of the flame with unburned gas underscores the pivotal influence of geometric parameters on combustion dynamics. This provides more favorable conditions for combustion and hence faster flame propagation. The speed peak-2 were 23.8 m/s, 22.4 m/s, 19.8 m/s, and 15.5 m/s respectively. As the flame continues its propagation toward straight pipe-3, turbulence induced by the second bend diminishes, leading to a subsequent decline in flame propagation velocity. Owing to the inflow of air from outside the tube, the combustible gas undergoes re-ignition, giving rise to speed peak-3—measured at 37.4 m/s, 31.8 m/s, 29.4 m/s, and 17.4 m/s. As D2 increases, speed peak-3 decreases significantly and the reduction is larger than in Cases 1 to 4, which indicates that the larger D2 is, the more significant the reduction in flame propagation speed, and the smaller the peak value of flame propagation speed becomes. In future double-bent pipe hydrogenation systems, the length of D2 can be increased to utilize its enhanced turbulent dissipation effect to offset the increase in combustion velocity caused by hydrogenation. At the same time, smooth-walled 316L stainless steel material can be selected to reduce local turbulent disturbances and prevent the flame front from propagating in the opposite direction due to turbulent intensification.

4.4. Effect of Bend Distance Configuration on Flame Area and Leading-Edge Position

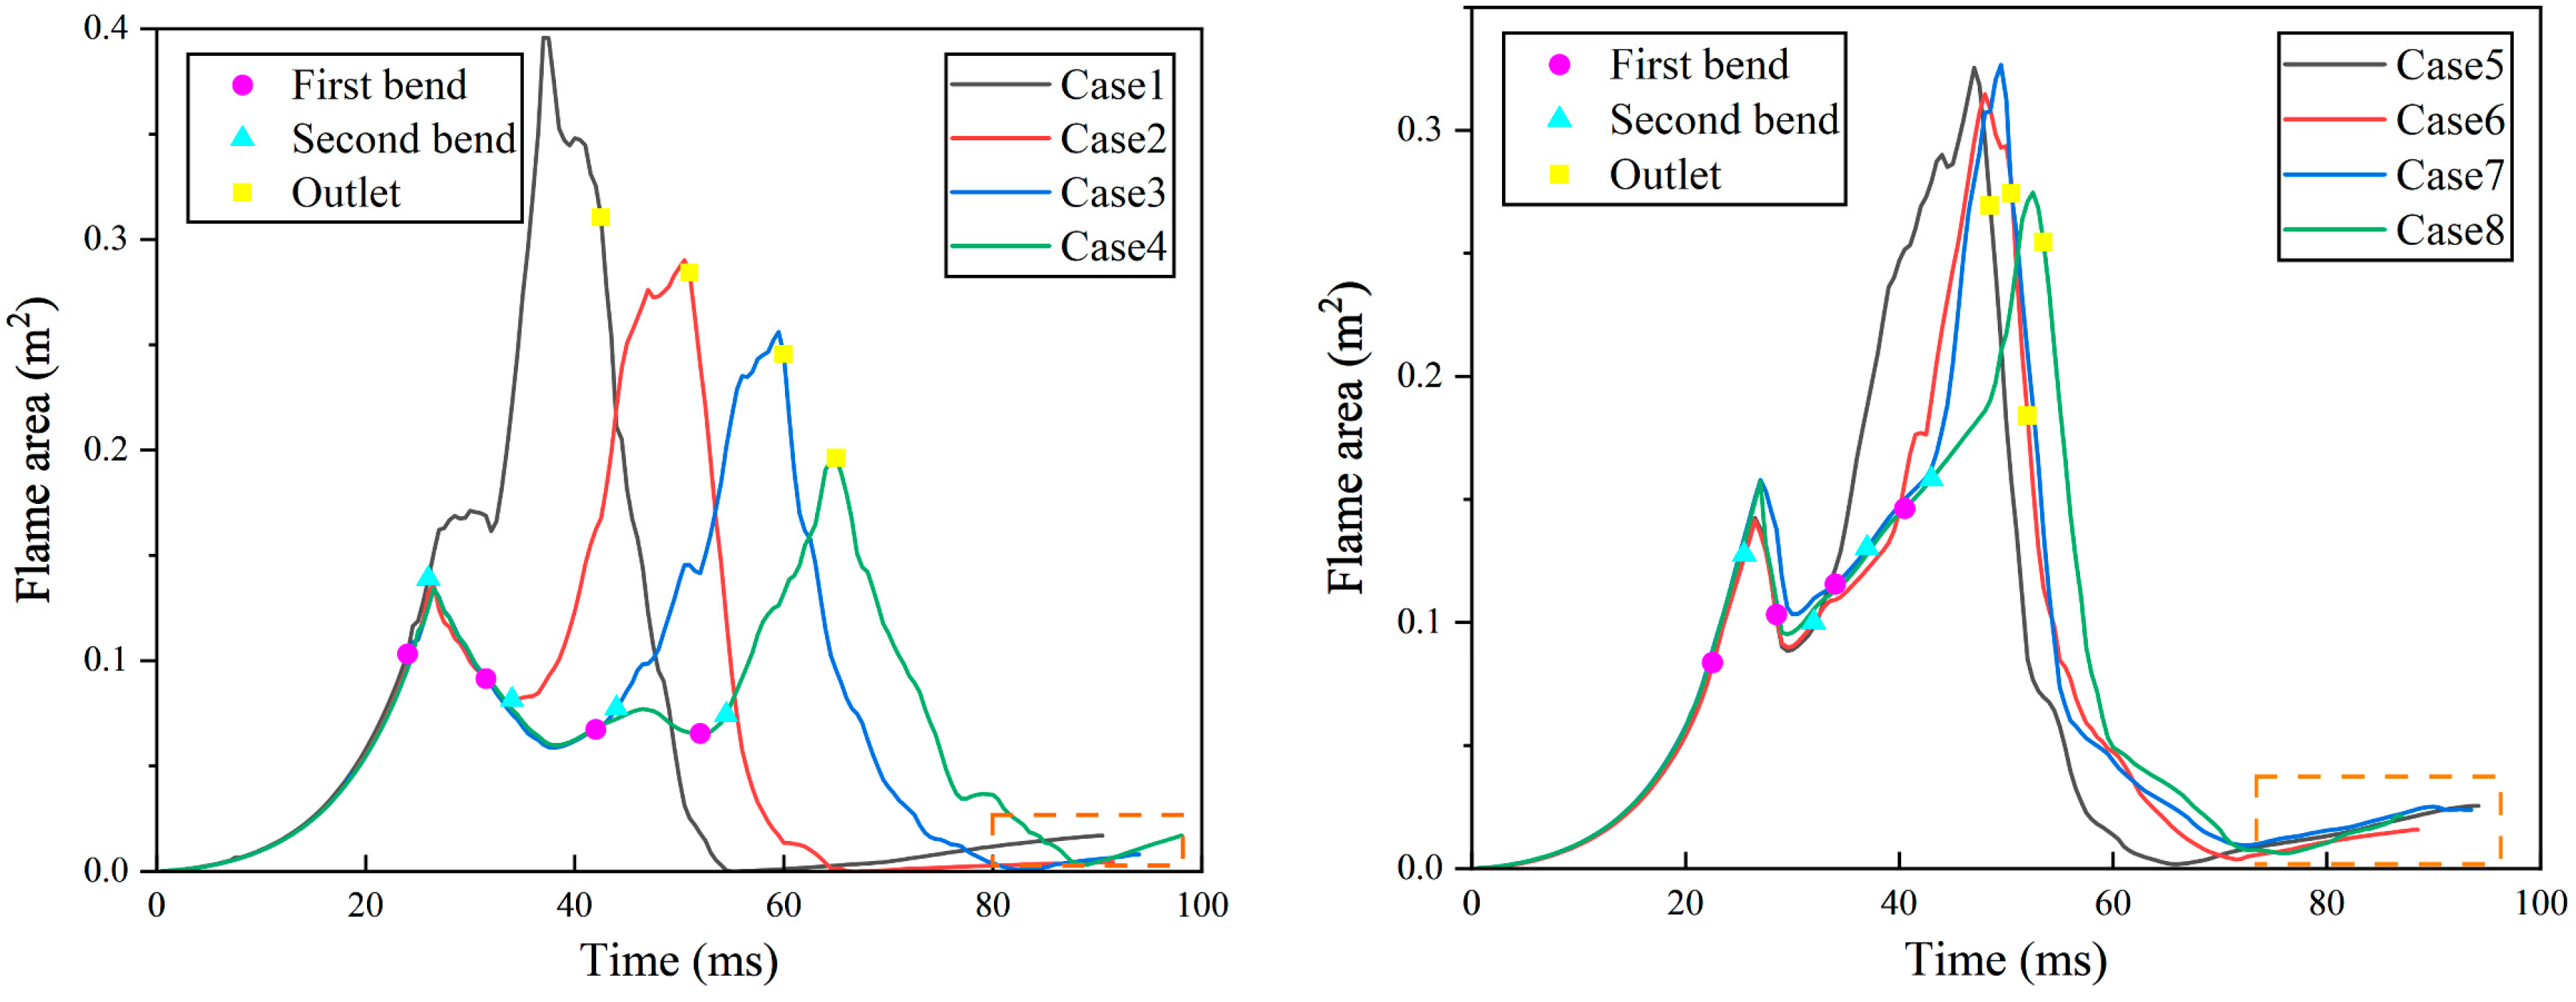
Figure 16 depicts the temporal evolution of flame area across different conditions. Concerning the flame propagation duration between flame area peak-1 and peak-2, the times elapsed for Cases 1 to 4 were 7.09 ms, 23.96 ms, 33.1 ms, and 38.32 ms, respectively. The average time increment between the conditions is about 10.41 ms, which shows a significant incremental trend; Cases 5 to 8 required 20.5 ms, 21.52 ms, 22.51 ms, and 25.56 ms, respectively, with an average time increment of about 1.69 ms per condition. We found that a gradual increase in D1 produced significant variability in flame area. As D1 increases, the peak flame area decreases, the time to reach this peak extends, and flame development becomes increasingly inhibited. In addition, we find that the area curve reaches the flame area peak-2 experience is very short, regardless of how D2 varies, and the area curve rises rapidly after bottoming out. Compared to Cases 1 to 4, the growth of flame area is more dramatic in Cases 5 to 8, and the flame area peak, as well as the flame propagation time parameters, are maintained in a relatively stable range. In addition, as shown in the orange dashed box, larger D2 conditions are more likely to trigger larger-scale flame backflow phenomena.
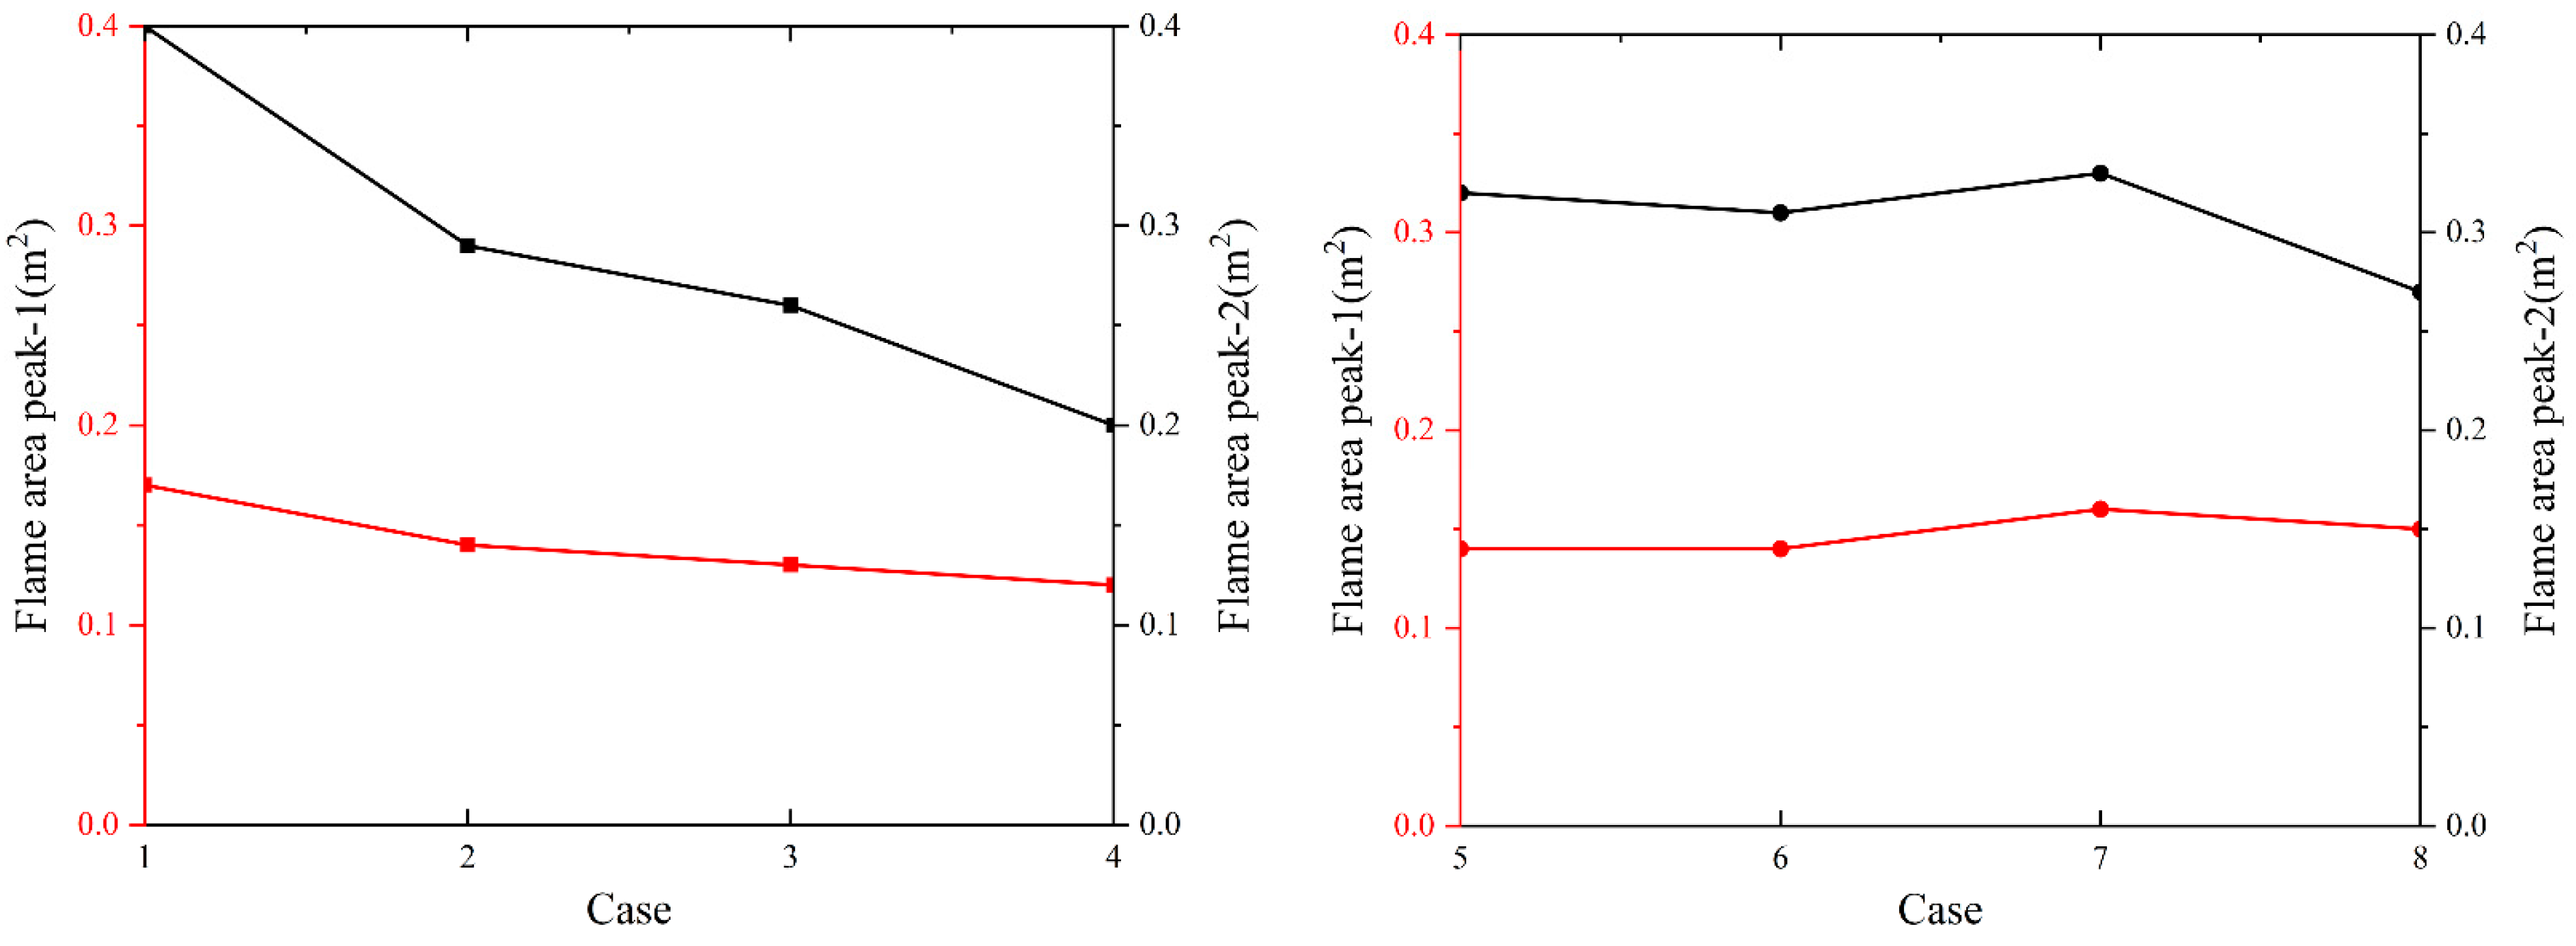
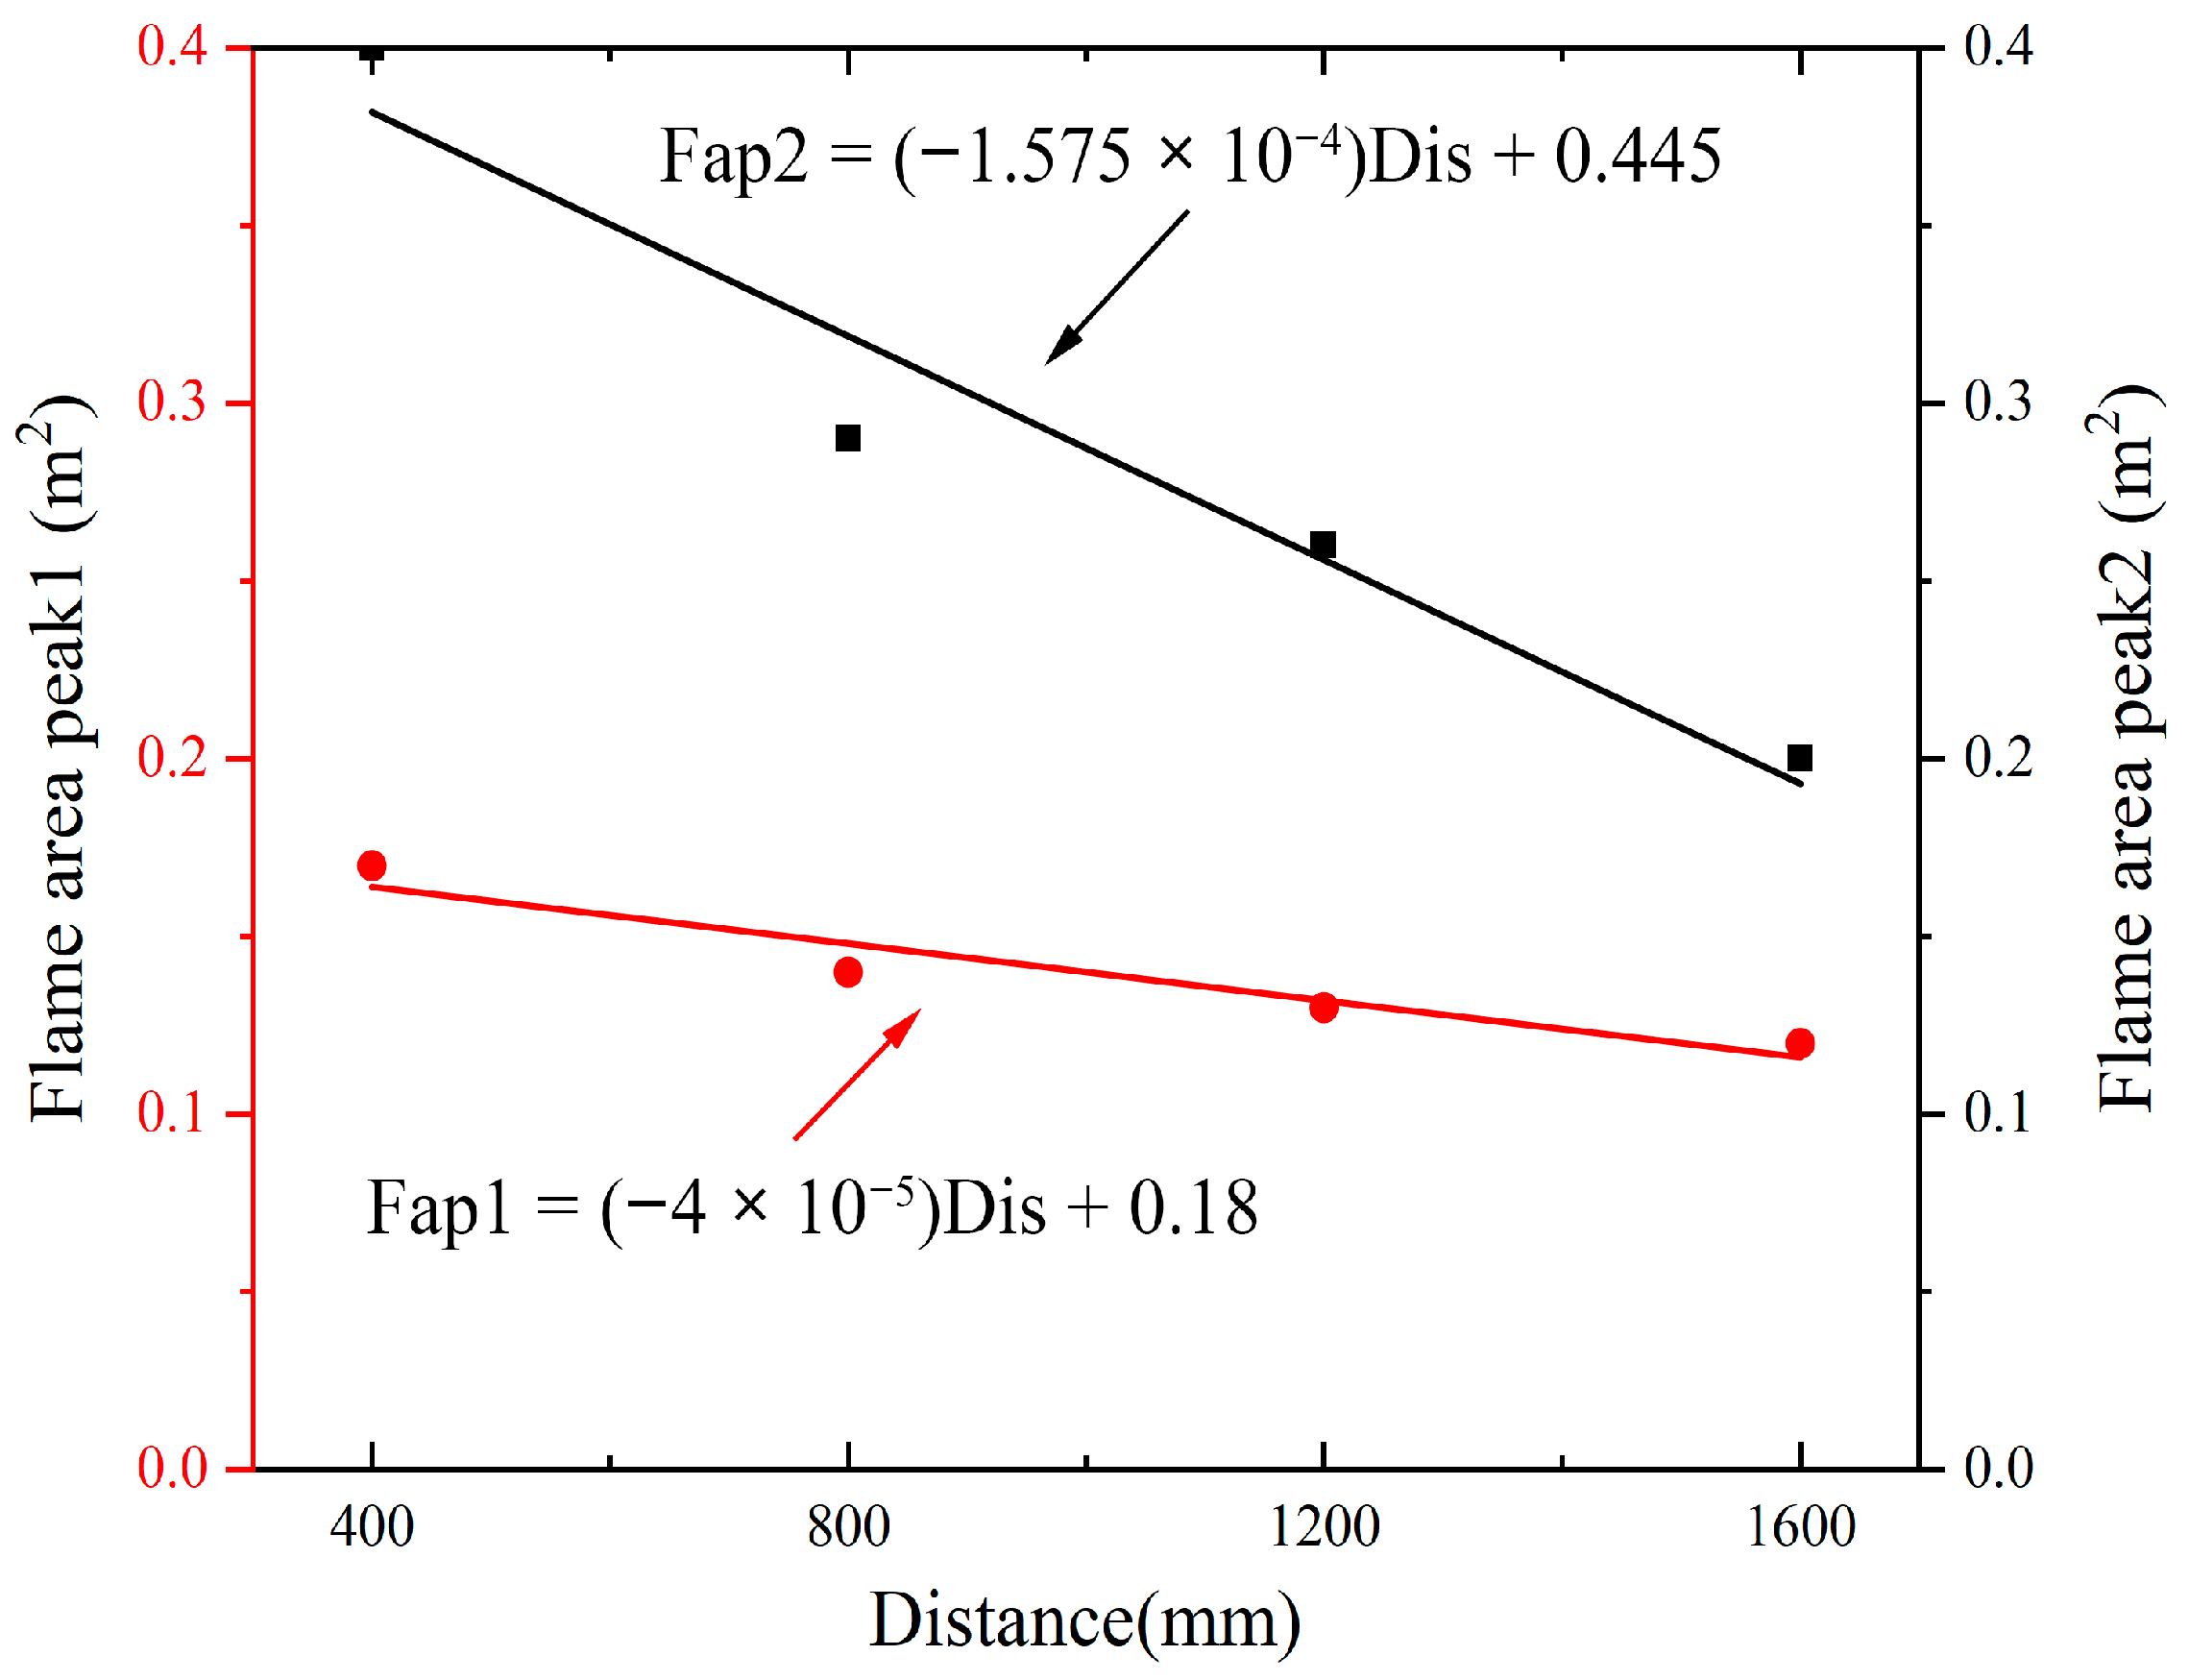
To obtain a more transparent understanding of the data variation trend, this study selected key data points from Figure 16 and transformed them to generate the peak flame area comparison line graph in Figure 17. After an in-depth analysis of Figure 17, it is found that the peak flame area under different conditions shows different characteristics. In Cases 1 to 4, the flame area peak shows an obvious decreasing trend with increasing distance. Among them, the decrease of flame area peak-1 is more uniform, with an average decrease of 0.017 m2 for each additional condition; the decrease of flame area peak-2 is larger, with an average decrease of 0.067 m2 for each condition, which indicates that the decrease of flame area peak-2 is faster. We fit a line to the key data points for Cases 1 to 4 in Figure 17, resulting in Figure 18 and the following equations:
Fap 1   =   ( 4   ×   10 5 ) Dis   +   0.18 ,
Fap2 = ( 1.575 × 10 4 ) Dis + 0.445 ,
Fap1 denotes flame area peak-1 and Fap2 denotes flame area peak-2. In Equations (9) and (10), scientific notation is used to avoid excessively long numbers after the decimal point and Dis represents the distance (in mm) from bent pipe-1 to the ignitor.
In Cases 5 to 8, the values of flame area peak-1 are 0.14 m2, 0.14 m2, 0.15 m2, and 0.16 m2, respectively. The limited fluctuation of the values, exhibiting a standard deviation of 0.02 m2, indicates that the peak flame area remains relatively stable. Flame area peak-2 values were 0.32 m2, 0.31 m2, 0.33 m2, and 0.27 m2. The fluctuation range is 0.06 m2. Although the fluctuation is relatively large, the overall pattern of increasing or decreasing is not obvious.

5. Conclusions

This study conducted explosion experiments and simulations on a methane/hydrogen premixed gas with φ   =   1 and a volume ratio of methane to hydrogen of 4:1 in a space with a total length of 2.65 m, featuring double-bent pipes and equipped with a blast vent. The effect of varying the distance from the bent pipe-1 to the ignitor (D1) and the distance between the double bent pipes (D2) on the explosion characteristics was investigated. The following conclusions can be drawn:
  • The Pmax of the straight pipe is 21.7 kPa and the (dp/dt) max is 1.8 MPa/s. After adding the double-bent pipes, Pmax increases to 65.2 kPa, a 200% increase over the straight pipe, and (dp/dt) max increases to 3.7 MPa/s, a 108% increase over the straight pipe. Pmax and (dp/dt)max show an approximately linear decreasing law with the increase of D1 and can be used for explosion hazard prediction. The reflection, refraction, and diffraction of pressure waves at bends represent the primary mechanisms driving the elevation of pressure peaks. In engineering applications, the explosion pressure can be reduced by increasing the length of D1 or D2, among which the effect of the former is more significant.
  • As the flame separates from the ignition source, an “irregular cavity” forms in the ignitor area. The high-pressure zone on the outer wall gives rise to the propagation of the flame front along the inner wall; meanwhile, it induces an uneven distribution of flow velocity, which in turn triggers flame wrinkles. Under the conditions of smaller D1 and any D2, the flame propagation presents the three-stage evolution characteristics of “finger-shaped” to “tongue-shaped” to “wrinkled-shaped”. When D1 is large, the flame evolution is a three-stage process of “finger-shaped” to “concave-shaped” to “wrinkled-shaped”.
  • Simulation results based on accurate and experimentally verified numerical models revealed that the velocity profile from Cases 1 to 4 has a pre- and post-phase, showing two significant velocity peaks. As D1 increases, the facilitative impact of the double-bent pipes on flame propagation weakens, causing speed peak-2 to decline progressively and its occurrence time to be delayed successively. The velocity profile from Cases 5 to 8 exhibits three characteristic peaks, corresponding to the pre, mid, and late stages. In the mid-term stage, due to the large D2, the turbulence intensity changes, providing more favorable conditions for combustion and promoting the formation of speed peak-2. However, its acceleration is significantly lower than that of the pre- and post-phases.
  • As D1 increases, the area peak-2 shows a more obvious linear decrease than the area peak-1. For every 400 mm increase in D1, the average area peak-2 decreases by 0.067 m2 and the average area peak-1 decreases by 0.017 m2. No matter how D2 changes, the area peak remains within a relatively stable range. The time for the area curve to reach the area peak-2 is very short, and the flame reflux area is relatively large.

Author Contributions

Conceptualization, Y.Y. and Y.W.; methodology, Y.Y. and B.H.; validation, Y.Y., Y.H. and X.W.; formal analysis, Y.Y., X.S. and M.L.; writing—original draft, Y.Y.; writing—review and editing, Y.Y. and J.G.; resources, J.G. All authors have read and agreed to the published version of the manuscript.

Funding

This research was funded by the Basic Public Welfare Research Project of Zhejiang Province, grant number LGF22E040002.

Institutional Review Board Statement

Not applicable.

Informed Consent Statement

Not applicable.

Data Availability Statement

The original contributions presented in the study are included in the article, further inquiries can be directed to the corresponding author.

Conflicts of Interest

Bin Hao was employed by Sinochem Emergency Technical Service Co., Ltd., The remaining authors declare that the research was conducted in the absence of any commercial or financial relationships that could be construed as a potential conflict of interest.

References

  1. Panda, P.K.; Sahoo, B.; Ramakrishna, S. Electrospun nanofibers for photocatalytic water treatment and hydrogen generation application: A review. Int. J. Hydrogen Energy 2023, 48, 37193–37208. [Google Scholar] [CrossRef]
  2. Wolański, P. Detonative propulsion. Proc. Combust. Inst. 2013, 34, 125–158. [Google Scholar] [CrossRef]
  3. Zhang, L.; Yang, Q.; Shi, B.; Niu, Y.; Zhong, Z. Influences of a Pipeline’s Bending Angle on the Propagation Law of Coal Dust Explosion Induced by Gas Explosion. Combust. Sci. Technol. 2019, 193, 798–811. [Google Scholar] [CrossRef]
  4. Ma, Q.; Zhang, Q.; Pang, L.; Huang, Y.; Chen, J. Effects of hydrogen addition on the confined and vented explosion behavior of methane in air. J. Loss Prev. Process Ind. 2014, 27, 65–73. [Google Scholar] [CrossRef]
  5. Timmerberg, S.; Kaltschmitt, M. Hydrogen from renewables: Supply from North Africa to Central Europe as blend in existing pipelines–Potentials and costs. Appl. Energy 2019, 237, 795–809. [Google Scholar] [CrossRef]
  6. Xiu, Z.; Liu, Z.; Li, P.; Hao, B.; Li, M.; Zhao, Y.; Cai, P. Effects of combined obstacles on deflagration characteristics of hydrogen-air premixed gas. Int. J. Hydrogen Energy 2023, 48, 31008–31021. [Google Scholar] [CrossRef]
  7. Jia, W.; Ren, Q.; Zhang, H.; Yang, M.; Wu, X.; Li, C. Multicomponent leakage and diffusion simulation of natural gas/hydrogen mixtures in compressor plants. Saf. Sci. 2023, 157, 105916. [Google Scholar] [CrossRef]
  8. Crowl, D.A.; Jo, Y.-D. The hazards and risks of hydrogen. J. Loss Prev. Process Ind. 2007, 20, 158–164. [Google Scholar] [CrossRef]
  9. Molnarne, M.; Schroeder, V. Hazardous properties of hydrogen and hydrogen containing fuel gases. Process Saf. Environ. Prot. 2019, 130, 1–5. [Google Scholar] [CrossRef]
  10. Yao, Z.; Deng, H.; Dong, J.; Wen, X.; Zhang, X.; Wang, F.; Chen, G. On explosion characteristics of premixed syngas/air mixtures with different hydrogen volume fractions and ignition positions. Fuel 2021, 288, 119619. [Google Scholar] [CrossRef]
  11. Jeon, J.; Shin, D.; Choi, W.; Kim, S.J. Identification of the extinction mechanism of lean limit hydrogen flames based on Lewis number effect. Int. J. Heat Mass Transf. 2021, 174, 121288. [Google Scholar] [CrossRef]
  12. Shirvill, L.C.; Roberts, T.A.; Royle, M.; Willoughby, D.B.; Sathiah, P. Experimental study of hydrogen explosion in repeated pipe congestion–Part 1: Effects of increase in congestion. Int. J. Hydrogen Energy 2019, 44, 9466–9483. [Google Scholar] [CrossRef]
  13. Li, D.; Zhang, Q.; Ma, Q.; Shen, S. Comparison of explosion characteristics between hydrogen/air and methane/air at the stoichiometric concentrations. Int. J. Hydrogen Energy 2015, 40, 8761–8768. [Google Scholar] [CrossRef]
  14. Chen, Q.; Zhao, K.; Li, B.; Zhang, D.; Mensah, R.A.; Das, O.; Xie, L.; Wang, Y. Effect of hydrogen concentration, vented area, and vented shape on vented hydrogen-air explosions and their consequence analysis. Exp. Therm. Fluid Sci. 2025, 167, 111484. [Google Scholar] [CrossRef]
  15. Jiang, B.; Tang, M.; Shi, S. Multiparameter acceleration characteristics of premixed methane/air explosion in a semi-confined pipe. J. Loss Prev. Process Ind. 2017, 49, 139–144. [Google Scholar] [CrossRef]
  16. Li, S.; Xiu, Z.; Li, R.; Ma, J.; Zhao, K.; Liu, Z.; Li, P.; Li, M.; Fan, T. Experimental and theoretical investigations into overpressure during confined space explosions of methane-hydrogen mixture. Process Saf. Environ. Prot. 2024, 187, 91–103. [Google Scholar] [CrossRef]
  17. Zhang, K.; Du, S.; Chen, H.; Wang, J.; Zhang, J.; Guo, Y.; Guo, J. Effect of hydrogen concentration on the vented explosion of hydrogen–air mixtures in a 5-m-long duct. Process Saf. Environ. Prot. 2022, 162, 978–986. [Google Scholar] [CrossRef]
  18. He, Q.; Gu, M.; Tang, F.; Sun, X.; Wang, Y. Ceiling radiation heat flux and downward received radiation heat flux of methane jet fire with hydrogen addition. Int. J. Hydrogen Energy 2024, 51, 741–753. [Google Scholar] [CrossRef]
  19. Cai, P.; Liu, Z.; Li, P.; Zhao, Y.; Li, M.; Li, R.; Wang, C.; Xiu, Z. Effects of fuel component, airflow field and obstacles on explosion characteristics of hydrogen/methane mixtures fuel. Energy 2023, 265, 126302. [Google Scholar] [CrossRef]
  20. Xiu, Z.; Liu, Q.; Liu, Z.; Li, M.; Li, P.; Hao, B. Coupled behavior of overpressure and vented flame in large-scale constrained spaces during methane deflagration: Effect of ignition position. Process Saf. Environ. Prot. 2025, 198, 107111. [Google Scholar] [CrossRef]
  21. Bin, H.; Xiu, Z.; Liu, Z. Optimization and improvement of Lee model and its application in large-scale constrained space of premixed methane/air deflagration dynamics analysis. Process Saf. Environ. Prot. 2025, 201, 107603. [Google Scholar] [CrossRef]
  22. Xiu, Z.; Liu, Z.; Li, P.; Li, M.; Ma, J.; Fan, T.; Hao, B. Research on the dynamics of flame propagation and overpressure evolution in full-scale residential gas deflagration. Case Stud. Therm. Eng. 2024, 62, 105204. [Google Scholar] [CrossRef]
  23. Pan, X.; Li, Y.; Jiang, Y.; Horri, B.A.; Zhang, T.; Wang, Z.; Wang, Q.; Jiang, J.; Wang, S. Self-ignition and flow characteristics of pressurized hydrogen in Y-shaped tubes. Int. J. Hydrogen Energy 2023, 48, 31412–31423. [Google Scholar] [CrossRef]
  24. Niu, Y.; Shi, B.; Jiang, B. Experimental study of overpressure evolution laws and flame propagation characteristics after methane explosion in transversal pipe networks. Appl. Therm. Eng. 2019, 154, 18–23. [Google Scholar] [CrossRef]
  25. Lei, B.; Wei, Q.; Pang, R.; Xiao, J.; Kuznetsov, M.; Jordan, T. The effect of hydrogen addition on methane/air explosion characteristics in a 20-L spherical device. Fuel 2023, 338, 127351. [Google Scholar] [CrossRef]
  26. Shamsadin Saeid, M.H.; Khadem, J.; Emami, S. Numerical investigation of the mechanism behind the deflagration to detonation transition in homogeneous and inhomogeneous mixtures of H2-air in an obstructed channel. Int. J. Hydrogen Energy 2021, 46, 21657–21671. [Google Scholar] [CrossRef]
  27. Xiao, H.; He, X.; Duan, Q.; Luo, X.; Sun, J. An investigation of premixed flame propagation in a closed combustion duct with a 90° bend. Appl. Energy 2014, 134, 248–256. [Google Scholar] [CrossRef]
  28. Mei, Y.; Shuai, J.; Zhou, N.; Ren, W.; Ren, F. Flame propagation of premixed hydrogen-air explosions in bend pipes. J. Loss Prev. Process Ind. 2022, 77, 104790. [Google Scholar] [CrossRef]
  29. Olugbemide, D.I. A CFD study of the effects of pipe bending angle on pressure piling in coal dust explosions in interconnected vessels. Fire Saf. J. 2022, 128, 103540. [Google Scholar] [CrossRef]
  30. Wang, Q.; Jin, S.; Wen, H.; Luo, Z.; Shu, C.-M.; Gao, W.; Wang, L.; Lu, X. Dynamic characteristics of methane explosion flame propagation in three types of pipe. Process Saf. Environ. Prot. 2023, 172, 1029–1047. [Google Scholar] [CrossRef]
  31. Li, S.; Liu, Z.; Zhao, Y.; Li, M.; Li, P. Flame propagation and overpressure characteristics of methane-hydrogen-mixed cloud explosion in unconfined area: Experimental and model study. Process Saf. Environ. Prot. 2025, 197, 106940. [Google Scholar] [CrossRef]
  32. Gong, L.; Jin, K.; Mo, T.; Zheng, X.; Yao, Y.; Zhang, Y. Numerical investigation on the shock wave propagation, hydrogen/air mixing and spontaneous ignition induced by high-pressure hydrogen release inside the tubes with different shaped cross-sections. Combust. Flame 2023, 252, 112770. [Google Scholar] [CrossRef]
  33. Ai, B.; Gao, J.; Hao, B.; Guo, B. Effect of Obstacle Length Variation on Hydrogen Deflagration in a Confined Space Based on Large Eddy Simulations. J. Appl. Fluid. Mech. 2024, 17, 384–397. [Google Scholar]
  34. Zheng, K.; Song, C.; Song, Z.; Ren, J.; Jia, Q. Experimental study on the explosion behavior of nonuniform hydrogen/methane/air mixtures in a duct. Fuel 2024, 368, 131655. [Google Scholar] [CrossRef]
  35. Hao, B.; Gao, J.; Guo, B.; Ai, B.; Hong, B.; Jiang, X. Numerical Simulation of Premixed Methane–Air Explosion in a Closed Tube with U-Type Obstacles. Energies 2022, 15, 4909. [Google Scholar] [CrossRef]
  36. Guo, B.; Gao, J.; Hao, B.; Ai, B.; Hong, B.; Jiang, X. Experimental and Numerical Study on the Explosion Dynamics of the Non-Uniform Liquefied Petroleum Gas and Air Mixture in a Channel with Mixed Obstacles. Energies 2022, 15, 7999. [Google Scholar] [CrossRef]
  37. Gao, J.; Ai, B.; Hao, B.; Guo, B.; Hong, B.; Jiang, X. Effect of Obstacles Gradient Arrangement on Non-Uniformly Distributed LPG–Air Premixed Gas Deflagration. Energies 2022, 15, 6872. [Google Scholar] [CrossRef]
  38. Han, O.; Zhang, Y.; Li, A.; Li, J.; Li, Y.; Liu, H. Experimental and numerical study on heavy gas contaminant dispersion and ventilation design for industrial buildings. Sustain. Cities Soc. 2020, 55, 102016. [Google Scholar] [CrossRef]
  39. Kazemi, M.; Brennan, S.; Molkov, V. Hydrogen-methane blends: Critical diameters and flame stability curves for non-premixed turbulent flames. Int. J. Hydrogen Energy 2025, 105, 693–700. [Google Scholar] [CrossRef]
  40. Su, Y.; Li, J.; Yu, B.; Zhao, Y. Numerical investigation on the leakage and diffusion characteristics of hydrogen-blended natural gas in a domestic kitchen. Renew. Energy 2022, 189, 899–916. [Google Scholar] [CrossRef]
  41. Long, F.; Duan, Y.; Yu, S.; Jia, H.; Bu, Y.; Huang, J. Effect of porous materials on explosion characteristics of low ratio hydrogen/methane mixture in barrier tube. J. Loss Prev. Process Ind. 2022, 80, 104875. [Google Scholar] [CrossRef]
  42. Blanchard, R.; Arndt, D.; Grätz, R.; Poli, M.; Scheider, S. Explosions in closed pipes containing baffles and 90 degree bends. J. Loss Prev. Process Ind. 2010, 23, 253–259. [Google Scholar] [CrossRef]
  43. Liu, L.; Luo, Z.; Su, B.; Hao, R.; Wang, T.; Deng, J.; Song, F. Flame propagation dynamic characteristics and mechanisms of methane–syngas–air mixtures in a semi-enclosed duct. Fuel 2024, 372, 132188. [Google Scholar] [CrossRef]
  44. Cheng, J.; Zhang, B. Characteristics of flame acceleration and deflagration-to-detonation transition enhanced by SF6 jet-in-cross-flow/flame interaction. Aerosp. Sci. Technol. 2023, 140, 108451. [Google Scholar] [CrossRef]
  45. Zhao, M.; Liu, D.; Li, M.; Xiao, H. Effect of wall roughness on flame acceleration and deflagration-to-detonation transition in a narrow channel. Int. J. Hydrogen Energy 2024, 51, 880–893. [Google Scholar] [CrossRef]
  46. Luo, C.; Zanganeh, J.; Moghtaderi, B. A 3D numerical study of detonation wave propagation in various angled bending tubes. Fire Saf. J. 2016, 86, 53–64. [Google Scholar] [CrossRef]
  47. Du, Y.; Zhou, F.; Ma, L.; Zheng, J.; Xu, C.; Chen, G. Dynamic fracture response of pre-flawed elbow pipe subjected to internal hydrogen-oxygen detonation. Int. J. Hydrogen Energy 2018, 43, 19625–19635. [Google Scholar] [CrossRef]
  48. Huang, Z.; Zhang, Y.; Zeng, K.; Liu, B.; Wang, Q.; Jiang, D. Measurements of laminar burning velocities for natural gas–hydrogen–air mixtures. Combust. Flame 2006, 146, 302–311. [Google Scholar] [CrossRef]
  49. Zhou, Y.; Li, Y.; Gao, W. Experimental investigation on the effect of a barrier wall on unconfined hydrogen explosion. Int. J. Hydrogen Energy 2023, 48, 33763–33773. [Google Scholar] [CrossRef]
  50. Li, S.; Xu, Z.; Wang, F.; Xiu, Z.; Liu, Z.; Li, P.; Li, M. Flame propagation characteristics and thermal radiation hazards of methane-hydrogen-mixed cloud explosion in unconfined area: Experiment research and theoretical modeling. Int. J. Hydrogen Energy 2024, 54, 1563–1574. [Google Scholar] [CrossRef]
  51. Li, Y.; Zhou, Y.; Zhang, Z.; Shang, S.; Gao, W. Experimental and theoretical investigation on hydrogen cloud explosion subjected to external turbulence. Int. J. Hydrogen Energy 2023, 48, 15331–15340. [Google Scholar] [CrossRef]
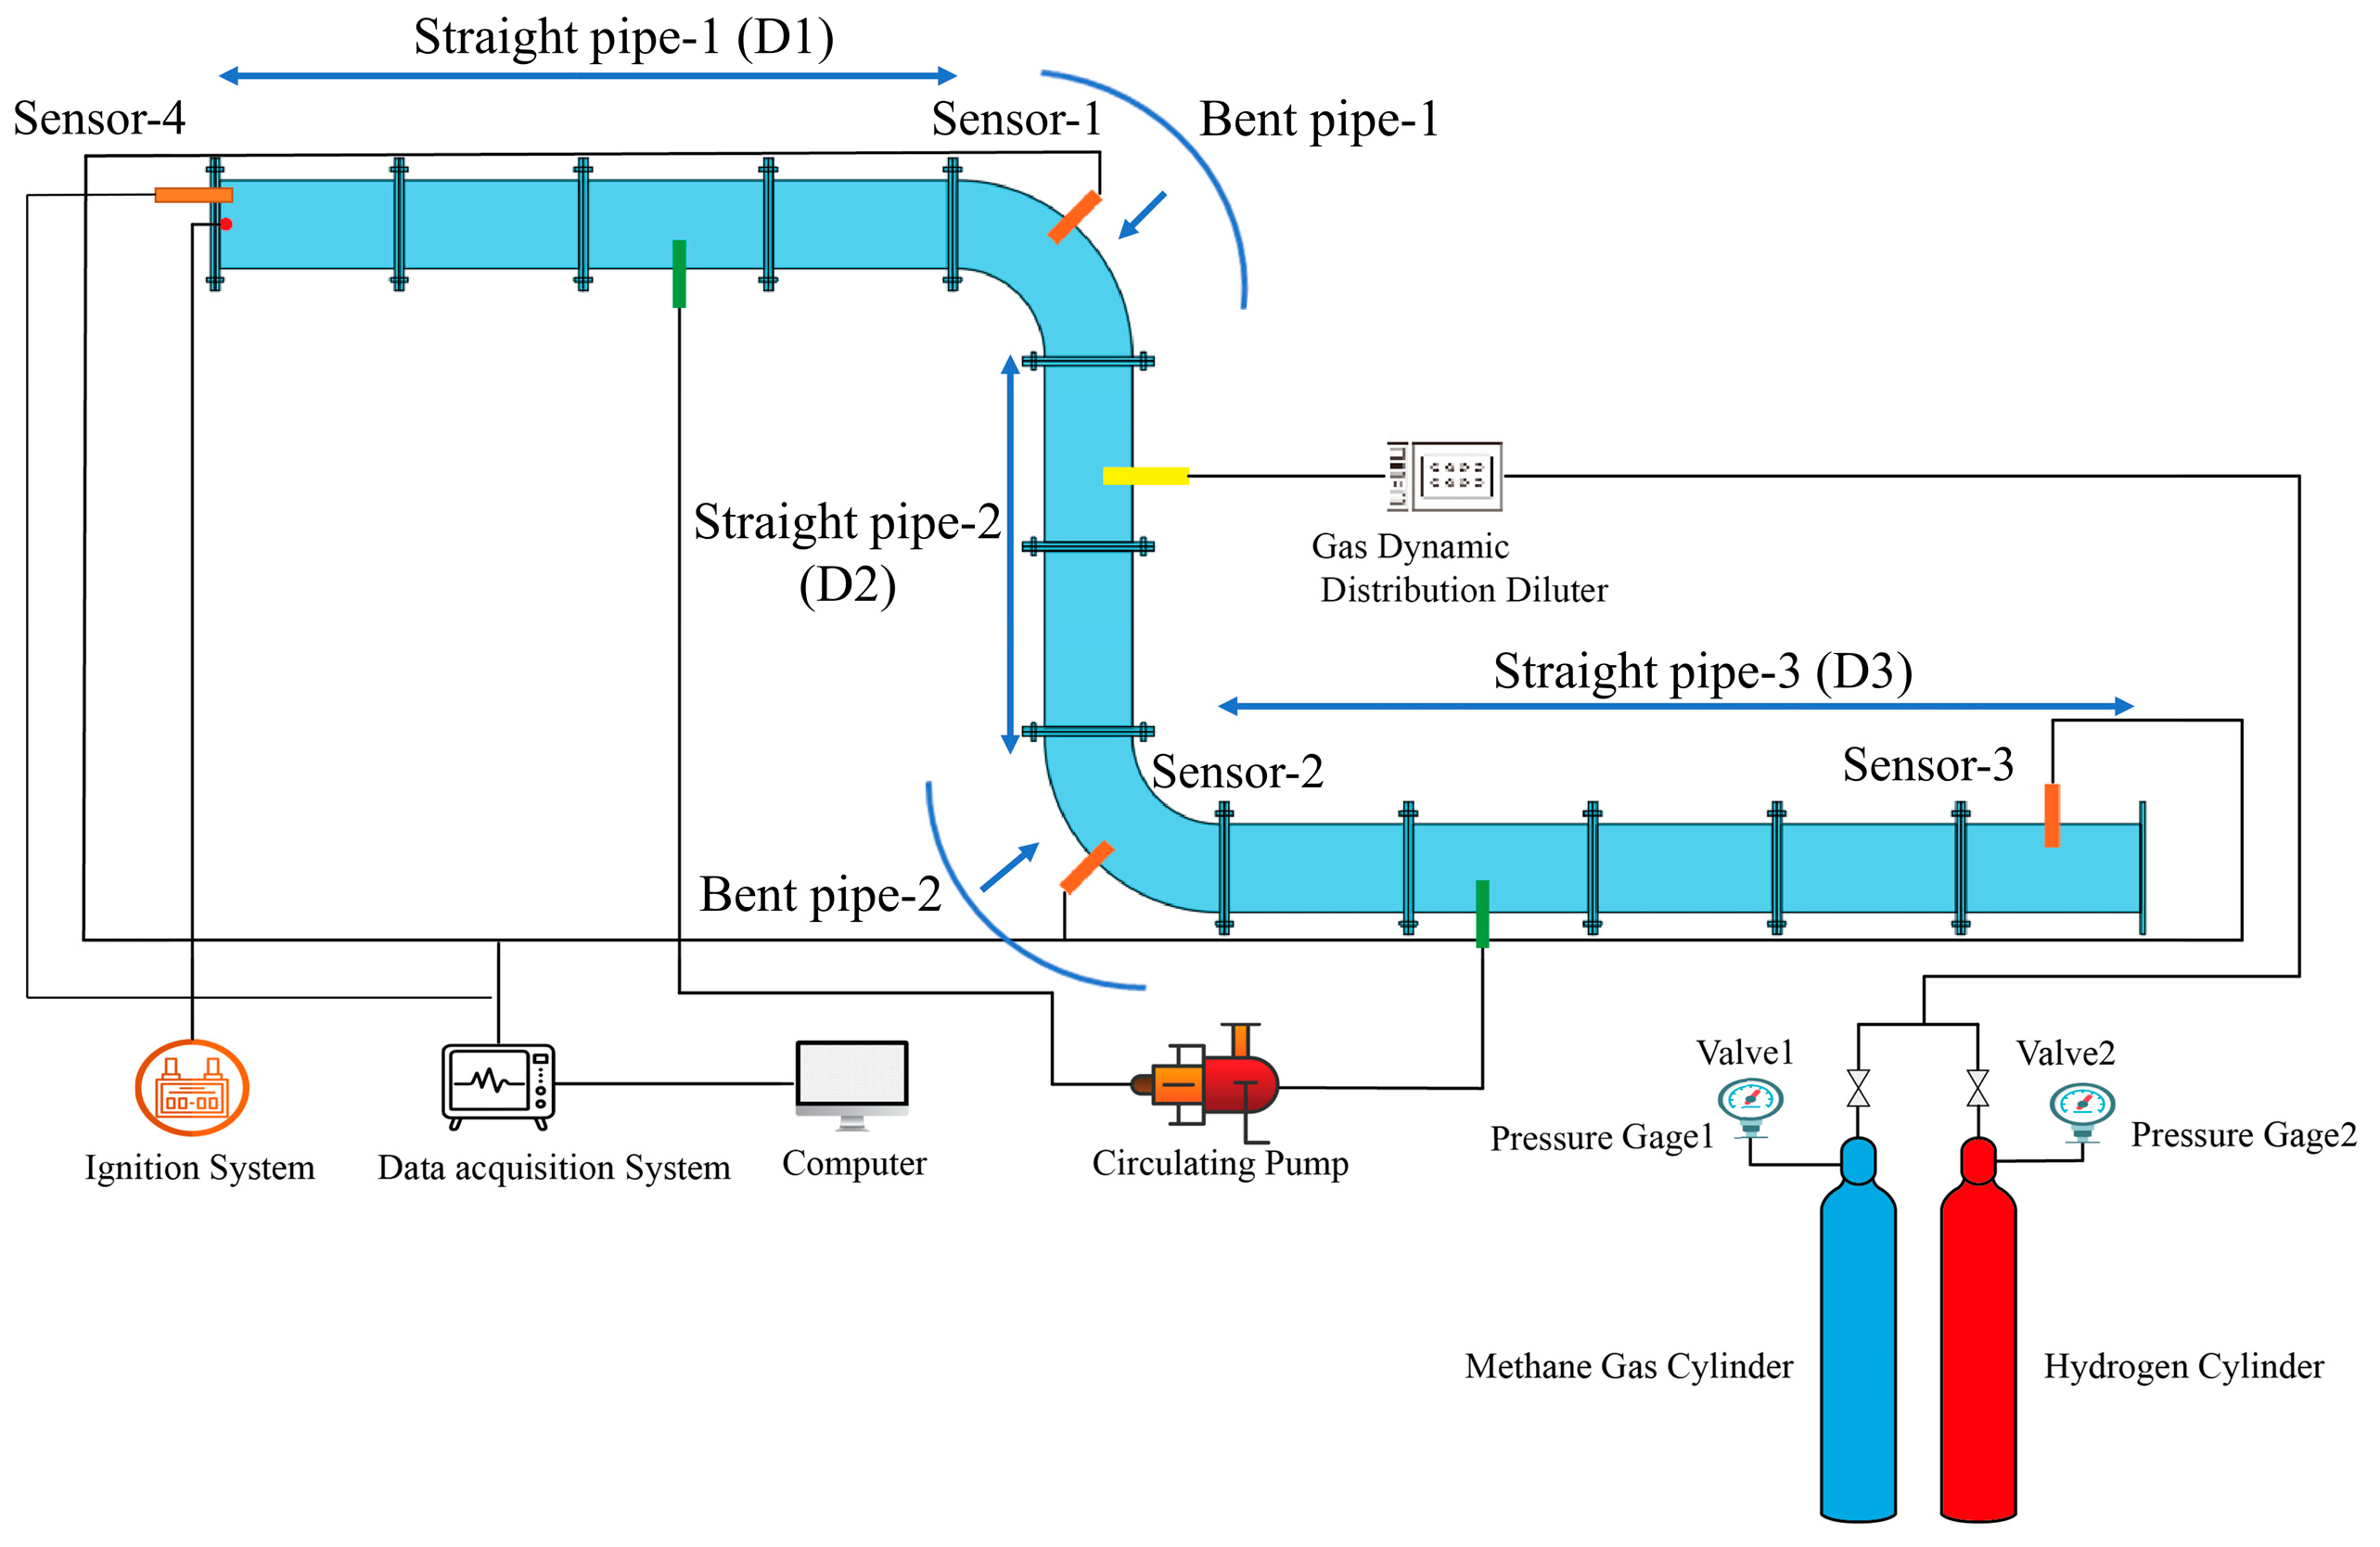
Figure 1. Experimental equipment.
Fire 08 00328 g001
Figure 2. Model and meshing.
Fire 08 00328 g002
Figure 3. Comparison of simulated and experimental overpressure.
Fire 08 00328 g003
Figure 4. Simulated (left) and experimental [41] (right) flame propagation dynamic processes.
Fire 08 00328 g004
Figure 5. Explosive pressures of methane/hydrogen mixtures obtained at three pressure monitoring points.
Fire 08 00328 g005
Figure 6. Comparison of pressures obtained by Case 1 to Case 4 based on LES.
Fire 08 00328 g006
Figure 7. Comparison of pressures obtained by Case 5 to Case 8 based on LES.
Fire 08 00328 g007
Figure 8. Pmax and (dp/dt)max at different distances.
Fire 08 00328 g008
Figure 9. Curvilinear relationship between distance and Pmax and (dp/dt)max.
Fire 08 00328 g009
Figure 10. Comparison of flame characteristics.
Fire 08 00328 g010
Figure 11. Propagation process of Case 1 to Case 4 flame fronts in the pipe.
Fire 08 00328 g011
Figure 12. Propagation process of Case 5 to Case 8 flame fronts in the pipe.
Fire 08 00328 g012
Figure 13. Distribution of pressure values when the flame reaches the bent pipe-2 pipe.
Fire 08 00328 g013
Figure 14. Flame propagation velocity changes over time in Case 1 to Case 4 based on LES.
Fire 08 00328 g014
Figure 15. Flame propagation velocity changes over time in Case 5 to Case 8 based on LES.
Fire 08 00328 g015
Figure 16. Temporal variations in flame area for pipes in different conditions based on LES.
Fire 08 00328 g016
Figure 17. Flame area peak-1 and peak-2 at different distances.
Fire 08 00328 g017
Figure 18. Curvilinear relationship between distance and flame area peak-1 and flame area peak-2.
Fire 08 00328 g018
Table 1. Detailed information on each condition.
CaseLength (mm)
D1D2D3
14002001400
28002001000
31200200600
41600200200
52004001400
62008001000
72001200600
82001600200
92000 (long straight pipe)
Disclaimer/Publisher’s Note: The statements, opinions and data contained in all publications are solely those of the individual author(s) and contributor(s) and not of MDPI and/or the editor(s). MDPI and/or the editor(s) disclaim responsibility for any injury to people or property resulting from any ideas, methods, instructions or products referred to in the content.