Article

Analytics and Trends over Time of Wildfires in Protected Areas in Greece and Other Mediterranean Countries

by
Aristides Moustakas
Natural History Museum of Crete, University of Crete, 71409 Heraklion, Greece
Fire 2025, 8(8), 324; https://doi.org/10.3390/fire8080324
Submission received: 10 June 2025 / Revised: 25 July 2025 / Accepted: 7 August 2025 / Published: 14 August 2025

Abstract

Wildfires are becoming more frequent and widespread, posing a threat to European ecosystems. Recent findings quantified a large fraction of Europe’s burnt areas within Natura 2000 protected area sites. This study analyzed total wildfire events and burnt areas in Greece. The frequency of protected area burn percentages per fire event and their trend over time were quantified. The mean protected area percentage of burn per fire event across other Mediterranean countries was compared. Results indicated an increase in the total number of wildfire events over time, while total burnt area was highest in recent years but generally varied. Forest-type vegetation burn exhibits no trend over time with the exception being that the transitional vegetation percentage of burn per wildfire is increasing, while agricultural land is decreasing. The protected area percentage of burn per wildfire is not related with total area burn. The majority of the high percentage protected area burns derive mainly from small or medium total area burn wildfires. More than a third of wildfires burned exclusively (100%) Natura protected area surfaces. Protected area percent per burn is increasing over time. This increase is not related to the increased total burnt area. Protected area percent per burn is considerably higher in Greece in comparison to Italy, Spain, and Portugal. Protected area percent per burn is increasing over time in Greece and with a slower slope in Portugal, while it has no monotonic trend in Italy and Spain. Reserves face increasing burn frequency, necessitating effective management strategies to conserve them. Climate change exacerbates total wildfires or surface area burned but cannot entirely explain the steep increase in protected area percent per burn. While a legislative framework preventing arson exists, management measures need to further improve the efficacy and clarity of legislation. High-power electricity networks and wind and solar energy facilities are often causes of wildfires and should receive low priority or not be licensed in Natura areas.

1. Introduction

Wildfires have long been a part of European forest ecosystems, helping to regenerate habitats, shape landscapes, and promote biodiversity [1]. However, wildfires pose also a significant threat to European ecosystems, with increasing frequency and extent in the Mediterranean and in Central and Eastern Europe [2,3]. Global wildfire regimes are changing due to increased frequency and extent, affecting conservation reserves and fire-threatened species [4]. Europe has undergone a sharp rise in wildfire activity in recent years, with burnt areas several fold higher than the previous 10-year average in several EU countries [2,3]. Climate change, urban migration, and human activity are contributing factors to increased wildfire risk. Climate change has led to warmer temperatures, prolonged droughts, and unpredictable weather patterns, making forests more susceptible to ignition and rapid spread of wildfires [5]. Due to urban migration, forest areas are not as well managed, which has increased the amount of dry vegetation and wildfire fuel [6]. Human activity, such as discarded cigarettes, poorly managed campfires or agricultural and pastoral clearance, electricity infrastructure in forests, or arson, often triggers wildfires [7,8]. The effects of wildfires on the economy, society, and ecology are impactful and complex [9,10], and public interest is high [11].
Wildfires result in losses in biodiversity, species, and ecosystem services [12]. They affect pattern formation, species succession, and landscape composition [13,14,15]. Wildfires release gases and particulates that decrease carbon sinks and contribute to climate change [16]. Long-term production is weakened by the loss of soil organic matter and mineral fertilizers [17]. Additionally, wildfires change the rate at which water infiltrates, increasing the likelihood of erosion and landslides in burnt areas [18]. Severely burned ecosystems can take decades to recover, which feeds the cycle of environmental deterioration [19]. This also results in the creation of new, unmaintained agricultural land more vulnerable to wildfires [6].
In addition to the impacts that wildfires have on ecosystems and the environment, wildfires have strong effects on the economy, society, and health [10]. Wildfires threaten homes, lives, and livelihoods, causing extensive destruction and economic costs [10]. The ongoing debate on land management and prevention is also a concern, with experts arguing for controlled burns, better forestry practices, stricter regulations, and improved emergency response systems [20,21]. Wildfires also pose health risks, with smoke drifting for miles, causing respiratory problems, and environmental damage [22]. Understanding wildfires and their control remains a complex challenge, with global temperatures expected to increase wildfire risk.
The Natura 2000 protected area network, comprising over 27,000 protected nature sites, covers nearly one-fifth of land and one-tenth of the surrounding seas, covering a vast array of wildlife and habitats [23]. These sites, ranging from less than one hectare to hundreds of square kilometers, include protected nature reserves and various habitat types [23]. The Birds and Habitats Directives, which have been in place for over 30 years, provide the legal framework for protecting and managing Natura 2000 sites. Analysis reports that in 2023, 41% of Europe’s burnt areas were within Natura 2000 sites, a significant figure given that the European network of Natura 2000 protected areas covers only 18% of European Union (EU) territory [24]. Greece has 5752 and 23,000 known plant and animal species, respectively, with 22% and 17% of them endemic, making it a global biodiversity hotspot [25]. It also boasts a vast Natura 2000 network of protected areas, which covers 27.3% of its land [26].
Protected areas house plants and animals found nowhere else, and their loss is irreversible [27]. The loss of foliage due to wildfires affects the entire food chain [28]. The damage may also change the landscape permanently, acting as a tipping point [29]. When the damage is not permanent, it can weaken ecosystems’ ability to bounce back quickly, taking years or decades to fully recover [28]. Important habitats, such as rare orchid populations or nesting sites for protected birds, can be severely affected, leading to declines in species relying on these habitats [30,31]. Some vulnerable species face a heightened risk of extinction due to repeated fires [29]. Wildfires in protected areas release large amounts of greenhouse gases, contributing to climate change [32]. This creates a dangerous cycle, as climate change often increases the likelihood and severity of fires. The impact extends beyond the immediate area, with communities facing increased risk of damage and danger, leading to closures of protected sites for safety reasons [33]. These closures hamper conservation efforts and limit public access to natural spaces, impacting eco-tourism and local economies [10]. Without proper management, fires are likely to become more frequent and intense, threatening the integrity of Natura 2000 sites [34].
This study initially sought to quantify (1) the number of wildfire events and the total area burnt over time in Greece. This study was conducted to identify whether wildfire events or total burnt area are exhibiting a trend over time in Greece. Percentage of burn per wildfire event was examined across artificial, agricultural, and forest vegetation land cover types. This was performed to identify if a specific land cover type is higher per burn or if it exhibits a trend over time, as well as the potential links with climate change, land, and environmental management. (2) Sequentially, the percentage of burn per wildfire event was examined for the Natura 2000 protected surface area in Greece. This research was conducted in order to quantify the percentage of protected area burnt per wildfire event and the trend over time. (3) Statistical distributions of and correlations between total area burnt per wildfire event and percentage of Natura burnt per wildfire event were examined to quantify if large fires in terms of total burnt area also burn a large percentage of protected area surface. The probability of a wildfire burning a Natura surface over time is quantified in order to examine if the chance of wildfires burning protected area surface is increasing, or if the total protected area burnt per fire event or percentage of protected area burnt per fire event are increasing. (4) Mean percentage of Natura burn per wildfire event as well as the trend over time of was examined in Italy, Spain, and Portugal and compared with Greece. The percentage of burn per wildfire event and trend over time is discussed in comparison with the percentage of Natura cover across each country. The study covers the past 17 years using a dataset that is comparable across the study countries.

2. Methods

2.1. Data

The European Forest Fire Information System (EFFIS) rapid damage assessment is a publicly available online dataset that provides daily updates on the perimeters of burnt areas in Europe for fires. The product does not distinguish between wildland fires, or prescribed fires. Burnt scars of a minimum size of 30 hectares or larger are mapped, and small burnt or un-burnt areas below the spatial resolution of satellite imagery are not mapped. The EFFIS burnt area product is updated twice daily, and the perimeter of burnt areas due to different fires occurring between two sequential updates may be merged into a single perimeter. The minimum resolution deployed in the EFFIS dataset accounts for approximately 75–80% of the total area burned in the EU. Equations have been established for each country based on historical fire data from the EFFIS European Fire Database, allowing for high-accuracy predictions of total area burned. The burnt area mapping is based on satellite imagery and remote sensing to identify active large fires, region-growing algorithms to expand burnt areas, and visual interpretation of images to refine the final fire perimeter. Data are publicly available at the following website: https://forest-fire.emergency.copernicus.eu/apps/data.request.form/ (accessed on 12 February 2025).
The EFFIS data was retrieved for Greece for the period of January 2008 to end of December 2024. This resulted in a number of n = 1733 burn events. Throughout this work ‘protected area’ refers to the Natura 2000 protected area network. The date of fire in terms of month and year were recorded. The initial data have a daily temporal resolution and were averaged on a monthly time scale. Variables retrieved per fire event recorded in the database included (1) total burnt area in ha, (2) broadleaved forest percentage of burn per fire event, (3) coniferous forest percentage of burn per fire event, (4) mixed forest percentage of burn per fire event, (5) sclerophyllous vegetation percentage of burn per fire event, (6) transitional vegetation percentage of burn per fire event, (7) agricultural land cover percentage of burn per fire event, (8) artificial land cover percentage of burn per fire event, and (9) protected area (Natura 2000) percentage of burn per fire event. For example, a score of 17% of mixed forest burn per fire event denotes that from the total area burned during that fire, 17% included mixed forests; it does not denote the fraction of mixed forests in Greece burned. The percentage of protected area (Natura 2000) burned per fire event was also retrieved for the same study period from the same dataset (EFFIS) for Italy, Spain, and Portugal for comparisons. Data regarding the percentage of the surface area of each of the four countries in terms of Natura 2000 protected areas was retrieved from [35].

2.2. Analysis

2.2.1. Wildfires in Greece

Surface area burnt in hectares per year as well as the annual number of wildfire events was quantified. Time trends regarding the percentage of artificial, agricultural, broadleaved, coniferous, sclerophyllous, and mixed forest land cover types as well as transitional vegetation burn per wildfire event across time were quantified. This was conducted in order to quantify whether wildfires in a particular land cover type are overall higher or exhibit a trend over time [36]. To accomplish this, a smoother line with confidence intervals was fitted in terms of time [37]. Smoother lines do not apply a particular model, like a regression line, or a linear trend, or a theoretical distribution; a smoother line is fitted to the data and aids in examining possible links between two variables [38]. A linear regression was also fitted for comparisons.

2.2.2. Wildfires in Protected Areas in Greece

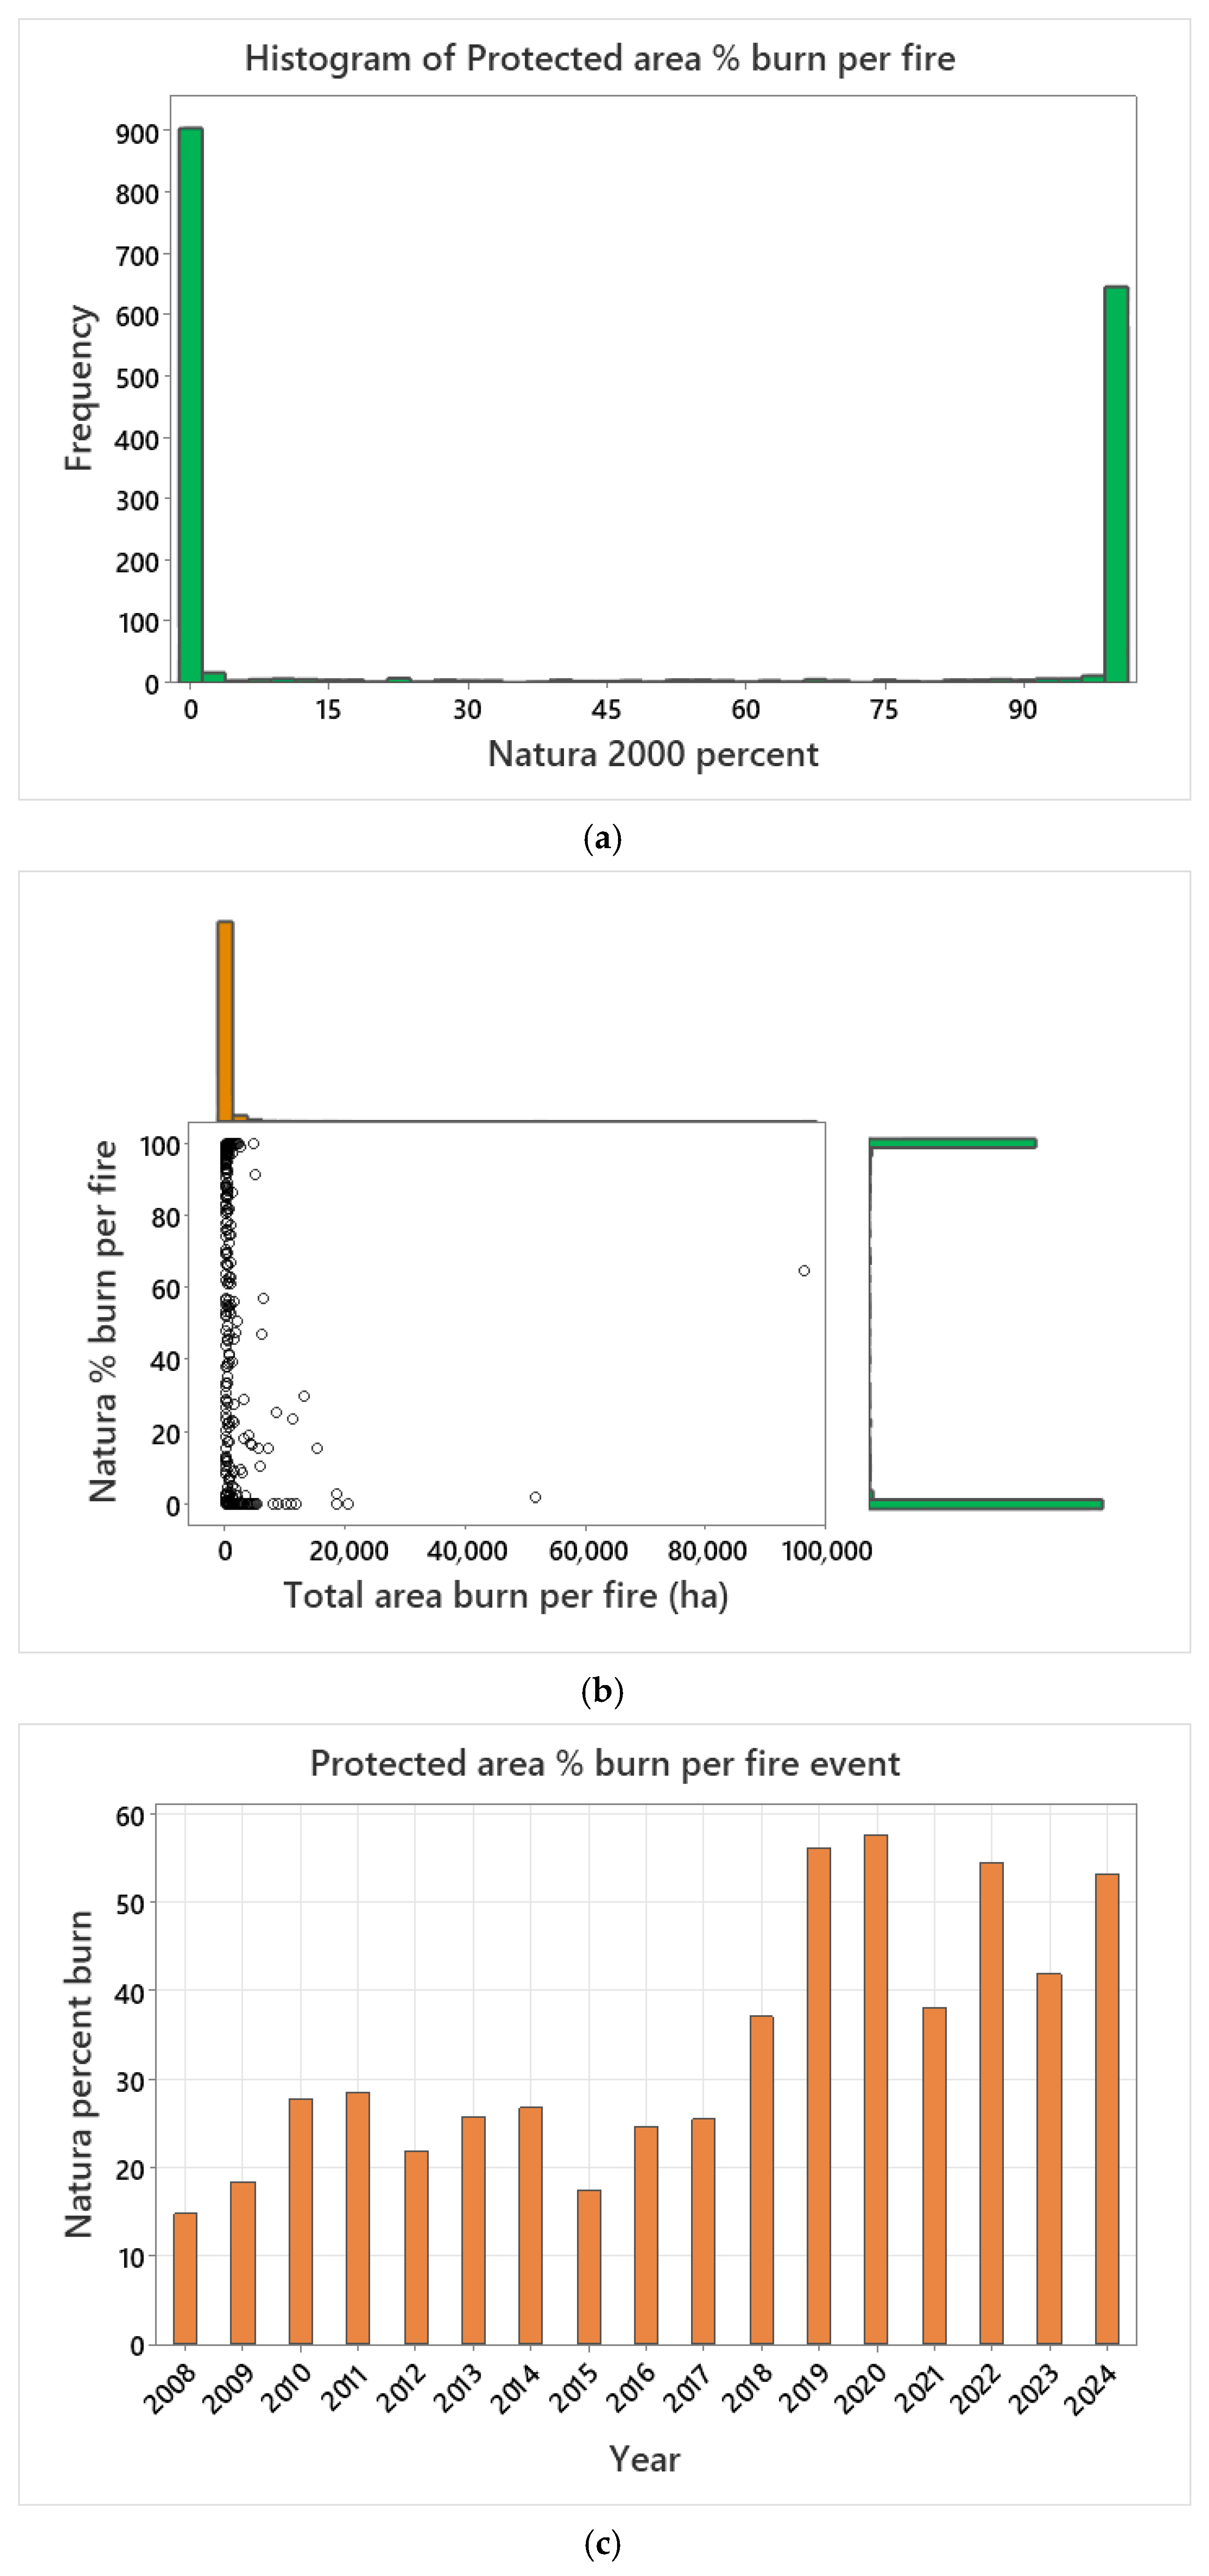
The statistical distribution in terms of binned frequencies of the percentage of Natura 2000 burn per wildfire event was quantified. This was conducted in order to quantify the percentage of Natura land burnt per fire event and to quantify if most fires burn a high, intermediate, or low percentage of Natura land per fire event. Natura percentage of burn per wildfire event was compared in terms of binned statistical distribution versus the total burnt area in ha per wildfire event. This was conducted in order to quantify whether total area burnt and Natura percentage of burn follow the same pattern or have a similar statistical distribution.
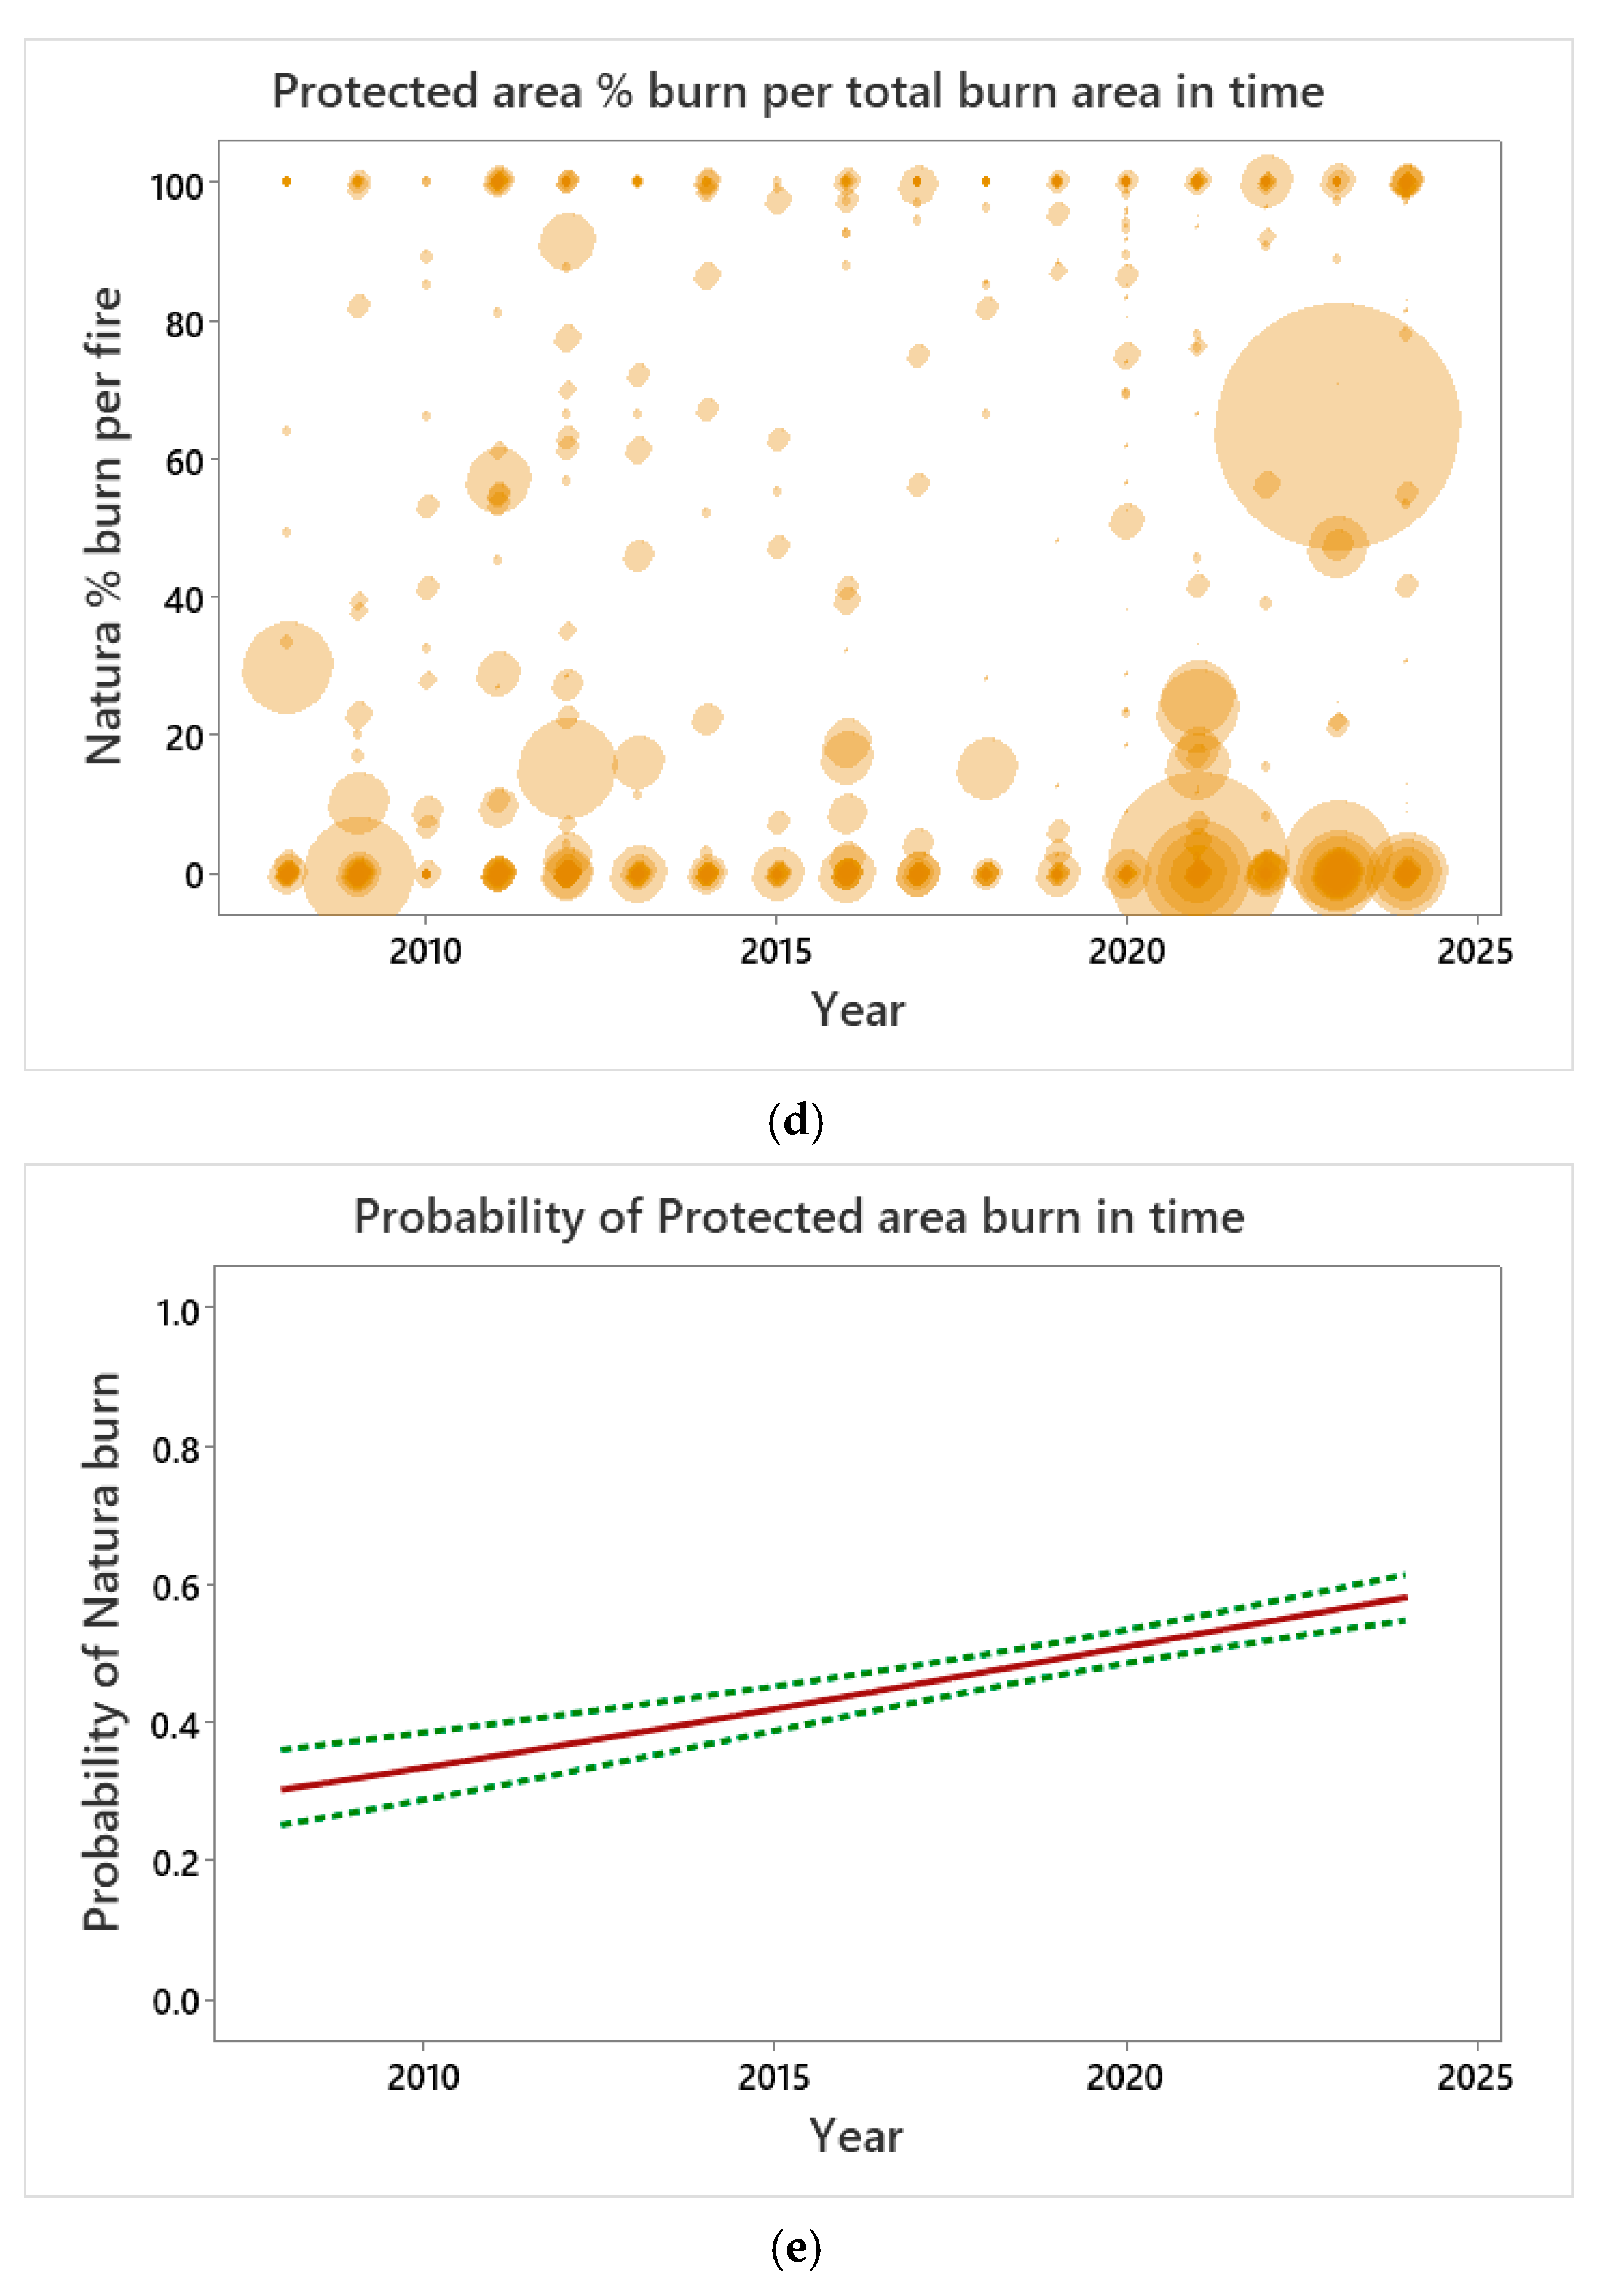
In order to quantify whether large surface area burn wildfires burn, in general, higher percentage of Natura land, a generalized linear model (GLM) was fitted [39]. The GLM included percentage of Natura burn as the dependent variable and wildfire surface area in ha as an independent explanatory variable. A positive slope in the fitted GLM would indicate higher Natura percentage burn for a larger total surface area burn; a negative slope would indicate the opposite, while a slope close to zero would indicate negligible correlation. Bubble plots of the percentage of Natura land burned per wildfire event over time were constructed in order to further examine the relationship between wildfire size and Natura burn percentage over time [40]. Bubble plots were deployed in order to visualize the percentage of Natura land burnt per wildfire per year, with each bubble indicating the total area burnt in that wildfire event. A larger bubble size indicates a larger total area burnt, and, thus, a larger surface area wildfire will have burnt a larger percentage of Natura land. Doing so it is examined if more recent larger wildfires are burning higher percentages of Natura over time.
The probability of a wildfire burning a Natura surface over time is quantified by deploying a binary logistic regression [41] in order to examine if the chance of wildfires burning protected area surface is increasing or if the total protected area burnt or percentage of protected area burnt per fire event are increasing. To achieve this, a binary variable was introduced, with zero value indicating no Natura area burnt in the wildfire event and a value equal to one if the wildfire included Natura burn. A binary logistic regression quantifies how continuous factors, like time, influence the likelihood of a Natura burn. The equation and plot display a continuous variable on the x-axis (time in years), representing a binary response on the y-axis (Natura burn or not). A logistic regression line shows the predicted probability of the binary outcome (Natura burn or not) at different values of the predictor variable (years). The plot demonstrates how the outcome probability changes with the predictor variable, indicating whether the outcome increases or decreases with time.

2.2.3. Wildfires in Protected Areas in Mediterranean Countries

Protected area burns in Greece were compared with the ones in Italy, Spain, and Portugal across the same time span. Mean percentage of Natura land burnt per wildfire event was calculated. This was conducted in order to quantify whether the Natura percentage of burn per wildfire in a particular country was higher than in other countries. Kruskal–Wallis non-parametric tests were deployed to compare statistical differences of Natura percentage of burn per wildfire between countries.
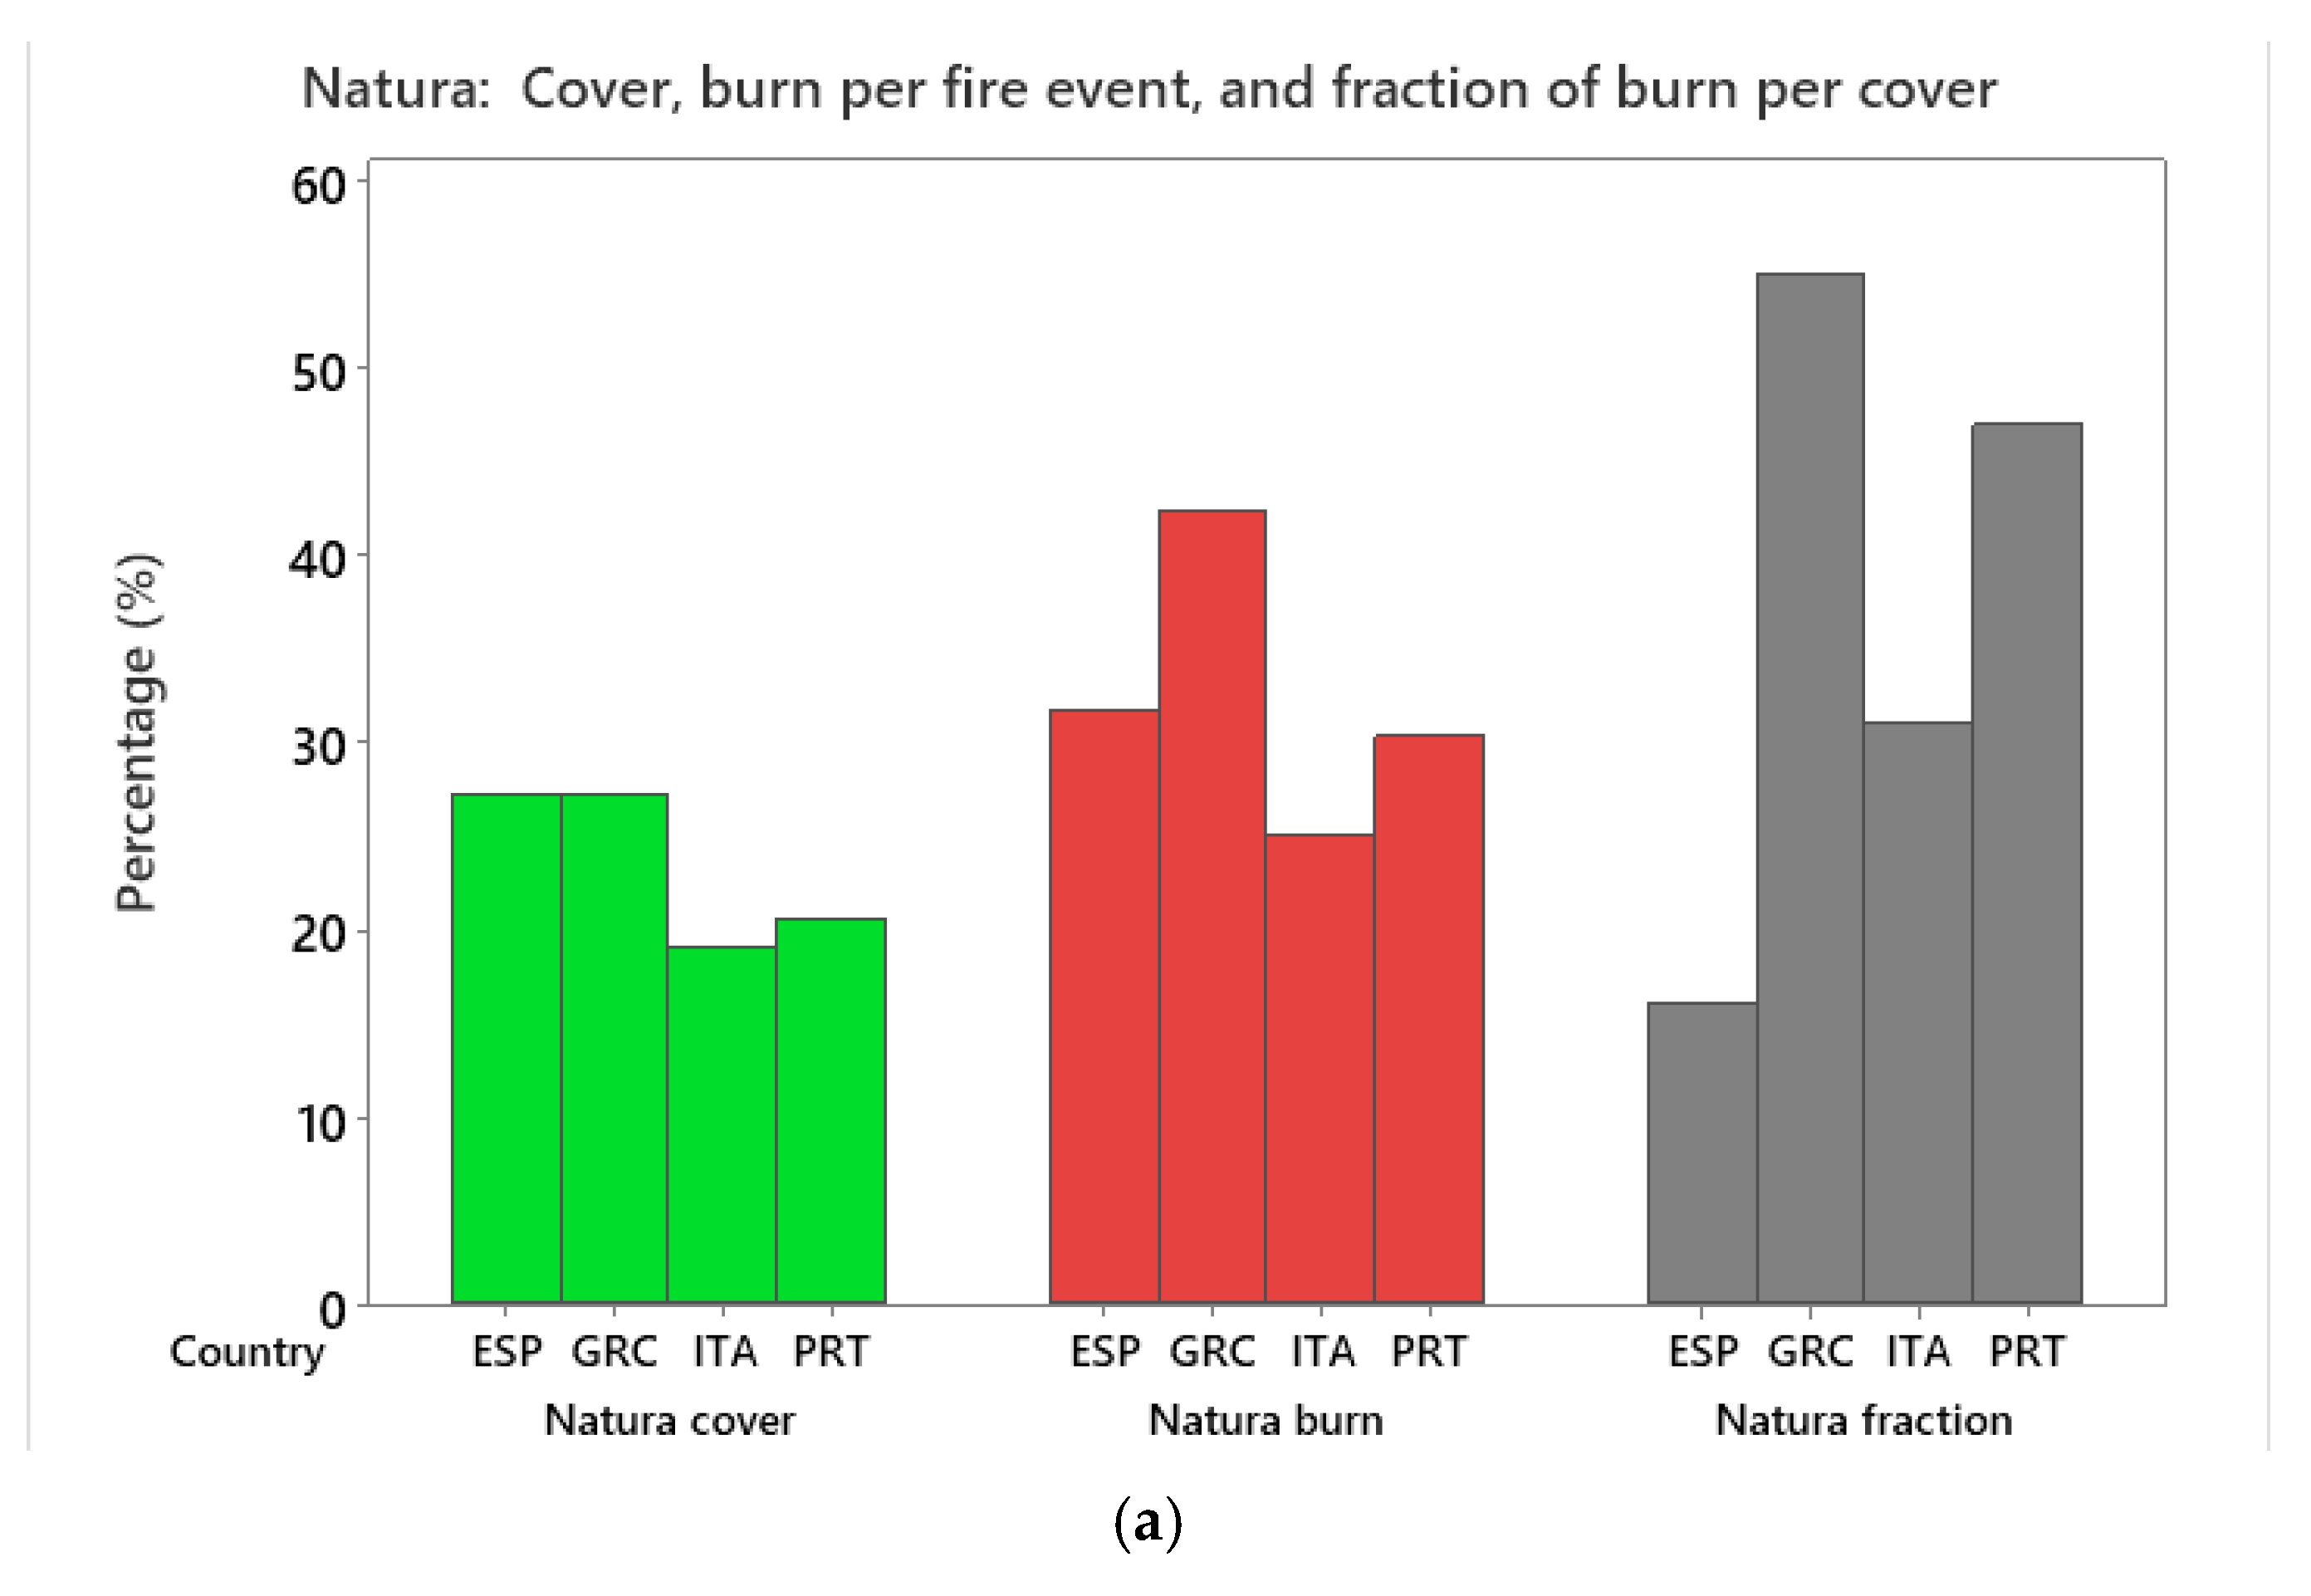
In addition, the fraction of the protected area burnt per country was calculated by dividing the mean percentage of Natura burnt per wildfire event across the data by the percentage of the country’s surface area within the Natura protected area network, multiplied by 100. This was conducted in order to quantify percentages of Natura burn per wildfire event based on how much of the country’s surface area is in the Natura protected area network.
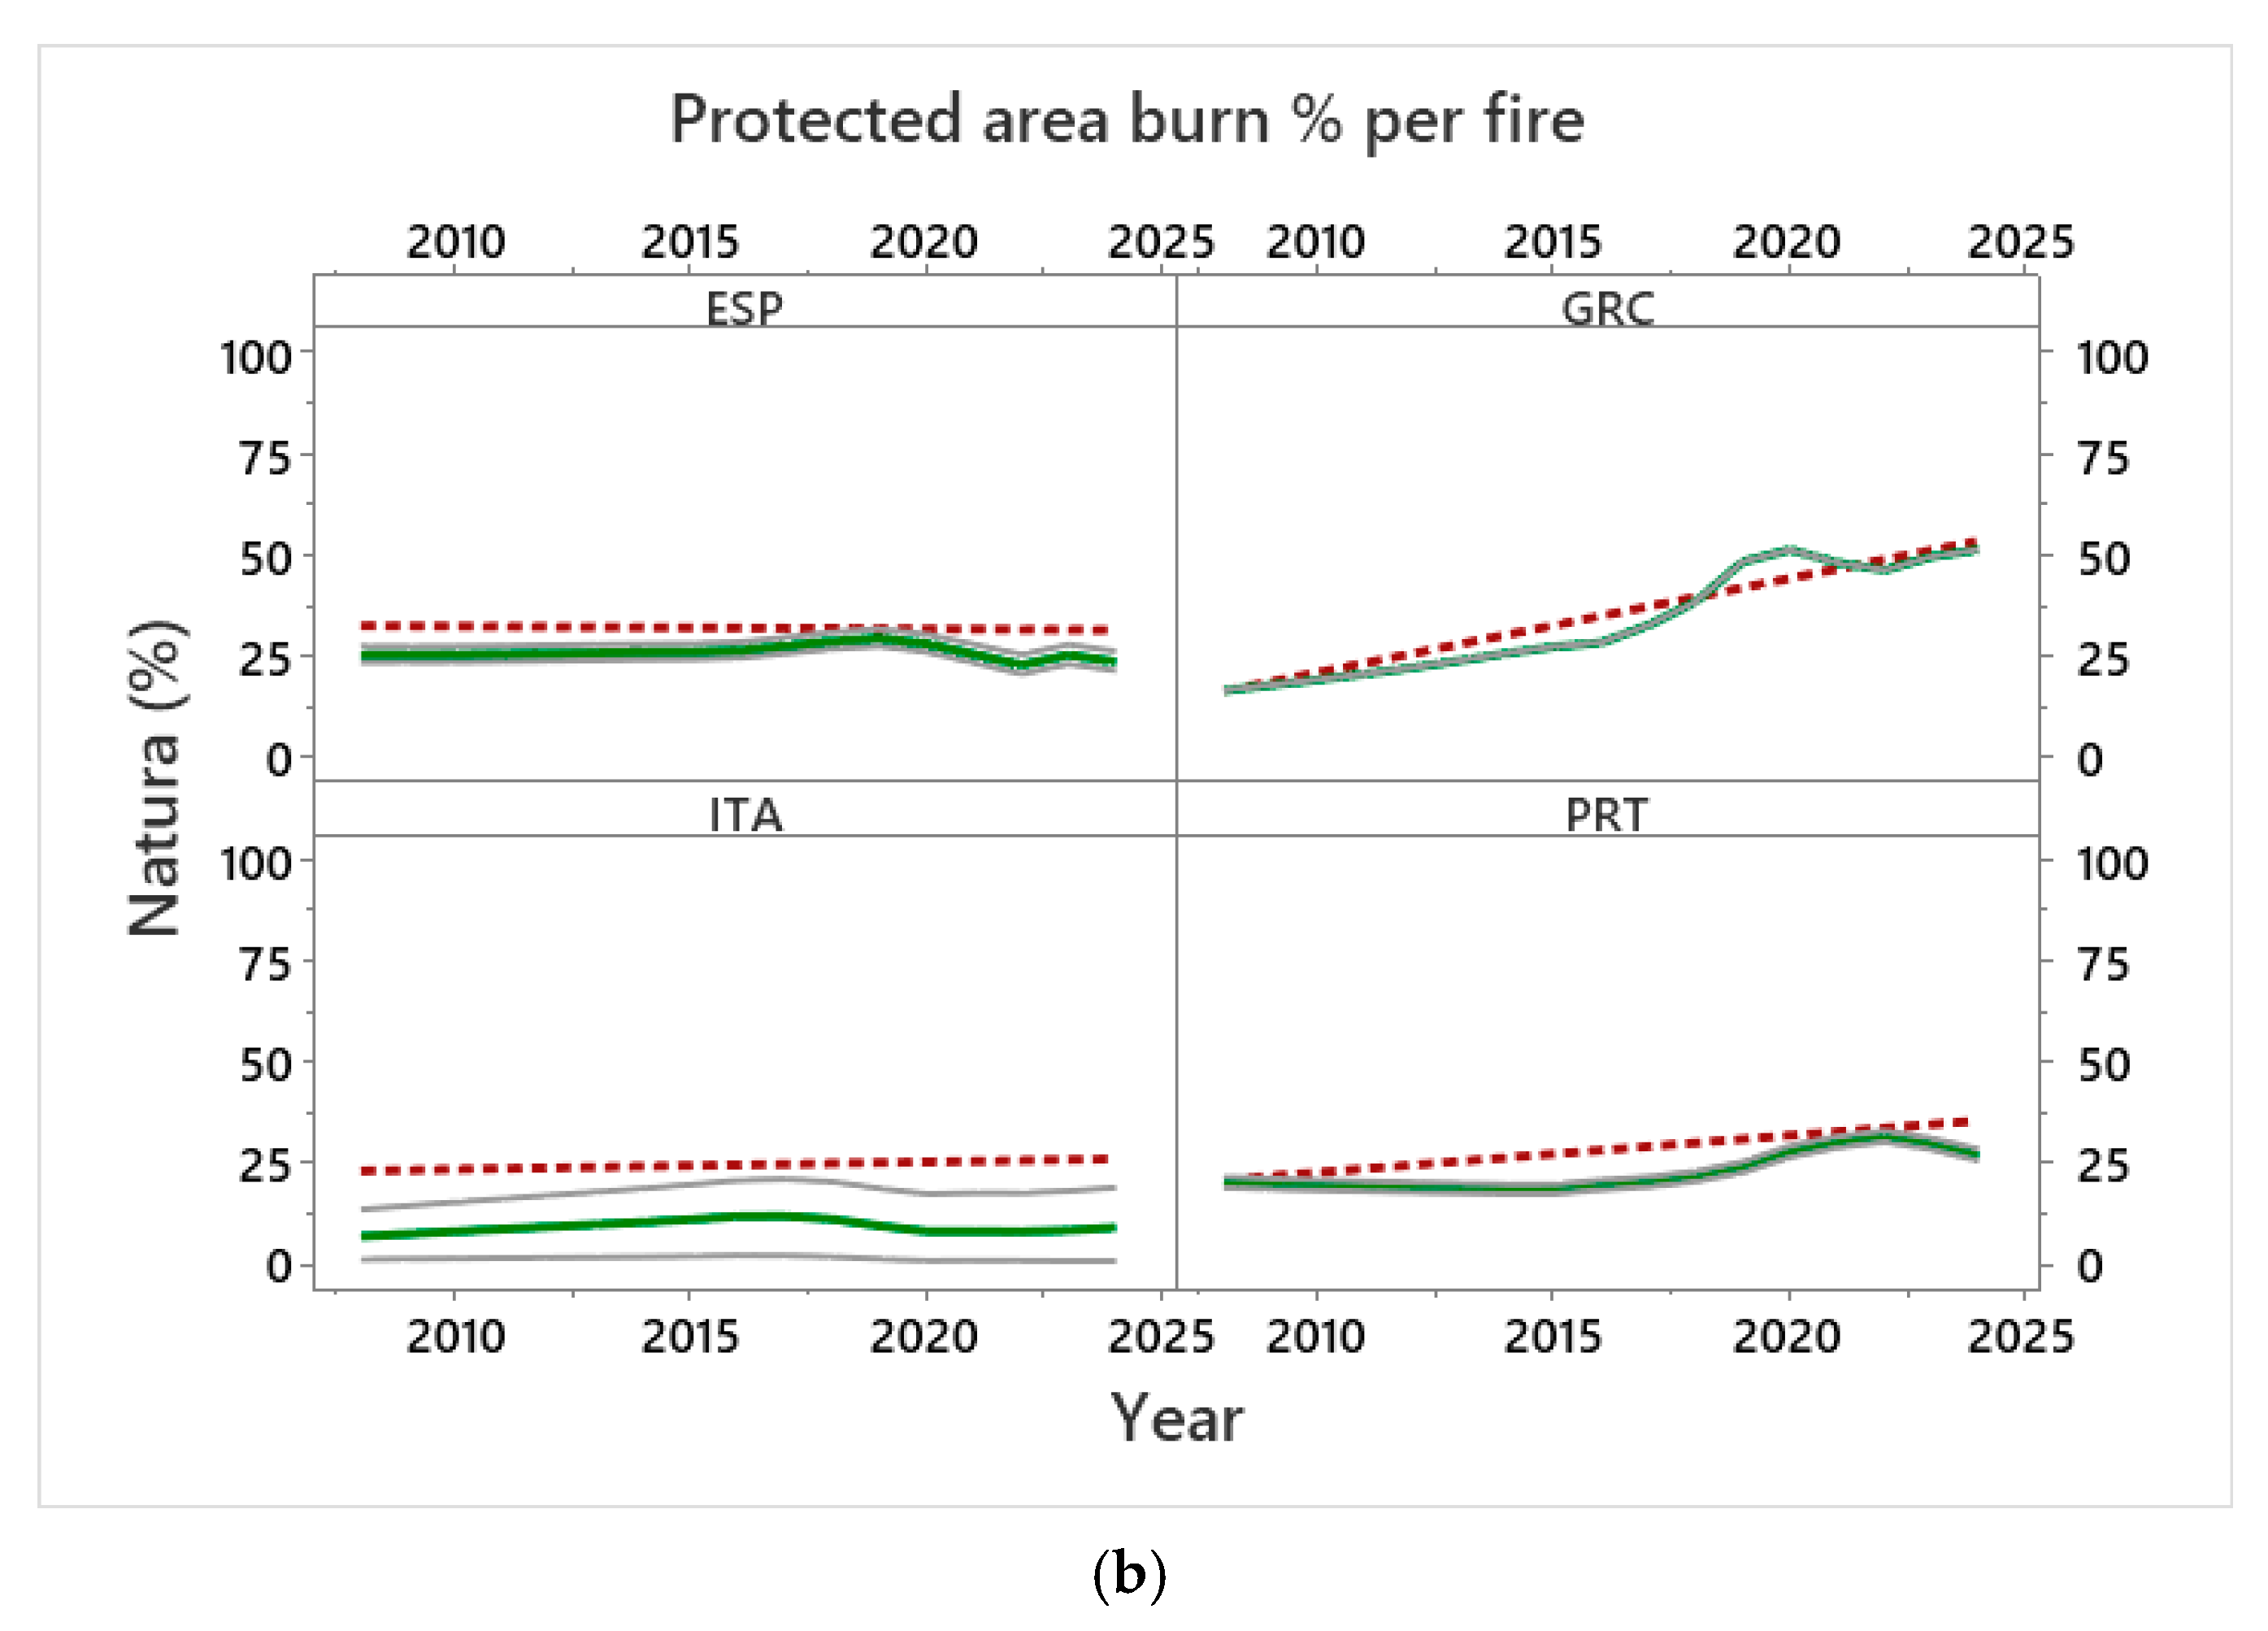
Time trends regarding the percentage of Natura burn per wildfire event across time were quantified. This was conducted in order to quantify whether Natura wildfires in a particular country are exhibiting a trend over time [36]. To achieve this, a smoother line with confidence intervals was fitted over time [37]. A linear regression was also fitted for comparisons.

3. Results

3.1. Wildfires in Greece

Total burnt area in Greece varied between years from 2008 to 2024, and there was no monotonic trend over time (Figure 1a). The years of 2021 and 2023 exhibited exceptional total burnt area in ha (Figure 1a). The number of wildfires drastically increased from 2020 onwards, with the number of wildfire events exceeding a twofold increase in comparison with years prior to 2020 (Figure 1b). Mean area burned per wildfire event varied between years and, in general, does not co-vary with total burn area during the same year; thus, higher total burnt area is not related with more wildfire events (Figure 1a,b). The majority of burns included sclerophyllous and agricultural land cover types (Figure 1c). The percentage of agricultural land cover as well as sclerophyllous vegetation land cover burn per wildfire event decreased over time (Figure 1c). The percentage of artificial land cover burn per wildlife event, as well as broadleaved, coniferous, and mixed forest land cover burn per wildfire event, was stable over time (Figure 1c). The percentage of transitional vegetation land cover burn per wildfire event mildly decreased until 2020 and abruptly increased over time thereafter (Figure 1c).

3.2. Wildfires in Protected Areas in Greece

The statistical binned distribution of wildfires in Greece in terms of percentage of burn per wildfire event indicated that the majority of wildfires either included no Natura surface burn (0% of protected area land cover burn per wildfire event), or burned exclusively Natura areas (100% of protected area land cover burn per wildfire event) (Figure 2a). Out of 1733 wildfire events in the study period, 640 wildfires (37% of wildfires) burned exclusively protected area surfaces (Figure 2a). Wildfire events burning only a small fraction of protected area per burn are rare (Figure 2a). The distributions of total area burned per wildfire event (ha) and the percentage of Natura 2000 area burned are not similar; total area burned per wildfire includes several small surface area wildfires and fewer larger ones, while the percentage of Natura burn per wildfire peaks at no Natura burn and at only Natura burn (Figure 2b). The protected area percentage of burn per wildfire event increases from 2018 onwards (Figure 2c). In the years 2019, 2020, 2022, and 2024, the mean percentage of protected area burn per wildfire event exceeded 50% (Figure 2c). Results from a GLM indicated that there is a statistically significant but weak (slope close to zero) negative relationship between Natura burn percentage and total burn area in ha, indicating that large wildfires burn a lower percentage of the protected area surface. In practice, the correlation between wildfire size and protected area burn is negligible. The regression equation is as follows:
Natura burn % = 42.73 − 0.000808 × Total area burn
GLM fit statistics: Df = 1, Adj SS = 9617, F-Value = 4.21, p-Value = 0.04
Bubble plots indicate that large surface area burn wildfires consistently burned a relatively small percentage of Natura areas over time, with the majority of large surface area burn wildfires including less than 35% of protected area land cover percentage (Figure 2d). Between 2020–2024 the majority of large surface area burnt wildfires included zero or a very low percentage of Natura burn, with the exception of a single wildfire in 2023 (Figure 2d). Therefore, recent large wildfire burn areas include small percentage of Natura burn, and most high percentage of Natura burn wildfires are smaller sized ones. The probability of Natura burn increases over time (Equation (2); Figure 2e). In addition, the confidence interval of the probability of Natura burn has narrowed, indicating higher burn certainty (Figure 2e). After 2020, the chance that a wildfire event will include Natura surface exceeds 50% (Figure 2e). The equation of probability of Natura burn over time is as follows:
P(Natura burn) = [exp(−146.3 + 0.0725 × Year)]/[1 + exp(−146.3 + 0.0725 × Year)]
Statistics of fit: AIC = 2358.98, BIC = 2369.90, chi-square = 47.37, and p-Value << 0.001

3.3. Wildfires in Protected Areas in Mediterranean Countries

The Natura 2000 protected surface area of Greece and Spain is 27.3%; in Portugal, it is 20.6%; and in Italy, it is 19.1% (Figure 3a). Throughout the study period Greece has the highest percentage of protected area burn per wildfire event with a mean of 42.39% per wildfire (Figure 3a). Spain has the second highest percentage of protected area burn per wildfire event, with a mean of 31.72% per wildfire, Portugal followed with 30.34% per wildfire, while Italy had the lowest score, with 25.05% per wildfire (Figure 3a). The percentage of Natura burn per wildfire significantly differs between countries, as indicated by the Kruskal–Wallis test (Table 1). The Natura fraction burnt per wildfire is 55% in Greece, 47% in Portugal, 31% in Italy, and 16% in Spain (Figure 3a). The percentage of protected area burn per wildfire event over time is generally stable in Spain, while it is non-monotonically and slightly increasing in Italy, and there is a non-linear general increase in Portugal (Figure 3b). The percentage of protected area burn per wildfire event over time is both higher and increasing faster than any of the other study countries in Greece (Figure 3a,b).

4. Discussion

Wildfires in protected areas in Greece are steeply increasing as a percentage of burn per wildfire event and are the highest among the EU Mediterranean countries examined. While in recent years a large fraction of Natura areas in the EU were burned [24,34], there is no monotonic increasing trend in Italy and Spain, while the increasing trend in Portugal is alarming but not comparable to the values and steep increasing trend recorded in Greece. Greece exhibits a very high fraction of Natura burn per wildfire when normalized by the country’s surface area in the Natura network, followed by Portugal. Italy has a relatively lower percentage of Natura cover within the country, resulting in a moderate fraction of Natura burn per wildfire, while Spain has the lowest fraction of Natura burn per wildfire when the country’s Natura cover is accounted for.

4.1. Wildfires in Greece

The 2021 and 2023, large surface area fires in Greece were triggered by a combination of natural, climatic, and human-related factors. The 2021 large fires were fueled by extreme heatwaves, climate change, strong winds, poor forest management, inadequate response capacity, arson and accidental ignitions, and decreased firefighting resources [42,43,44]. The 2023 large fires were more frequent and intense, with record-breaking temperatures and drought conditions. Human activity, such as arson or careless behavior, also contributed to the fires. High wind speeds pushed fires rapidly across vast regions, with the Evros region being the hardest hit [45,46,47]. Despite some improvements since 2021, the scale and speed of the fires in 2023 still outpaced the available resources. The 2021 and 2023 large fires resulted in major damage to Euboea, Attica, and the Peloponnese, while the Evros region was hit hardest, with Dadia National Park severely affected and multiple fatalities, including asylum seekers [42,43,44]. Thus, the issue of recent large wildfires is complex, involving a combination of factors.
The only natural vegetation land cover type burn percentage increasing over time in Greece was transitional woodland. This represents the natural development of forest formations and can include clearing cuts, young forest plantations, electric line corridors, natural grassland areas, burnt forests, mineral extraction sites, agricultural lands under recolonization, afforestation on former natural grasslands, and marginal zones of bogs [48]. Species in transitional regions are essential for the long-term preservation of biodiversity and frequently exhibit climate change adaptation [49]. This result may, in part, be driven by a combination of an overall increase in tree vegetation in Greece together with diminished human presence and activities in rural areas [50,51]. Transitional vegetation plays an important role in carbon sequestration, as well as natural vegetation regeneration [50,52], and, thus, management actions are needed to address the increased transitional vegetation wildfire activity.

4.2. Climate Change

Warming weather and climate may explain an increased number of wildfire events, or an increased total area burnt, even though the latter is poorly correlated with the former. However, it does not explain the increased percentage of Natura burn per wildfire, as percentage of Natura burn per wildfire is not related with wildfire size. Notably in the Mediterranean in the past centuries, precipitation variability is the rule, and no trend (e.g., a drier climate) has been identified [53], indicating that dry periods are part of the long-term variability. There is no a priori reason why climate change may act differently inside as opposed to outside protected areas. Forests and trees modulate extreme weather events [54,55], Natura sites usually are more forested than non-protected sites, and, thus, climate change impacts would be expected to be more pronounced in neighboring non-protected areas. In addition, climate change acts differently on different forest vegetation types [2,56], and, therefore, a trend in forest vegetation burnt over time might be expected, had the increased Natura burn mainly been driven only or mainly by climate. For example higher percentage of Coniferous or Sclerophyllous vegetation burn might be expected [57,58]. While no particular forest land cover type is increasing per burn over time, Natura land cover per burn over time is increasing, indicating that the natural vegetation land cover burnt is more commonly in the Natura protected areas. Thus, a combination of warming climate can partly explain the increased total area burned in Greece and increased number of wildfires, while there are subtleties regarding the increasing protected area percentage per burn.

4.3. Wildfire Size—Natura Burn Percentage

Total area burned is negatively and poorly correlated with Natura burn percentage per wildfire, indicating that it is mostly smaller wildfires [59] contributing to larger fractions of protected areas burned. In another study area, a fifth or more of the protected land was burnt during the study period [60]. It was reported that although the majority of wildfires began on agricultural land, natural and semi-natural land cover categories were disproportionately damaged, especially in protected areas [60]. This is unlikely to be the case in Greece, as agricultural land cover burn per wildfire is decreasing over time and the vast majority of wildfires include either 0% or 100% of Natura area burn. This further emphasizes that the majority of wildfires with a high fraction of protected area burn started in the protected areas [61].
Small wildfires in protected areas can contribute to a larger portion of the total burned area due to factors, such as increased fuel load, lower accessibility for firefighting, and the potential for fire spread to be underestimated in remote locations. Protected areas accumulate more biomass due to reduced human disturbance and management practices, leading to higher fire intensity and larger burned areas [62]. Accessibility challenges in remote areas can hinder the speed and effectiveness of firefighting efforts, allowing small fires to grow larger before they can be contained [63,64]. Underestimation of fire spread can also occur, as small fires in remote areas may not be immediately detected or prioritized for suppression [65]. Animal activities are also significant drivers of wildfires, and fire behavior is influenced by fuel characteristics, weather conditions, and potentially steep topography [66,67]. The fact that the majority of wildfires include either 0% Natura burn or 100% Natura burn indicates that once a wildfire is ignited in a protected area, the norm is that it is not controlled.

4.4. Wildfires in Protected Areas in Greece

The reducing human population living in rural areas near Natura sites over time can also explain increased fuel loads. Natura 2000 sites have anthropogenic activities [23], but human presence is generally lower inside than outside [68]. Anthropogenic activities involve agriculture but also land take via roads, artificial surfaces, and infrastructure for wind energy facilities [23,69,70,71,72]. Wind and solar energy facilities do not cause wildfires per se, but some of the largest wildfires globally have been attributed to the electricity network. In Greece, electricity networks have been linked to numerous wildfires, including the Varnavas and Attica wildfire in August 2024, which burned over 10,000 ha and claimed 1 life [73]. The wildfire was caused by a short circuit and falling power cable from a wooden electricity pole near Varnavas [73]. Electrical faults in Greece accounted for 13,420 ha of burned land in 2024, surpassing fires from negligence, lightning, or arson [74]. In 2024 and early 2025, authorities confirmed several wildfires originating from power line short-circuits in several areas between 2013–2015 [75]. The Parnitha wildfire of 2007 was a historical precedent, with one of Greece’s worst wildfires attributed to either an exploding electrical pylon or arson [76]. Elsewhere, the 2018 Camp Fire in California, the deadliest wildfire in state history, was caused by a faulty transmission line hook. The 2023 Lahaina fire in Hawaii was started by downed power lines, and the 2024 Smokehouse Creek fire in Texas was caused by a decayed utility pole. In general, electric grids are agents of wildfires which can be hard to initially detect and even harder to sequentially control [7,77,78].
Institutional and administrative fragmentation, bureaucratic inefficiencies, and limited capacity in protected area management contribute to poor coordination in fire prevention and response. There are also significant institutional and management weaknesses in the forest service, which is understaffed, underfunded, and decentralized. Inadequate fire prevention infrastructure, such as firebreaks, water tanks, and insufficient controlled burns or forest thinning, are also contributing factors [79]. Controlled burns and fuel management were recently made legal [80], but are still rarely used due to a lack of clear objectives and institutional and training barriers. A 2024 EU peer review report recommended urgent reforms, including updated hazard mapping, legal framework review, better funding, and stronger coordination between agencies [81]. Additionally, Greece is set to receive substantial post-pandemic EU funds, but many projects are poorly targeted, outdated, and lack long-term planning [82,83]. Other Mediterranean countries have established more consistent forest monitoring and risk-based planning frameworks [84].
Over 95% of wildfires in the EU are ignited by humans either by negligence or on purpose [8]. Arson is an issue in Greece [85], particularly during summer months, with wildfires often set near protected Natura 2000 zones. The reasons for arson include illegal land use changes, agricultural expansion or grazing, political or economic pressure, and negligence and recklessness [85,86]. Under Greek and EU law, it is illegal to build or develop on burned land, especially in Natura 2000 sites. However, enforcement is weak, and illegal construction or land-grabbing sometimes follows wildfires.
In Greece, citizens generally support protected areas and have sufficient environmental knowledge, but active participation is lacking [87]. Information provision significantly influences perceptions and supports participatory management. Encouraging public participation is crucial for sustainable management [87,88]. Stakeholder perceptions regarding wildfires in Greece indicated a firm conviction that most ignitions are caused by arson [85]. They also perceive that a significant contributing factor to issues with wildfires is the absence of a national cadastral system where both land use and land ownership are firmly stated [85]. Causes of arson in other countries have been attributed to financial and educational status as well as a lack of patrolling prevention [89]. Stakeholder engagement and incorporating a bottom-up policy can prevent wildfires [21].

4.5. Wildfires in Protected Areas

Other studies identified that the main causes of wildfires across protected areas in Mediterranean biomes were variations in controllable factors, like fuel loading and road density; however, abiotic factors also played a role [62]. The same study also reported that fire severity was 20% higher within protected areas in Mediterranean biomes [62]. It has been postulated that protected forestlands lead to higher fire severity levels due to historical logging restrictions, resulting in more biomass and fuel loading in less intensively managed areas after decades of suppression [90]. A study in the USA indicated that forests with higher protection levels have lower fire severity values, despite having the highest biomass and fuel loading, highlighting the need to reconsider simplistic assumptions in wildfire management and policy [90]. Reducing the frequency of wildfires may be accomplished by a more comprehensive management strategy that addresses socioeconomic causes.
A holistic management approach focusing on social causes for reducing wildfires in protected areas goes beyond firefighting and prevention techniques, considering broader social factors, such as land use practices, cultural attitudes towards fire, and community engagement [61,91]. By understanding these drivers, managers and authorities can develop targeted education campaigns and community programs to change behaviors that lead to wildfires [92]. Nature-based solutions involve restoring and maintaining natural landscapes to create barriers against wildfire spread, such as fire-resistant vegetation, restoring wetlands, or managing forests to reduce fuel buildup [93]. Investing in local education, promoting responsible land use, and restoring natural landscapes creates a multi-layered defense against wildfires, reducing the likelihood of uncontrolled wildfires [94].

4.6. Policy Implications

Causes of arson have been attributed to financial and educational status as well as a lack of patrolling prevention [89]. Stakeholder engagement and incorporating a bottom-up policy can prevent wildfires [21]. Clear policies are key deterrents of arson, and policies that encourage collaborative forest management and restrict urban growth in wildlands lower the risk of arson [95]. In Greece, a burned forest, protected or not, is officially a ‘forest area’, and land use status does not change after fire. In practice, the reforestation process needs to be declared and initiated by the local forestry department unless the burned location is included in an ‘Executive Order’ where the reforestation process is by default indefinitely active. Forestry departments are lacking staff and resources. Only about 1% of Natura protected areas in Greece are part of an Executive Order [96]. The time lag between a fire, changing forest land over, and official reforestation creates a window of opportunity for land use change. Thus, there is insufficient legislative clarity, potentially facilitating arson for land use change. In addition to Natura, transitional vegetation percentage per burn is also increasing in recent years in Greece. Transitional vegetation areas are less likely to be in Natura sites. However, they have an ambiguous land use and ownership status in Greece. In principle land use characterization does not exclusively depend on the current land cover but incorporates historical records from remote sensing providing past land cover, and ownership records providing land ownership. The absence of a clear legislative framework (each case is examined separately by a local committee of a lawyer, engineer, and forester) also leaves a policy gap for potential arson [86]. Transitional land cover turning into forest is undesirable for some landowners as restrictions about land use and development apply once land is characterized as forest. Reciprocally, agricultural land cover burn, i.e., land with clear land use, is decreasing over time. Efforts to combat arson include remote sensing and satellite monitoring, drones and surveillance in vulnerable areas, reforestation and ecological restoration, NGOs’ involvement, and public campaigns to raise awareness. High-power electricity networks and large wind and solar energy facilities should receive low priority for licensing in Natura areas. Stronger enforcement of anti-arson and building laws, better fire prevention infrastructure, community engagement in fire protection, transparent land use planning, and anti-corruption measures are needed. Results from Turkey indicate that regardless of how robust the legislation might be, inadequate administrative measures and a lack of public awareness hinder the successful suppression of forest fires [97].

4.7. Synthesis

Wildfires in protected areas can cause ecological damage, biodiversity loss, economic disruption, and human health concerns [98]. They can alter ecosystems, threaten endangered species, and impact local communities [62,99]. Greece exhibits a higher percentage of Natura burn per wildfire than other Mediterranean countries, and this trend is further increasing over time. Wildfires in Natura sites often burn almost exclusively protected surface area. Wildfires burning Natura sites are commonly smaller sized fires in terms of total area burnt, and these small and high percentage Natura burning wildfires need to be specifically targeted. Management measures need to further improve the efficacy and clarity of legislation preventing arson. High-power electricity network and reciprocal wind and solar energy facilities need to be minimized or excluded from Natura areas. A holistic management approach focusing on social causes, land use practices, cultural attitudes, and community engagement to reduce wildfires in protected areas is needed.

Funding

This research received no external funding.

Acknowledgments

I thank Petros Lymberakis and Dimitris Kontakos for comments and suggestions. Comments from three anonymous reviewers considerably improved an earlier manuscript draft.

Conflicts of Interest

The author declares that he has no known competing financial interests or personal relationships that could have appeared to influence the work reported in this paper.

References

  1. Pyne, S.J. Fire: A Brief History; University of Washington Press: Seattle, WA, USA, 2019. [Google Scholar]
  2. Berčák, R.; Holuša, J.; Trombik, J.; Resnerová, K.; Hlásny, T. A Combination of Human Activity and Climate Drives Forest Fire Occurrence in Central Europe: The Case of the Czech Republic. Fire 2024, 7, 109. [Google Scholar] [CrossRef]
  3. Knutzen, F.; Averbeck, P.; Barrasso, C.; Bouwer, L.M.; Gardiner, B.; Grünzweig, J.M.; Hänel, S.; Haustein, K.; Johannessen, M.R.; Kollet, S.; et al. Impacts on and damage to European forests from the 2018–2022 heat and drought events. Nat. Hazards Earth Syst. Sci. 2025, 25, 77–117. [Google Scholar] [CrossRef]
  4. Doherty, T.S.; Macdonald, K.J.; Nimmo, D.G.; Santos, J.L.; Geary, W.L. Shifting fire regimes cause continent-wide transformation of threatened species habitat. Proc. Natl. Acad. Sci. USA 2024, 121, e2316417121. [Google Scholar] [CrossRef]
  5. Hetzer, J.; Forrest, M.; Ribalaygua, J.; Prado-López, C.; Hickler, T. The fire weather in Europe: Large-scale trends towards higher danger. Environ. Res. Lett. 2024, 19, 084017. [Google Scholar] [CrossRef]
  6. Colantoni, A.; Egidi, G.; Quaranta, G.; D’Alessandro, R.; Vinci, S.; Turco, R.; Salvati, L. Sustainable Land Management, Wildfire Risk and the Role of Grazing in Mediterranean Urban-Rural Interfaces: A Regional Approach from Greece. Land 2020, 9, 21. [Google Scholar] [CrossRef]
  7. Babrauskas, V. Electricity-Caused Wildland Fires: Costs, Social Fairness, and Proposed Solution. Fire 2024, 7, 442. [Google Scholar] [CrossRef]
  8. San Miguel Ayanz, J.; Moreno, J.M.; Camia, A. Analysis of large fires in European Mediterranean landscapes: Lessons learned and perspectives. For. Ecol. Manag. 2013, 294, 11–22. [Google Scholar] [CrossRef]
  9. Castellet-Viciano, L.; Hernández-Chover, V.; Hernández-Sancho, F. The economic and environmental impact of fire preventive strategies in the Mediterranean region. J. Environ. Manag. 2024, 371, 123095. [Google Scholar] [CrossRef]
  10. Kala, C.P. Environmental and socioeconomic impacts of forest fires: A call for multilateral cooperation and management interventions. Nat. Hazards Res. 2023, 3, 286–294. [Google Scholar] [CrossRef]
  11. Santín, C.; Moustakas, A.; Doerr, S.H. Searching the flames: Trends in global and regional public interest in wildfires. Environ. Sci. Policy 2023, 146, 151–161. [Google Scholar] [CrossRef]
  12. Kelly, L.T.; Giljohann, K.M.; Duane, A.; Aquilué, N.; Archibald, S.; Batllori, E.; Bennett, A.F.; Buckland, S.T.; Canelles, Q.; Clarke, M.F. Fire and biodiversity in the Anthropocene. Science 2020, 370, eabb0355. [Google Scholar] [CrossRef] [PubMed]
  13. Moustakas, A. Fire acting as an increasing spatial autocorrelation force: Implications for pattern formation and ecological facilitation. Ecol. Complex. 2015, 21, 142–149. [Google Scholar] [CrossRef]
  14. Matossian, A.; Matsinos, Y.; Konstantinidis, P.; Moustakas, A. Post-fire succession indices performance in a Mediterranean ecosystem. Stoch. Environ. Res. Risk Assess. 2013, 27, 323–335. [Google Scholar] [CrossRef]
  15. Panagiotaras, D.; Kokkoris, I.P.; Avramidis, P.; Papoulis, D.; Koulougliotis, D.; Gianni, E.; Lekka, D.; Christodoulopoulos, D.C.; Nifora, D.; Druvari, D.; et al. A Local-Scale, Post-Fire Assessment in a Double-Burned Area: A Case Study from Peloponnisos, Greece. Land 2024, 13, 982. [Google Scholar] [CrossRef]
  16. Sommers, W.T.; Loehman, R.A.; Hardy, C.C. Wildland fire emissions, carbon, and climate: Science overview and knowledge needs. For. Ecol. Manag. 2014, 317, 1–8. [Google Scholar] [CrossRef]
  17. González-Pérez, J.A.; González-Vila, F.J.; Almendros, G.; Knicker, H. The effect of fire on soil organic matter—A review. Environ. Int. 2004, 30, 855–870. [Google Scholar] [CrossRef]
  18. Shakesby, R.A.; Doerr, S.H. Wildfire as a hydrological and geomorphological agent. Earth Sci. Rev. 2006, 74, 269–307. [Google Scholar] [CrossRef]
  19. Hemes, K.S.; Norlen, C.A.; Wang, J.A.; Goulden, M.L.; Field, C.B. The magnitude and pace of photosynthetic recovery after wildfire in California ecosystems. Proc. Natl. Acad. Sci. USA 2023, 120, e2201954120. [Google Scholar] [CrossRef]
  20. Kalapodis, N.; Sakkas, G. Integrated Fire Management and Closer to Nature Forest Management at the Landscape Scale as a Holistic Approach to Foster Forest Resilience to Wildfires [version 4; peer review: 4 approved with reservations, 2 not approved]. Open Res. Eur. 2025, 4, 131. [Google Scholar] [CrossRef]
  21. Ferreira, C.; Pinto, L.C.; Valente, M. Forest fire causes and prevention strategies in Portugal: Insights from stakeholder focus groups. For. Policy Econ. 2024, 169, 103330. [Google Scholar] [CrossRef]
  22. Lopes, M.; Monteiro, A.; Mouzourides, P.; Κouis, P. The health burden of wildfire smoke in a changing climate: Exposure, risks, and strategies for mitigation. Curr. Opin. Environ. Sci. Health 2025, 46, 100631. [Google Scholar] [CrossRef]
  23. Tsiafouli, M.A.; Apostolopoulou, E.; Mazaris, A.D.; Kallimanis, A.S.; Drakou, E.G.; Pantis, J.D. Human Activities in Natura 2000 Sites: A Highly Diversified Conservation Network. Environ. Manag. 2013, 51, 1025–1033. [Google Scholar] [CrossRef] [PubMed]
  24. San Miguel Ayanz, J.; Durrant, T.; Boca, R.; Maianti, P.; Liberta, G.; Oom, D.; Branco, A.; De, R.; Suarez, M.M.; Ferrari, D. Advance Report on Forest Fires in Europe, Middle East and North Africa 2023; JRC Techical Report 137375; Publications Office of the European Union: Luxembourg, 2023. [Google Scholar] [CrossRef]
  25. Myers, N.; Mittermeier, R.A.; Mittermeier, C.G.; Da Fonseca, G.A.; Kent, J. Biodiversity hotspots for conservation priorities. Nature 2000, 403, 853–858. [Google Scholar] [CrossRef] [PubMed]
  26. OECD. Environmental Performance Reviews: Greece 2020; OECD: Paris, France, 2020. [Google Scholar]
  27. Hoffmann, S. Challenges and opportunities of area-based conservation in reaching biodiversity and sustainability goals. Biodivers. Conserv. 2022, 31, 325–352. [Google Scholar] [CrossRef]
  28. Carvalho, F.; Pradhan, A.; Abrantes, N.; Campos, I.; Keizer, J.J.; Cássio, F.; Pascoal, C. Wildfire impacts on freshwater detrital food webs depend on runoff load, exposure time and burnt forest type. Sci. Total Environ. 2019, 692, 691–700. [Google Scholar] [CrossRef]
  29. Nemens, D.G.; Kidd, K.R.; Varner, J.M.; Wing, B. Recurring wildfires provoke type conversion in dry western forests. Ecosphere 2022, 13, e4184. [Google Scholar] [CrossRef]
  30. Tsiftsis, S.; Thomasoulis, K.; Chrysostomidis, C.; Merou, T. The effect of fire on the female pollination success of two non-rewarding orchid species. J. Nat. Conserv. 2025, 84, 126848. [Google Scholar] [CrossRef]
  31. Arrogante-Funes, F.; Aguado, I.; Chuvieco, E. Global impacts of fire regimes on wildland bird diversity. Fire Ecol. 2024, 20, 25. [Google Scholar] [CrossRef]
  32. Singh, S. Forest fire emissions: A contribution to global climate change. Front. For. Glob. Chang. 2022, 5, 925480. [Google Scholar] [CrossRef]
  33. Hertelendy, A.J.; Howard, C.; Sorensen, C.; Ranse, J.; Eboreime, E.; Henderson, S.; Tochkin, J.; Ciottone, G. Seasons of smoke and fire: Preparing health systems for improved performance before, during, and after wildfires. Lancet Planet. Health 2024, 8, e588–e602. [Google Scholar] [CrossRef]
  34. Arellano del Verbo, G.; Urbieta, I.R.; Moreno, J.M. Large-Fire Ignitions Are Higher in Protected Areas than Outside Them in West-Central Spain. Fire 2023, 6, 28. [Google Scholar] [CrossRef]
  35. EEA. Terrestrial Protected Area Coverage by Country and in the EU-27 by End of 2022. European Environmental Agency (EEA). Modified 29 Nov 2024. Available online: https://www.eea.europa.eu/en/analysis/indicators/terrestrial-protected-areas-in-europe/terrestrial-protected-area-coverage (accessed on 23 July 2025).
  36. Box, G.E.; Jenkins, G.M.; Reinsel, G.C.; Ljung, G.M. Time Series Analysis: Forecasting and Control; John Wiley & Sons: Hoboken, NJ, USA, 2015. [Google Scholar]
  37. Cleveland, W.S. Robust Locally Weighted Regression and Smoothing Scatterplots. J. Am. Stat. Assoc. 1979, 74, 829–836. [Google Scholar] [CrossRef]
  38. You, C.; Lin, D.K.J.; Young, S.S. Time series smoother for effect detection. PLoS ONE 2018, 13, e0195360. [Google Scholar] [CrossRef]
  39. Nelder, J.A.; Baker, R.J. Generalized Linear Models; Wiley Online Library: Hoboken, NJ, USA, 1972. [Google Scholar]
  40. Everitt, B.S. Bubble plot. In Wiley StatsRef: Statistics Reference Online; John Wiley & Sons, Ltd.: Hoboken, NJ, USA, 2014. [Google Scholar]
  41. Papoulis, A.; Pillai, S.U. Probability, Random Variables, and Stochastic Processes; Tata McGraw-Hill Education: Columbus, OH, USA, 2002. [Google Scholar]
  42. Giannaros, T.M.; Papavasileiou, G.; Lagouvardos, K.; Kotroni, V.; Dafis, S.; Karagiannidis, A.; Dragozi, E. Meteorological Analysis of the 2021 Extreme Wildfires in Greece: Lessons Learned and Implications for Early Warning of the Potential for Pyroconvection. Atmosphere 2022, 13, 475. [Google Scholar] [CrossRef]
  43. Misseyanni, A.; Christopoulou, A.; Kougkoulos, I.; Vassilakis, E.; Arianoutsou, M. The Impact of Forest Fires on Ecosystem Services: The Case of Greece. Forests 2025, 16, 533. [Google Scholar] [CrossRef]
  44. Xanthopoulos, G.; Athanasiou, M.; Kaoukis, K. Suppression versus prevention–The disastrous forest fire season of 2021 in Greece. Wildfire Quart. 2022, 2, 18–24. [Google Scholar]
  45. Michailidis, K.; Garane, K.; Karagkiozidis, D.; Peletidou, G.; Voudouri, K.-A.; Balis, D.; Bais, A. Extreme wildfires over northern Greece during summer 2023—Part A: Effects on aerosol optical properties and solar UV radiation. Atmos. Res. 2024, 311, 107700. [Google Scholar] [CrossRef]
  46. Kalogiannidis, S.; Kalfas, D.; Zagkas, T.; Chatzitheodoridis, F. Assessing the Effect of Community Preparedness on Property Damage Costs during Wildfires: A Case Study of Greece. Fire 2024, 7, 279. [Google Scholar] [CrossRef]
  47. Rovithakis, A.; Grillakis, M.G.; Seiradakis, K.D.; Giannakopoulos, C.; Karali, A.; Field, R.; Lazaridis, M.; Voulgarakis, A. Future climate change impact on wildfire danger over the Mediterranean: The case of Greece. Environ. Res. Lett. 2022, 17, 045022. [Google Scholar] [CrossRef]
  48. COPERNICUS. 3.2.4 Transitional Woodland/Shrub. Available online: https://land.copernicus.eu/content/corine-land-cover-nomenclature-guidelines/html/index-clc-324.html (accessed on 13 August 2025).
  49. Zhou, R.; Ci, X.; Hu, J.; Zhang, X.; Cao, G.; Xiao, J.; Liu, Z.; Li, L.; Thornhill, A.H.; Conran, J.G.; et al. Transitional areas of vegetation as biodiversity hotspots evidenced by multifaceted biodiversity analysis of a dominant group in Chinese evergreen broad-leaved forests. Ecol. Indic. 2023, 147, 110001. [Google Scholar] [CrossRef]
  50. Gemitzi, A.; Albarakat, R.; Kratouna, F.; Lakshmi, V. Land cover and vegetation carbon stock changes in Greece: A 29-year assessment based on CORINE and Landsat land cover data. Sci. Total Environ. 2021, 786, 147408. [Google Scholar] [CrossRef] [PubMed]
  51. Chouvardas, D.; Karatassiou, M.; Stergiou, A.; Chrysanthopoulou, G. Identifying the Spatiotemporal Transitions and Future Development of a Grazed Mediterranean Landscape of South Greece. Land 2022, 11, 2141. [Google Scholar] [CrossRef]
  52. Shi, Y.; Wei, W. Terracing drives Chinese Loess Plateau toward carbon neutrality: Spatiotemporal interaction between land use transitions and SOC storage. J. Environ. Manag. 2025, 385, 125760. [Google Scholar] [CrossRef]
  53. Vicente-Serrano, S.M.; Tramblay, Y.; Reig, F.; González-Hidalgo, J.C.; Beguería, S.; Brunetti, M.; Kalin, K.C.; Patalen, L.; Kržič, A.; Lionello, P.; et al. High temporal variability not trend dominates Mediterranean precipitation. Nature 2025, 639, 658–666. [Google Scholar] [CrossRef]
  54. Mahecha, M.D.; Bastos, A.; Bohn, F.; Eisenhauer, N.; Feilhauer, H.; Hickler, T.; Kalesse-Los, H.; Migliavacca, M.; Otto, F.E.L.; Peng, J. Biodiversity and climate extremes: Known interactions and research gaps. Earth’s Future 2024, 12, e2023EF003963. [Google Scholar] [CrossRef]
  55. De Frenne, P.; Zellweger, F.; Rodríguez-Sánchez, F.; Scheffers, B.R.; Hylander, K.; Luoto, M.; Vellend, M.; Verheyen, K.; Lenoir, J. Global buffering of temperatures under forest canopies. Nat. Ecol. Evol. 2019, 3, 744–749. [Google Scholar] [CrossRef] [PubMed]
  56. Vangi, E.; Dalmonech, D.; Cioccolo, E.; Marano, G.; Bianchini, L.; Puchi, P.F.; Grieco, E.; Cescatti, A.; Colantoni, A.; Chirici, G.; et al. Stand age diversity (and more than climate change) affects forests’ resilience and stability, although unevenly. J. Environ. Manag. 2024, 366, 121822. [Google Scholar] [CrossRef]
  57. Oikonomou, P.; Karathanassi, V.; Andronis, V.; Papoutsis, I. Assessing and Forecasting Natural Regeneration in Mediterranean Landscapes After Wildfires. Remote Sens. 2025, 17, 897. [Google Scholar] [CrossRef]
  58. Arianoutsou, M.; Athanasakis, G.; Kazanis, D.; Christopoulou, A. Attica: A Hot Spot for Forest Fires in Greece. Fire 2024, 7, 467. [Google Scholar] [CrossRef]
  59. Xu, W.; He, H.S.; Huang, C.; Duan, S.; Hawbaker, T.J.; Henne, P.D.; Liang, Y.; Zhu, Z. Large fires or small fires, will they differ in affecting shifts in species composition and distributions under climate change? For. Ecol. Manag. 2022, 510, 120131. [Google Scholar] [CrossRef]
  60. Kirkland, M.; Atkinson, P.W.; Pearce-Higgins, J.W.; de Jong, M.C.; Dowling, T.P.; Grummo, D.; Critchley, M.; Ashton-Butt, A. Landscape fires disproportionally affect high conservation value temperate peatlands, meadows, and deciduous forests, but only under low moisture conditions. Sci. Total Environ. 2023, 884, 163849. [Google Scholar] [CrossRef] [PubMed]
  61. Spadoni, G.L.; Moris, J.V.; Vacchiano, G.; Elia, M.; Garbarino, M.; Sibona, E.; Tomao, A.; Barbati, A.; Sallustio, L.; Salvati, L.; et al. Active governance of agro-pastoral, forest and protected areas mitigates wildfire impacts in Italy. Sci. Total Environ. 2023, 890, 164281. [Google Scholar] [CrossRef]
  62. Resco de Dios, V.; Schütze, S.J.; Cunill Camprubí, À.; Balaguer-Romano, R.; Boer, M.M.; Fernandes, P.M. Protected areas as hotspots of wildfire activity in fire-prone Temperate and Mediterranean biomes. J. Environ. Manag. 2025, 385, 125669. [Google Scholar] [CrossRef] [PubMed]
  63. Mohapatra, A.; Trinh, T. Early Wildfire Detection Technologies in Practice—A Review. Sustainability 2022, 14, 12270. [Google Scholar] [CrossRef]
  64. Medewar, A.G.; Sawarkar, A.D.; Kshirsagar, U.v. A Review on Fire and Smoke Detection With Intelligent Control for Enhanced Safety Using Machine Learning (ML) and Internet of Things (IoT). Cureus 2024, 1, e10. [Google Scholar] [CrossRef]
  65. Yebra, M.; Mahony, R.; Debus, R. Technological solutions for living with fire in the age of megafires. One Earth 2024, 7, 932–935. [Google Scholar] [CrossRef]
  66. McArthur, A.G.; Cheney, N.P. The Characterization of Fires in Relation to Ecological Studies. Fire Ecol. 2015, 11, 3–9. [Google Scholar] [CrossRef]
  67. Foster, C.N.; Banks, S.C.; Cary, G.J.; Johnson, C.N.; Lindenmayer, D.B.; Valentine, L.E. Animals as Agents in Fire Regimes. Trends Ecol. Evol. 2020, 35, 346–356. [Google Scholar] [CrossRef]
  68. Moustakas, A.; Voutsela, A.; Katsanevakis, S. Sampling alien species inside and outside protected areas: Does it matter? Sci. Total Environ. 2018, 625, 194–198. [Google Scholar] [CrossRef]
  69. Kati, V.; Kassara, C.; Vrontisi, Z.; Moustakas, A. The biodiversity-wind energy-land use nexus in a global biodiversity hotspot. Sci. Total Environ. 2021, 768, 144471. [Google Scholar] [CrossRef]
  70. Moustakas, A.; Georgiakakis, P.; Kret, E.; Kapsalis, E. Wind turbine power and land cover effects on cumulative bat deaths. Sci. Total Environ. 2023, 892, 164536. [Google Scholar] [CrossRef] [PubMed]
  71. Mammides, C.; Zotos, S.; Martini, F. Quantifying the amount of land lost to artificial surfaces in European habitats: A comparison inside and outside Natura 2000 sites using a quasi-experimental design. Biol. Conserv. 2024, 293, 110556. [Google Scholar] [CrossRef]
  72. Kati, V.; Kassara, C.; Panagos, P.; Tampouratzi, L.; Gotsis, D.; Tzortzakaki, O.; Petridou, M.; Psaralexi, M.; Sidiropoulos, L.; Vasilakis, D.; et al. The overlooked threat of land take from wind energy infrastructures: Quantification, drivers and policy gaps. J. Environ. Manag. 2023, 348, 119340. [Google Scholar] [CrossRef] [PubMed]
  73. Souliotis, Y. Attica Wildfire in August Caused by Falling Power Cable, Report Finds; Kathimerini: Athens, Greece, 7 December.
  74. Kathimerini. Power Lines Are Greece’s Top Wildfire Threat; Kathimerini: Athens, Greece, 11 June.
  75. Papadopoulos, Y. When Wildfires Are Started by Faulty Pylons; Kathimerini: Athens, Greece.
  76. BBC. Greek Forest Fire Close to Athens; BBC: London, UK, 29 June.
  77. Eagleston, H.; Bester, M.; Yusuf, J.; Damodaran, A.; Reno, M.J. Systemic Drivers of Electric-Grid-Caused Catastrophic Wildfires: Implications for Resilience in the United States. Challenges 2025, 16, 13. [Google Scholar] [CrossRef]
  78. Bandara, S.; Rajeev, P.; Gad, E. Power Distribution System Faults and Wildfires: Mechanisms and Prevention. Forests 2023, 14, 1146. [Google Scholar] [CrossRef]
  79. Troumbis, A.Y.; Gaganis, C.M.; Sideropoulos, H. Probabilistic Wildfire Risk Assessment and Modernization Transitions: The Case of Greece. Fire 2023, 6, 158. [Google Scholar] [CrossRef]
  80. Athanasiou, M.; Bouchounas, T.; Korakaki, E.; Tziritis, I.; Xanthopoulos, G.; Sitara, S. Introducing the use of fire for wildfire prevention in Greece: Pilot application of prescribed burning in Chios island. In Advances in Forest Fire Research 2022; Coimbra University Press: Coimbra, Portugal, 2022; pp. 1487–1494. [Google Scholar] [CrossRef]
  81. Arbinolo, M.; Patimo, G.; Rey, E.; Stokkeland, O.; Verde, J.C.; Casartelli, V.; Marengo, A.; Melinato, S.; Mysiak, J.; Salpina, D.; et al. UCPM Wildfire Peer Review Report: Greece 2024; European Commission: Brussels, Belgium, 2024. [Google Scholar] [CrossRef]
  82. Morfonios, N. Greece Falls Behind Its Targets for Post-COVID EU Recovery Money. In European Data Journalism Network. 2025. Available online: https://www.europeandatajournalism.eu/cp_data_news/greece-falls-behind-its-targets-for-post-covid-eu-recovery-money/ (accessed on 27 March 2025).
  83. GOV.GR. NextGenerationEU. Available online: https://greece20.gov.gr/en/at-a-glance/#:~:text=The%20National%20Recovery%20and%20Resilience,REPowerEU (accessed on 25 July 2025).
  84. Oliveres, J.; Castellnou, M.; Castellarnau, X.; Rosas-Casals, M.; Brotons, L.; Duane, A. The path to strategic fire management planning in the Aran, Pyrenees. Fire Ecol. 2025, 21, 9. [Google Scholar] [CrossRef]
  85. Palaiologou, P.; Kalabokidis, K.; Troumbis, A.; Day, M.A.; Nielsen-Pincus, M.; Ager, A.A. Socio-ecological perceptions of wildfire management and effects in Greece. Fire 2021, 4, 18. [Google Scholar] [CrossRef]
  86. Parente, J.; Tonini, M.; Stamou, Z.; Koutsias, N.; Pereira, M. Quantitative Assessment of the Relationship between Land Use/Land Cover Changes and Wildfires in Southern Europe. Fire 2023, 6, 198. [Google Scholar] [CrossRef]
  87. Dimitrakopoulos, P.G.; Jones, N.; Iosifides, T.; Florokapi, I.; Lasda, O.; Paliouras, F.; Evangelinos, K.I. Local attitudes on protected areas: Evidence from three Natura 2000 wetland sites in Greece. J. Environ. Manag. 2010, 91, 1847–1854. [Google Scholar] [CrossRef]
  88. Gharesifard, M.; Ceccaroni, L.; Gold, M.; Berti Suman, A.; Das, K. Citizen science and the nexus approach: Unlocking synergies for sustainable development. Sustain. Nexus Forum 2025, 33, 4. [Google Scholar] [CrossRef]
  89. Katuwal, H.; Kafley, H. Playing with fire: Socioeconomic factors and deliberate wildfires in Texas. J. Environ. Manag. 2024, 370, 122980. [Google Scholar] [CrossRef]
  90. Bradley, C.; Hanson, C.; DellaSala, D. Does increased forest protection correspond to higher fire severity in frequent-fire forests of the western United States? Ecosphere 2016, 7, e01492. [Google Scholar] [CrossRef]
  91. Kirkland, M.; Atkinson, P.W.; Aliácar, S.; Saavedra, D.; De Jong, M.C.; Dowling, T.P.F.; Ashton-Butt, A. Protected areas, drought, and grazing regimes influence fire occurrence in a fire-prone Mediterranean region. Fire Ecol. 2024, 20, 88. [Google Scholar] [CrossRef]
  92. Lambrou, N.; Kolden, C.; Loukaitou-Sideris, A.; Anjum, E.; Acey, C. Social drivers of vulnerability to wildfire disasters: A review of the literature. Landsc. Urban Plan. 2023, 237, 104797. [Google Scholar] [CrossRef]
  93. Regos, A.; Pais, S.; Campos, J.C.; Lecina-Diaz, J. Nature-based solutions to wildfires in rural landscapes of Southern Europe: Let’s be fire-smart! Int. J. Wildland Fire 2023, 32, 942–950. [Google Scholar] [CrossRef]
  94. Oliveras Menor, I.; Prat-Guitart, N.; Spadoni, G.L.; Hsu, A.; Fernandes, P.M.; Puig-Gironès, R.; Ascoli, D.; Bilbao, B.A.; Bacciu, V.; Brotons, L.; et al. Integrated fire management as an adaptation and mitigation strategy to altered fire regimes. Commun. Earth Environ. 2025, 6, 202. [Google Scholar] [CrossRef]
  95. Chas-Amil, M.L.; Prestemon, J.P.; McClean, C.J.; Touza, J. Human-ignited wildfire patterns and responses to policy shifts. Appl. Geogr. 2015, 56, 164–176. [Google Scholar] [CrossRef]
  96. YPEN. Reports—Studies. Available online: https://ypen.gov.gr/perivallon/viopoikilotita/ektheseis-meletes/ (accessed on 10 February 2025).
  97. Elvan, O.D.; Birben, Ü.; Özkan, U.Y.; Yıldırım, H.T.; Türker, Y.Ö. Forest fire and law: An analysis of Turkish forest fire legislation based on Food and Agriculture Organization criteria. Fire Ecol. 2021, 17, 12. [Google Scholar] [CrossRef]
  98. Folharini, S.; Vieira, A.; Bento-Gonçalves, A.; Silva, S.; Marques, T.; Novais, J. Bibliometric Analysis on Wildfires and Protected Areas. Sustainability 2023, 15, 8536. [Google Scholar] [CrossRef]
  99. Molina, J.R.; González-Cabán, A.; Rodríguez y Silva, F. Wildfires impact on the economic susceptibility of recreation activities: Application in a Mediterranean protected area. J. Environ. Manag. 2019, 245, 454–463. [Google Scholar] [CrossRef] [PubMed]
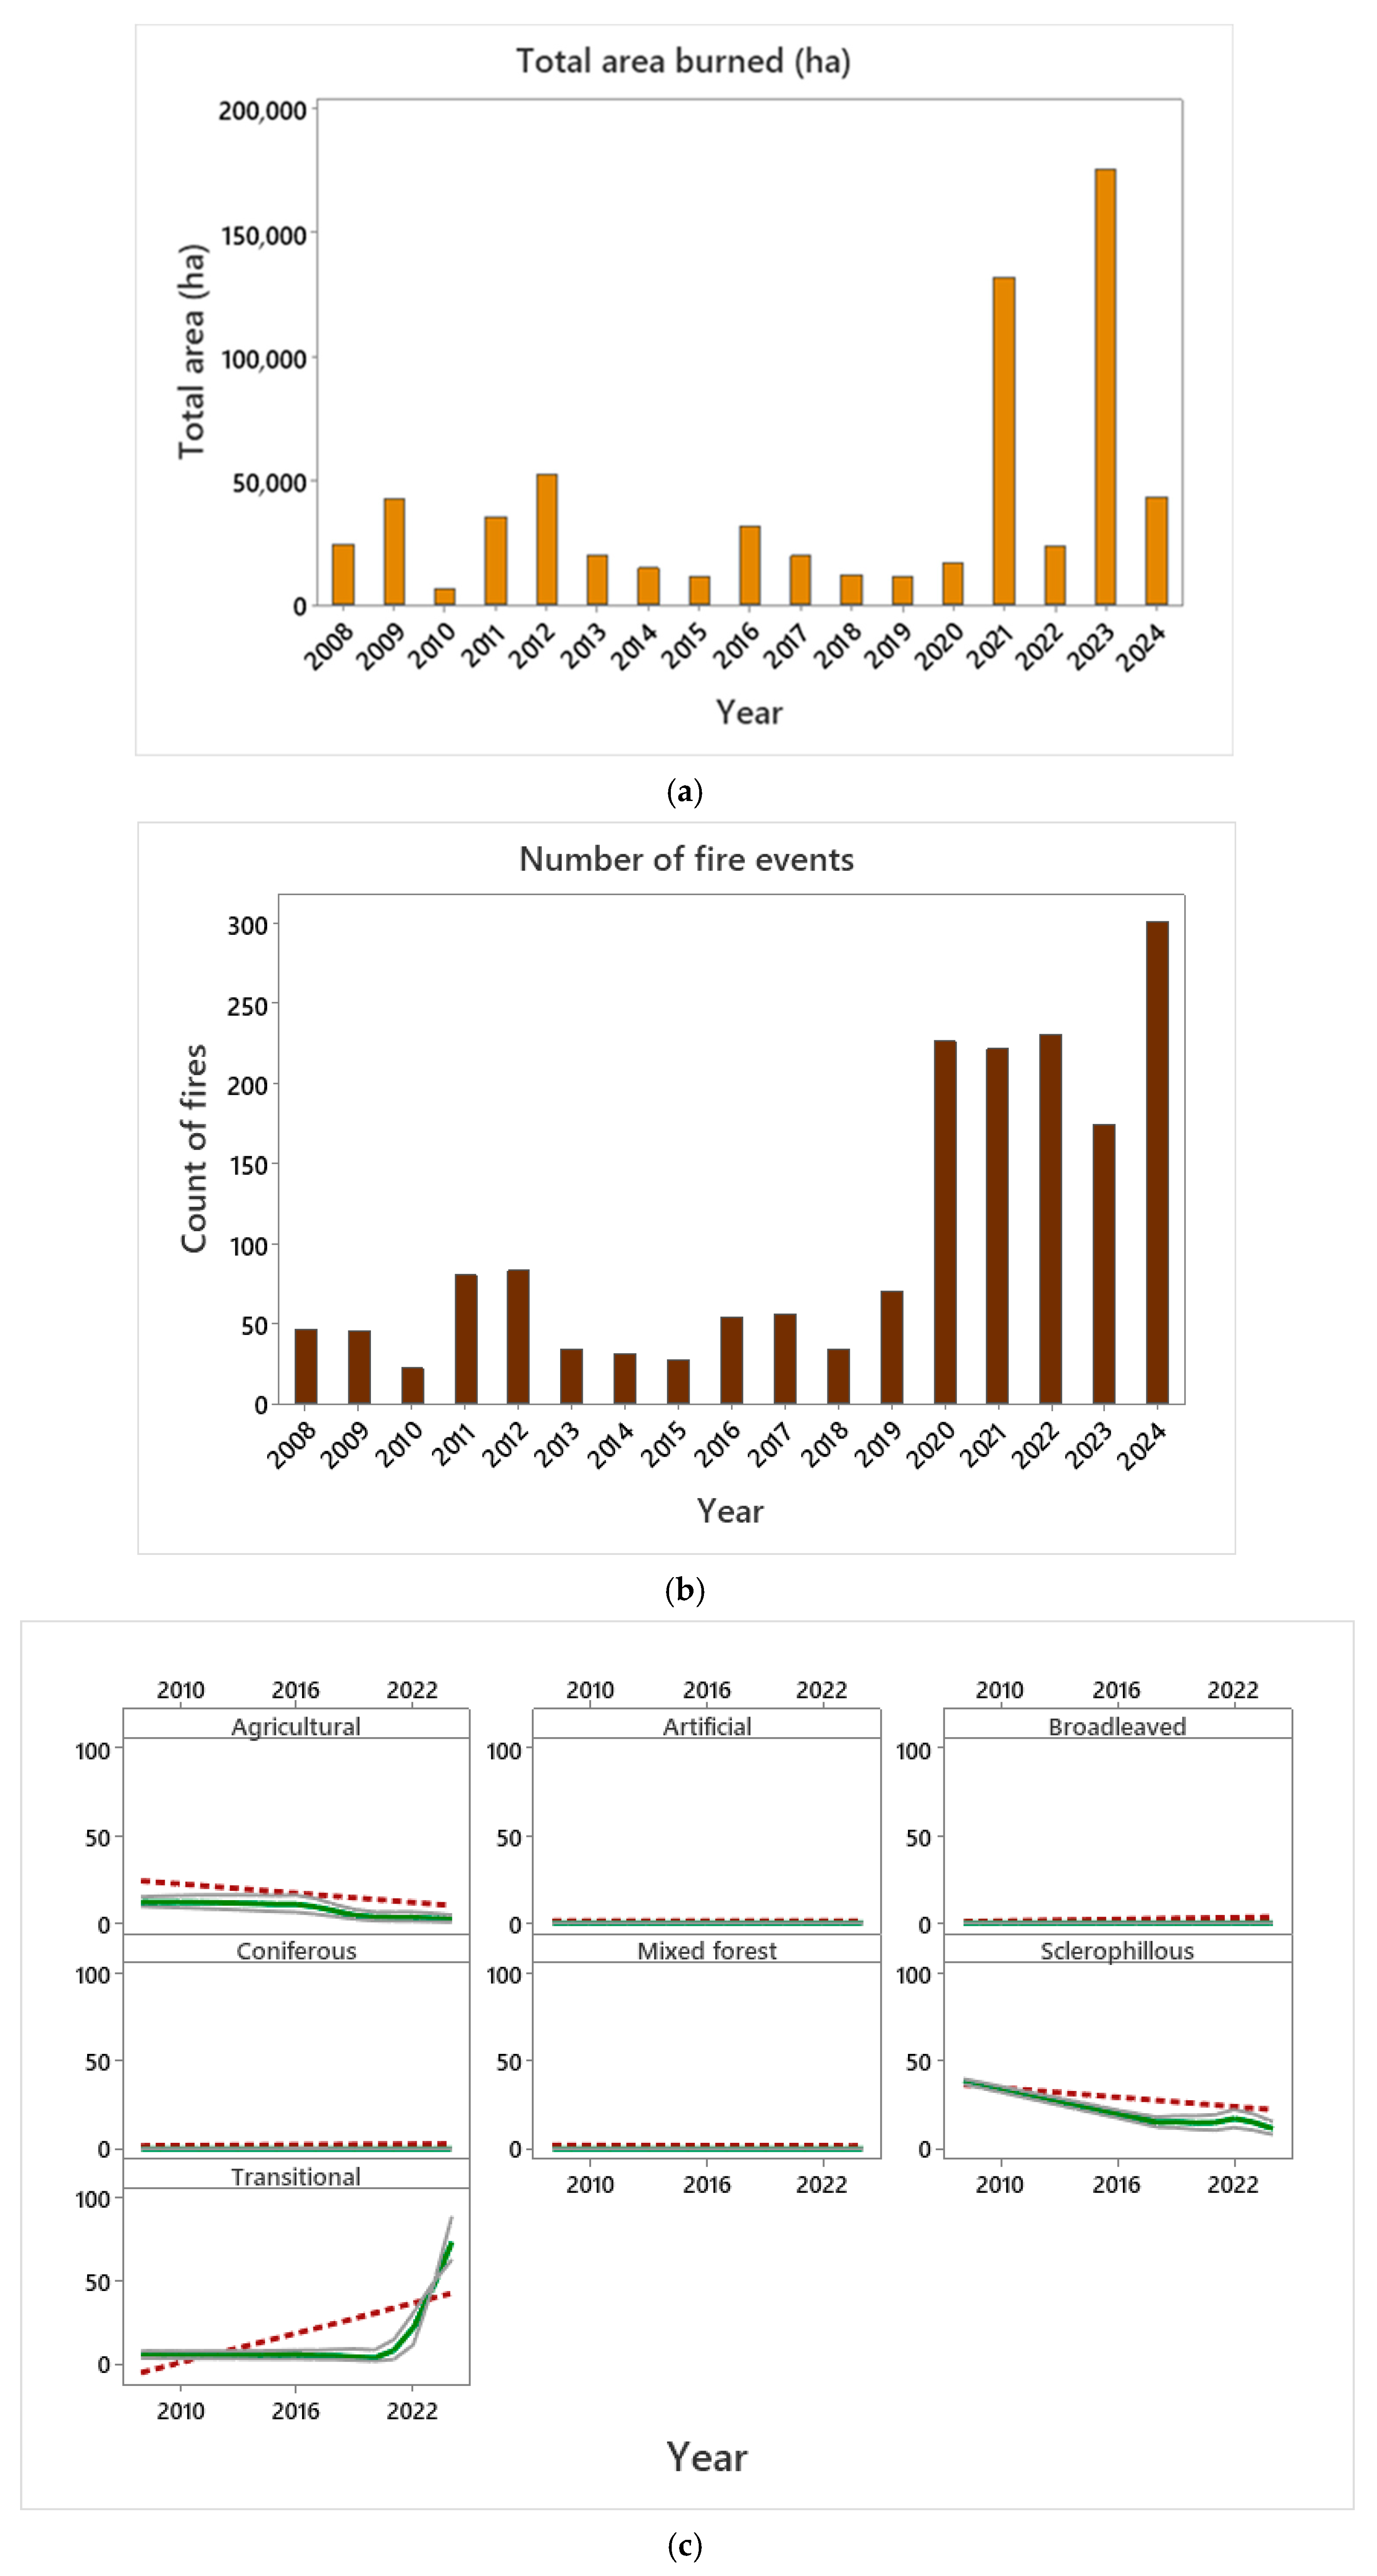
Figure 1. Characteristics of wildfires in Greece. (a) Total surface area burnt in Greece per year in ha. (b) Number of wildfire events per year. (c) Percentage of agricultural, artificial, and forest vegetation land cover types burnt per wildfire event over time. X-axis indicates time in years and Y-axis indicates the percentage of burn per wildfire event. All panels have the same scale. The green solid line indicates a smoothed time trend, and solid grey lines indicate a 95% confidence interval of the trend. Dotted red line indicates a linear regression.
Fire 08 00324 g001
Figure 2. Characteristics of wildfires in protected areas (Natura) in Greece. (a) Statistical binned distribution of percentage of Natura 2000 burn per wildfire event. (b) Statistical binned distribution of Natura percentage of burn per wildfire event (vertical axis) versus total burnt area (ha) per wildfire event (horizontal axis). Histograms in each axis indicate data frequencies. (c) Mean of percentage of Natura area burnt per wildfire event per year. (d) Bubble plots of Natura percentage burnt per wildfire event (vertical axis) versus time (years, horizontal axis). Bubble size indicates total area burnt per wildfire, with a larger bubble size indicating larger total area burnt. (e) Logistic regression quantifying the probability of a wildfire including Natura burn over time. The logistic regression includes a binary response on the Y-axis (Natura burn or not, dependent variable) at different values of the predictor variable on the X-axis (time in years, independent variable). Solid red line indicates the probability of Natura burn, while dotted green lines indicate a 95% confidence interval.
Fire 08 00324 g002aFire 08 00324 g002b
Figure 3. Protected area burns in Greece, Italy, Spain, and Portugal across the study time span. (a) Left panel: percentage of the surface area of the country in the Natura 2000 protected area network. Middle panel: mean value of the Natura percentage burnt per wildfire across each country throughout the time span. Right panel: percentage of Natura surface of the country divided by Natura percentage burnt per wildfire. (b) Percentage of Natura burnt per wildfire event over time. X-axis indicates time in years and Y-axis percentage of burn per wildfire event. All panels have the same scale. Green solid line indicates a smoothed time trend, and solid grey lines indicate a 95% confidence interval of the trend. Dotted red line indicates a linear regression.
Fire 08 00324 g003aFire 08 00324 g003b
Table 1. Kruskal–Wallis non-parametric tests for quantifying statistical differences between Natura percentage of burn per wildfire across countries. Results indicate significance differences.
Descriptive Statistics
iso 3NMedianMean RankZ-Value
ESP7153013,188.06.18
GRC1734014,626.011.1
ITA9602012,054.4−11.45
PRT6975012,728.1−0.06
Overall25,464 12,732.5
TEST
Null hypothesisH0: All medians are equal
Alternative hypothesisH1: At least one median is different
MethodDFH-Valuep-value
Not adjusted for ties3224.230.000
Adjusted for ties3307.060.000
Disclaimer/Publisher’s Note: The statements, opinions and data contained in all publications are solely those of the individual author(s) and contributor(s) and not of MDPI and/or the editor(s). MDPI and/or the editor(s) disclaim responsibility for any injury to people or property resulting from any ideas, methods, instructions or products referred to in the content.