Article

Climate Extremes, Vegetation, and Lightning: Regional Fire Drivers Across Eurasia and North America

1
Department of Agricultural Engineering, Universidade Federal de Viçosa, PH Rolfs, Vicosa 36570-430, Brazil
2
Polar Meteorology Group, Byrd Polar and Climate Research Center, The Ohio State University, 108 Scott Hall, 1090 Carmack Rd, Columbus, OH 43210, USA
*
Author to whom correspondence should be addressed.
Fire 2025, 8(7), 282; https://doi.org/10.3390/fire8070282
Submission received: 23 April 2025 / Revised: 5 July 2025 / Accepted: 10 July 2025 / Published: 16 July 2025
(This article belongs to the Section Fire Science Models, Remote Sensing, and Data)

Abstract

This study examines the complex interactions among soil moisture, evaporation, extreme weather events, and lightning, and their influence on fire activity across the extratropical and Pan-Arctic regions. Leveraging reanalysis and remote-sensing datasets from 2000 to 2020, we applied cross-correlation analysis, a modified Mann–Kendall trend test, and assessments of interannual variability to key variables including soil moisture, fire frequency and risk, evaporation, and lightning. Results indicate a significant increase in dry days (up to 40%) and heatwave events across Central Eurasia and Siberia (up to 50%) and Alaska (25%), when compared to the 1980–2000 baseline. Upward trends have been detected in evaporation across most of North America, consistent with soil moisture trends, while much of Eurasia exhibits declining soil moisture. Fire danger shows a strong positive correlation with evaporation north of 60° N (r ≈ 0.7, p ≤ 0.005), but a negative correlation in regions south of this latitude. These findings suggest that in mid-latitude ecosystems, fire activity is not solely driven by water stress or atmospheric dryness, highlighting the importance of region-specific surface–atmosphere interactions in shaping fire regimes. In North America, most fires occur in temperate grasslands, savannas, and shrublands (47%), whereas in Eurasia, approximately 55% of fires are concentrated in forests/taiga and temperate open biomes. The analysis also highlights that lightning-related fires are more prevalent in Eastern Europe and Southeastern Asia. In contrast, Western North America exhibits high fire incidence in temperate conifer forests despite relatively low lightning activity, indicating a dominant role of anthropogenic ignition. These findings underscore the importance of understanding land–atmosphere interactions in assessing fire risk. Integrating surface conditions, climate extremes, and ignition sources into fire prediction models is crucial for developing more effective wildfire prevention and management strategies.

Graphical Abstract

1. Introduction

Accurately forecasting wildfires remains a major scientific challenge due to the complex interactions across spatial and temporal scales that govern fire ignition, spread, and severity. A key limitation in current fire prediction models is their incomplete representation of surface conditions, particularly variables such as mid-term droughts, soil moisture, and evaporation, which play a critical role in shaping fire regimes [1].
These surface variables interact with extreme weather events, including heatwaves and dry spells, which are unevenly distributed in space and time, contributing to the observed increase in wildfire frequency and intensity [2,3,4].
In mid-latitude and extratropical regions, summer climatic conditions often resemble those in tropical environments, creating persistent fire-prone conditions [1,5]. These conditions are further exacerbated by irregular precipitation patterns during spring and summer, where prolonged droughts combined with elevated temperatures can drastically reduce soil moisture, thereby increasing fire risk [6,7]. Importantly, soil moisture influences fire dynamics differently across climates: in arid regions, wetter-than-average soils can promote biomass accumulation that later fuels large fires, while in humid regions, fires are often preceded by anomalously dry soils [8,9]. These soil moisture dynamics affect canopy dryness and vegetation health by modulating evaporation rates, which in turn increase litter accumulation and flammability [10].
Soil moisture (SM) and evaporation (Ea) are thus central to understanding fire susceptibility, as they govern vegetation dynamics, biomass availability, and surface–atmosphere interactions [8]. Evaporation also influences key atmospheric variables such as vapor pressure deficit (VPD), air humidity, and regional water balance, which are directly linked to plant water stress and fuel flammability [11]. Therefore, integrating soil moisture and evaporation metrics offers valuable insights into the conditions that precede fire outbreaks.
Despite recent advancements, identifying the dominant drivers of wildfire occurrence and severity remains challenging due to the spatial heterogeneity and temporal variability of contributing factors. While many studies have explored weather-related influences on fire behavior, fewer have examined how these interact with remote climate modes or vegetation dynamics [6,12]. Fire weather indices (FWIs) and environmental models offer predictive tools for assessing fire potential [13], yet their performance is often limited by a lack of high-resolution, multivariate environmental data. Moreover, while seasonal climate conditions shape fire regimes, sub-seasonal processes, including soil moisture anomalies, flash droughts, and thermal stress, can have an outsized impact on vegetation health and ignition potential [14,15].
Understanding these fire–environment interactions requires a multiscale framework that accounts for feedbacks among surface conditions, vegetation characteristics, and atmospheric variables. This is particularly critical in large continental regions where fire regimes are influenced by diverse climate zones, biomes, and human pressures [16]. However, a comprehensive understanding of how fire danger co-evolves with surface and atmosphere interactions, particularly in high-latitude and extratropical zones, remains limited. Most existing studies have focused on isolated relationships, such as between soil moisture and burned area, or lightning and fire ignition, without jointly analyzing the full suite of interacting variables in a spatially explicit, multivariate framework.
To address this gap, the present study investigates the co-variability and trends of soil moisture, evaporation, lightning activity, and fire weather indices across North America and Eurasia, with an emphasis on the Pan-Arctic and extratropical regions. While earlier regional studies have assessed individual components of this system [6,17], this is, to our knowledge, the first continental-scale analysis that integrates reanalysis products, satellite-based fire detections, and lightning observations to evaluate both surface preconditioning and ignition mechanisms during recent climate extremes (2000–2020).
Using cross-correlation analysis, a modified Mann–Kendall trend test, and evaluations of interannual variability, we identify where and when fire risk is most sensitive to surface dryness, lightning activity, or their interactions. This integrated approach provides new insights into fire regime dynamics in boreal and temperate ecosystems, regions historically underrepresented in global fire assessments, and enhances our ability to characterize vulnerability in the face of accelerating climate change.

2. Data and Methods

Datasets from ERA5 (0.25°), GLEAM (0.5°), MODIS (250 m–1 km), and LD (0.5°) were unified onto a common 0.5° regular latitude–longitude grid. Flux variables were conservatively remapped, while state variables were interpolated using bilinear methods. Upscaling from finer to coarser resolutions was performed by employing area-weighted averaging to preserve the quantitative integrity of each grid cell by reflecting the weighted contribution of high-resolution inputs. Temporally, all datasets were aggregated to a consistent daily resolution.
This approach was deemed appropriate given the continental-scale focus of the study, where sub-grid heterogeneity becomes less critical, and the use of a 0.5° resolution offers a suitable balance between computational efficiency and spatial representativeness. Although the re-gridding process may introduce spatial smoothing, particularly in precipitation extremes and temporal aggregation biases in daily fluxes, these effects are generally acceptable in large-scale climate analyses where broader spatial patterns and trends are prioritized over local-scale variability.

2.1. Climate Data

Weather patterns (surface temperature and relative humidity) are based on ERA5 which is the fifth-generation reanalysis released by ECMWF [18]. ERA5 combines vast amounts of historical observations into global estimates using advanced modeling and data assimilation systems. With respect to ERA-Interim, ERA5 increases the temporal resolution from 3-hourly to hourly. For a better understanding of the main regions affected by lightning, the ERA5 Convective Available Potential Energy (CAPE), is employed to locate instability of the atmosphere. The ERA5 is very appropriate, particularly in remote and data-scarce regions where gauge-based precipitation observations are limited.
ERA5’s high spatial (0.25°) and temporal (hourly) resolution, combined with its physically consistent data assimilation framework, makes it a robust choice for assessing climate–fire relationships in high-latitude and sparsely monitored areas [18]. However, regional and global studies have demonstrated that ERA5 struggles to reproduce precipitation extremes, and the errors are larger in the summer extratropics [19,20]. In addition, the depiction of localized precipitation extremes is challenging, especially in complex terrain or regions with sparse observational data [21].
Initial evaluation discusses regional patterns of climate extreme indices that can be associated with fire activity, namely consecutive dry days (CDD), the period of droughts (DD), and the number of heat waves (HW) during the 1980–2020 interval. The CDD is the largest number of consecutive dry days with daily precipitation amounts below 1 mm. This index has been extensively used to characterize short-term droughts and dry spells to evaluate climatic impact on agricultural activities and water shortage and may be very useful to estimate the environmental susceptibility to fire development [22,23].
The second index is called days of drought (DD). It is based upon the accumulated precipitation in different intervals during 120 consecutive days [24]. It has been shown that the DD parameter is highly correlated with the environmental fire danger which is dependent on vegetation characteristics. Briefly, DD represents accumulated precipitation for the 11 immediately preceding periods of 1, 2, 3, 4, 5, 6–10, 11–15, 16–30, 31–60, 61–90, and 91–120 days, applying an empirical exponential function for each period [14]. These individual periods are named precipitation factors (PF), from which DD is defined by the equation below:
DD = 105 × (PF1 × PF2 … × PF61−90 × PF91−120)
The constant 105 is included in the drought days (DD) equation to ensure that, in the absence of precipitation over a 120-day period, vegetation of any type would be sufficiently dry to support combustion. This threshold was empirically derived based on the estimated number of rainless days required for evergreen broadleaf forests or tropical vegetation to reach flammability conditions [14]. The exponential function is applied uniformly at both regional and global scales. The Potential Fire Index (PFI) methodology was originally developed to assess fire danger in Brazil, grounded in extensive observational data across diverse biomes. The use of precipitation accumulated over various time intervals is coupled with different exponential coefficients to reflect the fact that fire danger is modulated by moisture availability over short-, medium-, and long-term periods. These coefficients allow the PFI to adapt to vegetation-specific fuel drying dynamics and regional climatological variability. The third index is the HW, which characterizes the number of days per time period (a year), in intervals of at least 6 consecutive days, when the daily maximum temperature is higher than a reference value by 5 °C. The reference value is calculated as the mean of maximum temperatures in a five-day window for individual grid boxes centered on each calendar day over the 1980–2020 interval.

2.2. Satellite Based-Fires

The processed Moderate Resolution Imaging Spectroradiometer (MODIS) Collection 6 Near Real-Time (NRT) active fire products (Aqua and Terra), based on the standard MOD14DL/MYD14 fire and thermal anomalies algorithm have been used as fire proxies [25]. The MODIS hotspots (MCD14DL) are downloaded at 1 km resolution from 2001 to 2020.
The MODIS fire products are essential for monitoring global fire activity, particularly in remote regions where ground-based observations are limited. However, it is important to mention that MODIS NRT fire products, while powerful, are not without limitations. One key issue is the potential for false positives and false negatives. False positives can occur when non-fire sources of heat, such as volcanic eruptions or gas flares, are misidentified as fires. False negatives can occur when small or low-intensity fires, especially those obscured by smoke or vegetation, are not detected. Uncertainties are present in most fire algorithms but [26] demonstrated that boreal biomes exhibited the highest values of date percent agreement between burned area pixels and active fires, showing the validity of using MODIS for large-scale evaluation.

2.3. Lightning Datasets

Cloud-to-ground lightning data used are from The Earth Networks Global Lightning Network (ENGLN, https://www.earthnetworks.com), that combines the World Wide Lightning Location Network (WWLLN, http://wwlln.net/, with the Earth Networks Total Lightning Network (ENTLN). The ENTLN is a global network with more than 1600 wide-band sensors, with location accuracy of 210 m, and detection efficiency and classification accuracy of higher than 90% for cloud-to-ground strokes [27]. More on its performance can be found in [28,29]. The WWLLN is a global network consisting of very low frequency sensors, a collaborative network involving many universities at different locations. The WWLLN performance has improved with an increasing number of stations around the world through the improvement of algorithms, with approximately 10 km spatial accuracy [30].
The overall detection efficiency is 11% for the cloud-to-ground flashes, with more than 30% for intense flashes [31]. As described in detail by [32], the WWLLN dataset provides the position, time of occurrence, and energy radiated by lightning discharges, the ENGLN in addition to those quantities, delivers the polarity and peak current of lightning strokes. Both datasets present reasonable accuracy in detecting lightning; nevertheless, the ENGLN has shown higher detection efficiency by up to 90% across US and 57% globally [33,34]. Herein, the daily number of strokes per square km during the 2010–2020 interval is evaluated.

2.4. Soil Data and Evaporation

The GLEAM is based on satellite near-surface soil moisture active C- and L-band microwave sensors (European Space Agency Climate Change Initiative, ESA CCI), vegetation optical depth, and snow-water equivalent. Climate data based on the reanalysis of air temperature and radiation and a multi-source precipitation product are also used. The model version 4.1 currently used (https://www.gleam.eu/) is designed to calculate potential evaporation (Ep) by integrating several key inputs: surface net radiation (Rn), near-surface air temperature (Ta), wind speed (u), leaf area index (LAI), and vapor pressure deficit (VPD). The model outputs include bare soil evaporation (Eb), transpiration (Et), interception loss (Ei), actual evaporation for water bodies (Ew), and actual evaporation for ice/snow regions (Es). GLEAM computes root-zone soil moisture (SMrz) using a multi-layer running-water balance and assimilates satellite observations of surface soil moisture (SMs), to correct potential errors. The term evaporation instead of evapotranspiration is used herein based on the analysis of [35], who argued that the former is more suitable to characterize vaporization of water over land. Calculations of potential evaporation over bare soils and canopies are converted into actual evaporation using a multiplicative evaporative stress factor, which is based on observations of microwave Vegetation Optical Depth (VOD) and estimates of root-zone soil moisture.

2.5. Climate Extremes and Statistical Analysis

Extreme climate indices have been computed as proposed by the joint Expert Team on Climate Change Detection and Indices (ETCCDI) http://etccdi.pacificclimate.org/) for daily maximum temperature and daily precipitation amount. Linear correlation and seasonal boxplot analysis are conducted to identify the relationship between climate and weather variables. To compute the temporal evolution and trends, modified Mann–Kendall methods [36] are used and deseasonalized standard deviations are applied to characterize the spatial variability. While correlation analysis may have limitations when dealing with nonlinear relationships, studies have demonstrated that for monthly datasets and longer, linear methods can be generally sufficient, especially after addressing non-stationarity issues [37]. Our analysis aligns with these findings. It has been demonstrated that the quantitative impact of nonlinear coupling on the monthly scale is minimal, providing strong support for the present use of linear methods in analyzing monthly data.
Previous studies have indicated an increase in the frequency, severity, and risk of wildfires, particularly in regions like Central Europe, East Asia, and Western North America, driven by changes in temperature, atmospheric dryness, and reduced precipitation. Given these trends, it is essential to investigate whether regions experiencing extreme climate conditions are also experiencing increased fire characteristics. Thus, calculating trends which may be related to fire occurrence is crucial to understanding the relationship between extreme weather and fire. Trend magnitude was calculated using Sen’s slope method and its statistical significance was assessed using the modified Mann–Kendall (MK) non-parametric test at a 95% significance level (p-value ≤ 0.05) [36]. As noted above, the MK test is robust to non-normal data, insensitive to sudden data gaps, and resistant to outliers.

3. Results and Discussion

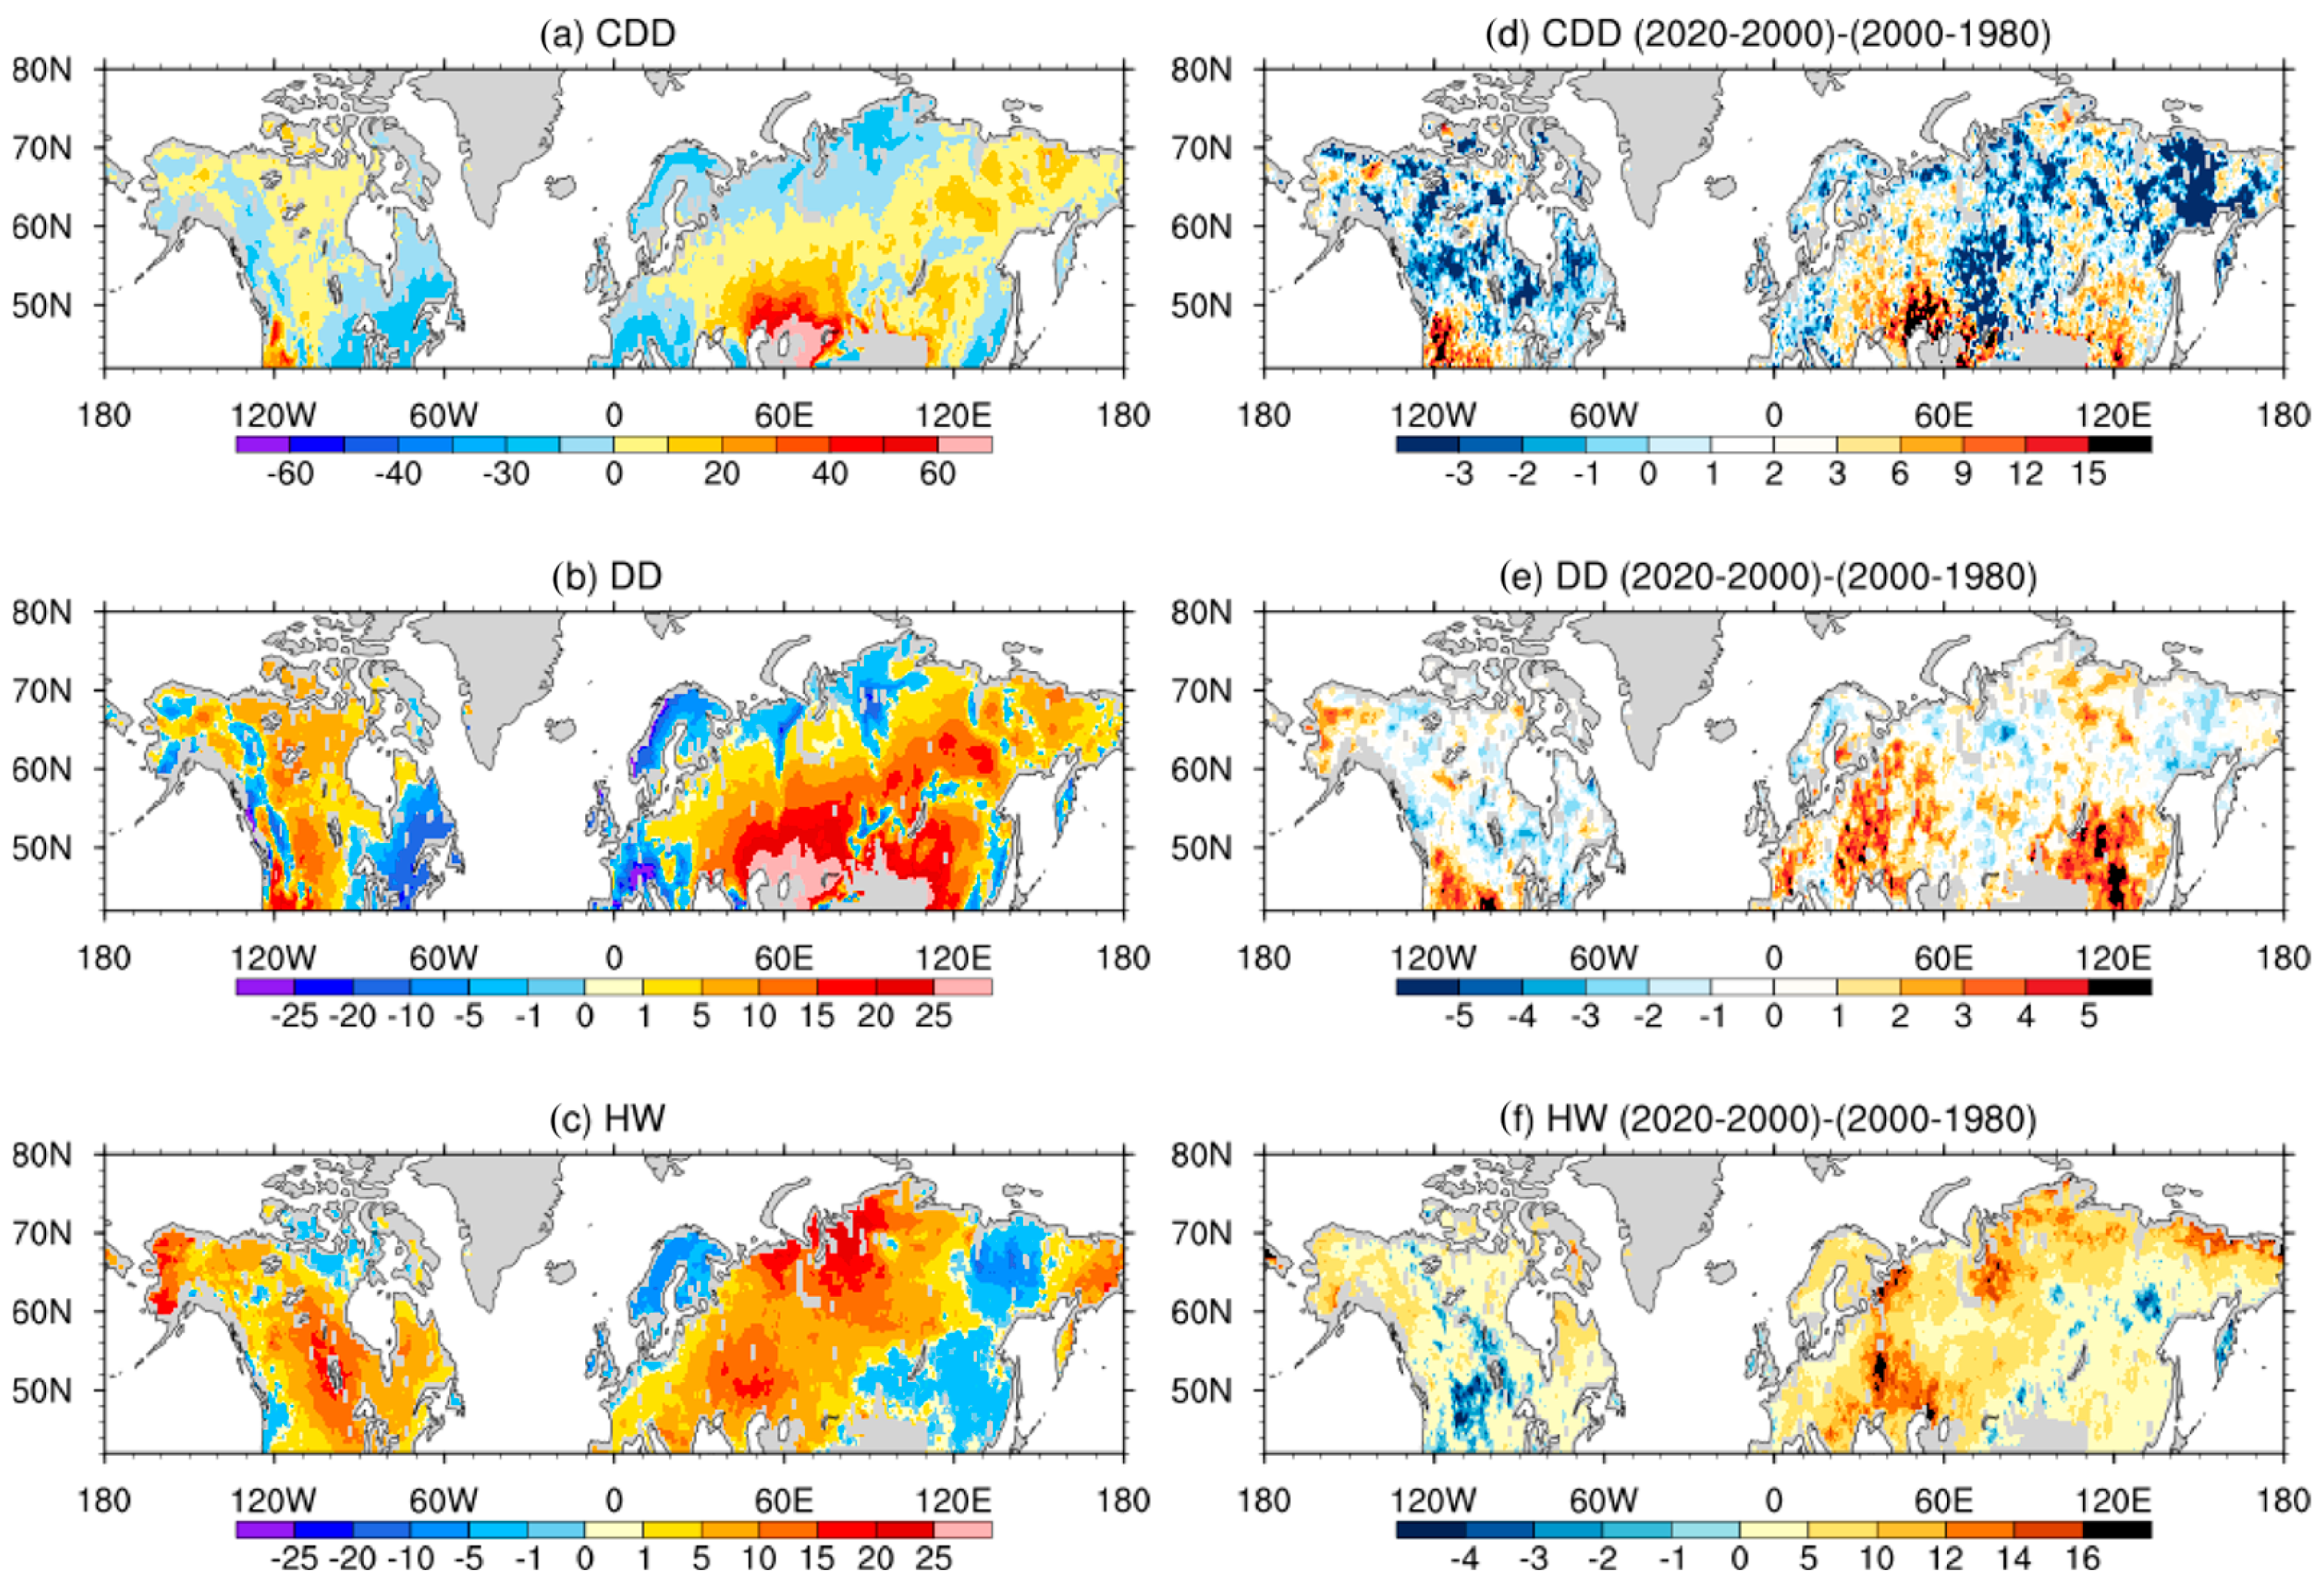
3.1. Climate Extremes Indices: CDD, DD, and HW

Figure 1a–c shows zonally averaged anomalies of CDD, DD, and HW in the 1980–2020 period. By removing the zonal mean, we can more effectively highlight hotspot regions. It is found that CDD is higher across western NA with respect to zonal averages, particularly in Oregon and California, and south and northeastern Asia (Figure 1a). In fact, these values of CDD indicate that western North America and southern Asia centered in 45–55° N have more than 30 days without precipitation higher than 1 mm/day in a year, with respect to the zonal average (Figure 1a). Dry spells across the west coast of NA, by about 120° W, interact with a wide variety of plant types, allowing for the presence of conifers and grasslands which, in summer, can provide fuel loading needed for fire ignition. It is worth mentioning that a large amount of precipitation across west NA is associated with moisture transport due to atmospheric rivers which, during the recent decades, have experienced negative trends in summer, leading to reduced rainfall frequency. Middle latitudes in the central part of NA are, in general, covered by grasslands, short trees, and shrublands, vegetation types that are also very susceptible to fire ignition.
Although, mostly covered by snow in winter, vegetation in Siberia and eastern Europe/southwestern Asia responds in summer to increased irradiance and subsequently warmer conditions. These regions have been affected by a large number of fires with increased severity [38], thus in agreement with the CDD distribution. The dry spot in middle latitudes nearby Kazakhstan also experiences substantial fire activity as demonstrated by previous work [3,6,39].
The cumulative distribution of precipitation intervals, calculated using the DD index (as defined in the previous section), closely aligns with the main patterns observed in the CDD distribution across central North America (Figure 1a,b). Specifically, regions with higher DD values tend to correspond to areas with larger CDD values (Figure 1a,b). However, the temporal evolution of precipitation intervals exceeding five days, as represented by the DD index (Figure 1b), suggests that it may provide a more nuanced depiction of critical drought conditions, by accounting for the longer-term persistence of rainfall deficits. Indeed, ref. [4] demonstrated that DD higher than 30 is associated with high danger and potential occurrence of fires. This occurs because vegetation greening or browning, and consequently its susceptibility to fire, is primarily influenced by the timing and amount of cumulative precipitation rather than isolated rainfall events [40,41].
Although CDD is able to show the region’s lack of precipitation, it may not properly represent the soil moisture content because accumulation and evaporation of soil water responds to changes in the daily rainfall distribution rather than accumulated in a prescribed interval. This has a profound impact on vegetation characteristics and properties, including biomass production, which is more responsive to soil moisture content in distinct phenological stages. It has been shown that grasslands and forests are more sensitive to soil moisture anomalies during the maturity stage, which is achieved according to the environmental conditions along the plant cycle [42].
The extreme conditions related to temperatures have been examined during the 1980–2020 period. The time averaged HW shows regions in NA and Asia with the largest number of consecutive days, where maximum temperatures exceeds the 5-day running mean by 5 °C (Figure 1c). Alaska and northern Russia are the hot spots. There are other regions which experience frequent HW such as the central parts of NA, Balkans, and far east Russia. This indicates more frequent higher temperatures in summer due to more persistent anticyclonic circulation in Eurasia [43]. In NA, recent HW episodes have also been attributed to drought and reduced soil moisture. Dry soils are associated with increasing sensible heat flux into the atmosphere, further increasing air temperatures [44]. The interannual changes in Alaska’s temperatures and summer warming have a large contribution from increased greenhouse gases (GHG), with the GHG forcing accounting for 51% of the Alaska’s winter warming and 75% of Alaska’s annual mean warming over the 1950–2017 time period [45].
In addition to mean conditions, it is crucial to analyze how those extreme weather indices have evolved in recent decades. This is justified by the fact that large parts of extratropical latitudes have shown positive trends in fire danger ratings, wildfires, and burned areas [3,6,39]. Analysis of the differences between the 2000–2020 and 1980–2000 decades reveal regions experiencing increased warming and dryness, particularly in southwest,53,54t NA and the temperate continental region of central Eurasia (30–70° E, 40–60° N) (Figure 1d–f). However, due to the short length of the time series, the statistical significance of these differences may be limited. Nonetheless, this does not invalidate the analysis or the insights derived from them.
Decadal differences in CDD and DD indicates that western NA and most of Asia southward of 55° N have been more frequently affected by intervals without precipitation, which are highlighted across 20–60° E–40–50° N (Figure 1d,e). Extratropical and polar latitude differences exhibit local characteristics. There is not a well-defined pattern except for negative CDD in easternmost Asia (120-180° E). The positive anomalies are also depicted by the DD distribution (Figure 1e). Indeed, four hotspots are identified over southern Asia, east Europe/Kazakhstan/west Russia, and over US west coast and Alaska. These regions have been marked by substantial fires and burned areas in the recent decades [4,6].
Focusing on the extratropical pattern of heat waves (Figure 1c,f), we observe that HW largely aligns with the large-scale patterns of DD and CDD in North America, where positive HW anomalies coincide with positive CDD and DD. However, regions in northern Asia frequently affected by HW do not exhibit pronounced CDD and DD anomalies. This suggests that transitions between dry and wet conditions in recent decades may not be solely driven by increased temperature and evaporation
Analysis across Eurasia point out different patterns with respect to NA because over the middle latitudes, increases in HW and DD/CDD show good agreement, as demonstrated by the yellowish and reddish regions in Figure 1d–f. It has to be noted that north of 60° N, the correspondence is marked. This indicates that daily precipitation can occur without significant changes in temperatures during the 1980–2020 period. Certainly, the influence of far-reaching changes in atmospheric dynamics and global climatic teleconnections induced by the modes of climate variability, can substantially affect precipitation and temperature in different ways across the study region [12,46].
A further step in evaluating temperature and precipitation extremes and their link to fire activity is conducted based on heat map calculations (Figure 2). The heatmap characterizes the temporal evolution in a two-dimensional distribution to demonstrate the magnitude of individual monthly values across North America, Europe, and Asia. This aims to verify the fire frequency and burned area during 2001–2020 and the potential influence of diurnal temperature range (DTR, the difference between the daily maximum and minimum temperatures) and the maximum amount of rain that falls in five consecutive days (Rx5day). Both extremes play a relevant role in increasing fire danger as well as fire incidence through inducing evaporative demand in the case of DTR [47] and increased combustible material in the case of Rx5day.
Analysis of DTR is important because they represent daily available heat [48], which may be converted into sensible or latent fluxes that further modify the greenhouse capacity of the atmosphere by inducing evaporation. On the other hand, in a dry atmosphere DTR might increase diurnal temperature, thus, potentially leading to changes in soil moisture characteristics [49]. Rx5day represents the most extreme precipitation event that reduces the environmental susceptibility to fire development. In this sense, an evaluation of its temporal evolution is crucial because worldwide, Rx5day is projected to reduce in intensity in areas that are wet and increase in intensity in dry areas [50].
During the initial years along the 2000–2020 interval, the DTR across North America does not show significant changes from 2000 to 2010, but positive trends are evident during summer for some years during the 2010–2020 interval. Turning to patterns in Europe and Asia, similarities are found for DTR, in which there exists an increase in DTR during the summer months from 2009 (Figure 2e,i). Differences are noted in Asia, where an increase in Rx5day by up to 40% with respect to averaged conditions is found (Figure 2j). It is quite interesting that all these changes in DTR and Rx5day do not show a clear correspondence with fire frequency and burned area (Figure 2k,l). Although, during the first (second) decade, reduced Rx5day and DTR in Europe (Asia) seem to reduce the extent of burned areas. The spatial distribution of decadal trends of DTR and Rx5day (Figure 2m,n), demonstrated that large departures from mean conditions are observed across western North America, and mid-latitudes of Eurasia, particularly for DTR (Figure 2m).
Those regions have been identified as most vulnerable to fires [39]. Trends of Rx5day are overall barely statistically significant (Figure 2n), but positive values are found over Siberia, southern Asia, and the Canadian archipelago. These previous analysis reveal that both temperature and precipitation extremes can significantly influence temporal fire variability because no remarkable changes have been identified in climatological conditions. To better understand these relationships, the next sections explore vegetation characteristics, soil moisture, and evaporation patterns, which may serve to increase the understanding of preconditions for fire development and spread.
Climate extreme analysis (1980–2020) reveals consistent increases in drought (consecutive dry days and dry-day intervals) and heat stress (heat waves) across North America, Europe, and Asia. Western North America and parts of southern and northeastern Asia are particularly affected by prolonged dry spells, experiencing over 30 additional dry days annually. The persistence of these precipitation deficits directly contributes to vegetation stress, soil moisture depletion, and heightened fire susceptibility, aligning with observed increases in fire activity in regions like Kazakhstan, eastern Russia, and the U.S. west coast.
Concurrently, heatwave trends show strong regional variations, notably increasing in Alaska, northern Asia, and central North America. The co-occurrence of heatwaves with dryness in extratropical zones underscores the compound nature of climate extremes, amplifying environmental stress. However, discrepancies in some northern Asian areas (heatwaves without increased dryness) suggest the influence of non-hydroclimatic factors. These findings emphasize that the intensity and timing of various extreme events are crucial for modulating fire regimes, highlighting the need for a multidimensional assessment of fire risk and ecological vulnerability in a changing climate.

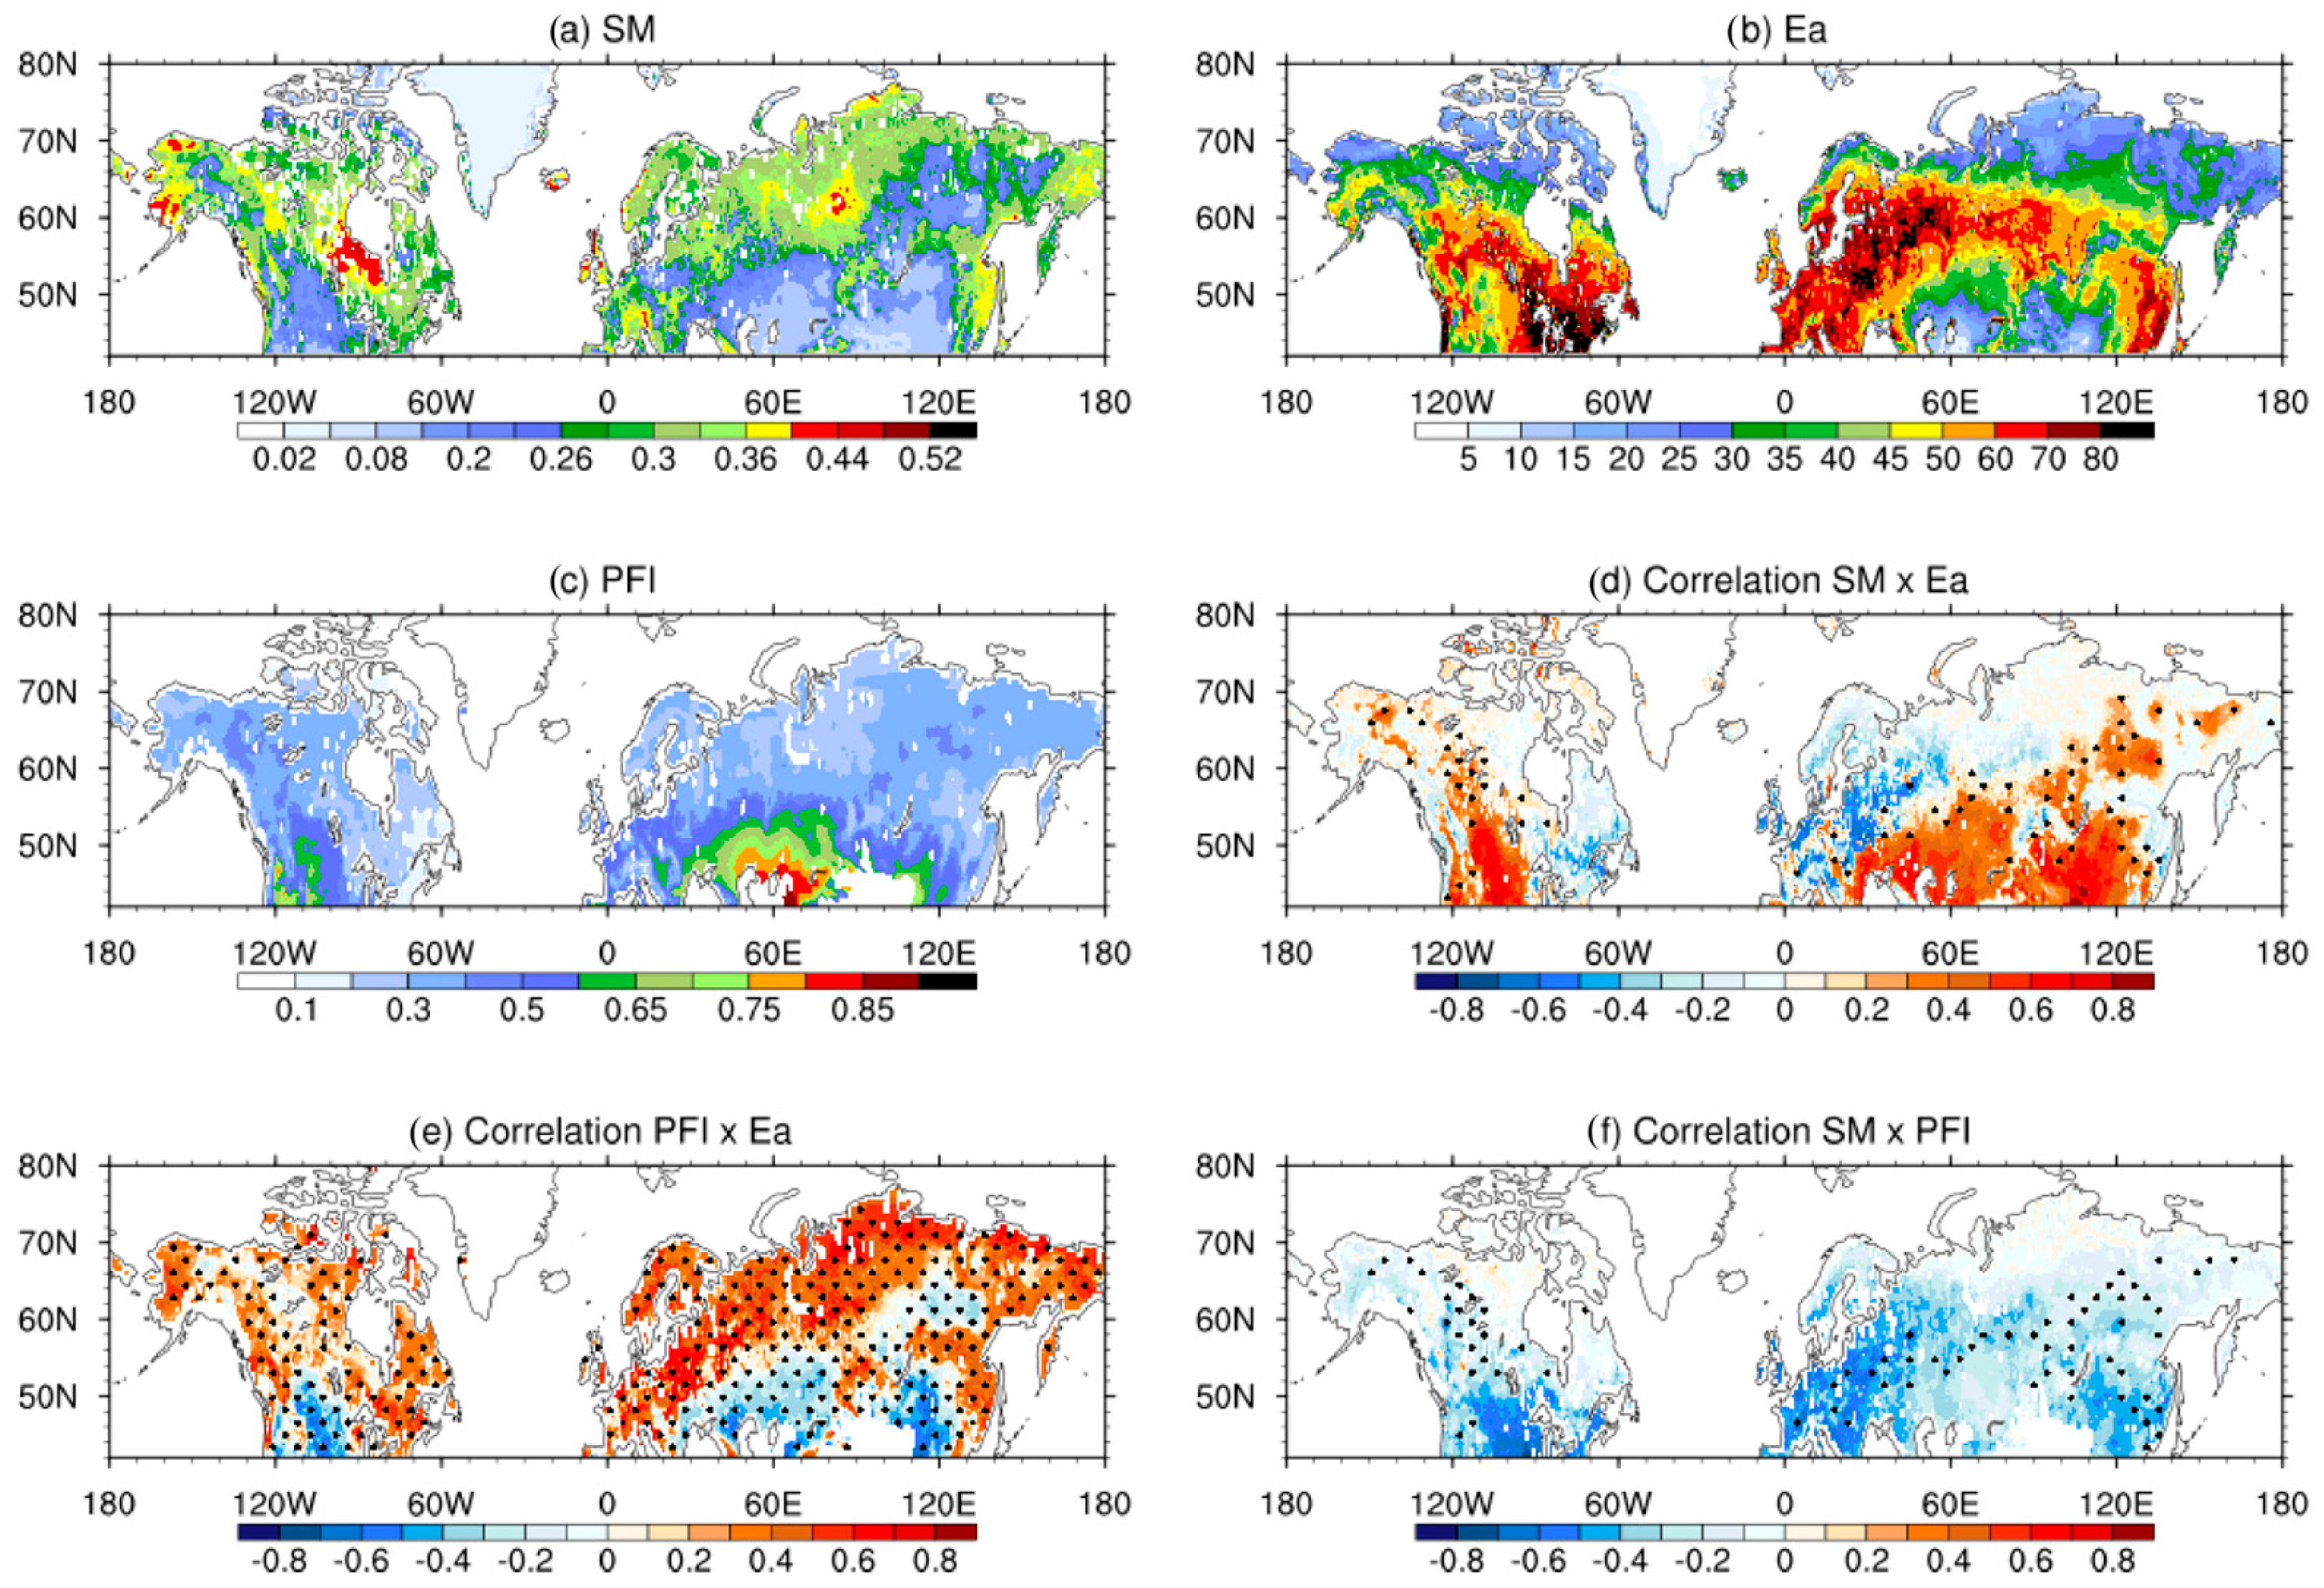
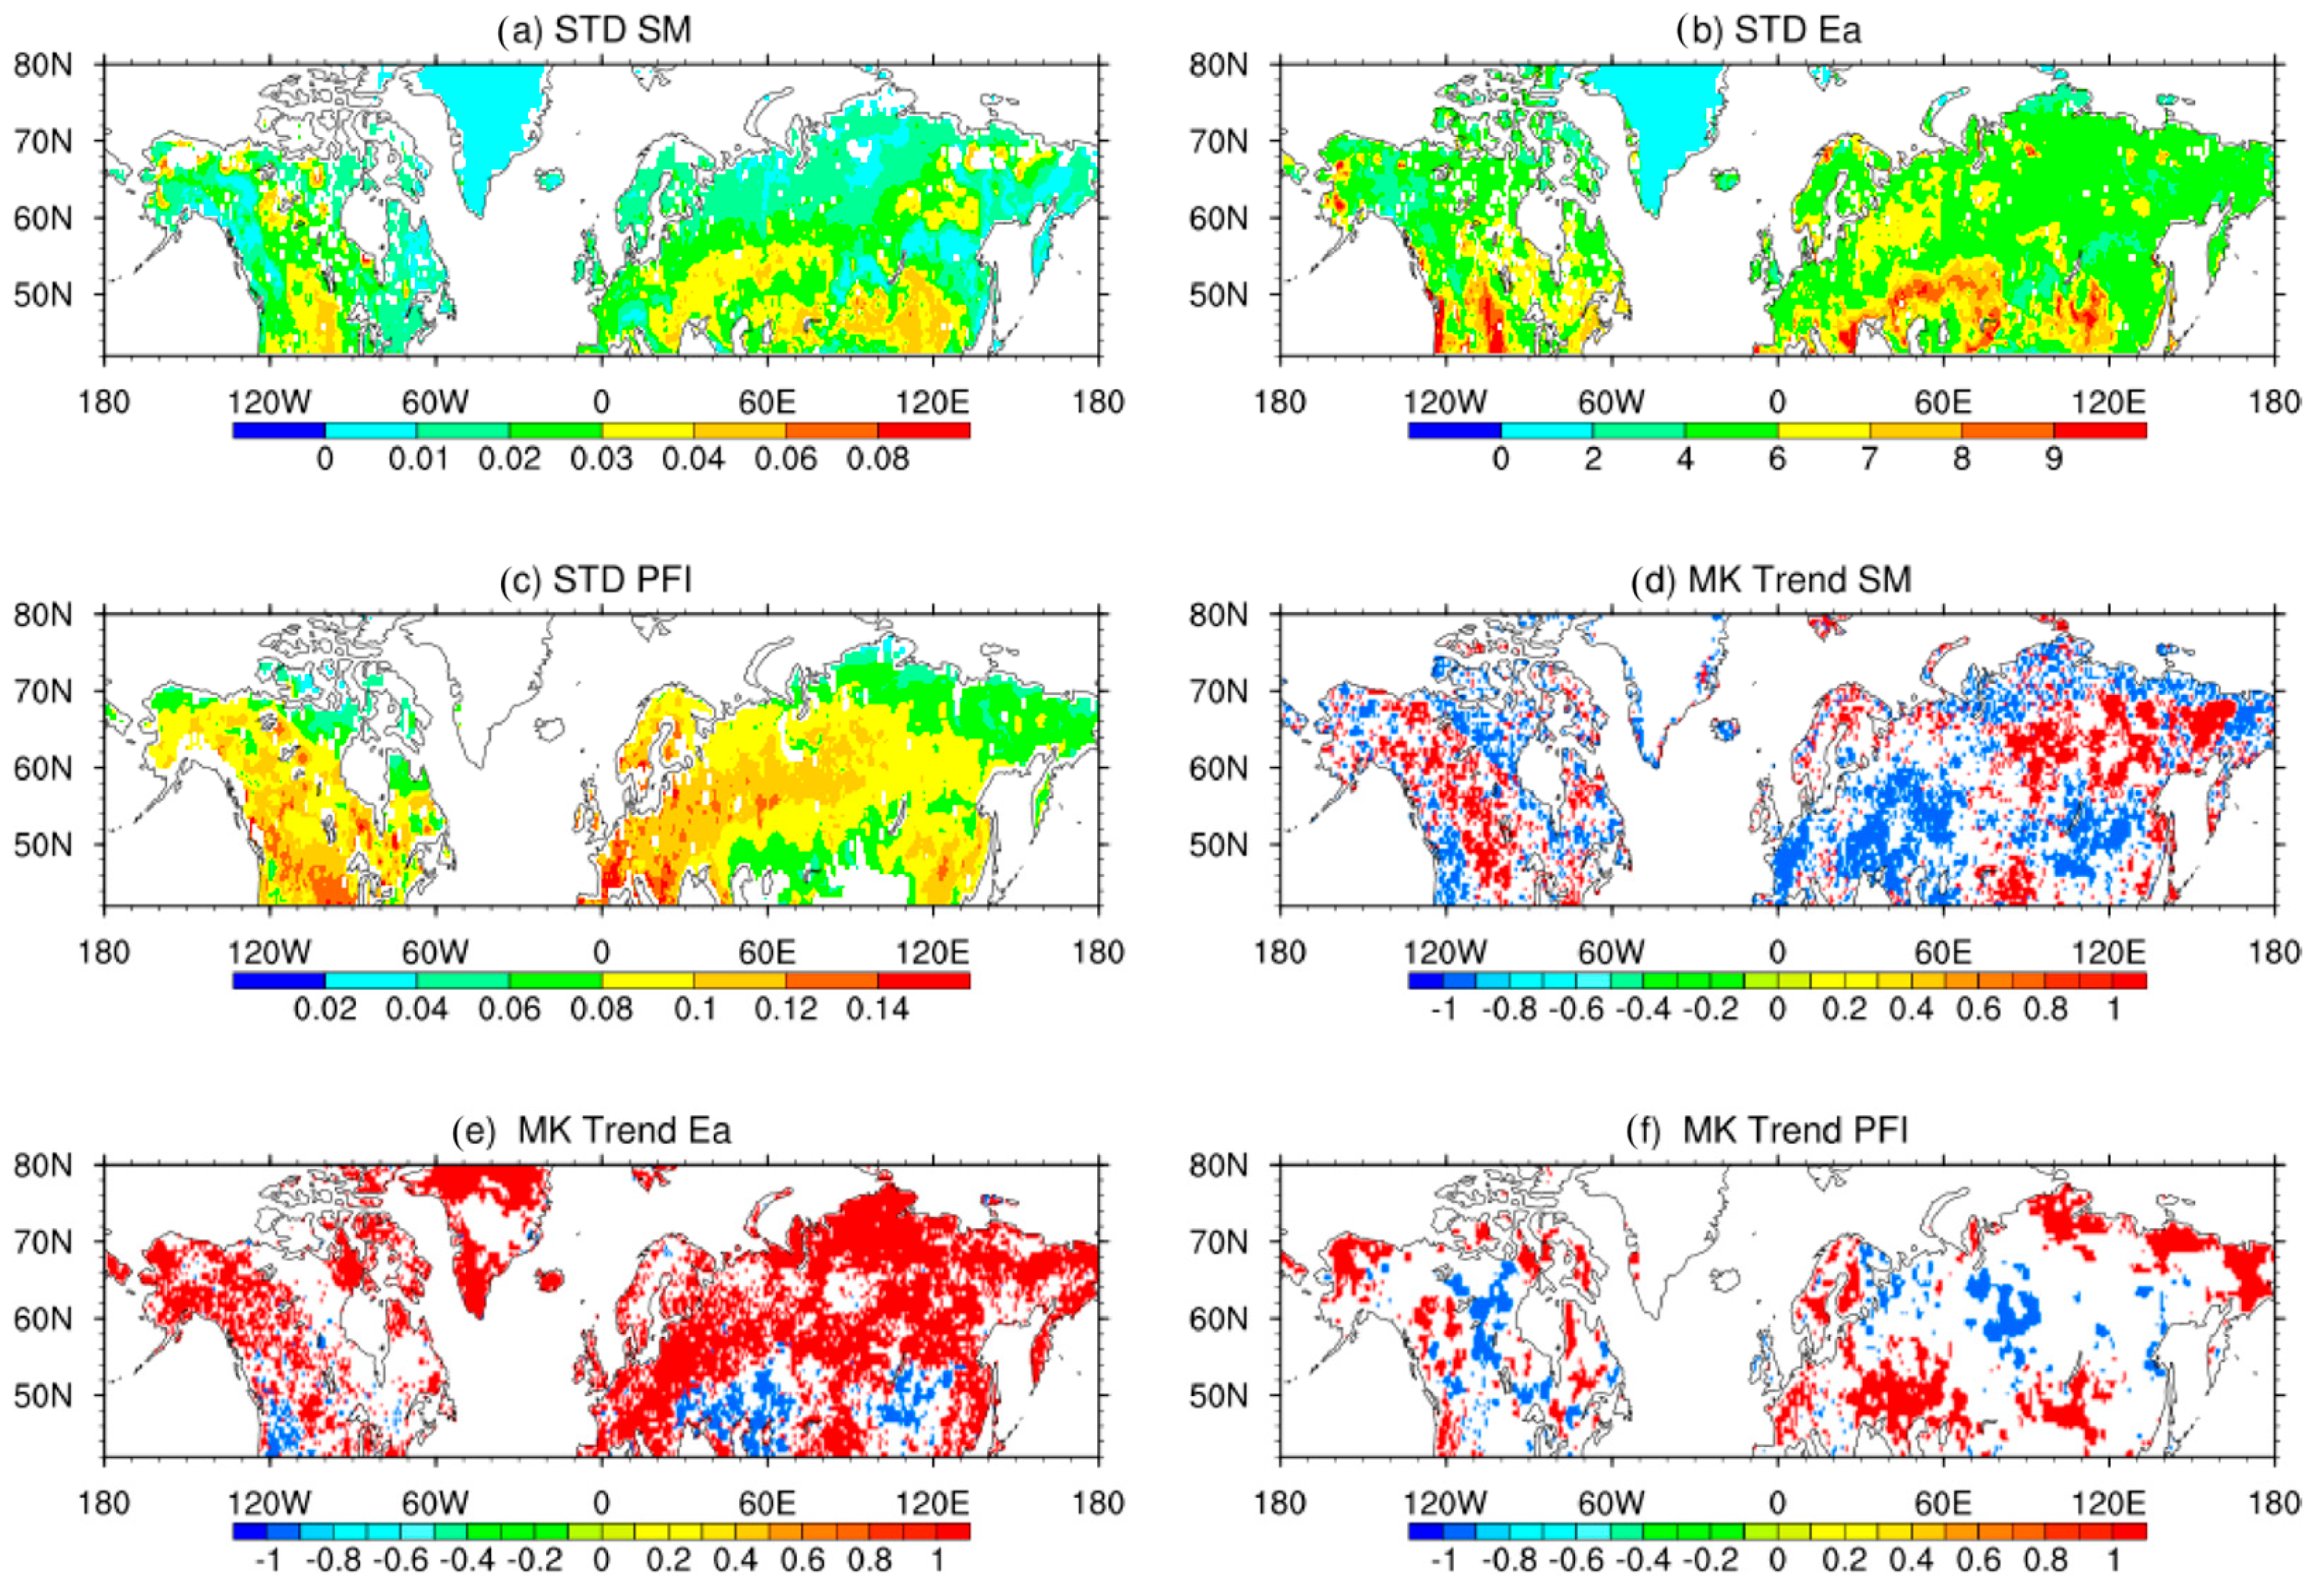
3.2. Land Surface Characteristics: Soil Moisture (SM), Evaporation (Ea), and Fire Danger (PFI)

Figure 3a shows the dominant pattern of SM variability based on GLEAM estimates from March to October, during 2001–2020. The main characteristics of SM is the dominance of much higher values across northern Asia and northern NA. The close association between the SM and Ea fluctuations is sort of true in the extratropics but it also reveals that distinct vegetation influences the overall pattern (Figure 3a,b). Indeed, the northeast part of NA does show larger values of SM (Figure 3a), but the Ea varies considerably (Figure 3b). These regions are covered by vegetation types, temperate and mixed forests across the northeastern North America (taiga in the north), that are able to capture water from subsurface soil layer due to much deeper roots [51]. This allows for sub-surface water uptake throughout the year, favoring an increase in Ea during drier conditions.
Turning to analysis of the PFI, it is demonstrated that maximum amplitude values are found in the middle latitudes, across 40–60° N, which are not entirely in line with seasonal/interannual changes in soil moisture and evaporation. However, over North America these quantities are in phase as shown by the correlation analysis (Figure 3d–f). PFI values below 0.5 are related to low fire danger during spring and fall (Figure 4c). These lower values contribute to a reduction in the annual average PFI, which is typically high during the summer season (see Figure 2 in [4]).
Figure 3d shows that SM and Ea exhibit strong spatial correlations, particularly at zero lag, indicating a close relationship between soil moisture and evaporation. When examining correlations at different time lags, we find that monthly correlations decrease for all analyzed quantities (Ea, SM, and PFI). It is interesting to note that positive correlations between Ea and SM are found across middle latitudes of Eurasia and western NA, and negative values are found over the eastern NA and high latitudes, particularly in Europe. This indicates that northward of 50° N, vegetation characteristics are not directly related to surface soil moisture. The positive Ea-SM correlation in mid-latitude Eurasia and western North America reflects soil moisture-limited regimes where SM controls evaporation [52,53].
Negative correlations in eastern North America and high-latitude Europe occur in energy-limited regions where atmospheric demand drives Ea, reducing SM [54,55]. High-latitude decoupling (north of 50° N) stems from frozen ground processes, with subsurface water sustaining evaporation [56]. These patterns are modulated by land–atmosphere feedbacks, where moisture-limited regions show SM–Ea causality, while heat-limited regions exhibit Ea–SM relationships [57,58]. Atmospheric conditions can undoubtedly exacerbate this relationship. This is expected in well-watered regions such as high latitude soils (Figure 3d) [59].
The PFI and Ea relationship shows that high fire danger is positively correlated with Ea (Figure 3e). Positive correlations up to 0.8 are found across the northern part of Eurasia and NA, which are statistically significant at the 99% level (Figure 3e), indicating that northward of 60° N, Ea and PFI march at the same pace throughout the year. These features depend on the magnitude of the seasonal cycle. It is found that in most regions, the Ea is dominated by a well-defined seasonal contrast with maximum (minimum) values in summer (winter). This is not the case for the PFI, in which the semi-annual cycle, with two maxima, exerts a dominant role across most of the middle latitudes [14]. During some months, the semi-annual component results in an out of phase pattern (negative correlations) between the PFI and Ea. The correlation between the SM and PFI (Figure 3f) demonstrates that high fire danger is accompanied by low surface soil moisture (Figure 3e) in central NA and Europe. However, in general, fire risk and soil moisture do not show correspondence at all.
At lag-0, precipitation shows no correlation with SM due to rapid drainage basin effects, suggesting that PFI’s connection to SM/EA may operate through more complex mechanisms than direct precipitation coupling. This implies that while precipitation deficits may create conditions favorable for fire through vegetation drying, the translation of these deficits into SM and EA changes, and consequently PFI, depends on basin-specific hydrological processes and temporal lags. The lack of immediate SM response to precipitation highlights the importance of considering intermediate variables like vegetation stress and atmospheric demand when evaluating fire potential.
The deseasonalized standard deviation (STD, Figure 4a–c) of the temporal variability of SM, Ea, and PFI between 1980 and 2020 reveals that despite having distinct vegetation types, that vary from grasslands, evergreen, and deciduous needleaf, and open shrubland, northern Asia and most of NA do not experience large temporal fluctuation in SM and Ea (Figure 4a,b). However, changes in SM and Ea over the 40–50° latitudinal belt show high temporal changes with similar spatial patterns (Figure 4a,b). Changes in the fire danger variability as shown by the PFI, do not match the SM and Ea patterns (Figure 4d–f) because the PFI is primarily dominated by accumulated precipitation in different intervals throughout the last 120 days.
Interannual changes in PFI are distributed over large regions with higher standard deviation (brown-red areas) across US, Europe, western Asia, and southern China (Figure 4c). This differs from Ea, which mostly changes in response to energy budget and vapor pressure deficit that are affected by weather characteristics and not necessarily precipitation. SM also responds to day-to-day variability which in some cases is in phase with changes in Ea (Figure 4a,b). However, SM is also associated with regional soil properties (color, texture, structure, porosity, density, consistency and temperature) that vary greatly among sites, even under similar vegetation patterns [60,61].
Previous studies have indicated an increase in the frequency, severity, and risk of wildfires, particularly in regions like Central Europe, East Asia, and Western North America, driven by changes in temperature, atmospheric dryness, and reduced precipitation. Given these trends, it is essential to investigate whether regions experiencing extreme climate conditions are also affected by increased fire characteristics. Thus, calculating trends which may be related to fire occurrence is crucial to understanding extreme weather and fire relationships.
Trends are based on the modified Mann–Kendall approach for SM, Ea, and PFI (Figure 4d–f). This evaluation is crucial because positive trends in Ea may lead to increase flammability in response to degraded forests, and increased fuel loads, as discussed by [62]. Moreover, the increase in actual evaporation contributes to drought severity by decreasing soil moisture. Negative trends in SM are evident in central Europe and the Balkan states. Most of North America has experienced increased soil moisture, with the exception of parts of the west coast (Figure 4e). Ea distribution shows that the majority of areas are dominated by positive trends (Figure 4e). This may reflect an increase in temperature and local changes in land-use, particularly in Europe and central and southern Asia. Several locations, in particular, eastern-central Asia and northeastern NA have abandoned crop and pastures, which favor land evaporation [63,64,65] and increased fire danger, as shown in Figure 4f. Indeed, positive statistically significant trends of PFI are evident over the west coast of NA, Europe, Scandinavia, and Siberia. It is interesting to notice that PFI and SM trends can be the opposite (Figure 4d,f), particularly in central Eurasia, between 30 and 60° E. At large, trends in Ea, SM, and PFI may indicate conditions more conducive to increased fire danger across those regions. Alaska’s increased fire danger can be related to the conversion of forests to shrubs and grasslands [66].
The analysis of SM, Ea, and PFI across the Northern Hemisphere reveals complex interactions between soil–vegetation–atmosphere processes and their role in modulating fire danger. The spatial decoupling of PFI from SM in many regions, despite shared influences from temperature and precipitation, highlights that fire risk is not governed solely by immediate moisture availability but by its interplay with vegetation traits, land surface conditions, and long-term hydroclimatic memory.
Trends over the past decades suggest a growing threat from wildfires across temperate and boreal latitudes. Statistically significant increases in Ea and PFI across Europe, East Asia, and North America indicate that warming temperatures, land-use change, and shifting precipitation regimes are intensifying fire potential, even in regions with increasing soil moisture. For instance, central Eurasia and parts of Alaska are experiencing rising fire danger linked to vegetation shifts and human-induced land abandonment. The observed divergence between SM and PFI trends in several hotspots further emphasizes the need for integrated assessments that consider both physical and ecological dimensions of fire risk.
Together, these findings highlight the growing relevance of land–atmosphere coupling and highlight the importance of long-term monitoring to inform fire management under climate change.

3.3. Fires and Lightning

As demonstrated previously, near-surface atmospheric conditions and soil moisture are individually responsible for inducing regional characterization of fire danger, fire frequency, and severity. Wildfires have also been linked to cloud-to-ground lightning, particularly over regions with reduced human presence, such as the Pan-Arctic [8,32,67]. In this sense, it is quite useful to verify the lightning spatial distribution to disentangle its contribution to the fire regime [17,68]. In the following, the lightning spatial distribution and frequency, and the 95th CAPE percentile are discussed. Furthermore, the temporal pattern in which lightning and fires are coincident in the grid boxes is explored, as well as how they are distributed across extra-tropical ecoregions which are characterized by distinct biomes.
Lightning strikes, which in the tropics are followed by rain, in most cases do not result in fires [69]. In contrast, dry lightning events have resulted in large tundra fires in the extratropical remote regions and can potentially induce higher fire danger and severity under future climate conditions, with the predicted future expansion of boreal forests under global warming scenarios [70]. Evaluation of fire weather conditions and the presence of lightning density (LD) based on class distributions (histogram), is carried by extracting values of precipitation, surface temperatures, DD, and PFI when lightning is identified in a grid box. Results show that most lightning events are found under daily precipitation lower than 10 mm, characterized by a left modal/negatively skewed distribution. For temperatures, values are between 15 and 22 °C with exponentially increasing probability. The distribution of DD shows prominent positive skewness, i.e., most values are clustered around the left tail. However, the relationship between the fire danger (PFI) and LD is primary dominated by a normal distribution. Higher incidence of LD is found in grid boxes with PFI around 0.5, with moderate fire danger. This is reasonable because LD is highly correlated with precipitation (low danger).
Figure 5a,b show the monthly accumulated LD during the 2010–2020 interval, based on the ENGLN global network. Despite using two datasets, only the ENGLN spatial and temporal characteristics are shown; consideration of the WWLLN is provided when necessary. The total LD as delivered by the WWLLN platform in both North America and Eurasia, is much lower as compared to the ENGLN counterpart [71,72]. However, the WWLLN can capture the primary regions of lightning occurrence. The ENGLN LD displays three maxima over central North America, southern Europe/western Russia and east Asia (Figure 5a,b). These regions are baroclinic zones in which extratropical air masses interact with warmer subtropical conditions, favoring convection and storminess. An additional contribution to convective systems and atmospheric instability is provided by vegetation, which as a result of summer heating increases evaporation leading to moist convection and cloudiness (Figure 3b). Vegetation significantly influences the exchange of heat and moisture between the land surface and the atmosphere within the planetary boundary layer, affecting the development of convective available potential energy and ultimately influencing the frequency and intensity of precipitation [73].
Regional LD maxima exhibit spatial coincidence with MODIS fire detections across southern Europe, eastern Asia, and central North America (Figure 5a–d), yet mechanistic relationships remain uncertain as studies indicate that more than 50% of Eurasian and western North American fires originate from non-lightning sources [74,75] with only 15–25% of boreal fires being lightning-ignited [13]. This disparity reflects (1) detection limitations (MODIS misses ~80% of small fires <100 ha [76] while lightning networks underdetect weak strikes), (2) predominance of human ignitions (>60% in western NA [74] and 50–70% in Eurasia [75], and (3) environmental filters where only 4–12% of flashes ignite fires due to fuel moisture and vegetation barriers.
Regions with maximum CAPE, as shown by the 95th percentile, also match the core maxima of LD activity, and resemble regions with the largest frequency of fires (Figure 5e,f), across mid-latitudes between 30 and 60° E in Eurasia. This region contains areas of abandoned farmland in Ukraine, Belarus, and Kazakhstan, where the lack of people leads to reduction in the human-induced fires [77]. However, no consistent trends in burned areas have been identified [6,78].
The number of pixels in which fires and LD occur on the same day and grid has been computed between 2010 and 2020. Two limitations arise from this analysis because by extracting points in the fire grid, it does not necessarily correspond to the exact lightning locations. Secondly, both lightning and fire may occur at different times during the day. Across NA the number of days when fires and lightning events have been found at the same grid boxes during 2010–2020 interval is about 20 days/year, and very little differences arise on the choice of the data base, whether using ENGLN or WWLLN datasets. The interannual variability when fires coincide with lightning is more evident from 2014 in Eurasia because the lightning data has been collected by an increased number of stations (Figure 5i). In Eurasia, the number of days in which lightning and fires are concomitant is larger than in NA, and in some years, such as 2014, reaching up to 100 days. The occurrence of these events reveals that fires and lightning are distributed during warmer months. Their activity from onset to demise lasts for almost 7 months, from March to August (Figure 5g–j).
North America experienced the highest (lowest) spatial concurrence between LD and fires in 2010 (2014). Between 2012 and 2016 there is a reduction in the spatial distribution of fire (Figure 5g). This temporal behavior is not related to LD distribution. According to the NASA Earth Observatory (https://earthobservatory.nasa.gov/images/79921/us-fires-2012, accessed on 12 March 2022), the total number of fires (55,505) in 2012 was the lowest recorded by the US National Inter-agency Fire Center (NIFC), but this year attained the second largest acres burned between 2010 and 2016. Figure 5g demonstrates that changes in fire occurrence are not entirely explained by changes in lightning frequency. In Eurasia, the monthly distribution reveals that July is the month with the highest spatial overlap between fire and lightning events. Fires and lightning events are distributed primarily from March to October, whereas from November to April lightning density and fire are very low (Figure 5j).
Despite some regional and seasonal overlaps between fire and lightning events, particularly during warmer months (March–August), the overall spatial concurrence remains modest, with a limited number of fire and lightning coincidences per year across North America and Eurasia. This disconnection may stem from detection limitations in both fire and lightning datasets, temporal mismatches, and environmental constraints that restrict lightning-induced fire ignition. Eurasia shows a higher number of coincident fire–lightning events especially after 2014 due to improved LD monitoring. However, interannual variability in fire occurrence is not consistently linked to lightning frequency, suggesting that other factors, such as fuel conditions, land abandonment, and broader climatic influences, play a more dominant role in determining fire regimes. These findings highlight the complex interplay between atmospheric instability, ignition sources, and surface conditions in driving fire risk across extratropical biomes.

3.4. Fire, Lightning, and Vegetation Cover

According to Figure 6, across NA, most fires occur in temperate grasslands, savannas, and shrublands (TGSS, 47%), temperate conifer forests (TCF, 31%) and boreal forest/taiga (BFT, 20%) (Figure 6b). In Eurasia, 37% of fires are concentrated over temperate broadleaf and mixed forests (TBMF). In addition, about 55% of fires are distributed across boreal forest/taiga and temperate grasslands, savannas, and shrublands (Figure 6c).
Analysis herein demonstrates that eastern Europe and southeastern Asia are largely affected by fires in association with lightning (Figure 5). Massive cropland activities take place in eastern Europe and Asia, which is mostly covered by grassland, mixed, and deciduous forests [79]. These biomes are more related to high local fire danger being more fire-prone. It is interesting to note the good match between the incidence of LD and fires over TGSS; on the other hand, across western North America, the lower number of LD resides with the large incidence of fires over temperate conifer forests (Figure 6a,b,d).
Figure 6d shows over North America that 76% of lightning frequency is found across regions dominated by TGSS vegetation and 17% over TBMF. The region covered by BFT (red regions in Figure 6a) exhibits a lower concentration of lightning events, but a large number of fires despite lower population density. This may reveal a greater anthropogenic influence upon fire ignition (Figure 6). Turning to Eurasia, the dominant regions of fires are also characterized by the largest number of lightning events, which are more frequent in the TBMF, in particular East Europe/Balkans. Central Asia and Scandinavia across the BFT show that the contribution of lightning seems to be weaker, as compared to its relevance with fire in the TBMF and TGSS, as mentioned above. This biome (BFT) only concentrates 7.3% of lightning in Eurasia, although it occupies the largest area (Figure 6c,e). It should be noted that on many occasions, small fires with short duration are not detected due to the time difference between the hotspot occurrence and the satellite passage, which can lead to a mismatch between fires and lightning events. Furthermore, the lightning station network is unevenly and sparsely distributed, which hampers a better correspondence between those disturbances.

4. Concluding Remarks

Recent decades have witnessed a pronounced increase in fire danger across key regions such as western North America, Alaska, and southern Asia, driven by escalating climate extremes. Notably, heatwaves (HW), consecutive dry days (CDD), and drought days (DD) have become more frequent and intense, correlating strongly with heightened fire risk from 1980 to 2020. These patterns are compounded by broader warming and drying trends, particularly in mid-latitudes. Moreover, diurnal temperature range (DTR) and reduced extreme precipitation (Rx5day) play critical roles by intensifying evaporative demand and soil desiccation, respectively, further elevating fire potential.
Soil moisture (SM) and surface evaporation (Ea) interactions reveal distinct latitudinal dynamics. In mid-latitudes, SM and Ea are positively correlated, indicating strong coupling between available water and evaporative fluxes. However, in high-latitude regions such as Siberia and northern Canada, this relationship inverts, as evaporation becomes increasingly driven by vegetation activity and subsurface water stores rather than topsoil moisture. This decoupling suggests that fire danger in these zones may be more sensitive to ecological factors like vegetation greening than to soil dryness alone. Lightning activity and its relationship with wildfires exhibit strong regional variability. While lightning density (LD) peaks align with fire occurrences in particular locations in southern Europe, central North America, and eastern Asia, a large proportion of fires in Eurasia and western North America stem from anthropogenic ignitions. CAPE (Convective Available Potential Energy) correlates with LD and fire hotspots, yet actual lightning–fire coincidence remains rare, particularly in North America where it occurs fewer than 20 days per year, underscoring the importance of non-lightning ignition sources in shaping fire regimes.
Vegetation type further modulates fire risk and ignition patterns. Temperate grasslands and savannas (TGSS) in North America account for nearly half of recorded fires, while lightning-induced ignitions remain sparse in boreal forest regions (BFT). In contrast, Eurasian fire activity is concentrated in temperate broadleaf and mixed forests (TBMF) where human ignition dominates and lightning plays a minor role. These biome-specific dynamics highlight the need for fire models to integrate land cover and ignition source information.
Despite the growing understanding, data limitations challenge comprehensive fire-risk assessments. The MODIS satellites may fail to detect small or low-intensity fires, and lightning networks (e.g., ENGLN, WWLLN) underreport weaker strikes. Additionally, ERA5 precipitation underestimates extremes, necessitating the inclusion of alternative datasets such as GPCP. Looking forward, climate change is expected to increase lightning frequency and vegetation productivity at high latitudes, potentially amplifying fire risk in boreal ecosystems. Consequently, the interplay of climate extremes, soil–vegetation coupling, and ignition sources must be carefully integrated into projections of future fire regimes.

Author Contributions

Conceptualization, F.J., D.H.B., J.R., C.G. and S.-H.W.; Methodology, F.J., J.R. and C.G.; Validation, C.G.; Formal analysis, D.H.B.; Investigation, S.-H.W.; Writing—original draft, F.J., D.H.B. and C.G.; Writing—review & editing, D.H.B.; Visualization, F.J., J.R. and S.-H.W. All authors have read and agreed to the published version of the manuscript.

Funding

FJ thanks the Fulbright Foundation, the Byrd Polar Climate and Research Center’s (BPCRC) Polar Meteorology Group, as well as the Brazilian National Council for Scientific and Technological Development (CNPq, grant number 305897/2022-5), for financial support. All datasets used in the study are available upon contacting FJ.

Data Availability Statement

The original contributions presented in this study are included in the article. Further inquiries can be directed to the corresponding author.

Conflicts of Interest

The authors declare no conflict of interest.

References

  1. Zhang, Z.; Wang, L.; Xue, N.; Du, Z. Spatiotemporal Analysis of Active Fires in the Arctic Region during 2001–2019 and a Fire Risk Assessment Model. Fire 2021, 4, 57. [Google Scholar] [CrossRef]
  2. Walker, X.J.; Baltzer, J.L.; Cumming, S.G.; Day, N.J.; Ebert, C.; Goetz, S.; Johnstone, J.F.; Potter, S.; Rogers, B.M.; Schuur, E.A.; et al. Increasing wildfires threaten historic carbon sink of boreal forest soils. Nature 2019, 572, 520–523. [Google Scholar] [CrossRef]
  3. Jain, P.; Castellanos-Acuña, D.; Coogan, S.; Abatzoglou, J.; Flannigan, M. Observed increases in extreme fire weather driven by atmospheric humidity and temperature. Nat. Clim. Change 2021, 12, 63–70. [Google Scholar] [CrossRef]
  4. Justino, F.; Bromwich, D.; Silva, A.; Schumacher, V.; Altoff, D.; Shang-Hang, W.; da Silva, A. Arctic Oscillation and Pacific-North American pattern dominated-modulation of fire danger and wildfire occurrence. npj Clim. Atmos. Sci. 2022, 5, 52. [Google Scholar] [CrossRef]
  5. Canadell, J.G.; Meyer, C.P.M.; Cook, G.D.; Dowdy, A.; Briggs, P.R.; Knauer, J.; Pepler, A.; Haverd, V. Multi-decadal increase of forest burned area in Australia is linked to climate change. Nat. Commun. 2021, 12, 6921. [Google Scholar] [CrossRef] [PubMed]
  6. Shi, K.; Touge, Y. Characterization of global wildfire burned area spatiotemporal patterns and underlying climatic causes. Sci. Rep. 2022, 12, 644. [Google Scholar] [CrossRef]
  7. Lian, X.; Piao, S.; Li, L.Z.X.; Li, Y.; Huntingford, C.; Ciais, P.; Cescatti, A.; Janssens, I.A.; Peñuelas, J.; Buermann, W.; et al. Summer soil drying exacerbated by earlier spring greening of northern vegetation. Sci. Adv. 2020, 6, eaax0255. [Google Scholar] [CrossRef]
  8. Sungmin, O.; Xinyuan, H.; Rene, O. Observational evidence of wildfire-promoting soil moisture anomalies. Sci. Rep. 2020, 10, 11008. [Google Scholar] [CrossRef] [PubMed]
  9. Vivoni, E.R.; Moreno, H.A.; Mascaro, G.; Rodriguez, J.C.; Watts, C.J.; Garatuza-Payan, J.; Scott, R.L. Observed relation between evapotranspiration and soil moisture in the North American monsoon region. Geophys. Res. Lett. 2008, 35, L22403. [Google Scholar] [CrossRef]
  10. Heim, R.J.; Heim, W.; Darman, G.F.; Heinken, T.; Smirenski, S.M.; Hölzel, N. Litter removal through fire—A key process for wetland vegetation and ecosystem dynamics. Sci. Total Environ. 2021, 755, 142659. [Google Scholar] [CrossRef] [PubMed]
  11. Collar, N.M.; Saxe, S.; Rust, A.J.; Hogue, T.S. A conus-scale study of wildfire and evapotranspiration: Spatial and temporal response and controlling factors. J. Hydrol. 2021, 603, 127162. [Google Scholar] [CrossRef]
  12. Justino, F.; Bromwich, D.H.; Wang, S.-H.; Altoff, D.; Schumacher, V.; Da Silva, A. Influence of local scale and oceanic teleconnections on regional fire danger and wildfire trends. Sci. Total Environ. 2023, 1, 163397. [Google Scholar] [CrossRef]
  13. Veraverbeke, S.; Rogers, B.M.; Goulden, M.L.; Jandt, R.R.; Miller, C.E.; Wiggins, E.B.; Randerson, J.T. Lightning as a major driver of recent large fire years in North American boreal forests. Nat. Clim. Change 2017, 7, 529–534. [Google Scholar] [CrossRef]
  14. da Silva, A.S.; Justino, F.; Setzer, A.W.; Avila-Diaz, A. Vegetation fire activity and the Potential Fire Index (PFIv2) performance in the last two decades (2001–2016). Int. J. Climatol. 2021, 41, E78–E92. [Google Scholar] [CrossRef]
  15. Jian, M.; Jian, Y.; Zeng, H.; Cao, D.; Cui, X. Current status and prospects of plant flammability measurements. Fire 2024, 7, 266. [Google Scholar] [CrossRef]
  16. McLauchlan, K.K.; Higuera, P.E.; Miesel, J.; Rogers, B.M.; Schweitzer, J.; Shuman, J.K.; Tepley, A.J.; Varner, J.M.; Veblen, T.T.; Adalsteinsson, S.A.; et al. Fire as a fundamental ecological process: Research advances and frontiers. J. Ecol. 2020, 108, 2047–2069. [Google Scholar] [CrossRef]
  17. Abatzoglou, J.T.; Kolden, C.A.; Balch, J.K.; Bradley, B.A. Controls on interannual variability in lightning-caused fire activity in the western, U.S. Environ. Res. Lett. 2016, 11, 045005. [Google Scholar] [CrossRef]
  18. Hersbach, H.; Bell, B.; Berrisford, P.; Hirahara, S.; Horányi, A.; Muñoz-Sabater, J.; Nicolas, J.; Peubey, C.; Radu, R.; Schepers, D.; et al. The era5 global reanalysis. Q. J. R. Meteorol. Soc. 2020, 146, 1999–2049. [Google Scholar] [CrossRef]
  19. Lavers, D.A.; Simmons, A.; Vamborg, F.; Rodwell, M.J. An evaluation of era5 precipitation for climate monitoring. Q. J. R. Meteorol. Soc. 2022, 148, 3152–3165. [Google Scholar] [CrossRef]
  20. Lei, X.; Xu, W.; Chen, S.; Yu, T.; Hu, Z.; Zhang, M.; Jiang, L.; Bao, R.; Guan, X.; Ma, M.; et al. How well does the era5 reanalysis capture the extreme climate events over china? Part i: Extreme precipitation. Front. Environ. Sci. 2022, 10, 921658. [Google Scholar] [CrossRef]
  21. Xin, Y.; Yang, Y.; Chen, X.; Yue, X.; Liu, Y.; Yin, C. Evaluation of IMERG and ERA5 precipitation products over the Mongolian Plateau. Sci. Rep. 2022, 12, 21776. [Google Scholar] [CrossRef]
  22. Quagraine, K.; Klutse, N.A.B.; Nkrumah, F.; Adukpo, D.; Owusu, K. Changes in rainfall characteristics in Wenchi and Saltpond farming areas of Ghana. Int. J. Geosci. 2017, 8, 305–317. [Google Scholar] [CrossRef]
  23. Avila-Diaz, A.; Bromwich, D.H.; Wilson, A.B.; Justino, F.; Wang, S.H. Climate extremes across the north American arctic in modern reanalyses. J. Clim. 2021, 34, 2385–2410. [Google Scholar] [CrossRef]
  24. Justino, F.; De Mélo, A.; Setzer, A.; Sismanoglu, R.; Sediyama, G.; Ribeiro, G.; Machado, J.; Sterl, A. Greenhouse gas induced changes in the fire risk in Brazil in ECHAM5/MPI-OM coupled climate model. Clim. Change 2011, 106, 285–302. [Google Scholar] [CrossRef]
  25. Giglio, L.; Schroeder, W.; Justice, C.O. The collection 6 MODIS active fire detection algorithm and fire products. Remote Sens. Environ. 2016, 178, 31–41. [Google Scholar] [CrossRef]
  26. Neves, A.K.; Pereira, J.M.; Silva, J.M.; Catarino, S.; Oliva, P.; Chuvieco, E.; Campagnolo, M.L. Active fire-based dating accuracy for landsat burned area maps is high in boreal and mediterranean biomes and low in grasslands and savannas. ISPRS J. Photogramm. Remote Sens. 2024, 209, 461–471. [Google Scholar] [CrossRef]
  27. Zhu, Y.; Rakov, V.; Tran, M.; Stock, M.; Heckman, S.; Liu, C.; Sloop, C.; Jordan, D.; Uman, M.; Caicedo, J.; et al. Evaluation of entln performance characteristics based on the ground-truth natural and rocket-triggered lightning data acquired in Florida: Evaluation of entln performance. J. Geophys. Res. Atmos. 2017, 122, 9858–9866. [Google Scholar] [CrossRef]
  28. Sonnenfeld, R.; Lapierre, J.; Contreras Vidal, L.; Zhu, Y.; Stock, M. Earth networks lightning network performance. Earth Space Sci. Open Arch. 2020, preprint. [Google Scholar] [CrossRef]
  29. Marchand, M.; Hilburn, K.; Miller, S.D. Geostationary lightning mapper and earth networks lightning detection over the contiguous united states and dependence on flash characteristics. J. Geophys. Res. Atmos. 2019, 124, 11552–11567. [Google Scholar] [CrossRef]
  30. Rodger, C.J.; Brundell, J.B.; Holzworth, R.H.; Lay, E.H. Growing detection efficiency of the world wide lightning location network. AIP Conf. Proc. 2009, 1118, 15–20. [Google Scholar] [CrossRef]
  31. Mezuman, K.; Price, C.; Galanti, E. On the spatial and temporal distribution of global thunderstorm cells. Environ. Res. Lett. 2014, 9, 124023. [Google Scholar] [CrossRef]
  32. Pérez-Invernón, F.J.; Huntrieser, H.; Soler, S.; Gordillo-Vázquez, F.J.; Pineda, N.; Navarro-González, J.; Reglero, V.; Montanyà, J.; van der Velde, O.; Koutsias, N. Lightning-ignited wildfires and long-continuing-current lightning in the mediterranean basin: Preferential meteorological conditions. Atmos. Chem. Phys. Discuss. 2021, 2021, 17529–17557. [Google Scholar] [CrossRef]
  33. Lapierre, J.L.; Laughner, J.L.; Geddes, J.A.; Koshak, W.J.; Cohen, R.C.; Pusede, S.E. Observing us regional variability in lightning no2 production rates. J. Geophys. Res. Atmos. 2020, 125, e2019JD031362. [Google Scholar] [CrossRef]
  34. Bitzer, P.M. Global distribution and properties of continuing current in lightning. J. Geophys. Res. Atmos. 2017, 122, 1033–1041. [Google Scholar] [CrossRef]
  35. Miralles, D.G.; Brutsaert, W.; Dolman, A.J.; Gash, J.H. On the use of the term “evapotranspiration”. Water Resour. Res. 2020, 56, e2020WR028055. [Google Scholar] [CrossRef] [PubMed]
  36. Hamed, K.H.; Rao, A.R. A modified mann-kendall trend test for autocorrelated data. J. Hydrol. 1998, 204, 182–196. [Google Scholar] [CrossRef]
  37. Hlinka, J.; Hartman, D.; Vejmelka, M.; Novotná, D.; Paluš, M. Non-linear dependence and teleconnections in climate data: Sources, relevance, nonstationarity. Clim. Dyn. 2014, 42, 1873–1886. [Google Scholar] [CrossRef]
  38. Kharuk, V.I.; Dvinskaya, M.L.; Im, S.T.; Golyukov, A.S.; Smith, K.T. Wildfires in the Siberian arctic. Fire 2022, 5, 106. [Google Scholar] [CrossRef]
  39. Justino, F.; Bromwich, D.; Wilson, A.; Silva, A.; Avila-Diaz, A.; Fernandez, A.; Rodrigues, J. Estimates of temporal-spatial variability of wildfire danger across the Pan-Arctic and extra-tropics. Environ. Res. Lett. 2021, 16, 044060. [Google Scholar] [CrossRef]
  40. Hanes, C.; Wotton, M.; Woolford, D.G.; Martell, D.L.; Flannigan, M. Preceding fall drought conditions and overwinter precipitation effects on spring wildland fire activity in Canada. Fire 2020, 3, 24. [Google Scholar] [CrossRef]
  41. Westerling, A.L. Increasing western us forest wildfire activity: Sensitivity to changes in the timing of spring. Philos. Trans. R. Soc. B Biol. Sci. 2016, 371, 20150178. [Google Scholar] [CrossRef]
  42. Shen, Q.; Liu, L.; Zhao, W.; Yang, J.; Han, X.; Tian, F.; Wu, J. Relationship of surface soil moisture with solar-induced chlorophyll fluorescence and normalized difference vegetation index in different phenological stages: A case study of Northeast China. Environ. Res. Lett. 2021, 16, 024039. [Google Scholar] [CrossRef]
  43. L’HEureux, M.L.; Kumar, A.; Bell, G.D.; Halpert, M.S.; Higgins, R.W. Role of the pacific-north American (pna) pattern in the 2007 arctic sea ice decline. Geophys. Res. Lett. 2008, 35, L20701. [Google Scholar] [CrossRef]
  44. Benson, D.O.; Dirmeyer, P.A. Characterizing the Relationship between Temperature and Soil Moisture Extremes and Their Role in the Exacerbation of Heat Waves over the Contiguous United States. J. Clim. 2021, 34, 2175–2187. [Google Scholar] [CrossRef]
  45. Walsh, J.E.; Brettschneider, B. Attribution of recent warming in Alaska. Polar Sci. 2019, 21, 101–109. [Google Scholar] [CrossRef]
  46. Shi, S.; Wang, P.; Yu, J. Vegetation greening and climate change promote an increase in evapotranspiration across Siberia. J. Hydrol. 2022, 610, 127965. [Google Scholar] [CrossRef]
  47. Libonati, R.; Geirinhas, J.L.; Silva, P.S.; Russo, A.; Rodrigues, J.A.; Belém, L.B.; Nogueira, J.; Roque, F.O.; DaCamara, C.C.; Nunes, A.M.; et al. Assessing the role of compound drought and heatwave events on unprecedented 2020 wildfires in the pantanal. Environ. Res. Lett. 2022, 17, 015005. [Google Scholar] [CrossRef]
  48. Braganza, K.; Karoly, D.J.; Arblaster, J.M. Diurnal temperature range as an index of global climate change during the twentieth century. Geophys. Res. Lett. 2004, 31, L13217. [Google Scholar] [CrossRef]
  49. Adekanmbi, A.A.; Sizmur, T. Importance of diurnal temperature range (DTR) for predicting the temperature sensitivity of soil respiration. Front. Soil Sci. 2022, 2, 969077. [Google Scholar] [CrossRef]
  50. Tye, M.R.; Dagon, K.; Molina, M.J.; Richter, J.H.; Visioni, D.; Kravitz, B.; Tilmes, S. Indices of extremes: Geographic patterns of change in extremes and associated vegetation impacts under climate intervention. Earth Syst. Dyn. 2022, 13, 1233–1257. [Google Scholar] [CrossRef]
  51. Dong, Z.; Hu, H.; Wei, Z.; Liu, Y.; Xu, H.; Yan, H.; Chen, L.; Li, H.; Khan, M.Y.A. Estimating the actual evapotranspiration of different vegetation types based on root distribution functions. Front. Earth Sci. 2022, 10, 893388. [Google Scholar] [CrossRef]
  52. Koster, R.D.; Dirmeyer, P.A.; Guo, Z.; Bonan, G.; Chan, E.; Cox, P.; Gordon, C.T.; Kanae, S.; Kowalczyk, E.; Lawrence, D.; et al. Regions of strong coupling between soil moisture and precipitation. Science 2004, 305, 1138–1140. [Google Scholar] [CrossRef] [PubMed]
  53. Seneviratne, S.I.; Corti, T.; Davin, E.L.; Hirschi, M.; Jaeger, E.B.; Lehner, I.; Teuling, A.J. Investigating soil moisture–climate interactions. Earth-Sci. Rev. 2010, 99, 125–161. [Google Scholar] [CrossRef]
  54. Lawrence, D.M.; Thornton, P.E.; Oleson, K.W.; Bonan, G.B. Partitioning of evaporation in a gcm. J. Hydrometeorol. 2007, 8, 862–880. [Google Scholar] [CrossRef]
  55. Zhang, K.; Kimball, J.S.; Nemani, R.R.; Running, S.W.; Hong, S.; Gourley, J.; Yu, Z. Vegetation greening and climate change promote multidecadal rises of global land evapotranspiration. Sci. Rep. 2015, 5, 15956. [Google Scholar] [CrossRef]
  56. Swenson, S.C.; Lawrence, D.M.; Lee, H. Improved simulation of the seasonal cycle of Northern Hemisphere land water storage with the Community Land Model. Geophys. Res. Lett. 2012, 39, L20404. [Google Scholar]
  57. Liu, W.; Zhang, Q.; Li, C.; Xiao, W. Granger causality for soil moisture–evaporation. Hydrol. Earth Syst. Sci. 2017, 21, 819–831. [Google Scholar]
  58. Miralles, D.G.; van Den Berg, M.J.; Teuling, A.J.; de Jeu, R.A.M. Soil moisture-temperature coupling. Nat. Clim. Change 2019, 9, 1–10. [Google Scholar]
  59. Berg, A.; Sheffield, J. Soil moisture–evapotranspiration coupling in cmip5 models: Relationship with simulated climate and projections. J. Clim. 2018, 31, 4865–4878. [Google Scholar] [CrossRef]
  60. Western, A.W.; Zhou, S.L.; Grayson, R.B.; McMahon, T.A.; Blöschl, G.; Wilson, D.J. Spatial correlation of soil moisture in small catchments and its relationship to dominant spatial hydrological processes. J. Hydrol. 2004, 286, 113–134. [Google Scholar] [CrossRef]
  61. Martens, B.; Miralles, D.G.; Lievens, H.; van der Schalie, R.; de Jeu, R.A.M.; Fernández-Prieto, D.; Beck, H.E.; Dorigo, W.A.; Verhoest, N.E.C. Gleam v3: Satellite-based land evaporation and root-zone soil moisture. Geosci. Model Dev. 2017, 10, 1903–1925. [Google Scholar] [CrossRef]
  62. McEvoy, D.J.; Pierce, D.W.; Kalansky, J.F.; Cayan, D.R.; Abatzoglou, J.T. Projected Changes in Reference Evapotranspiration in California and Nevada: Implications for Drought and Wildland Fire Danger. Earth’s Future 2020, 8, e2020EF001736. [Google Scholar] [CrossRef]
  63. Löw, F.; Fliemann, E.; Abdullaev, I.; Conrad, C.; Lamers, J.P. Mapping abandoned agricultural land in Kyzyl-Orda, Kazakhstan using satellite remote sensing. Appl. Geogr. 2015, 62, 377–390. [Google Scholar] [CrossRef]
  64. Wilcove, D.S.; Giam, X.; Edwards, D.P.; Fisher, B.; Koh, L.P. Navjot’s nightmare revisited: Logging, agriculture, and biodiversity in southeast Asia. Trends Ecol. Evol. 2013, 28, 531–540. [Google Scholar] [CrossRef]
  65. Campbell, J.E.; Lobell, D.B.; Genova, R.C.; Field, C.B. The global potential of bioenergy on abandoned agriculture lands. Environ. Sci. Technol. 2008, 42, 5791–5794. [Google Scholar] [CrossRef] [PubMed]
  66. Macander, M.J.; Nelson, P.R.; Nawrocki, T.W.; Frost, G.V.; Orndahl, K.M.; Palm, E.C.; Wells, A.F.; Goetz, S.J. Time-series maps reveal widespread change in plant functional type cover across arctic and boreal Alaska and Yukon. Environ. Res. Lett. 2022, 17, 054042. [Google Scholar] [CrossRef]
  67. Krause, A.; Kloster, S.; Wilkenskjeld, S.; Paeth, H. The sensitivity of global wildfires to simulated past, present, and future lightning frequency. J. Geophys. Res. Biogeosci. 2014, 119, 312–322. [Google Scholar] [CrossRef]
  68. Knorr, W.; Kaminski, T.; Arneth, A.; Weber, U. Impact of human population density on fire frequency at the global scale. Biogeosciences 2014, 11, 1085–1102. [Google Scholar] [CrossRef]
  69. Schumacher, V.; Setzer, A.; Saba, M.M.; Naccarato, K.P.; Mattos, E.; Justino, F. Characteristics of lightning-caused wildfires in central brazil in relation to cloud-ground and dry lightning. Agric. For. Meteorol. 2022, 312, 108723. [Google Scholar] [CrossRef]
  70. Chen, Y.; Romps, D.; Seeley, J.; Veraverbeke, S.; Riley, W.; Mekonnen, Z.; Randerson, J. Future increases in arctic lightning and fire risk for permafrost carbon. Nat. Clim. Change 2021, 11, 404–410. [Google Scholar] [CrossRef]
  71. Kaplan, J.O.; Lau, K.H.K. The WWLLN Global Lightning Climatology and Timeseries (WGLC). In This Version the Data for Lightning Stroke Density Have Been Updated to Correctly Reflect the Units in the File Metadata (Strokes km-2 Day-1). 2021. Available online: https://zenodo.org/records/4882792 (accessed on 18 February 2022).
  72. Kaplan, J.O.; Lau, K.H.K. The WGLC global gridded lightning climatology and time series. Earth Syst. Sci. Data 2021, 13, 3219–3237. [Google Scholar] [CrossRef]
  73. Pielke, S.; Roger, A. Influence of the spatial distribution of vegetation and soils on the prediction of cumulus convective rainfall. Rev. Geophys. 2001, 39, 151–177. [Google Scholar] [CrossRef]
  74. Abatzoglou, J.T.; Balch, J.K.; Bradley, B.A.; Kolden, C.A. Human-related ignitions concurrent with high winds promote large fires across the USA. Int. J. Wildland Fire 2018, 27, 377–386. [Google Scholar] [CrossRef]
  75. Kukavskaya, E.A.; Soja, A.J.; Petkov, A.P.; Ponomarev, E.I.; Ivanova, G.A.; Conard, S.G. Fire emissions estimates in Siberia: Evaluation of combustion completeness. Can. J. For. Res. 2013, 43, 493–506. [Google Scholar] [CrossRef]
  76. Andela, N.; Morton, D.C.; Giglio, L.; Chen, Y.; van der Werf, G.R.; Kasibhatla, P.S.; DeFries, R.S.; Collatz, G.J.; Hantson, S.; Kloster, S.; et al. A human-driven decline in global burned area. Science 2017, 356, 1356–1362. [Google Scholar] [CrossRef] [PubMed]
  77. Schierhorn, F.; Müller, D.; Beringer, T.; Prishchepov, A.V.; Kuemmerle, T.; Balmann, A. Post-soviet cropland abandonment and carbon sequestration in European Russia, Ukraine, and Belarus. Glob. Biogeochem. Cycles 2013, 27, 1175–1185. [Google Scholar] [CrossRef]
  78. Alcantara, C.; Kuemmerle, T.; Baumann, M.; Bragina, E.V.; Griffiths, P.; Hostert, P.; Knorn, J.; Müller, D.; Prishchepov, A.V.; Schierhorn, F.; et al. Mapping the extent of abandoned farmland in Central and Eastern Europe using MODIS time series satellite data. Environ. Res. Lett. 2013, 8, 035035. [Google Scholar] [CrossRef]
  79. Dinerstein, E.; Olson, D.; Joshi, A.; Vynne, C.; Burgess, N.D.; Wikramanayake, E.; Hahn, N.; Palminteri, S.; Hedao, P.; Noss, R.; et al. An Ecoregion-Based Approach to Protecting Half the Terrestrial Realm. BioScience 2017, 67, 534–545. [Google Scholar] [CrossRef]
Figure 1. Zonal anomalies of annual maximum number of days with precipitation lower than 1mm/day in 1980–2020. (a) CDD, (b) averaged days of droughts (DD), and (c) is the same as (a) but for number of heat waves (HW). See text for details. (d) CDD differences between 2000–2020 and 1980–2000. (e) and (f) are the same as (d) but for DD and HW, respectively.
Fire 08 00282 g001
Figure 2. Heat map distribution as shown in percentage with respect to averaged conditions during 2001–2020, for diurnal temperature range (DTR) in (a) North America, (e) Europe, and (i) Asia. Maximum amount of rainfall in five consecutive days (Rx5day) in (b) North America, (f) Europe, and (j) Asia. Panels (c,d,g,h,k,l) show the monthly anomalies of satellite-detected fires and burned areas. (m,n) show trends of DTR (°C decade−1) and Rx5day (mm decade−1). Gray areas are not statistically significant at the 95% level. Green boxes highlight persistent DTR/Rx5day, fire, and burned areas anomalies.
Fire 08 00282 g002
Figure 3. ((a), m3/m3) shows March-October averaged soil moisture, ((b), mm) shows the mean monthly accumulated evaporation, and (c) shows March-October averaged PFI. Correlations between SM and Ea are shown in (d), correlations between PFI and Ea are shown in (e), and correlations between SM and PFI are displayed in (f). Dotted regions are significant at 95% level.
Fire 08 00282 g003
Figure 4. Deseasonalized standard deviation distribution for SM ((a), m3/m3), for Ea ((b), mm), and for the PFI (c). (df) show the standardized modified Mann-Kendall trends for SM (d), for Ea (e), and for PFI (f). (df) red and blue regions are significant at 95% level.
Fire 08 00282 g004
Figure 5. Accumulated lightning density (lightning km−2) during the 2010–2020 interval (a,b). (c,d) are the same as (a,b) but for satellite-detected fires. (e,f) show regions exceeding the 95th percentile of CAPE (J Kg−1). Note that the upper limit of label bars does not reach the maximum values. Plots aim to represent the dominant regions. (g,h) show the annual and monthly pixels distribution across North America of fire and lightning and the number of pixels when they occur concomitantly. (i,j) is the same as (g,h) but for Eurasia.
Fire 08 00282 g005
Figure 6. (a) Vegetation distribution between 40 and 80° N according to ecoregions https://ecoregions.appspot.com/ (accessed on 9 July 2025): BFT-boreal Forests/Taiga, TCF-temperate conifer forests, FGS-flooded grasslands & savannas, TBMF-temperate broadleaf & mixed forests, TGSS-temperate grasslands, savannas & shrublands, MFWS-mediterranean forests, woodlands scrub, DXS-deserts xeric shrublands, Tun-tundra. (be) shows the percentage of fires/lightning within the biome.
Fire 08 00282 g006
Disclaimer/Publisher’s Note: The statements, opinions and data contained in all publications are solely those of the individual author(s) and contributor(s) and not of MDPI and/or the editor(s). MDPI and/or the editor(s) disclaim responsibility for any injury to people or property resulting from any ideas, methods, instructions or products referred to in the content.

