Article

Pyrolysis Kinetics and Gas Evolution of Flame-Retardant PVC and PE: A TG-FTIR-GC/MS Study

1
State Key Laboratory of Fire Science, University of Science and Technology of China, Hefei 230026, China
2
Forensic Science Institute, China People’s Police University, Langfang 065000, China
*
Authors to whom correspondence should be addressed.
Fire 2025, 8(7), 262; https://doi.org/10.3390/fire8070262
Submission received: 26 May 2025 / Revised: 17 June 2025 / Accepted: 20 June 2025 / Published: 30 June 2025

Abstract

The insulation layer of flame-retardant cables plays a critical role in mitigating fire hazards by influencing toxic gas emissions and the accuracy of fire modeling. This study systematically explores the pyrolysis kinetics and volatile gas evolution of flame-retardant polyvinyl chloride (PVC) and polyethylene (PE) insulation materials using advanced TG-FTIR-GC/MS techniques. Distinct pyrolysis stages were identified through thermogravimetric analysis (TGA) at heating rates of 10–40 K/min, while the KAS model-free method and Málek fitting function quantified activation energies and reaction mechanisms. Results revealed that flame-retardant PVC undergoes two major stages: (1) dehydrochlorination, characterized by the rapid release of HCl and low activation energy, and (2) main-chain scission, producing aromatic compounds that contribute to fire toxicity. In contrast, flame-retardant PE demonstrates a more stable pyrolysis process dominated by random chain scission and the formation of a dense char layer, significantly enhancing its flame-retardant performance. FTIR and GC/MS analyses further highlighted distinct gas evolution behaviors: PVC primarily generates HCl and aromatic hydrocarbons, whereas PE releases olefins and alkanes with significantly lower toxicity. Additionally, the application of a classification and regression tree (CART) model accurately predicted mass loss behavior under various heating rates, achieving exceptional fitting accuracy (R2 > 0.98). This study provides critical insights into the pyrolysis mechanisms of flame-retardant cable insulation and offers a robust data framework for optimizing fire modeling and improving material design.

1. Introduction

Electrical fires caused by cable combustion are a leading source of casualties and property loss globally, accounting for approximately 30% of all fire incidents. More than half of these fires are directly linked to the ignition of cable insulation materials [1,2]. For instance, a fire in Lüliang City, Shanxi Province, on 7 May 2023, caused by insulation failure in a cable duct, released high heat and toxic gases, resulting in five fatalities. To mitigate such risks, China has implemented the national standard General Rules for Flame Retardant and Fire-Resistant Wires and Cables (GB/T19666-2019) [3], which specifies classifications for flame-retardant performance. Among available materials, cables insulated with flame-retardant polyvinyl chloride (PVC) and polyethylene (PE) dominate the market due to their cost-effectiveness and improved safety [4,5]. Despite their flame-retardant properties, PVC and PE insulation materials release hazardous substances such as HCl, CO2, benzene, and other volatile organic compounds during pyrolysis at high temperatures. These emissions not only increase fire toxicity and the risk of secondary hazards but also complicate firefighting efforts [6,7]. Therefore, understanding the pyrolysis and gas evolution behavior of flame-retardant PVC and PE is crucial for accurately quantifying kinetic parameters in fire modeling, guiding the design of safer insulation materials, and supporting fire risk assessment and prevention strategies.
Pyrolysis, as the initial step of all thermochemical reactions, describes the decomposition of materials into solid, liquid, and gaseous products in an inert environment [8]. For cables, the insulation layer and outer sheath are the primary combustible components during a fire, and their pyrolysis behavior not only governs the early stages of combustion but also directly influences the rate of fire spread and the release of toxic gases. For PVC insulation, Benes et al. [9] used thermogravimetric analysis (TGA) to show that its pyrolysis process occurs in two major stages: the first stage (473–613 K) primarily involves HCl elimination, while the second stage entails molecular chain scission and carbonization. Wang et al. [10] further quantified the activation energies for the two stages, reporting 122.0 kJ/mol and 247.7 kJ/mol, respectively, indicating that HCl removal requires less energy compared to the more energy-intensive main chain degradation. Using TG-FTIR, Wang et al. [11] identified the key volatile products of PVC pyrolysis, including HCl, CO2, and compounds corresponding to the characteristic vibrations of C–H and C–Cl bonds, reflecting the progressive decomposition stages of PVC. Moreover, Zhou et al. [12] employed TG-FTIR coupled with Py-GC/MS to systematically investigate the rapid pyrolysis of PVC. Their findings revealed two primary stages: the HCl removal phase (289–409 K) and the subsequent backbone degradation phase (409–543 K), which generates aromatic compounds and halogenated hydrocarbons. Notably, aromatic compounds accounted for 76.79–81.81% of the volatile products, followed by HCl. Liu et al. [13] extended this research using TG-FTIR-MS to study catalytic pyrolysis and found that the presence of catalysts significantly accelerated HCl elimination and enhanced the formation of aromatic compounds, highlighting a synergistic relationship between dehydrochlorination and aromatization during pyrolysis. Deng et al. [14] demonstrated that PVC subjected to overloading exhibited increased pyrolysis onset temperatures and activation energies, resulting in enhanced thermal stability. However, compared to new PVC insulation, overloaded PVC released higher amounts of volatile organic compounds and CO2 during pyrolysis, exacerbating fire risks. Zou et al. [15] investigated the pyrolysis of PVC and CaCO3-based cable sheathing materials using TG-DSC-MS and XPS, reporting that CaCO3 effectively absorbed HCl, forming CaCl2 and CO2, thereby reducing the toxic effects of HCl emissions. These studies highlight the significant influence of environmental conditions, aging, and catalysts on the stage-specific pyrolysis behavior and gas evolution characteristics of PVC. They provide critical insights for optimizing its thermal stability and minimizing toxic emissions. Lin et al. [4] investigated the pyrolysis gas evolution characteristics of both new and overload-aged insulation materials. Their results showed that electrical overloading significantly altered the initial pyrolysis temperature, apparent activation energy, reaction mechanism, and gas evolution behavior of the insulation.
The pyrolysis behavior of PE insulation differs significantly from that of PVC due to its chlorine-free chemical structure, with alkanes and alkenes as the primary volatile products. PE generally exhibits a higher pyrolysis onset temperature compared to PVC. Liu et al. [13], using TG-FTIR-MS, systematically investigated the pyrolysis of PE and found that it primarily undergoes random chain scission between 350 and 550 K, producing light hydrocarbons such as alkanes and alkenes, with the maximum decomposition rate occurring at 513 K. Their study further demonstrated that the introduction of catalysts can accelerate the formation of alkenes and optimize the distribution of volatile products. Encinar et al. [16] explored the pyrolysis of PE under isothermal and non-isothermal conditions, revealing that its primary products are waxes and hydrocarbon gases, accompanied by a small amount of char, indicating a distinct chain-reaction mechanism. Additionally, Xu et al. [17] highlighted that under high heating rates, the onset, peak, and final temperatures of PE shift to higher ranges. Despite these shifts, alkanes and alkenes remain the dominant volatile products, and the nonlinear effects of chain scission become more pronounced. Aging and external environmental factors also significantly affect PE’s pyrolysis behavior. Lin et al. [18] studied the pyrolysis gas evolution characteristics of flame-retardant and non-flame-retardant PVC insulation. The results showed that the flame-retardant insulation released less HCl gas, while the non-flame-retardant insulation emitted a greater amount of CO2. Sugimoto et al. [19] analyzed the chemical structural changes of XLPE insulation under radiation and thermal aging using FTIR, identifying carboxylic acids as the main oxidation products, with their relative yield increasing at elevated temperatures. Wan et al. [20] investigated the pyrolysis characteristics of XLPE cables under overheating conditions and found that high temperatures cause the release of various gases, including ethylene (C2H4), propylene (C3H6), and other alkanes and alkenes. These emissions reflect the combined effects of main chain scission and degradation of the crosslinked structure. Kong et al. [21], through ReaxFF molecular dynamics simulations and TG-MS experiments, elucidated the formation mechanisms of gaseous products such as H2, CH4, and C2H4 during the pyrolysis of XLPE. Their work provides a theoretical framework at the microscopic level for understanding the pyrolysis pathways of PE insulation materials.
Despite extensive studies on the pyrolysis behavior and gas release characteristics of PVC and PE insulation materials, several gaps remain:
  • Existing research primarily focuses on conventional PVC and PE materials, with limited investigation into the pyrolysis behavior and volatile product release patterns of flame-retardant PVC and PE. In particular, there is a lack of systematic analysis of gas evolution at different pyrolysis stages.
  • Current studies predominantly rely on single techniques such as TG or TG-FTIR. While these methods effectively analyze mass loss trends and some volatile product characteristics, they fall short in accurately identifying and quantifying complex gaseous products.
In summary, this study systematically investigated the pyrolysis and gas evolution behavior of flame-retardant PVC and PE insulation materials under a nitrogen atmosphere using TG-FTIR-GC/MS. Experiments were conducted at various heating rates (10–40 K/min) to comprehensively characterize the pyrolysis process, obtain key kinetic parameters, and analyze gas release properties. Additionally, the Classification and Regression Tree (CART) model was employed to predict and analyze the pyrolysis behavior. The findings provide valuable insights for accurately quantifying key kinetic parameters in fire modeling, offer a scientific basis for the modification and design of cable insulation materials, and support advancements in fire hazard assessment and fire prevention strategies.

2. Materials and Methods

2.1. Materials

The materials used in this study were widely utilized flame-retardant cables, including copper-core low-smoke halogen-free flame-retardant irradiated cross-linked polyethylene (PE) insulated cables (model: WDZR-BVR) and flame-retardant copper-core polyvinyl chloride (PVC) insulated flexible cables (model: ZR-BVR). These cables are 19-core flame-retardant wires with an outer diameter of 4.1 mm and an insulation thickness of 0.8 mm, meeting the technical specifications outlined in the national standard General Rules for Flame-Retardant and Fire-Resistant Wires and Cables (GB/T19666-2019) [3]. The PVC insulation achieves flame retardancy through the addition of antimony trioxide (Sb2O3) and a small amount of phosphate-based synergists. Sb2O3 reacts with HCl released during decomposition to form stable compounds such as SbOCl, thereby effectively suppressing smoke and inhibiting flame propagation [22]. In contrast, the PE insulation adopts a halogen-free formulation consisting primarily of magnesium hydroxide (Mg(OH)2) and aluminum hydroxide (Al(OH)3) as inorganic flame-retardant fillers, which decompose endothermically to release water vapor and dilute combustible gases. This is further enhanced by irradiated cross-linking technology, which promotes molecular networking and helps form a dense carbonaceous char layer, significantly improving thermal stability and flame resistance. These two types of flame-retardant cables are widely used in residential and commercial buildings due to their reliable fire performance and ability to mitigate fire risks.

2.2. TG-FTIR-GC/MS Tests

Figure 1 illustrates the experimental workflow. First, the PVC and PE insulation layers were separated from the cable cores and ground uniformly using a 0.2 mm grinder. The powdered samples were then dried in an oven at 373 K for 24 h to remove moisture, ensuring the stability and consistency of the experimental results. The dried samples were stored in sealed bags until use.
To ensure data reliability, all thermal experiments were performed in triplicate, and the results were averaged. The standard deviation of mass loss data in TG curves was less than 2.5%, indicating high repeatability.
During each TG run, approximately 6 ± 0.2 mg of the sample was placed in an alumina crucible, weighed precisely using a built-in TG balance, and heated under a nitrogen atmosphere (flow rate: 100 mL/min). The heating rates were set to 10, 20, 30, and 40 K/min, covering a temperature range of 308–1273 K. The TG system monitored the mass loss of the sample in real-time, while the generated pyrolysis gases were transported to FTIR and GC–MS for further analysis.
To prevent condensation or loss of volatile products, all gas transfer lines were maintained at 500 K. Pyrolysis gases generated by TG were directed into the FTIR gas cell at a flow rate of 200 mL/min. The gas cell was also kept at 500 K to facilitate real-time monitoring of the main gas components and their evolution. The FTIR spectrometer operated at a scanning frequency of 20 scans per minute, with a spectral range of 4000–450 cm−1 and a resolution of 8 cm−1. Throughout the pyrolysis process, interferograms were continuously recorded to produce absorption spectra and time-resolved profiles of the gas components. The FTIR system was primarily used to detect functional group information in the volatile gases.
In addition, pyrolysis gases were directed at specific temperature points into the GC–MS system using helium as the carrier gas (flow rate: 50 mL/min, 99.99% purity) for more precise separation and qualitative analysis. In the GC system, a DP-5 capillary column was used to separate the complex volatile components generated during pyrolysis. The GC oven operated in a programmed heating mode, with an initial temperature of 308 K, ramped at 5 K/min to 428 K, held for 180 s, then ramped at 15 K/min to 558 K, and held at this temperature for 300 s. A split ratio of 1:10 was applied to ensure stable column flow. The separated gas components were subsequently introduced into the MS for detection. The MS operated in electron ionization mode, with an ionization energy of 70 eV and a mass scan range of 30–550 m/z. Using the NIST spectral database and the relevant literature, the gas products were identified and quantified with high precision.

2.3. Kinetic Methods

The pyrolysis kinetics were evaluated using the kinetic triplet (Eα, f(α) and A). Eα represents the minimum energy required for the reaction, reflecting the difficulty of the chemical process. As shown in Equation (1), f(α) denotes the decomposition expression for solid materials:
d α d t = K T f α
In this equation, α represents the conversion rate, and K(T) is the pyrolysis kinetic constant. According to the recommendations of the International Confederation for Thermal Analysis and Calorimetry (ICTAC) Kinetics Committee for calculating kinetics from thermal analysis data, α and K(T) can be expressed as:
α = m 0 m m 0 m end
K T = A   e x p E α R T
Here, m0, m and mend represent the initial mass, real-time mass, and final mass of the sample, respectively. A is the pre-exponential factor, R is the universal gas constant, and T is the reaction temperature (K). These kinetic triplets can be determined through non-isothermal TG experiments.

2.3.1. Model-Free Methods

The model-free method is a standard approach for estimating the activation energy of materials without assuming or specifying a reaction model. In this study, the widely used model-free method, Kissinger–Akahira–Sunose (KAS), was employed as follows [23]:
ln β T α 2 = ln A α R E α g α E α R T α
where α = (m0mt)/(m0mfinal) is the pyrolysis conversion rate, Tα is the reaction temperature, Aα represents the pre-exponential factor, Eα is the activation energy, R is the universal gas constant (8.314 J mol−1 K−1), and β = dT/dt is the heating rate. g(α) is the integral form of the reaction mechanism, which can be expressed as:
g α = 0 α d α f α = A α β T 0 T exp E α R T d T

2.3.2. Model-Fitting Methods

The reaction mechanism can be determined using the Málek method [24], expressed as:
Y α = Z α Z 0.5 = f α g α f 0.5 g 0.5 = T α T 0.5 2 d α / d t α d α / d t 0.5
Here, /dt and T0.5 represent the conversion rate and the temperature at a conversion of 0.5, respectively. The left side of the equation corresponds to the general characteristic profiles of various reaction mechanisms, as shown in Table 1. The right side is related to the pyrolysis rate, which can be derived from experimental data, requiring the generation of curves for all heating rates. By comparing the consistency between theoretical and experimental results, the most suitable model for the pyrolysis of the sample is selected.

2.3.3. Classification and Regression Tree

The Classification and Regression Tree (CART) method is a fundamental approach for both classification and regression tasks. It automatically selects relevant auxiliary variables from the provided dataset and integrates them with continuous and categorical data for analysis [25]. By simulating data at different heating rates, CART is utilized to calculate reaction kinetic parameters, facilitating the description and prediction of reaction processes [26]. In this study, CART was applied to predict the thermal mass loss behavior of flame-retardant PVC and PE insulation materials.

3. Results and Discussion

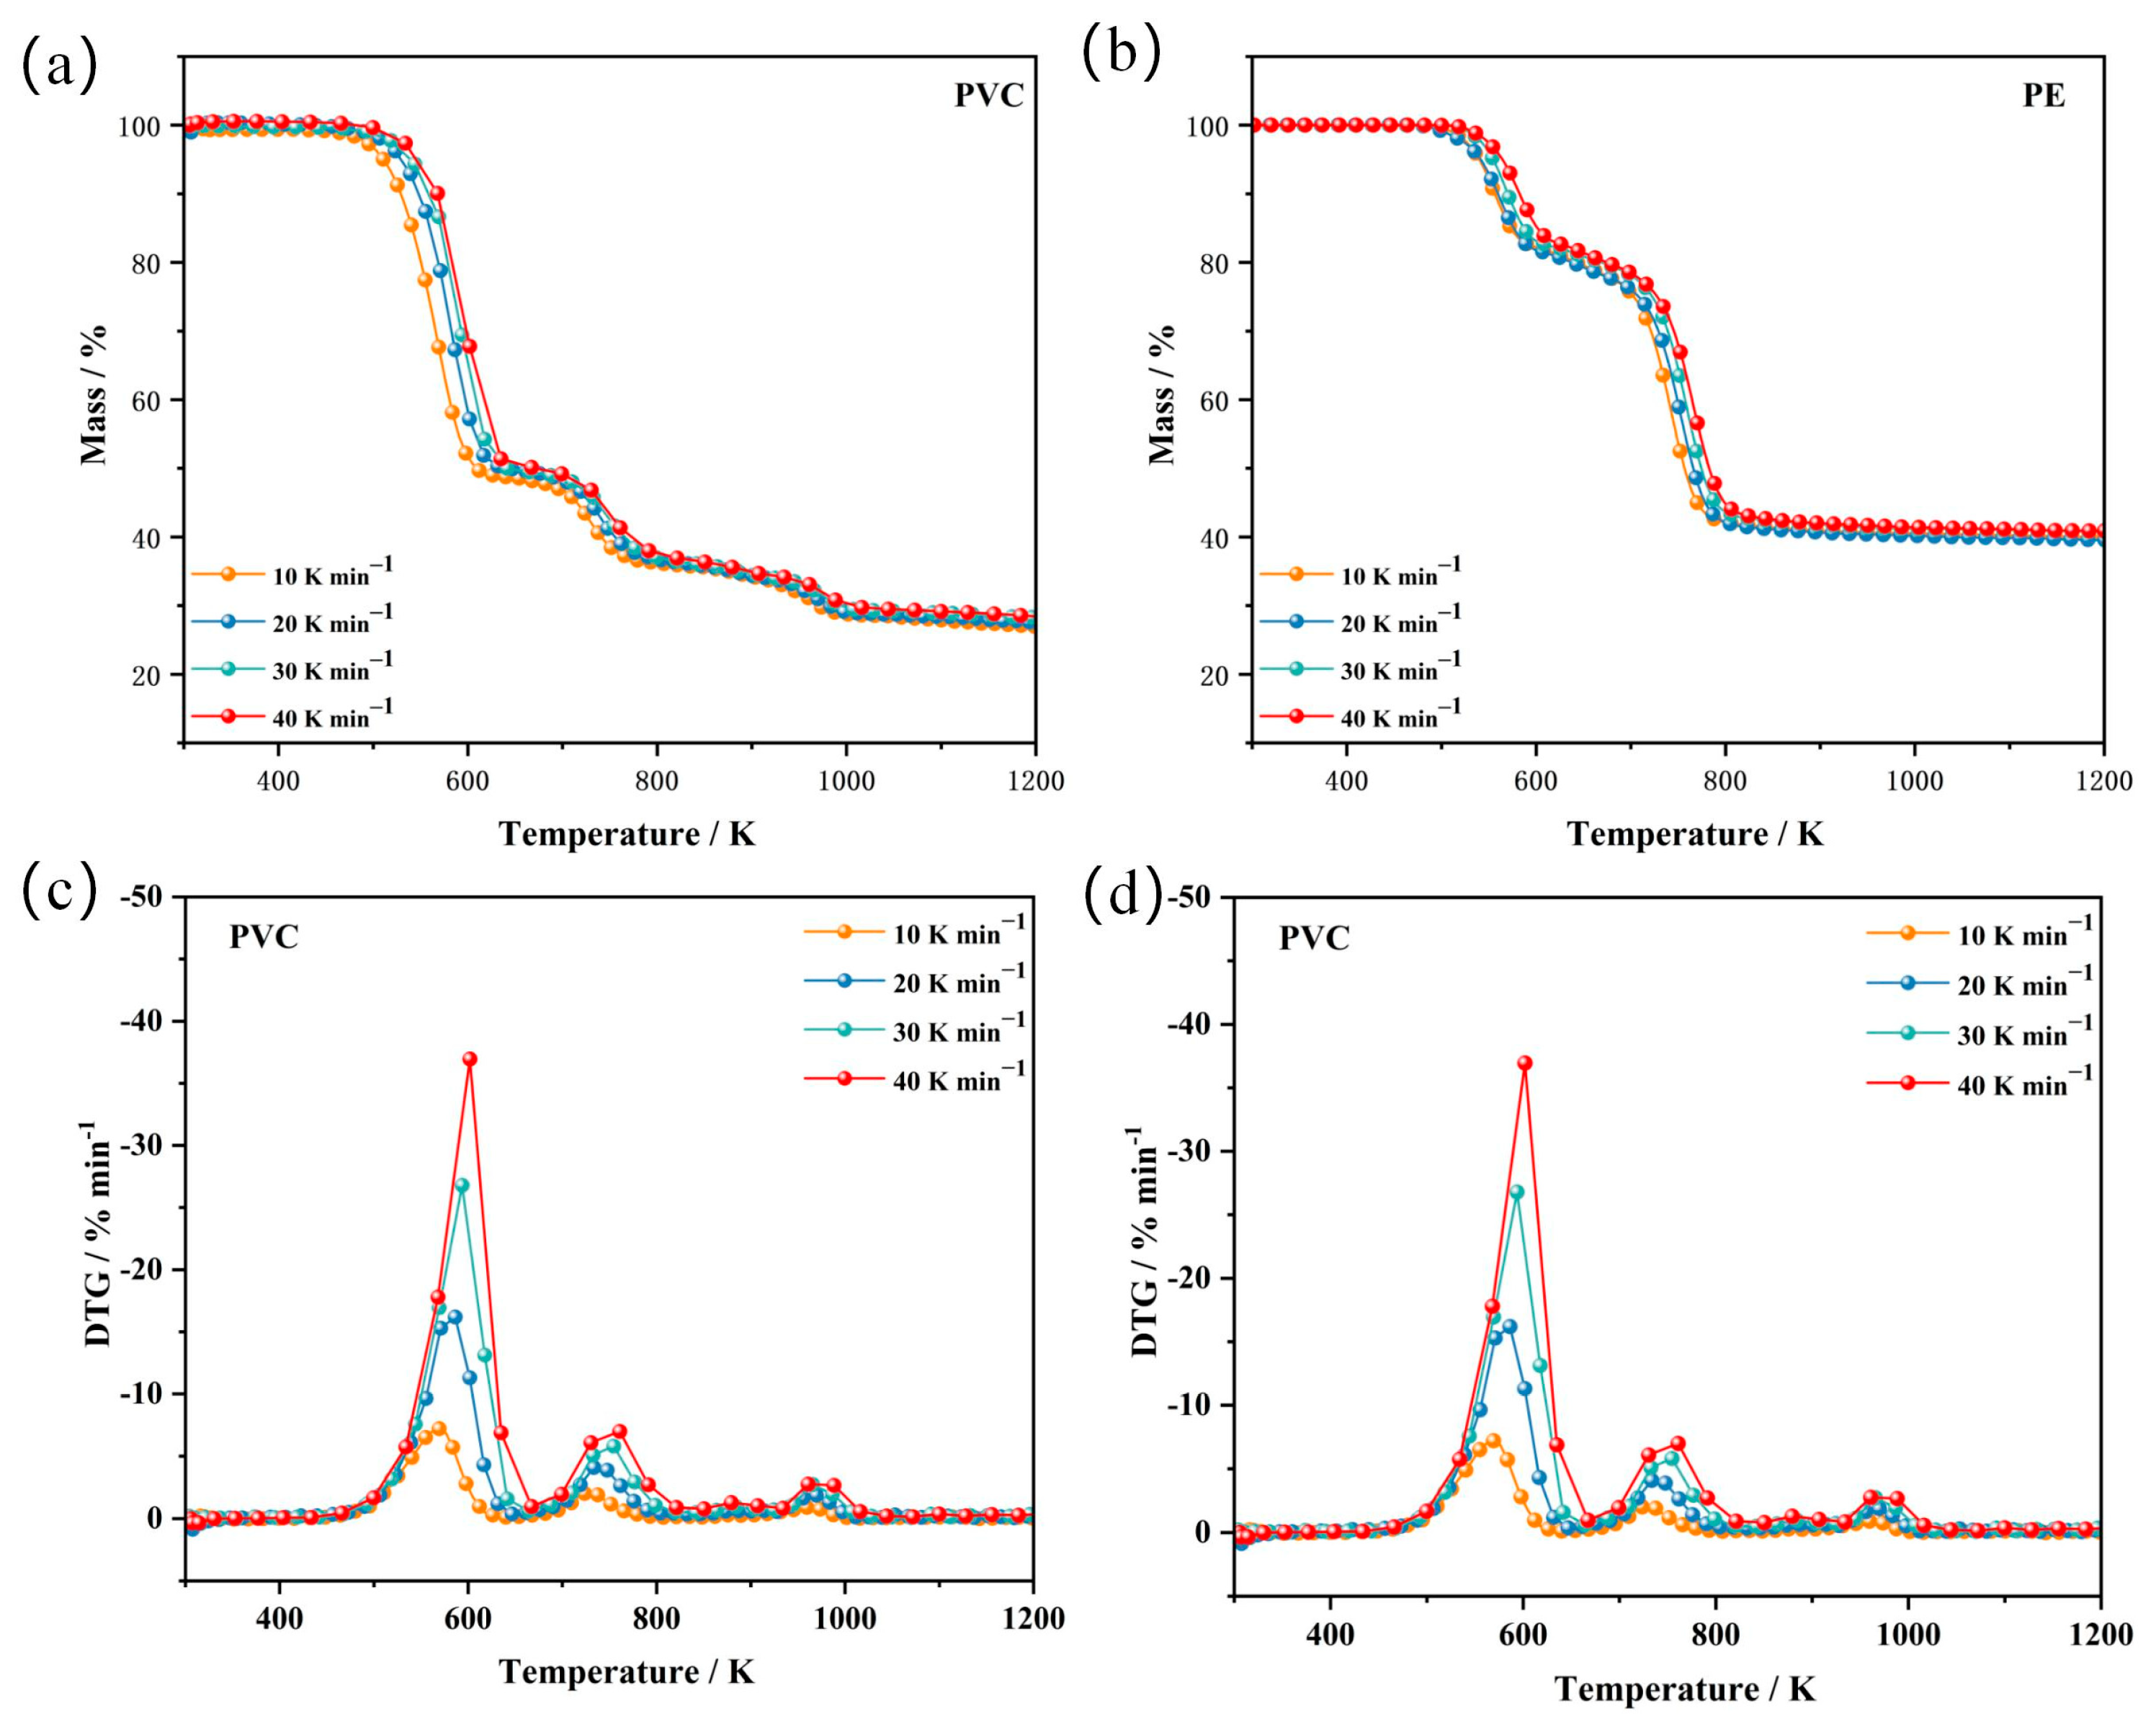
3.1. Thermogravimetric Analysis

The mass loss (TG) and mass loss rate (DTG) curves of flame-retardant PVC and PE insulation materials at different heating rates are shown in Figure 2, with the key pyrolysis parameters summarized in Table 2.
In this study, the onset temperature (Tonset) was determined by the intersection of the TG baseline and the tangent at the steepest slope before major weight loss. Peak temperatures (DTGpeak1 and DTGpeak2) correspond to the local maxima on the DTG curve. This widely used method ensures both accuracy and reproducibility in thermal analysis. Previous studies on the pyrolysis of non-flame-retardant PVC insulation have shown that the thermal degradation process typically occurs in two or three stages 8915. In contrast, this study reveals that flame-retardant PVC undergoes three distinct stages of pyrolysis, with the first two being the most critical, as illustrated in Figure 2a,c. The first stage occurs between 470 and 650 K, where the TG curve shows noticeable mass loss, and the DTG curve exhibits the first peak rate (DTGpeak1) within the range of 569.18–601.78 K. This stage primarily involves the dehydrochlorination of PVC’s molecular chains, releasing HCl. As the heating rate increases, the initial decomposition temperature (Tonset) rises from 480.03 K (10 K/min) to 502.42 K (40 K/min). The flame retardant Sb2O3 catalyzes the removal of HCl during this stage, promoting the formation of flame-retardant gases and effectively delaying combustion reactions [22]. The second stage, occurring between 680 and 800 K, corresponds to the breakdown of the polymer backbone and carbonization. The TG curve indicates noticeable mass loss, with the DTG curve showing the second peak rate (DTGpeak2) within 710.26–760.89 K. During this stage, complex volatile organic compounds are released, accompanied by the formation of carbonized residues. Sb2O3 reacts with the released HCl to form antimony oxychlorides (e.g., SbOCl), which further inhibit the pyrolysis process and reduce the release of toxic gases [27]. The flame retardant also enhances the formation of a protective char layer, thereby improving the material’s flame-retardant performance. However, the residual char yield (approximately 28%) remains lower than that of flame-retardant PE. The third stage, occurring above 900 K, primarily involves the further decomposition of carbonized residues. The TG curve shows minimal mass loss, indicating a weaker influence on the overall pyrolysis process. Notably, the inert barrier formed by Sb2O3 during carbonization effectively suppresses the continuation of pyrolysis reactions and further reduces the generation of toxic gases, which is highly significant under real fire conditions.
The pyrolysis behavior of flame-retardant PE insulation occurs in two distinct stages, as shown in Figure 2b,d, corresponding to the decomposition of branched chains and main chains, respectively. The first stage takes place between 500 and 620 K, where the TG curve shows significant mass loss, and the DTG curve exhibits the first peak decomposition rate (DTGpeak1) in the range of 566.12–592.13 K. This stage is primarily attributed to the thermal cracking of branched alkanes in the polyolefin molecules and the release of small volatile compounds [28,29,30]. Compared to PVC, PE demonstrates a higher initial decomposition temperature (Tonset), increasing from 506.69 K (10 K/min) to 521.56 K (40 K/min), indicating that flame-retardant PE possesses superior thermal stability. The second stage occurs between 650 and 800 K and corresponds to the thermal cracking and carbonization of the polymer’s main chains. During this stage, the TG curve shows further mass loss, while the DTG curve reveals the second peak decomposition rate (DTGpeak2) within the range of 746.20–768.13 K. Notably, for both PVC and PE insulation, the peak decomposition rates (DTGpeak1 and DTGpeak2) increase significantly with higher heating rates. Furthermore, PE exhibits a considerably higher char residue yield compared to PVC, reaching 39.83–42.42%. This high char yield is attributed to the low-smoke, halogen-free flame-retardant formulation and radiation crosslinking structure of PE materials, which promote the formation of a more stable carbonized layer during pyrolysis.

3.2. Kinetic Analysis

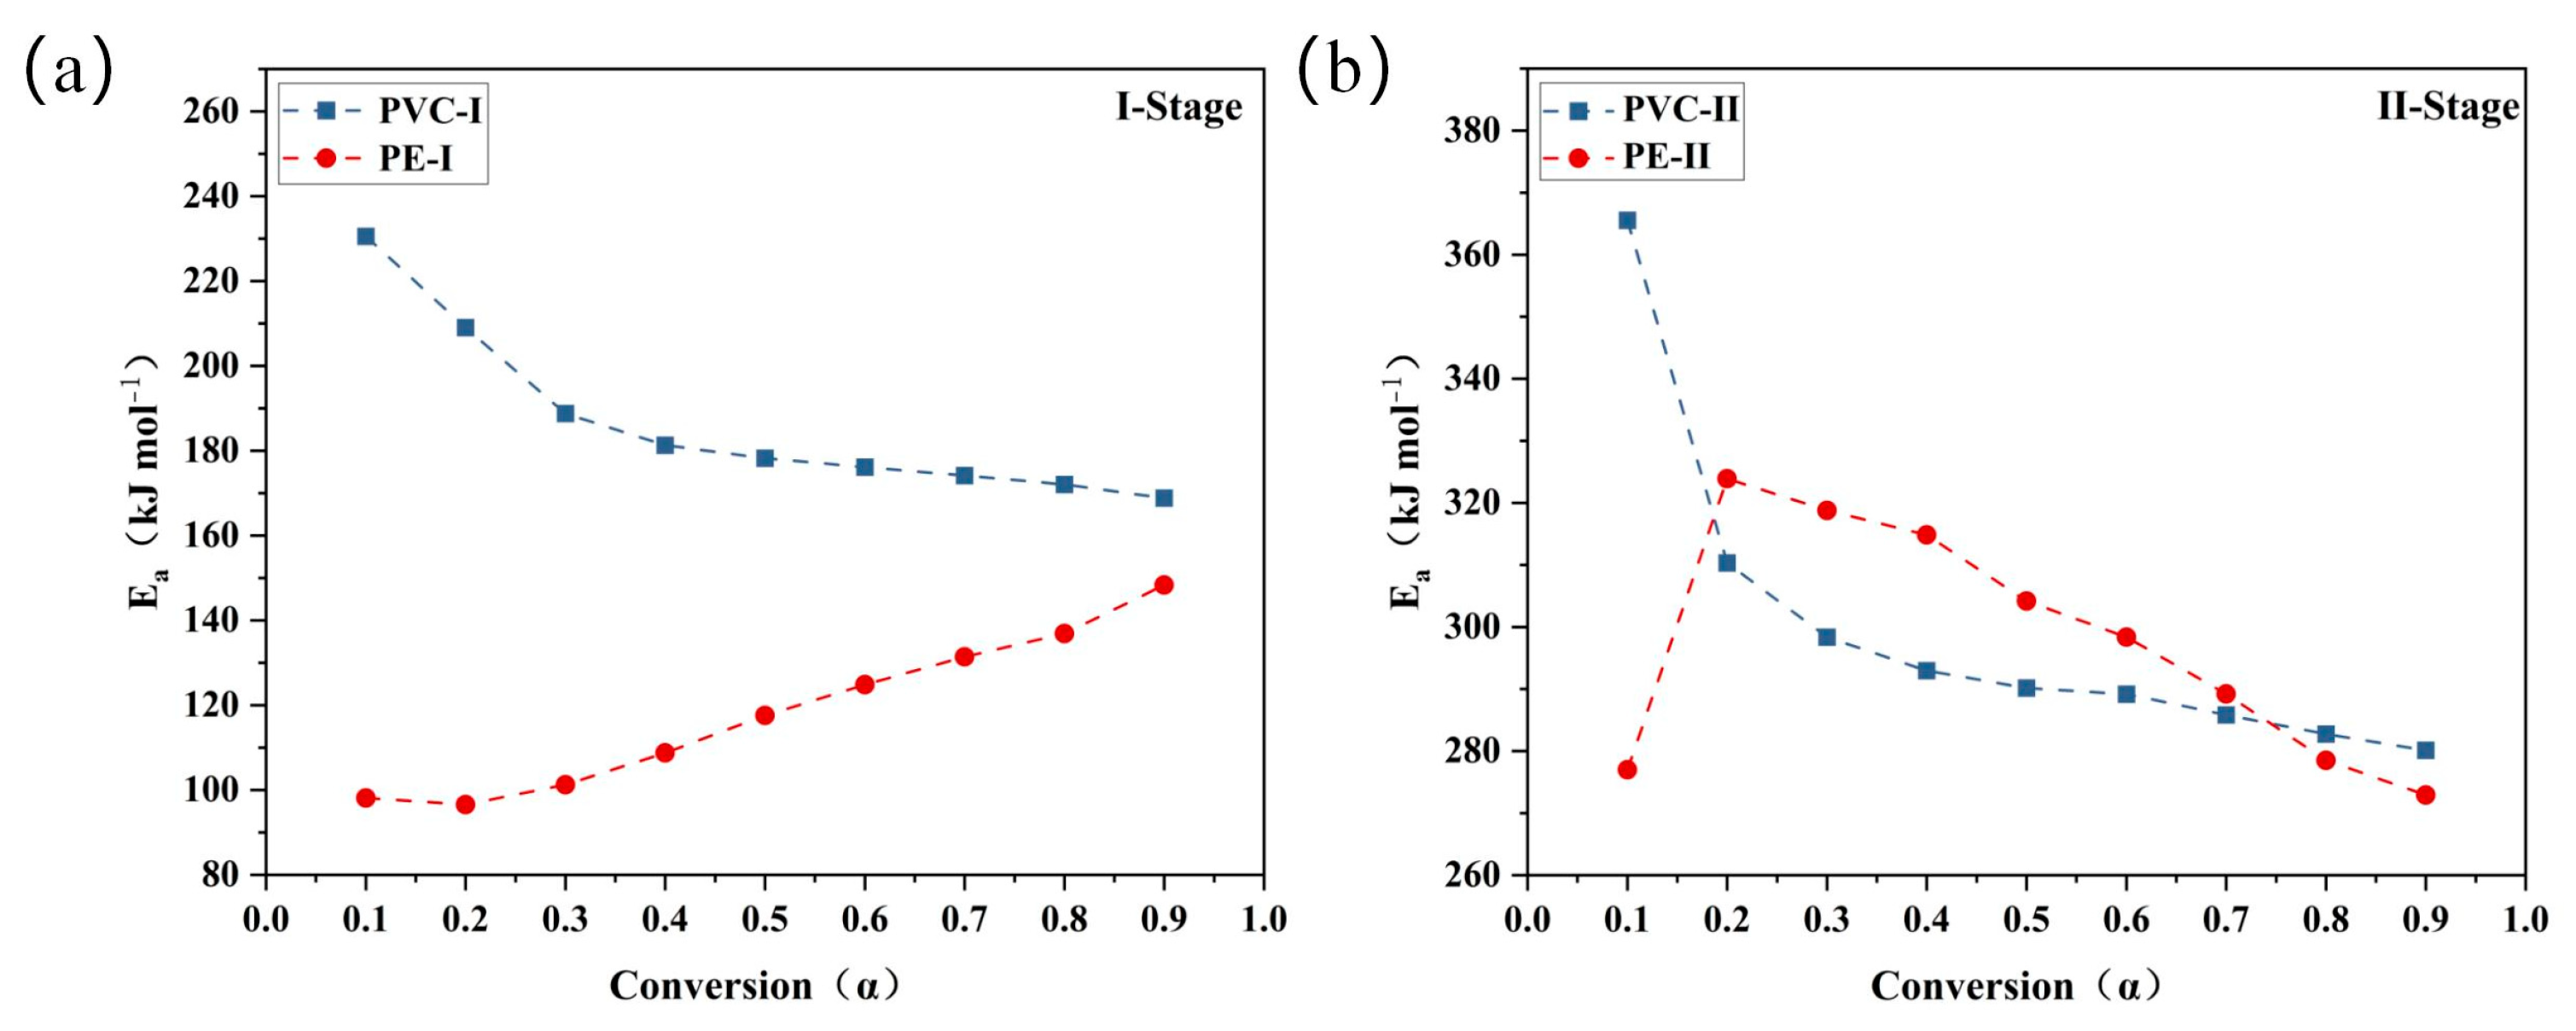
3.2.1. Kinetic Analysis by Model-Free Methods

To further investigate the pyrolysis kinetics of flame-retardant PVC and PE, the KAS method was used to calculate the activation energy Eα at different conversion rates α. Figure 3 illustrates the relationship between ln(β/T2) and 1000/T during the pyrolysis process for flame-retardant PVC and PE.
Figure 4 and Table 3 present the variations in activation energy across different pyrolysis stages, highlighting the kinetic differences between the two materials. This study adopts the stage-specific activation energy calculation method recommended by the International Confederation for Thermal Analysis and Calorimetry (ICTAC), enabling a more detailed segmentation of the pyrolysis process [31,32,33]. During the pyrolysis of flame-retardant PVC insulation, the activation energy Eα in the first stage decreases gradually from 230.56 kJ/mol to 168.79 kJ/mol, with an average value of 186.55 kJ/mol. This stage primarily corresponds to the dehydrochlorination reaction. The initially high Eα indicates that significant energy input is required for HCl removal, while the subsequent decline in Eα reflects the stabilization of the reaction as chlorine atoms are progressively released. This process captures the kinetic characteristics of the stepwise cleavage of C–Cl bonds and dechlorination within the PVC molecular chain [34,35]. In the second stage, Eα decreases from 365.55 kJ/mol to 280.14 kJ/mol, with an average value of 299.47 kJ/mol. This stage is associated with the cleavage of the PVC main chain and the carbonization process. The relatively high Eα indicates that main chain scission requires greater energy input, while the subsequent decline in Eα at higher conversion rates reflects the accumulation of char residue, which forms a physical barrier and limits further mass transfer and volatile release, thereby inhibiting the overall decomposition process [36,37].
The pyrolysis behavior of flame-retardant PE exhibits characteristics significantly different from those of PVC. In the first stage, the Eα gradually increases from 98.12 kJ/mol to 148.32 kJ/mol, with an average value of 118.19 kJ/mol. This trend indicates that the initial reactions primarily involve the decomposition of side chains and small hydrocarbon molecules, which require relatively low energy. As the reaction progresses, it shifts toward main chain scission, leading to an increased energy demand and a corresponding rise in Eα. In the second stage, Eα decreases slightly from 276.99 kJ/mol to 272.90 kJ/mol, with an average value of 297.52 kJ/mol. This gradual decline suggests that the main chain scission process in flame-retardant PE is more stable. Its low-smoke, halogen-free flame-retardant formulation and radiation cross-linking structure significantly enhance the formation of a char layer, which reduces the rate of heat release and suppresses the generation of toxic gases.
In comparison, flame-retardant PE exhibits lower average activation energy in both pyrolysis stages compared to PVC, with smaller variations, indicating greater thermal stability and reduced energy requirements for decomposition. Notably, in the second stage, the dense char layer formed by PE effectively suppresses heat release and toxic gas generation, offering significant advantages in fire prevention and control. In contrast, PVC releases a higher amount of toxic gases during the rapid HCl elimination in the first stage, posing potential fire toxicity risks, highlighting the need for further material optimization.

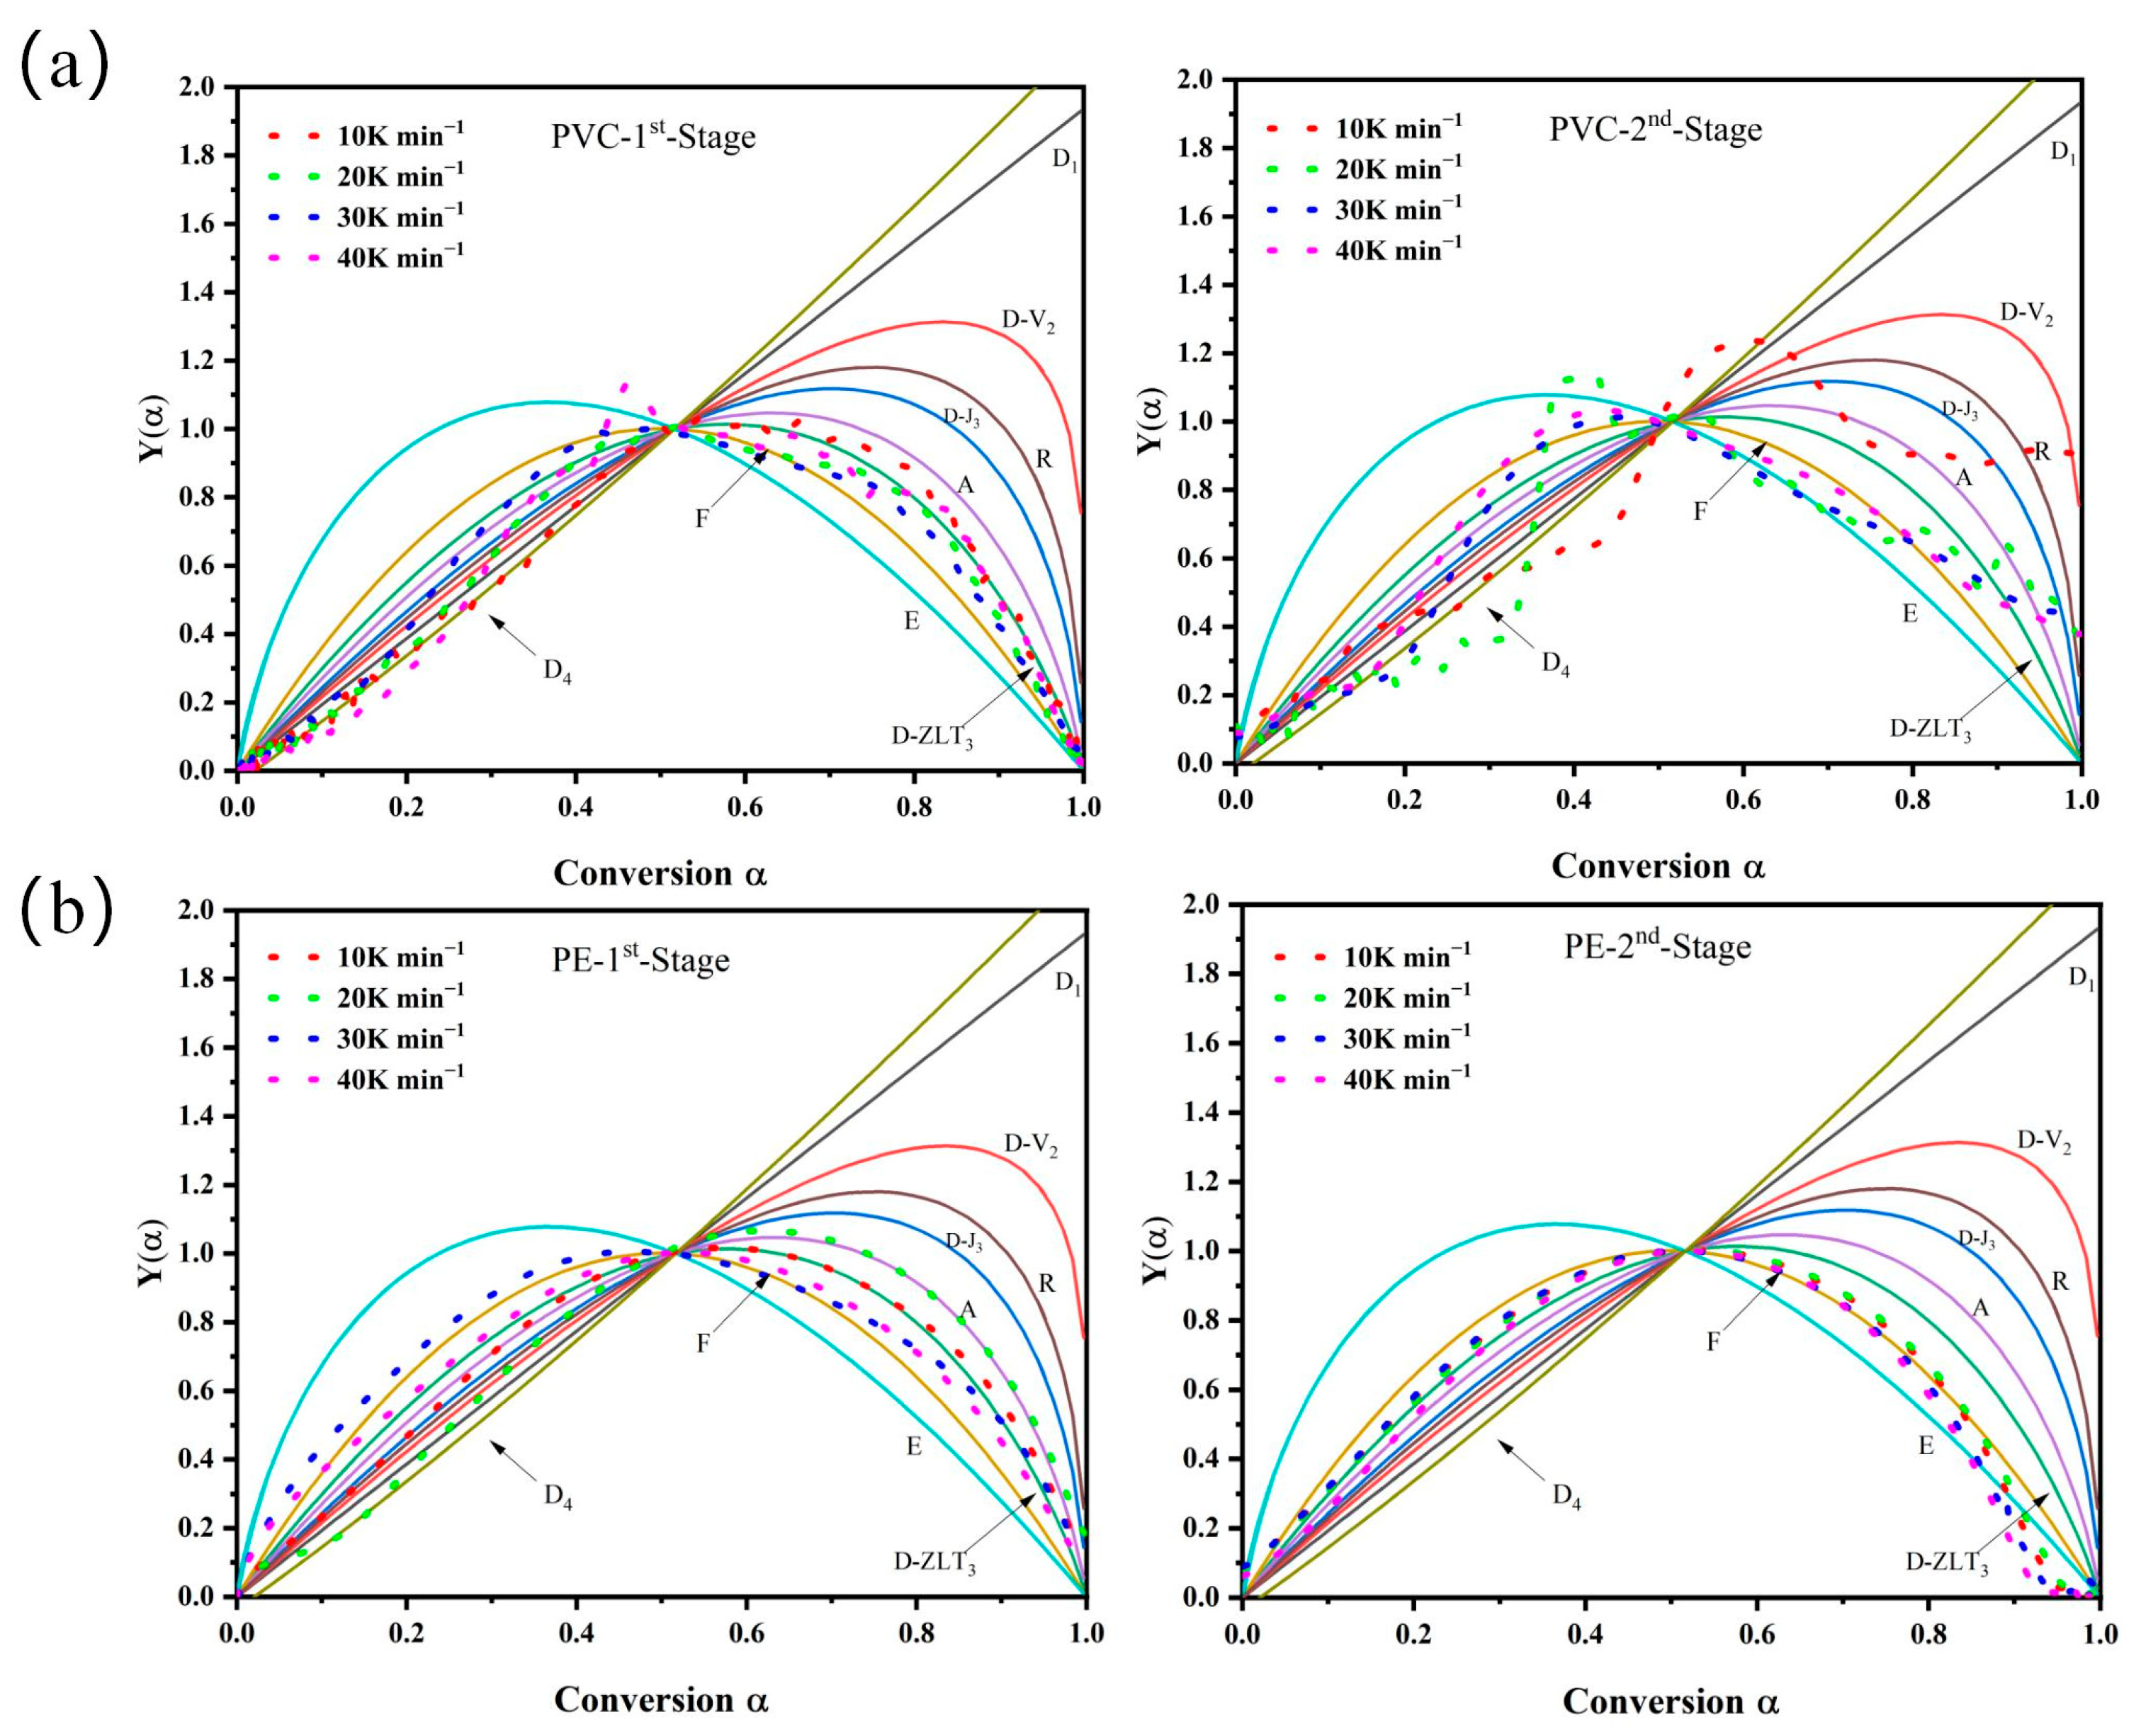
3.2.2. Kinetic Analysis by Model-Fitting Method

Figure 5 illustrates the kinetic curve fitting results for flame-retardant PVC and PE at various α during different pyrolysis stages, highlighting the complex multi-step reaction mechanisms of both materials. Unlike single-rate equations, which often fail to accurately predict thermal degradation processes, this study employs stage-specific pyrolysis analysis combined with mechanistic functions to provide a more scientific interpretation of the reaction characteristics and controlling mechanisms for flame-retardant PVC and PE at each stage.
During the pyrolysis of flame-retardant PVC, the first stage (PVC-I-Stage) exhibits behavior consistent with the three-dimensional diffusion model (D4) at conversion rates between 0.1 and 0.3, indicating that the initial HCl elimination process is primarily diffusion-controlled. As the conversion rate increases to 0.4–0.9, the mechanism transitions to the D-ZLT3 model (three-dimensional random pore diffusion model), suggesting that HCl removal becomes governed by a combined effect of diffusion and random pore expansion. In the second stage (PVC-II-Stage), the pyrolysis process at conversion rates between 0.3 and 0.8 aligns with the two-dimensional random nucleation and growth model (F2), indicating that this phase is dominated by PVC backbone cleavage and carbonization reactions. The formation of char residues during this stage imposes significant kinetic inhibition on subsequent reactions, thereby reducing the pyrolysis rate.
In contrast, the pyrolysis kinetics of flame-retardant PE exhibit greater stability. During the first stage (PE-I-Stage), the pyrolysis behavior across the entire conversion range (0.1 < α < 0.9) closely aligns with the D-ZLT3 model, indicating that the decomposition of side chains and small hydrocarbon molecules is entirely diffusion-controlled. In the second stage (PE-II-Stage), the kinetic behavior demonstrates a phased transition. For conversion rates between 0.1 and 0.5, the process remains consistent with the D-ZLT3 model, suggesting that initial main-chain decomposition is still governed by diffusion mechanisms. However, for conversion rates from 0.5 to 0.9, the mechanism transitions to the F2 model, reflecting a shift where main-chain cleavage and carbonization are regulated by a combination of nucleation and growth processes [38].

3.3. Prediction of Thermal Decomposition Using the CART Model

Figure 6 presents the comparison between experimental data and CART model predictions for the mass loss curves of flame-retardant PVC and PE. The experiments were conducted at heating rates of 10, 20, 30, and 40 K/min, and the CART model demonstrated excellent agreement with the experimental data, achieving determination coefficients (R2) of 0.995 for PVC and 0.988 for PE. These results highlight the model’s high reliability and precision in describing the pyrolysis process of these materials. As shown in Figure 6a, the CART model accurately predicts the mass loss characteristics of flame-retardant PVC during pyrolysis, particularly during the HCl elimination and main-chain scission stages. Similarly, Figure 6b demonstrates the model’s high accuracy in predicting the pyrolysis of flame-retardant PE, effectively capturing the stages of branch decomposition and main-chain cracking. These findings validate the CART model’s adaptability and robustness in characterizing complex pyrolysis behaviors.

3.4. Micro-Scale Pyrolysis Gas Analysis

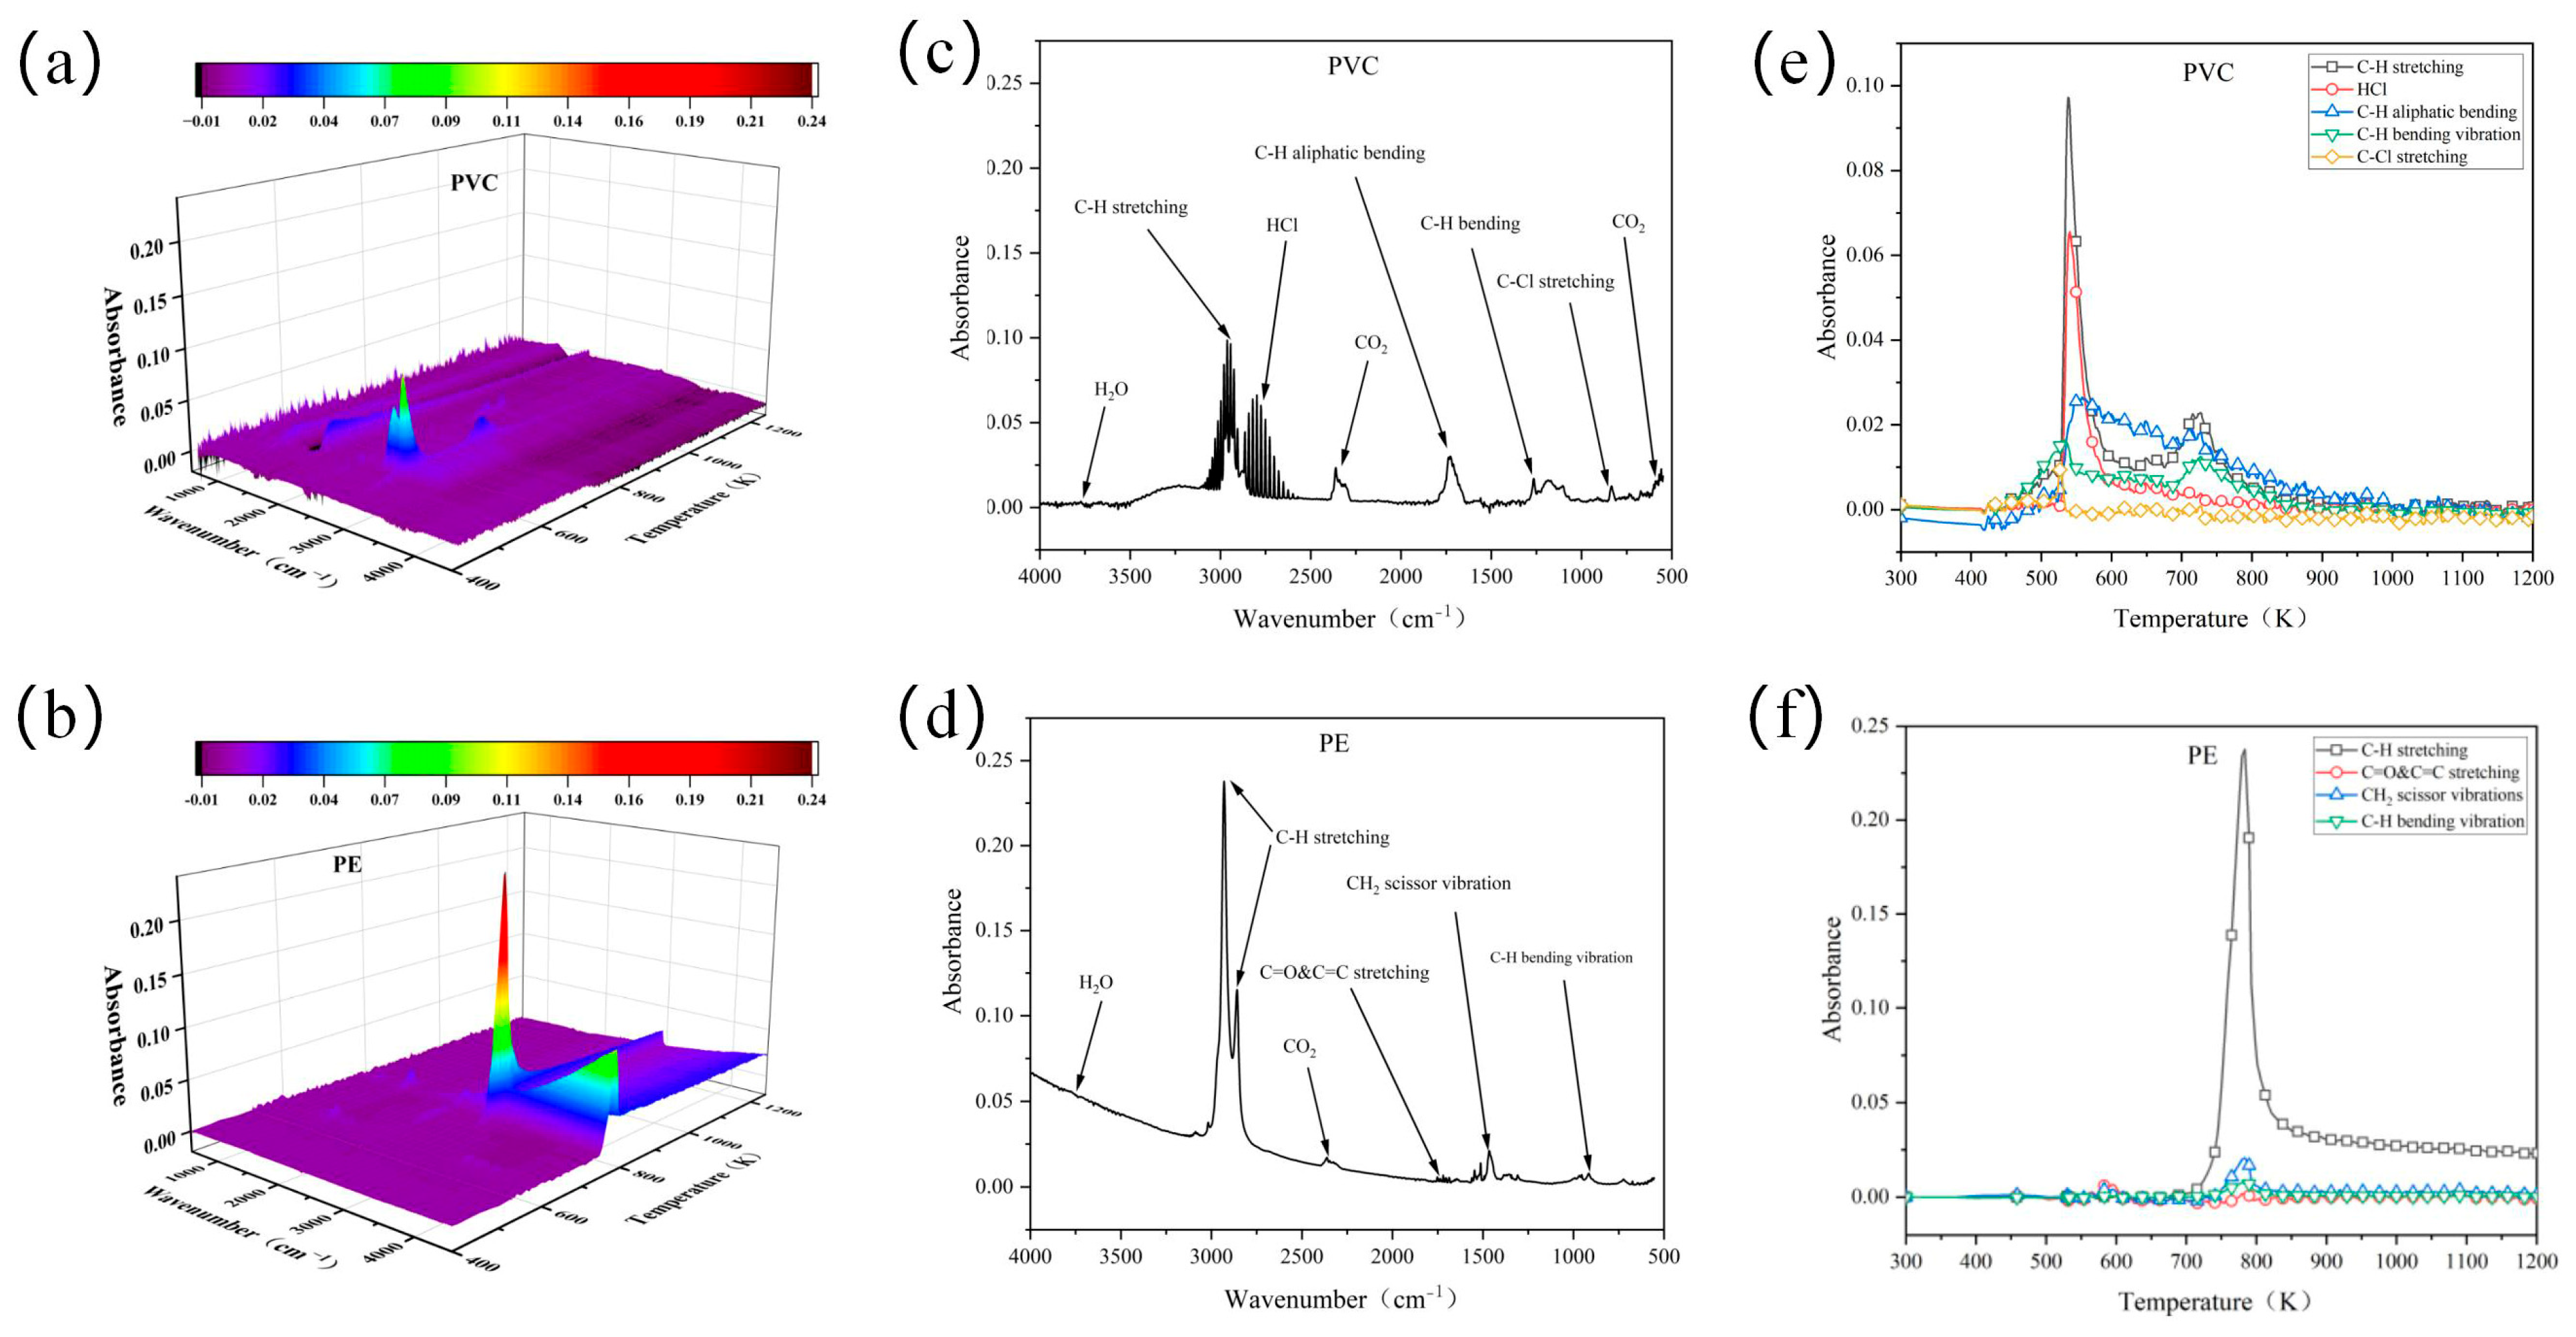
3.4.1. FTIR Analysis

Figure 7a,b present the three-dimensional FTIR absorption spectra of pyrolysis gases for flame-retardant PVC and PE at a heating rate of 10 K/min. These spectra illustrate the generation patterns of gaseous products and their temperature-dependent evolution during pyrolysis. As shown, the release temperature ranges for the pyrolysis gases are 480–1000 K for PVC and 500–800 K for PE. The broader temperature range observed for PVC aligns with its DTG curve evolution, reflecting its extended decomposition process.
Figure 7c,d illustrate the FTIR characteristic absorption peaks of pyrolysis gases from flame-retardant PVC and PE, with detailed assignments provided in Table 4. For flame-retardant PVC, absorption bands are observed at 4000–3500 cm−1 and 1800–1300 cm−1, corresponding to the stretching vibrations of H2O. These peaks indicate the release of water molecules from the thermal decomposition of oxygen-containing functional groups. The stretching vibration of C–H appears near 2934 cm−1, attributed to symmetric and asymmetric stretching of C–H bonds in the PVC molecular structure. Additionally, absorption peaks in the 2400–2260 cm−1 range correspond to CO2, highlighting its generation during PVC pyrolysis. The stretching vibration of C–Cl bonds at 660 cm−1 indicates that HCl removal is the primary reaction in the initial pyrolysis stage. Notably, the added flame retardant Sb2O3 plays a critical role during this phase by reacting with the released HCl to form antimony oxychloride (SbOCl), which not only reduces the toxic release of gaseous HCl but also creates a flame-retardant barrier [39]. The absorption peak at 1458 cm−1 is associated with the aliphatic bending vibration of C–H, while the peak at 1240 cm−1 corresponds to the bending vibration of C–H adjacent to chlorine atoms. These characteristic absorption peaks confirm that the main pyrolysis gases of PVC include HCl, H2O, CO2, and small hydrocarbon molecules released through C–H bond cleavage. Additionally, the presence of the flame retardant significantly enhances char layer formation, further inhibiting sustained combustion.
For flame-retardant PE, absorption bands at 4000–3500 cm−1 and 1800–1300 cm−1 correspond to the stretching vibrations of H2O. The characteristic C–H stretching vibrations are clearly observed at 2928 cm−1 and 2860 cm−1, reflecting the symmetric and asymmetric stretching of CH2 and CH3 groups in polyethylene molecules. Additionally, a distinctive absorption band near 1652 cm−1 corresponds to the stretching vibrations of unconjugated C=O and C=C bonds, indicating the formation of unsaturated hydrocarbons and ketones during pyrolysis [40]. Peaks at 1460 cm−1 and 732 cm−1 are associated with the scissoring vibrations of CH2 groups and the bending vibrations of C–H bonds, respectively. The pyrolysis gases of PE primarily consist of H2O, CO2, saturated hydrocarbons, and unsaturated hydrocarbons, with significantly reduced toxic gas emissions compared to PVC [13]. In summary, the key difference between the pyrolysis gases of flame-retardant PVC and PE lies in their chemical composition: PVC releases large amounts of HCl due to the decomposition of chlorine-containing components, whereas PE generates more unsaturated hydrocarbons.
Figure 7e,f illustrate the temperature-dependent intensity profiles of major gas absorption peaks during the pyrolysis of flame-retardant PVC and PE. For flame-retardant PVC, the absorption peak intensities of characteristic gases exhibit distinct stage-specific changes with increasing temperature. In the temperature range of approximately 480–600 K, the intensity of the HCl absorption peak increases sharply, reaching its maximum around 569 K. This behavior is closely associated with the dehydrochlorination process, a hallmark of the HCl-removal stage in PVC pyrolysis. Concurrently, the absorption intensities of C–H stretching vibrations (2934 cm−1) and aliphatic C–H bending vibrations (1458 cm−1) also increase significantly, indicating the generation of small hydrocarbon molecules in this stage [38]. In the second stage (600–800 K), the absorption peak intensity of CO2 (2400–2260 cm−1) gradually rises to its maximum, reflecting substantial CO2 production during the breakdown of the PVC backbone and subsequent carbonization. Additionally, the changes in the C–Cl stretching vibration peak (660 cm−1) confirm the cleavage and depletion of C–Cl bonds throughout the pyrolysis process.
In contrast, the temperature-dependent gas release patterns of flame-retardant PE follow a different trend. In the range of approximately 500–800 K, the absorption peak intensity of C–H stretching vibrations (2928 cm−1) increases sharply, peaking around 766 K. This suggests that PE pyrolysis is dominated by the production of small alkanes and alkenes. Furthermore, the intensities of the C=O and C=C stretching vibrations (1652 cm−1) and CH2 scissoring vibrations (1460 cm−1), though lower in magnitude, remain notable, indicating the minor release of unsaturated hydrocarbons and ketones. At higher temperatures (>800 K), the intensity of PE gas emissions declines rapidly, suggesting that its pyrolysis is largely concentrated in the main chain cleavage stage between 700 and 800 K.

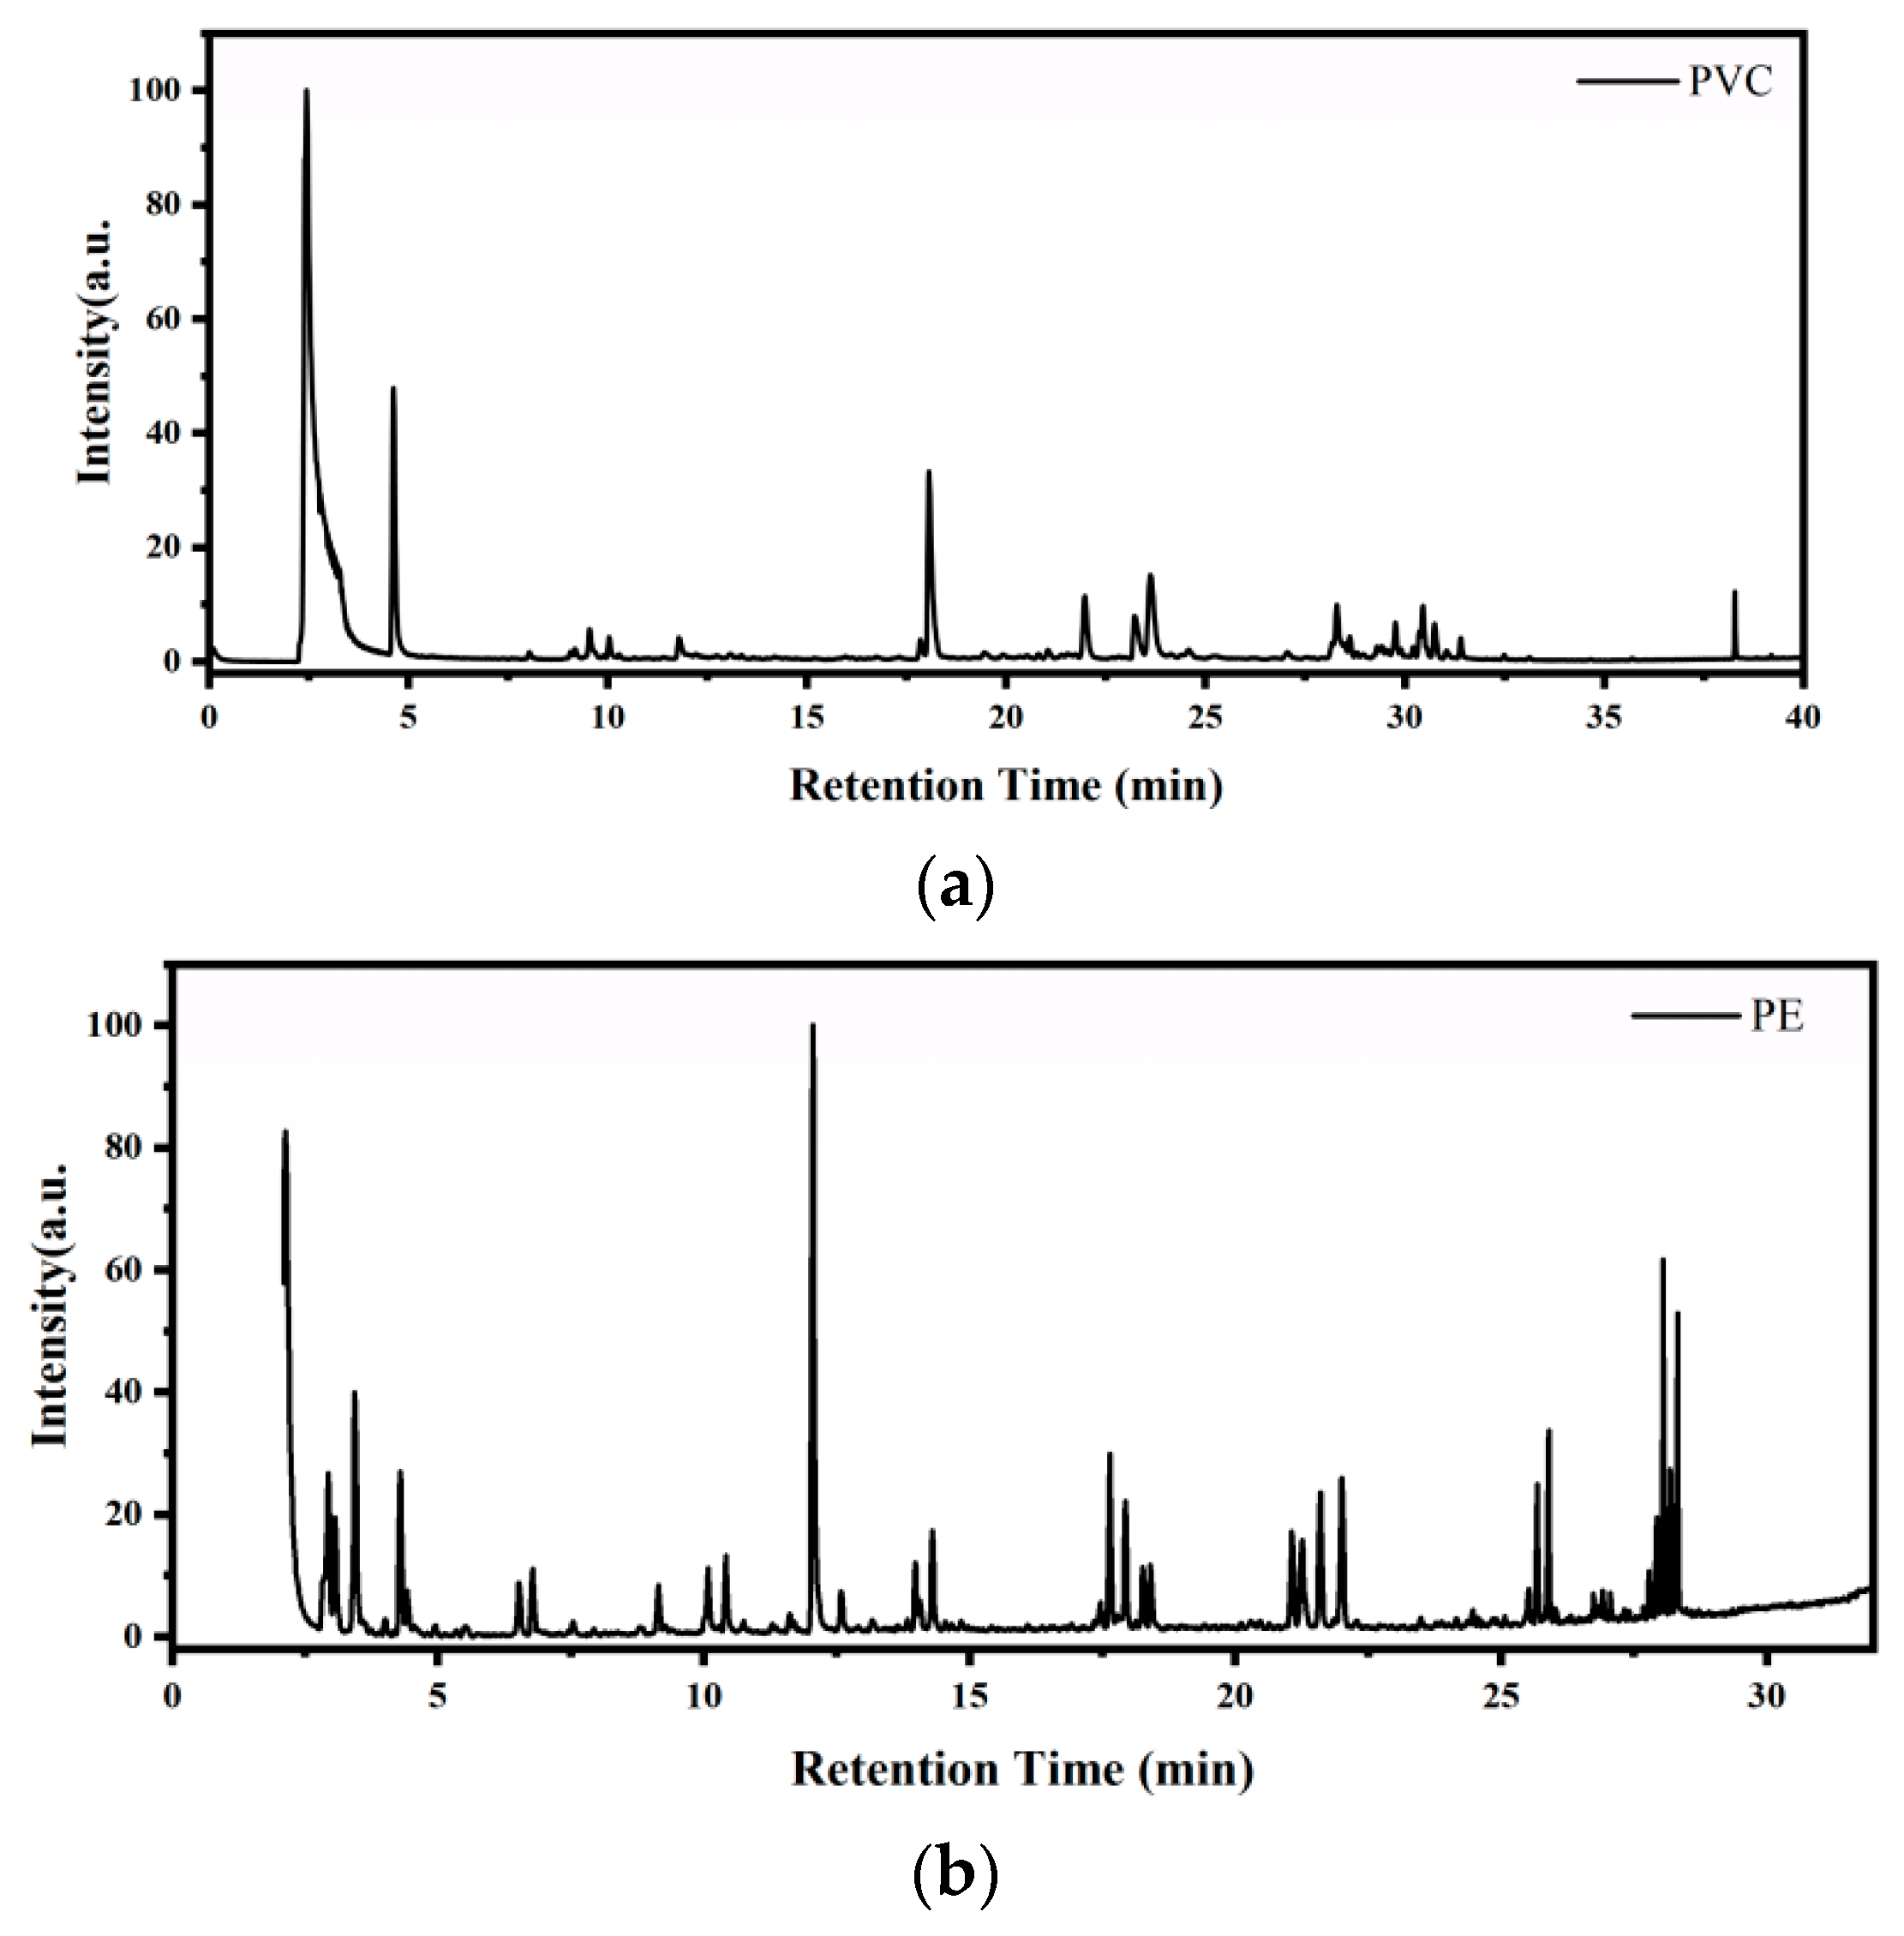
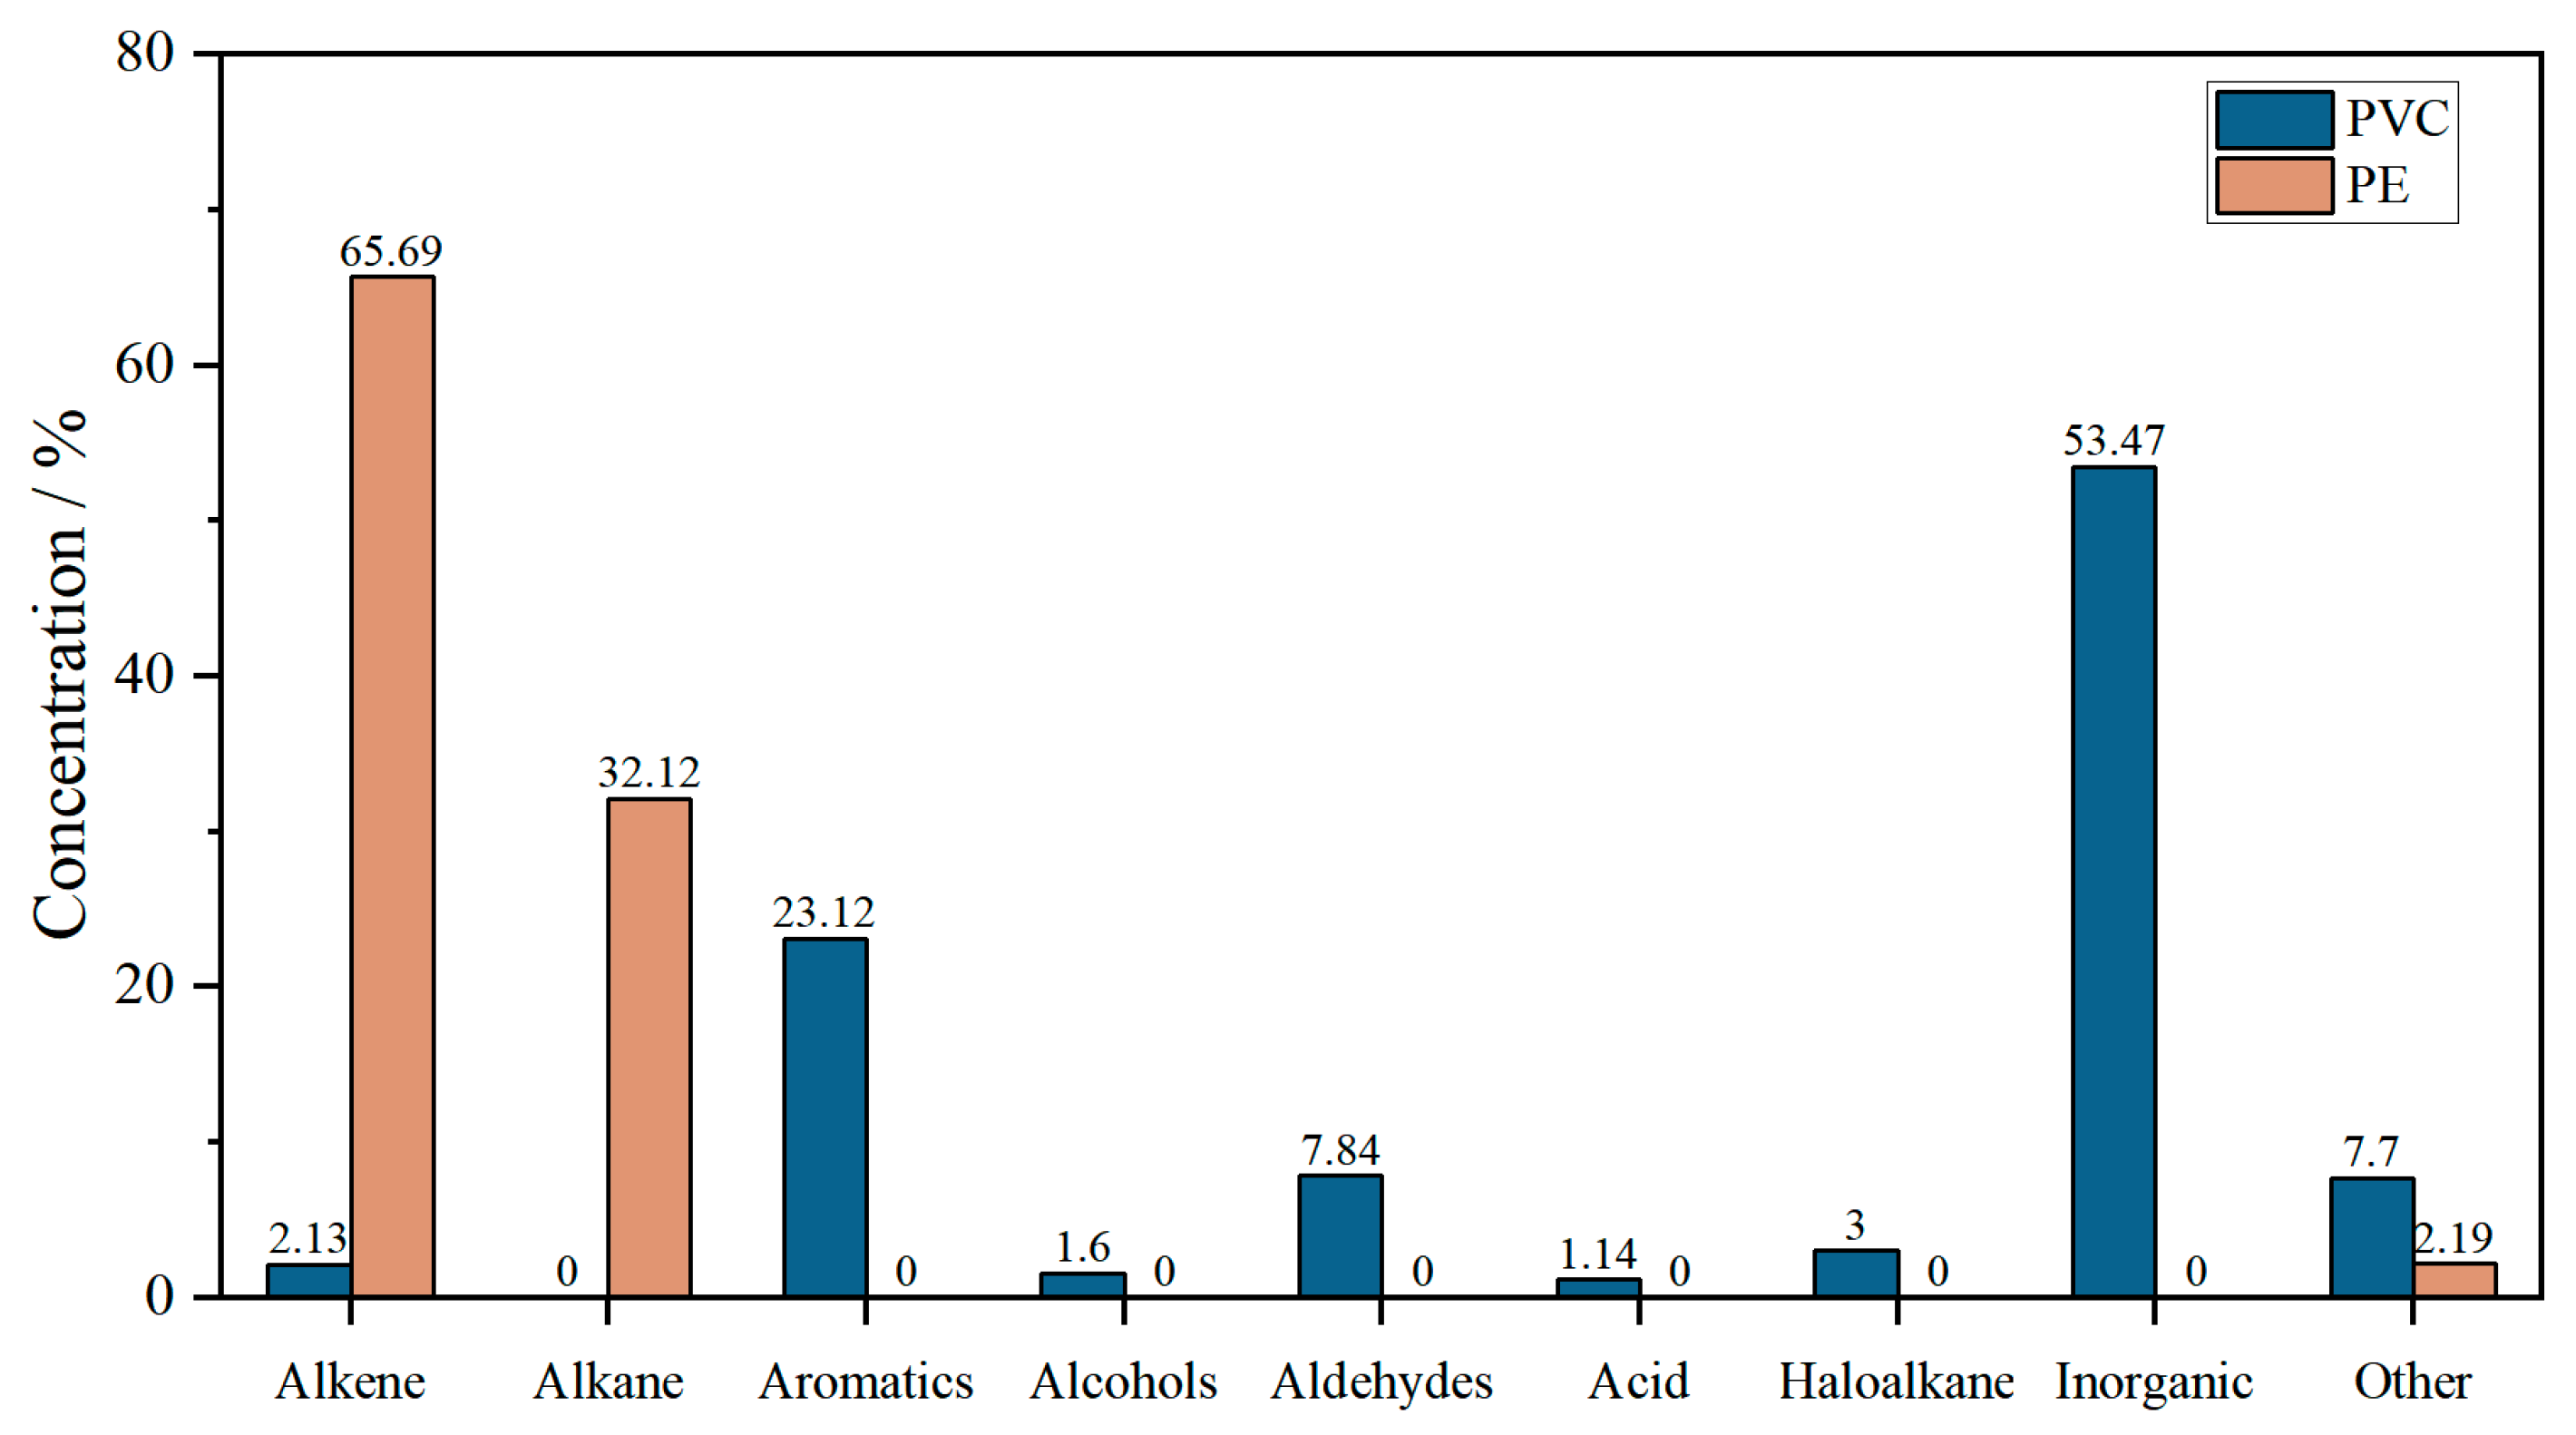
3.4.2. GC/MS Analysis

Figure 8 and Table 5 present the total ion chromatograms (TIC) and major components of pyrolysis products for flame-retardant PVC and PE at a heating rate of 10 K/min, as detected by GC/MS. The analysis was conducted at the peak DTG temperatures for each material (569.18 K for PVC and 566.12 K for PE) to investigate the compositional differences and release patterns of volatile products during their pyrolysis processes.
The pyrolysis products of flame-retardant PVC primarily consist of inorganic compounds (e.g., HCl) and aromatic hydrocarbons. At 569.18 K, the primary detected products include hydrogen chloride (HCl, retention time: 2.56 min), benzene (retention time: 4.66 min), and aromatic compounds such as 3-heptene (3-methyl-) and 3-methylphenylacetylene. Additionally, small quantities of oxygen-containing compounds, such as benzaldehyde (retention time: 18.09 min) and 1,2-benzenedicarboxylic acid (retention time: 38.28 min), as well as halogenated alkanes like 3-chloromethylheptane, were identified. The prominent release of HCl highlights the characteristics of the initial dehydrochlorination stage of PVC pyrolysis, representing the direct cleavage of C–Cl bonds in the molecular chain. Moreover, the generation of aromatic hydrocarbons indicates that, following the dehydrochlorination process, the PVC main chain undergoes rearrangement and carbonization. Notably, inorganic components constituted a significant proportion (53.47%), consistent with PVC’s high chlorine content and the substantial gas-phase product generation during HCl elimination [41,42].
In contrast, the pyrolysis products of flame-retardant PE at 566.12 K show markedly different characteristics, being dominated by alkenes and alkanes. The main products include propene (retention time: 2.94 min), 2-butene (retention time: 3.07 min), pentane (retention time: 3.48 min), and 1-decene (retention time: 17.93 min). Trace amounts of higher molecular weight alkanes such as tetradecene and tetradecane, as well as minimal quantities of oxygen-containing compounds like 1,2-benzenedicarboxylic acid, were also detected. Alkenes (65.69%) and alkanes (32.12%) constitute the majority of PE’s volatile pyrolysis products, highlighting a decomposition mechanism dominated by chain scission and the subsequent formation of small hydrocarbon molecules [12]. This behavior is closely tied to PE’s molecular structure, which promotes typical carbon chain cleavage reactions. Furthermore, the low-smoke, halogen-free flame-retardant formulation and crosslinked structure significantly enhance the formation of carbonized residues, thereby improving the flame-retardant performance by reducing the release of toxic and flammable gases.
From an environmental and health perspective, the identified pyrolysis gases present distinct hazards. For PVC, hydrogen chloride (HCl) is highly corrosive and toxic upon inhalation, contributing to respiratory irritation and environmental acidification. Aromatic hydrocarbons such as benzene are known carcinogens and pose serious health risks. In the case of PE, although the gases released (e.g., propene, butene, and pentane) are generally less toxic, they are highly flammable and may contribute to secondary fire risks and explosions in confined spaces. Therefore, understanding the composition and relative hazards of these gases is essential for evaluating the safety implications of flame-retardant cable materials during thermal failure.
Figure 9 provides a comparative analysis of the major chemical components in the pyrolysis products of flame-retardant PVC and PE, highlighting distinct differences in their decomposition behaviors. Flame-retardant PVC primarily generates inorganic compounds and aromatic hydrocarbons, whereas flame-retardant PE predominantly produces alkenes and alkanes.
For PVC, the pyrolysis products are predominantly composed of inorganic compounds (53.47%), followed by aromatic hydrocarbons (23.12%) and aldehydes (7.84%), with minor contributions from acids (0.14%) and halogenated alkanes (3%). The high concentration of inorganic compounds is attributed to the significant release of hydrogen chloride (HCl) during the dehydrochlorination stage, a characteristic feature of PVC pyrolysis [43]. Additionally, the generation of aromatic hydrocarbons, such as benzene and toluene, reflects the rearrangement and carbonization of PVC’s molecular chains. The presence of aldehydes indicates partial oxidation of carbon chains during thermal decomposition. Notably, no alkanes were detected in the pyrolysis products of PVC, consistent with its molecular structure, which lacks long hydrocarbon chains.
In contrast, PE’s pyrolysis products are dominated by alkenes (65.69%) and alkanes (32.12%), indicating a decomposition mechanism centered on chain scission and the formation of small hydrocarbon molecules [44]. Typical products include propene, butene, pentane, and decane, which are indicative of PE’s chain-breaking thermal degradation. The low toxicity of these hydrocarbons, coupled with the absence of halogenated compounds, makes PE comparatively more environmentally friendly than PVC. Furthermore, PE generates only trace amounts of alcohols (1.6%) and other minor components (2.19%), underscoring its simpler pyrolysis product profile and reduced release of toxic gases.

4. Conclusions

This study systematically investigates the pyrolysis kinetics and volatile product release behaviors of flame-retardant PVC and PE using TG-FTIR-GC/MS combined with kinetic analysis and the CART model, offering a novel perspective on the pyrolysis behavior of flame-retardant materials. The findings reveal that flame-retardant PVC exhibits pronounced stage-specific pyrolysis characteristics, with the first stage dominated by HCl elimination and the second stage involving main-chain scission and carbonization. These stages are accompanied by the release of a significant proportion of inorganic volatile products (53.47%) and aromatic compounds (23.12%), indicating a higher fire toxicity risk. In contrast, flame-retardant PE demonstrates diffusion-controlled mechanisms in both pyrolysis stages, releasing primarily alkenes (65.69%) and alkanes (32.12%), which are less toxic, while forming a denser char layer, underscoring the superior performance of its low-smoke, halogen-free flame-retardant formulation.
Kinetic analysis further highlights that flame-retardant PE exhibits lower activation energy, higher char residue, and more stable diffusion-controlled behavior during pyrolysis, outperforming flame-retardant PVC in thermal stability and fire safety. Additionally, the innovative incorporation of the CART model enables precise simulation of the pyrolysis process, achieving prediction accuracies with R2 values of 0.995 for PVC and 0.988 for PE. This advancement offers a robust new approach for characterizing and predicting complex pyrolysis reactions.
In conclusion, flame-retardant PE, with its exceptional thermal stability, low toxicity, and enhanced char-forming capability, is a more suitable choice for high-safety applications. This study represents a significant breakthrough in the multi-scale analysis of pyrolysis behavior and data-driven predictive modeling, providing critical scientific insights and technological support for optimizing flame-retardant materials and assessing fire risks.

Author Contributions

Conceptualization, P.-R.M.; writing—review and editing, W.-W.S.; visualization, Y.-W.S.; supervision, Y.L.; supervision, J.W. All authors have read and agreed to the published version of the manuscript.

Funding

This research was funded by [The National Key Research and Development Program of China] grant number [No.2023YFC3009800].

Institutional Review Board Statement

Not applicable.

Informed Consent Statement

Not applicable.

Data Availability Statement

All data generated during this study are included in the article.

Conflicts of Interest

The authors declare no conflict of interest.

References

  1. Babrauskas, V. Electrical Fire and Explosion; Fire Science Publishers: New York, NY, USA, 2021. [Google Scholar]
  2. Lin, Q.; Li, Y.; Man, P.; Jin, Y.; Lyu, H.; Wang, H.; Zhao, Y.; Su, W.; Deng, J. Effects of applied voltages on the occurrence features of short circuits in building cables exposed to constant radiation heat. J. Build. Eng. 2024, 98, 111038. [Google Scholar] [CrossRef]
  3. GB/T 19666-2019; General Rules for Flame Retardant and Fire Resistant Electric Wires and Cables or Optical Fiber Cables. State Administration for Market Regulation: Beijing, China, 2019.
  4. Lin, Q.-W.; Li, Y.; Deng, J.; He, F.-F.; Man, P.-R. Thermo-oxidative degradation behavior of poly(vinyl chloride) insulation for new and overloaded wires via TG-FTIR. J. Appl. Polym. Sci. 2024, 141, e55994. [Google Scholar] [CrossRef]
  5. Lin, Q.; Li, Y.; Deng, J. Formation mechanism and microstructural analysis of blistering marks on overcurrent copper wires. Fire Saf. J. 2024, 150, 104268. [Google Scholar] [CrossRef]
  6. Deng, J.; Lin, Q.; Li, Y.; Wang, C.; Wang, H.; Man, P. Effect of overload current values on the fire characteristics of polyethylene (PE) copper wires. J. Therm. Anal. Calorim. 2023, 148, 11695–11705. [Google Scholar] [CrossRef]
  7. Yan, L.; Wang, W.; Xu, Z. Impact of thermal aging temperatures on the combustion behavior and mechanical properties of flame-retardant electrical cables. J. Therm. Anal. Calorim. 2024, 149, 9045–9056. [Google Scholar] [CrossRef]
  8. Yu, J.; Sun, L.; Ma, C.; Qiao, Y.; Yao, H. Thermal degradation of PVC: A review. Waste Manag. 2016, 48, 300–314. [Google Scholar] [CrossRef]
  9. Beneš, M.; Milanov, N.; Matuschek, G.; Kettrup, A.; Plaček, V.; Balek, V. Thermal degradation of PVC cable insulation studied by simultaneous TG-FTIR and TG-EGA methods. J. Therm. Anal. Calorim. 2004, 78, 621–630. [Google Scholar] [CrossRef]
  10. Wang, C.; Liu, H.; Zhang, J.; Yang, S.; Zhang, Z.; Zhao, W. Thermal degradation of flame-retarded high-voltage cable sheath and insulation via TG-FTIR. J. Anal. Appl. Pyrolysis 2018, 134, 167–175. [Google Scholar] [CrossRef]
  11. Wang, Y.; Kang, N.; Lin, J.; Lu, S.; Liew, K.M. On the pyrolysis characteristic parameters of four flame-retardant classes of PVC sheathless cable insulation materials. J. Anal. Appl. Pyrolysis 2023, 170, 105901. [Google Scholar] [CrossRef]
  12. Zhou, J.; Liu, G.; Wang, S.; Zhang, H.; Xu, F. TG-FTIR and Py-GC/MS study of the pyrolysis mechanism and composition of volatiles from flash pyrolysis of PVC. J. Energy Inst. 2020, 93, 2362–2370. [Google Scholar] [CrossRef]
  13. Liu, X.; Tian, K.; Chen, Z.; Wei, W.; Xu, B.; Ni, B.-J. Online TG-FTIR-MS analysis of the catalytic pyrolysis of polyethylene and polyvinyl chloride microplastics. J. Hazard. Mater. 2023, 441, 129881. [Google Scholar] [CrossRef] [PubMed]
  14. Deng, J.; Lin, Q.-W.; Li, Y.; Wang, H.-B.; Wang, C.-P.; Zhao, Y.-H.; Lyu, H.-F.; Shu, C.-M. Ignition and Flame Spreading Features of Excessively Overloaded Polyvinyl Chloride Copper Wires. Fire Technol. 2023, 59, 3589–3607. [Google Scholar] [CrossRef]
  15. Zou, Y.; Li, Y.; Bourbigot, S.; Zhang, J.; Guo, Y.; Li, K.; He, X.; Baolati, J. Determination of solid-phase reaction mechanism and chlorine migration behavior of co-pyrolyzing PVCCaCO3 based polymer using temperature-dependent FTIR and XRD analysis. Polym. Degrad. Stab. 2021, 193, 109741. [Google Scholar] [CrossRef]
  16. Encinar, J.M.; González, J.F. Pyrolysis of synthetic polymers and plastic wastes. Kinetic study. Fuel Process. Technol. 2008, 89, 678–686. [Google Scholar] [CrossRef]
  17. Xu, F.; Wang, B.; Yang, D.; Hao, J.; Qiao, Y.; Tian, Y. Thermal degradation of typical plastics under high heating rate conditions by TG-FTIR: Pyrolysis behaviors and kinetic analysis. Energy Convers. Manag. 2018, 171, 1106–1115. [Google Scholar] [CrossRef]
  18. Lin, Q.-W.; Li, X.; Li, Y.; Deng, J.; Man, P.-R.; Jia, Y.-Z. Comparative investigation on thermo-oxidative degradation and fire characteristics of flame-retardant and non-flame-retardant polyvinyl chloride wires. Therm. Sci. Eng. Prog. 2025, 57, 103210. [Google Scholar] [CrossRef]
  19. Sugimoto, M.; Shimada, A.; Kudoh, H.; Tamura, K.; Seguchi, T. Product analysis for polyethylene degradation by radiation and thermal ageing. Radiat. Phys. Chem. 2013, 82, 69–73. [Google Scholar] [CrossRef]
  20. Wan, L.; Zhang, G.; Zhao, Y.; Zhao, M.; Liao, Z. Analysis of Internal Pyrolysis Characteristics of Crosslinked Polyethylene Cable. In Proceedings of the 2020 IEEE Electrical Insulation Conference (EIC), Knoxville, TN, USA, 22 June–3 July 2020; pp. 498–503. [Google Scholar] [CrossRef]
  21. Kong, J.; Zhou, K.; Ren, X.; Chen, Y.; Li, Y.; Meng, P. Insight into gaseous product distribution of cross-linked polyethylene pyrolysis using ReaxFF MD simulation and TG-MS. J. Anal. Appl. Pyrolysis 2023, 169, 105847. [Google Scholar] [CrossRef]
  22. Qu, H.; Wu, W.; Zheng, Y.; Xie, J.; Xu, J. Synergistic effects of inorganic tin compounds and Sb2O3 on thermal properties and flame retardancy of flexible poly(vinyl chloride). Fire Saf. J. 2011, 46, 462–467. [Google Scholar] [CrossRef]
  23. Kissinger, H.E. Reaction Kinetics in Differential Thermal Analysis. Anal. Chem. 1957, 29, 1702–1706. [Google Scholar] [CrossRef]
  24. Málek, J. The kinetic analysis of non-isothermal data. Thermochim. Acta 1992, 200, 257–269. [Google Scholar] [CrossRef]
  25. Lawrence, R.L.; Wright, A. Rule-Based Classification Systems Using Classification and Regression Tree(CART) Analysis. Photogramm. Eng. Remote Sens. 2001, 67, 1137–1142. [Google Scholar]
  26. Wang, Y.; Kang, N.; Lin, J.; Lu, S.; Liew, K.M. Cross-heating-rate prediction of thermogravimetry of PVC and XLPE cable insulation material: A novel artificial neural network framework. J. Therm. Anal. Calorim. 2022, 147, 14467–14478. [Google Scholar] [CrossRef]
  27. Liu, H.; Wang, S.; Li, S.; Wu, Y.; Jiang, L.; Lang, J.; Yuan, J.; Liu, J. Effect of thermo-oxidative aging on thermal elongation performance of XLPE insulation for high-voltage cables. Polym. Degrad. Stab. 2023, 210, 110291. [Google Scholar] [CrossRef]
  28. Mo, S.-J.; Zhang, J.; Liang, D.; Chen, H.-Y. Study on Pyrolysis Characteristics of Cross-linked Polyethylene Material Cable. Procedia Eng. 2013, 52, 588–592. [Google Scholar] [CrossRef]
  29. Wang, Z.; Wei, R.; Ning, X.; Xie, T.; Wang, J. Thermal degradation properties of LDPE insulation for new and aged fine wires. J. Therm. Anal. Calorim. 2019, 137, 461–471. [Google Scholar] [CrossRef]
  30. Xuan, W.; Yan, S.; Dong, Y. Exploration of Pyrolysis Behaviors of Waste Plastics (Polypropylene Plastic/Polyethylene Plastic/Polystyrene Plastic): Macro-Thermal Kinetics and Micro-Pyrolysis Mechanism. Processes 2023, 11, 2764. [Google Scholar] [CrossRef]
  31. Cho, Y.-S.; Shim, M.-J.; Kim, S.-W. Thermal degradation kinetics of PE by the Kissinger equation. Mater. Chem. Phys. 1998, 52, 94–97. [Google Scholar] [CrossRef]
  32. Park, J.W.; Oh, S.C.; Lee, H.P.; Kim, H.T.; Yoo, K.O. A kinetic analysis of thermal degradation of polymers using a dynamic method. Polym. Degrad. Stab. 2000, 67, 535–540. [Google Scholar] [CrossRef]
  33. Peterson, J.D.; Vyazovkin, S.; Wight, C.A. Kinetics of the Thermal and Thermo-Oxidative Degradation of Polystyrene, Polyethylene and Poly(propylene). Macromol. Chem. Phys. 2001, 202, 775–784. [Google Scholar] [CrossRef]
  34. Aboulkas, A.; El harfi, K.; El Bouadili, A. Thermal degradation behaviors of polyethylene and polypropylene. Part I: Pyrolysis kinetics and mechanisms. Energy Convers. Manag. 2010, 51, 1363–1369. [Google Scholar] [CrossRef]
  35. Das, P.; Tiwari, P. Thermal degradation kinetics of plastics and model selection. Thermochim. Acta 2017, 654, 191–202. [Google Scholar] [CrossRef]
  36. Xie, Q.; Zhang, H.; Tong, L. Experimental study on the fire protection properties of PVC sheath for old and new cables. J. Hazard. Mater. 2010, 179, 373–381. [Google Scholar] [CrossRef] [PubMed]
  37. Wang, Z.; Xie, T.; Ning, X.; Liu, Y.; Wang, J. Thermal degradation kinetics study of polyvinyl chloride (PVC) sheath for new and aged cables. Waste Manag. 2019, 99, 146–153. [Google Scholar] [CrossRef] [PubMed]
  38. Wu, J.; Chen, T.; Luo, X.; Han, D.; Wang, Z.; Wu, J. TG/FTIR analysis on co-pyrolysis behavior of PE, PVC and PS. Waste Manag. 2014, 34, 676–682. [Google Scholar] [CrossRef] [PubMed]
  39. Han, Z.; Li, J.; Gu, T.; Yang, R.; Fu, Z.; Yan, B.; Chen, G. Effects of torrefaction on the formation and distribution of dioxins during wood and PVC pyrolysis: An experimental and mechanistic study. J. Anal. Appl. Pyrolysis 2021, 157, 105240. [Google Scholar] [CrossRef]
  40. Berkowicz-Płatek, G.; Żukowski, W.; Wrona, J.; Wencel, K. Thermal decomposition of polyolefins under different oxygen content. Composition of products and thermal effects. Energy 2024, 295, 130987. [Google Scholar] [CrossRef]
  41. Al-Sagheer, F.; Ahmad, Z. Stabilizing poly(vinyl chloride) using its blends with poly(methyl methacarylate): Pyrolysis GC/MS studies. J. Hazard. Mater. 2014, 278, 584–591. [Google Scholar] [CrossRef]
  42. Yousef, S.; Eimontas, J.; Striūgas, N.; Zakarauskas, K.; Praspaliauskas, M.; Abdelnaby, M.A. Pyrolysis kinetic behavior and TG-FTIR-GC–MS analysis of metallised food packaging plastics. Fuel 2020, 282, 118737. [Google Scholar] [CrossRef]
  43. Peller, J.R.; Mezyk, S.P.; Shidler, S.; Castleman, J.; Kaiser, S.; Horne, G.P. The Reactivity of Polyethylene Microplastics in Water under Low Oxygen Conditions Using Radiation Chemistry. Water 2021, 13, 3120. [Google Scholar] [CrossRef]
  44. Cheng, L.; Gu, J.; Wang, Y.; Zhang, J.; Yuan, H.; Chen, Y. Polyethylene high-pressure pyrolysis: Better product distribution and process mechanism analysis. Chem. Eng. J. 2020, 385, 123866. [Google Scholar] [CrossRef]
Figure 1. Experimental procedure.
Fire 08 00262 g001
Figure 2. TG (a,b) and DTG (c,d) curves of flame-retardant PVC and PE insulation at various heating rates.
Fire 08 00262 g002
Figure 3. ln(β/T2) vs. 1000/T plots for pyrolysis activation energy at different conversion rates: (a) flame-retardant PVC; (b) flame-retardant PE.
Fire 08 00262 g003
Figure 4. Activation energy (Eα) variation with conversion rate (α) across pyrolysis stages of flame-retardant PVC and PE. (a) I-Stage, (b) II-Stage.
Fire 08 00262 g004
Figure 5. Kinetic curve fitting using different model functions for pyrolysis stages: (a) flame-retardant PVC; (b) flame-retardant PE.
Fire 08 00262 g005
Figure 6. Experimental and CART-predicted TG curves for: (a) flame-retardant PVC; (b) flame-retardant PE at different heating rates.
Fire 08 00262 g006
Figure 7. Infrared characteristics of pyrolysis gases from flame-retardant PVC and PE: (a,b) 3D infrared spectra; (c,d) gas characteristic peaks; (e,f) temperature-dependent absorption peak intensities.
Fire 08 00262 g007
Figure 8. TIC of pyrolysis products from flame-retardant PVC (a) and PE (b) detected via GC/MS at a heating rate of 10 K/min.
Fire 08 00262 g008
Figure 9. Comparative distribution of major chemical components in pyrolysis products of flame-retardant PVC and PE.
Fire 08 00262 g009
Table 1. Common kinetic mechanism functions.
ModelDifferential Form f(α)Integral Form g(α)
1D diffusion D1 1 / 2 α 1 α 2
2D diffusion-Valensi D-V2 ln 1 α 1 α + 1 α ln 1 α
3D diffusion-Jander D-J3 6 1 α 2 / 3 [ 1 1 α 1 / 3 ] 1 / 2 [ 1 1 α 1 / 3 ] 1 / 2
3D Zhuravlev-Leskin-Tempelman D-ZLT3 3 / 2 1 α 4 / 3 1 α 1 / 3 1 1 1 α 1 / 3 1 2
3D Ginstling-Brounstein D4 1 2 α / 3 1 α 2 / 3 3 1 α 1 / 3 1 1 / 2
Avarami–Erofeev A2 1 / 2 1 α ln 1 α 1 ln 1 α 2
Avarami–Erofeev A3 1 / 3 1 α ln 1 α 2 ln 1 α 3
Avarami–Erofeev A4 1 / 4 1 α ln 1 α 3 ln 1 α 4
Second-order chemical reaction F2 1 α 2 1 α 1 1
Third-order chemical reaction F3 1 α 3 1 / 2 1 1 α 2
First-order E1 α ln α
Second-order E2 1 / 2 α ln α 2
Contracting area R2 2 1 α 1 / 2 1 1 α 1 / 2
3D contracting volume R3 1 α 2 / 3 3 1 1 α 1 / 3
Table 2. Key pyrolysis parameters of flame-retardant PVC and PE insulation at various heating rates.
SampleHeating Rate/K min−1Tonset/KDTGpeak1/% min−1DTGpeak2/% min−1Tpeak1/KTpeak2/KMassresidue/%
PVC10480.037.222.06569.18710.2628.05
20493.7216.204.10586.33733.3428.29
30499.7126.795.81593.67754.5928.60
40502.4236.956.99601.78760.8928.84
PE10506.696.388.21566.12746.2039.83
20508.699.4316.23570.69756.6941.07
30515.2811.4621.91575.55761.5541.35
40521.5619.1034.80592.13768.1342.42
Table 3. Activation energy (Eα) variation with conversion rate (α) during pyrolysis stages of flame-retardant PVC and PE.
SampleαEα (kJ/mol)αEα (kJ/mol)
I-StageII-Stage
PVC0.1230.5560.1365.549
0.2209.0580.2310.331
0.3188.7640.3298.367
0.4181.2990.4292.96
0.5178.2370.5290.163
0.6176.1060.6289.179
0.7174.1450.7285.830
0.8172.0180.8282.729
0.9168.7940.9280.137
Mean value 186.553 299.472
PE0.198.1230.1276.985
0.296.5830.2323.913
0.3101.2300.3318.766
0.4108.7640.4314.861
0.5117.5850.5304.164
0.6124.8150.6298.374
0.7131.3870.7289.221
0.8136.8850.8278.504
0.9148.3230.9272.899
Mean value 118.188 297.521
Table 4. Infrared characteristic peaks and corresponding wavenumbers of volatile products from pyrolysis of flame-retardant PVC and PE.
SampleDescriptionWavenumbers (cm−1)
Flame-retardant PVCH2O4000–3500
C–H stretching2922
CO22400–2260
C–H aliphatic bending1458
C–H bending1240
C–Cl stretching660
Flame-retardant PEH2O4000–3500
C–H stretching2922, 2854
CO22400–2260
C=O & C=C stretching1652
CH2 scissor vibrations1460
C–H bending vibrations669
Table 5. GC/MS analysis of pyrolysis products from flame-retardant PVC and PE.
SampleRetention (min)ComponentFormulaChemical Family
PVC at 569.18 K2.56Hydrogen chlorideHClInorganic
4.66BenzeneC6H6Aromatics
9.553-Heptene, 3-methylC8H10Aromatics
Alkane
Alkane
10.05Heptene, 3-methylene-C8H16Alkene
11.82Arsenic trichlorideAsCl3Inorganic
18.09BenzaldehydeC7H6OAldehydes
21.97Heptane, 3-(chloromethyl)C8H17ClHaloalkane
23.611-Hexanol, 2-ehyl-C8H18OAlcohols
24.593-MethylphenylacethleneC9H8Aromatics
38.281,2-Benzenedicarboxytic acidC8H6O4Acid
PE at 566.12 K2.94PropeneC3H6Alkene
3.072-Butene, (E)-C4H8Alkene
3.48PentaneC5H12Alkane
4.291-Pentene,2-methyl-C6H12Alkene
6.521-HepteneC7H14Alkene
12.062,4-Dimethyl-1-hepteneC9H18Alkene
17.631-DeceneC10H20Alkene
17.93DecaneC10H22Alkane
21.064-Docame, 4-methyl-C12H24Alkene
21.261-Octene, 3,7-dimethylC10H20Alkene
21.601-TetradeceneC14H28Alkene
22.01UndecaneC11H24Alkane
25.89TetradecaneC14H30Alkane
28.063-Eicosene.(E)-C20H40Alkene
28.311-HeptadeceneC17H34Alkene
Disclaimer/Publisher’s Note: The statements, opinions and data contained in all publications are solely those of the individual author(s) and contributor(s) and not of MDPI and/or the editor(s). MDPI and/or the editor(s) disclaim responsibility for any injury to people or property resulting from any ideas, methods, instructions or products referred to in the content.

