Article

Numerical Investigation of Spontaneous Ignition During Pressurized Hydrogen Release: Effects of Burst Disk Shape and Opening Characteristics

1
College of Safety Science and Engineering, Nanjing Tech University, Nanjing 211816, China
2
Institute of Fire Science and Engineering, Nanjing Tech University, Nanjing 211816, China
3
Jiangsu Xuzhou Petroleum Branch, Sinopec Sales Co., Ltd., Xuzhou 221006, China
*
Authors to whom correspondence should be addressed.
Fire 2025, 8(7), 246; https://doi.org/10.3390/fire8070246
Submission received: 25 May 2025 / Revised: 22 June 2025 / Accepted: 23 June 2025 / Published: 26 June 2025

Abstract

Pressure relief devices are critical for the safe release of pressurized hydrogen. To address the risk of spontaneous ignition during a high-pressure release, three-dimensional (3D) numerical simulations are systematically conducted to investigate the effects of burst conditions on spontaneous ignition behavior. Eight simulation cases are considered, involving two opening processes (instantaneous and 10-step-like), three burst disk shapes (flat, conventional domed, and reverse domed), and five opening ratios (1, 0.8, 0.6, 0.4, and 0.2). The 10-step-like opening enhances jet turbulence and promotes flame merging between the boundary layer and jet front, intensifying combustion. Domed structures cause a high-velocity region behind the leading shock wave, altering jet front evolution. Compared with reverse-domed disks, flat and conventional domed disks generate stronger vortices and a larger shock-heated area, resulting in more severe combustion and elevated fire risk. As the opening ratio decreases, both shock wave strength and propagation velocity drop significantly, and spontaneous ignition does not occur. The opening ratio has minimal influence on the distance traveled by shock-induced heating. These findings offer meaningful guidance for the design and manufacture of pressure relief devices for the safe emergency release of hydrogen.

1. Introduction

Currently, the excessive use of traditional fossil fuels has brought serious issues of environmental pollution and energy shortage. Hydrogen, with its zero carbon emissions and high energy density, raises concern from all over the world. It has been regarded as one of the most promising solutions to the aforementioned challenges [1,2]. However, hydrogen also has many hazardous characteristics, such as high diffusivity, low ignition energy, and a wide flammability range, which can easily lead to spontaneous ignition during high-pressure release [3]. Thus, this paper seeks to reveal the influence mechanism of diverse burst conditions on the spontaneous ignition of high-pressure hydrogen and enhance the technical basis for hydrogen safety engineering.
In terms of hydrogen spontaneous ignition mechanisms, Wolanski and Wojciki [4] first proposed the Diffusion Ignition Theory in the 1970s, which is considered to be the most possible mechanism for hydrogen spontaneous ignition. It is believed that the high pressure can cause the hydrogen jet front to generate a leading shock wave, heating the gas mixture behind. When the temperature and the concentration of the mixture meet the ignition requirements, spontaneous ignition can be triggered.
Following the pioneering work of Wolanski and Wojciki [4], a number of experimental studies on spontaneous ignition and its influencing factors have been carried out. Dryer et al. [5] argued that the shock wave heating of the flammable hydrogen/air mixture in a tube was necessary for spontaneous hydrogen ignition and found that with the increase in tube length, the possibility of spontaneous ignition increased. It can also be seen that for the high-pressure hydrogen release (4–30 MPa) in experiments by Mogi et al. [6], the hydrogen jet tended to ignite in the tube with the increase of the tube length. Kitabayashi et al. [7] conducted experiments using relatively long tubes with lengths of 1.0–4.2 m and determined a critical length of 1.2 m for the extinction. Duan et al. [8] demonstrated that for tubes with diameters of 15 mm and 20 mm, spontaneous ignition was more likely to occur with small diameters. In addition, some other factors, such as the complicated structures of tubes [9,10,11], the existence of obstacles [12,13], and the gas additions [14,15], were also investigated, showing an evident effect on the occurrence of spontaneous ignition. The burst disk parameters are important factors as well. Grune et al. [16] used the Schlieren method to observe the flow field of hydrogen leaking through a fast valve and a burst disk, with opening times in the millisecond and microsecond ranges, respectively. They found that spontaneous ignition and shock waves can occur when hydrogen leaks through the burst disk, contrary to the fast valve. Golovastov and Bocharnikov [17] found that the faster rupture rate increased the possibility of spontaneous ignition, and three basic shock wave formation modes were identified, i.e., single-step, two-step, and three-step. Kaneko and Ishii [18] investigated the critical pressure for spontaneous ignition using burst disks of varying thickness and scores and improved the reproducibility of rupture conditions. Jiang et al. [19] recently found that the rupture conditions of the burst disk were significantly affected by the gasket with a slit, which in turn influenced both shock propagation and spontaneous ignition.
Additionally, numerical simulations have also been employed by many scholars as an effective research method to gain insights into the mechanisms of spontaneous ignition. For example, Wen et al. [20] simulated the release of highly pressurized hydrogen and found that slower rupture times and smaller release pressures increased the likelihood of spontaneous ignition. Xu et al. [21] numerically studied the effect of rupture rate on hydrogen spontaneous ignition, with results showing that reduced rupture rates induced earlier Mach shock development. Lee and Jeung [22] employed a realistic burst disk failure geometry assumption in direct numerical simulations, identifying shock reflections and interactions between shocks and boundary layers as the primary factors contributing to early ignition near the boundary. Asahara et al. [23] proposed two spontaneous ignition mechanisms, examining their locations and related instabilities through direct numerical simulation of two burst disk shapes (straight and curved). Bragin et al. [24] indicated that inertial rupture, compared with the instantaneous opening of the burst disk, altered the mixing process between shock-heated air and cold-expanding hydrogen. Terashima et al. [25] numerically studied the effect of diaphragm curvature on spontaneous ignition of high-pressure hydrogen in a two-dimensional (2D) rectangular duct. They found that unlike zero- and one-dimensional (0- and 1D) cases where no ignition occurred, ignition consistently appeared in 2D simulations, with its location and process influenced by the diaphragm shape. Gong et al. [26] found that ignition delay time/distance and combustion intensity decreased with increasing wall corner angle in square, pentagonal, and circular tubes. Sun et al. [27] simulated the hydrogen’s spontaneous ignition using four different burst disk shapes and found that the spontaneous ignition time of leaked hydrogen was proportional to the disk’s open area. Li et al. [28] also investigated the impact of burst disk shapes on the spontaneous ignition of pressurized hydrogen. They found that a higher rupture ratio intensified the shock wave and increased its speed, which accelerated adiabatic compression in the air and hydrogen–air mixture and caused earlier self-ignition.
In practical applications, pressure relief devices for pressurized hydrogen storage equipment may not always perform as intended due to varying burst conditions. Therefore, to enhance the safety design of such devices in hydrogen storage systems, it is necessary to conduct investigations on the mechanisms of spontaneous ignition of pressurized hydrogen release through tubes under diverse burst conditions. However, the influence of burst conditions on spontaneous ignition inside the tubes has not been fully elucidated and requires further study. In the present paper, a numerical study is conducted to investigate shock wave propagation, flow structures, and spontaneous ignition inside a tube. The effect of burst disks with various shapes and opening ratios is discussed and analyzed in detail. In particular, this work employs fully 3D modeling to better capture asymmetric flow features and ignition dynamics. Furthermore, a 10-step-like opening process is introduced to represent the staged rupture of real burst disks. Finally, the mechanism of spontaneous ignition is proposed, and the findings offer meaningful guidance for the design and manufacture of safer pressure relief devices in hydrogen storage systems.

2. Simulation Methods

2.1. Governing Equations and Numerical Models

In this study, the commercial CFD software ANSYS Fluent 2020 R2 was employed as the computational tool. During the process of pressurized hydrogen release and spontaneous ignition, the gas flow is assumed to behave as a continuous medium. Its behavior is governed by the 3D unsteady compressible Navier–Stokes equations, including conservation equations of mass (1), momentum (2), energy (3), and component transport (4), as presented below [29,30]:
ρ t + x i ρ u i = 0
t ρ u j + x i ρ u i u j = p x j + σ i j x i
t ρ E + x i ρ E + p u i = x i λ T x i + x i σ i j u j
t ρ Y s + x i ρ u i Y s = x i D s ρ Y s x i
where u is the velocity, ρ is the density, p is the static pressure, T is the temperature, λ is the thermal conductivity, E is the total energy, and Ys and Ds are, respectively, the mass fraction and diffusion coefficient of species. The stress tensor σij in Equation (2) is defined by
σ i j = μ u i x j + u j x i + μ b 2 3 μ u k x k δ i j
where μ is the dynamic viscosity, μb is the bulk viscosity, δij is the Kronecker delta, and the subscripts i, j, and k denote spatial directions in a 3D Cartesian coordinate system.
Compared with other numerical models, the Large Eddy Simulation (LES) exhibits excellent capability in resolving complex flow fields and capturing fine-scale turbulent structures during pressurized hydrogen release. This model has been validated against experimental data, successfully predicting the spontaneous ignition of high-pressure hydrogen release through pipes [31,32]. LES works by decomposing the flow field into large-scale vortices and small-scale turbulent fluctuations. The large-scale vortices are resolved directly through numerical simulation, while the small-scale turbulent motions are modeled using a Sub-Grid Scale (SGS) model. Furthermore, the Wall-Adapting Local Eddy-Viscosity (WALE) model was used to solve the sub-grid scale stress, and the Eddy Dissipation Concept (EDC) model was employed as the combustion model [31].

2.2. Computational Domain and Initial Conditions

Figure 1 illustrates the computational domain and initial conditions. The computational domain primarily consists of a high-pressure region and a downstream tube (representing the low-pressure region). The geometric models were created using ANSYS SpaceClaim 2020 R2. To reduce computational cost, the experimental high-pressure tank was simplified into a high-pressure region with a diameter of 10 mm and a length of 100 mm [29,33]. Additionally, to minimize the influence on shock wave propagation and ensure that the pressure drop within the high-pressure region remains below 3% [20], one end of the high-pressure region was defined as a constant pressure inlet. The downstream tube is 300 mm long with the same diameter. The tube outlet was set as a pressure outlet, and other wall boundaries were treated as non-slip, impermeable, adiabatic conditions. In this paper, a 3D mesh was created using the Poly-Hexcore Mosaic technique, which realizes layered poly grids near walls, pure poly grids in the transition region, and hexahedral grids in the core. This hybrid approach improves overall grid quality while reducing both the total number of grids and solution time.
The gas was treated as an ideal gas. The initial temperature was set to 300 K. In the high-pressure region, the hydrogen mass fraction was set to 1, and the initial pressure was 7 MPa. In the downstream tube, atmospheric conditions were considered (0.1 MPa, 23% O2, and 77% N2). The simulation employed a second-order explicit solution method. The flux type was set to Advection Upstream Splitting Method (AUSM), the gradient was calculated using the Green-Gauss Cell-Based (GGCB) scheme, and the time step was set to 10−8 s. To ensure numerical stability and convergence, the Courant number was set to 0.5.
This paper simulates the spontaneous ignition of pressurized hydrogen release through a tube with varying burst conditions. Therefore, two opening processes (instantaneous and 10-step, like opening), three shapes (flat, conventional domed, and reverse domed), and five opening ratios (1, 0.8, 0.6, 0.4, and 0.2) of burst disks are modeled. Table 1 lists the key information of different simulation cases.
Note that in Cases 1–8, the burst disk opening is approximated by the 10-step-like process, with the opening time estimated as t = k ρ b b d / p b 1 / 2 [34], where k is a constant ranging from 0.91 to 0.93 [35], and ρb, b, and d are the density, thickness, and diameter of the Ni-made burst disk, respectively. pb is the burst pressure. In Cases 2–4, the initial conditions are the same, with the only variable being the burst disk shape. This enables an analysis of the influence of different boundary geometries. In Cases 2, 5, 6, 7, and 8, the burst disks open in the same sequence but vary in opening ratios, allowing for investigation into their effects on shock wave propagation and spontaneous ignition of high-pressure hydrogen within the same tube. Figure 2 illustrates the specific opening processes and the corresponding opening times for each section in all cases. Based on the calculated opening times for each section, the full opening time for each case is determined as follows: Case 1–0 µs (instantaneous opening), Case 2–4–44.40 µs, Case 5–35.52 µs, Case 6–22.20 µs, Case 7–13.32 µs, and Case 8–4.44 µs. Four monitoring points were arranged based on the experimental setup [33], as depicted in Figure 3. These points were used to record parameters such as pressure and velocity, allowing for analysis of their dynamic evolution.

2.3. Grid Independence and Model Validation

A grid independence analysis was performed to test the effect of the grid resolution. In the simulation, the maximum grid length δx in the downstream tube was varied across three values to assess its impact on the results. The grid size was set to 0.2 mm near the burst disk and gradually increased along both the upstream and downstream directions. The results of the grid independence test are presented in Figure 4a, which shows the velocity distribution along the centerline at the initial leakage stage (t = 40 μs) in a straight tube. When δx increased from 0.4 to 0.6 mm, the axial velocity profile remained nearly unchanged, indicating grid convergence. However, when δx was further increased to 0.9 mm, the total number of grids was significantly reduced, and the grid quality deteriorated, resulting in noticeable discrepancies in the axial velocity distribution. Therefore, a maximum grid length of 0.6 mm was selected for this study, which offered a balanced compromise between simulation accuracy and computational efficiency. To verify the accuracy of the simulation, the numerical results were compared against experimental pressure data obtained at monitoring point P1 under an initial hydrogen pressure of 7 MPa, as reported by Pan et al. [33]. As shown in Figure 4b, despite some fluctuations, the simulation results closely follow the experimental trend, indicating that the model predictions are reasonably accurate and within an acceptable range.

3. Results and Discussion

3.1. Effects of Varying Opening Processes on Shock Wave Propagation and Spontaneous Ignition

When pressurized hydrogen is released into the downstream tube through a ruptured burst disk, a strong shock wave forms at the leading edge of the under-expanded hydrogen jet. In experimental studies, the shock formation process takes place within the short distance between the first pressure sensor and the burst disk, making it challenging to capture using pressure sensors. Hence, numerical simulations are essential to gain a more detailed understanding and analysis of this phenomenon. Figure 5 shows the shock wave formation under both the instantaneous and 10-step-like opening processes of the burst disk.
In Figure 5a, the instantaneous removal of the pressure boundary at t = 0 μs—without accounting for the gradual opening of the burst disk—leads to the rapid formation of a planar shock wave within the tube. This shock wave propagates downstream with relatively uniform intensity and velocity. A hydrogen jet emerges behind the shock front; as the shock wave moves faster than the jet, the distance between them gradually increases. Initially, mixing between hydrogen and air is limited to the jet’s leading edge. Up to t = 10 μs, the hydrogen jet maintains a shape closely aligned with that of the shock wave. Subsequently, instabilities develop at the boundary layer interface, causing the jet to develop a fingertip-like morphology.
As shown in Figure 5b, under the 10-step-like opening process, the staged fragmentation of the burst disk results in high-pressure hydrogen gradually infiltrating the tube under strong expansion forces. The hydrogen diffuses axially and radially, forming a concentration gradient around the mixing layer at the jet’s periphery. At t = 5 μs, a hemispherical shock structure emerges ahead of the jet and rapidly propagates toward the tube walls, where reflections occur due to geometric confinement. These reflected shocks redirect along the jet’s propagation axis and eventually converge to form barrel-shaped shocks. By t = 20 μs, a characteristic Mach disk appears. The interaction of barrel-shaped shocks produces triple points along the wavefront. As the hydrogen jet passes through the Mach disk, it undergoes a rapid velocity drop and a corresponding pressure rise, resulting in a high-velocity area upstream and a low-velocity area downstream of the Mach disk. Velocity contour plots further reveal that the high-velocity area develops along the tube walls, forming symmetrically extended high-velocity flows. The velocity difference between this high-velocity periphery and the central low-velocity zone causes a concave deformation at the jet front. As rupture continues, the position of the Mach disk shifts from an initial distance of approximately 7.1 mm from the rupture section to nearly 8.5 mm, consistent with the findings of Jin et al. [36]. At t = 55 μs, upon complete rupture, the hydrogen jet fully expands to match the tube’s inner diameter, which reduces the expansion angle at the wall and ultimately leads to the disappearance of the Mach disk. Simultaneously, the barrel shock divides into three segments, a phenomenon explained by Gong et al. [35] as the transition from Mach reflection to regular reflection. This results in the formation of planar shock fronts that travel downstream ahead of the main flow. These shock fronts exhibit bulging leading edges and tapering rear profiles due to high axial velocities and lateral expansion. Such deformation enhances turbulent mixing at the hydrogen–air interface, thereby increasing the formation of concentrated mixture layers and improving overall mixing efficiency.
Unlike the instantaneous opening, the 10-step-like opening leads to the successive emission and accumulation of multiple shock waves during the initial formation stage. This results in the generation of complex shock structures, including bucket-shaped shock waves and Mach disks. Meanwhile, a symmetrical high-velocity area develops radially from the shock wave interaction zone, while a low-velocity area persists along the central axis. This dynamic gives rise to an inward-facing hydrogen jet shaped by the surrounding shock waves. As the rupture process completes, these multi-dimensional shock structures gradually dissipate, and the overall shock front transitions into a planar positive shock wave. This planar shock wave then continues propagating downstream, sequentially passing through the designated monitoring points.
Figure 6 shows the shock overpressure recorded at the monitoring points under different opening processes. It demonstrates that the characteristic pressure variations associated with shock waves can be effectively captured in both opening processes. Initially, as the positive shock wave reaches each monitoring point, a rapid increase in pressure is observed. At monitoring point P1, the pressure profile differs significantly between the two opening processes: in the instantaneous opening (Case 1), the pressure rises abruptly, whereas, in the 10-step-like opening (Case 2), the pressure increase exhibits a stepped pattern, ultimately reaching a local peak. This is attributed to the sequential generation and superposition of compression waves during the staged opening of the burst disk, which gradually coalesce into a planar shock wave. As the shock wave continues to propagate downstream, the pressure at P1 in Case 2 shows a local dip, primarily caused by the influence of a residual Mach disk structure moving downstream, leading to a brief pressure decrease. This phenomenon is absent at subsequent monitoring points, suggesting that the Mach disk structure dissipates entirely. Following this, the pressure at each monitoring point follows a smoother rise and fall profile. Notably, Case 1 exhibits a consistent increasing trend, while Case 2 demonstrates a slight attenuation, likely due to energy losses from wall friction, fluid viscosity, and air resistance. Eventually, as the under-expanded hydrogen jet arrives, accompanied by expansion waves within it, a renewed pressure increase is detected, which gradually stabilizes. The timing of shock wave arrivals at each monitoring point is also indicated in Figure 6. While the shock wave reaches P1 more slowly in Case 2 due to the gradual rupture process, its propagation speed surpasses that of Case 1 once stabilized. This acceleration is attributed to the earlier superposition of multi-dimensional shock wave structures, which enhance the overall shock wave intensity.
A comparison of the temperature contour plots for Cases 1 and 2 at different times is shown in Figure 7. After the shock wave stabilizes, the temperature distribution in the heated region becomes comparable under both opening processes. In Case 1, the shock wave propagates downstream, and the region it traverses experiences a significant rise in air temperature. As the hydrogen jet interacts with the tube wall in the boundary layer, friction causes a gradual reduction in jet velocity, resulting in further temperature increase. According to the work of Morii et al. [13], ignition can be determined based on the local temperature exceeding 2000 K; thus, ignition is first observed at t = 75 μs. Additionally, the hydrogen–air mixture at the jet boundary undergoes heating due to the shock wave, leading to ignition at the center of the tube. However, the flame propagation along the boundary layer remains slow, and the two ignition sites do not merge. In Case 2, the hydrogen jet exhibits a higher degree of turbulence, and disturbances induced by Kelvin–Helmholtz instability appear at the boundary layer. Ignition is observed at the boundary layer at t =100 μs, followed by ignition at the jet front at t = 125 μs. These ignition sites subsequently merge, forming a flame that spans the full cross-section of the tube. It is evident that under both opening processes, the temperatures at the boundary layer and at the jet interface reach levels sufficient to trigger ignition within the spontaneous ignition delay time. However, the staged opening in Case 2 enhances jet turbulence, promoting flame merging between the boundary layer and the jet front, thereby intensifying the combustion process.
The distance between the leading shock wave and the hydrogen front defines the extent of the shock-induced heating region, where the temperature of the hydrogen–air mixture is elevated. Since the shock wave propagates faster than the hydrogen jet, the high-temperature region progressively expands, prolonging the exposure of the mixture to elevated temperatures and thereby facilitating spontaneous ignition. Figure 8 shows the evolution of this distance under both opening processes. In Case 1, a stable planar shock wave is established at t = 0 μs, and the length of the heating region increases approximately linearly. The shock structure remains simple and well-defined, resulting in a relatively smooth development of the heating region. In contrast, Case 2 exhibits a different trend during the initial stage. As the burst disk undergoes staged rupture, it generates a sequence of weak compression waves rather than a single strong shock. During this early phase, the shock wave propagates more slowly and remains relatively close to the hydrogen front. At t = 25 μs, the heating region is markedly shorter compared with Case 1. However, as the multi-dimensional shock structures evolve and a planar shock wave forms, the leading shock wave accelerates, and the distance from the hydrogen front increases. Consequently, the heating region in Case 2 develops more significantly over time. These findings suggest that the 10-step-like opening, by generating stronger shock interactions and increasing the separation between the shock front and the hydrogen jet, promotes a longer heating zone. This condition is more favorable for triggering spontaneous ignition under otherwise identical circumstances.

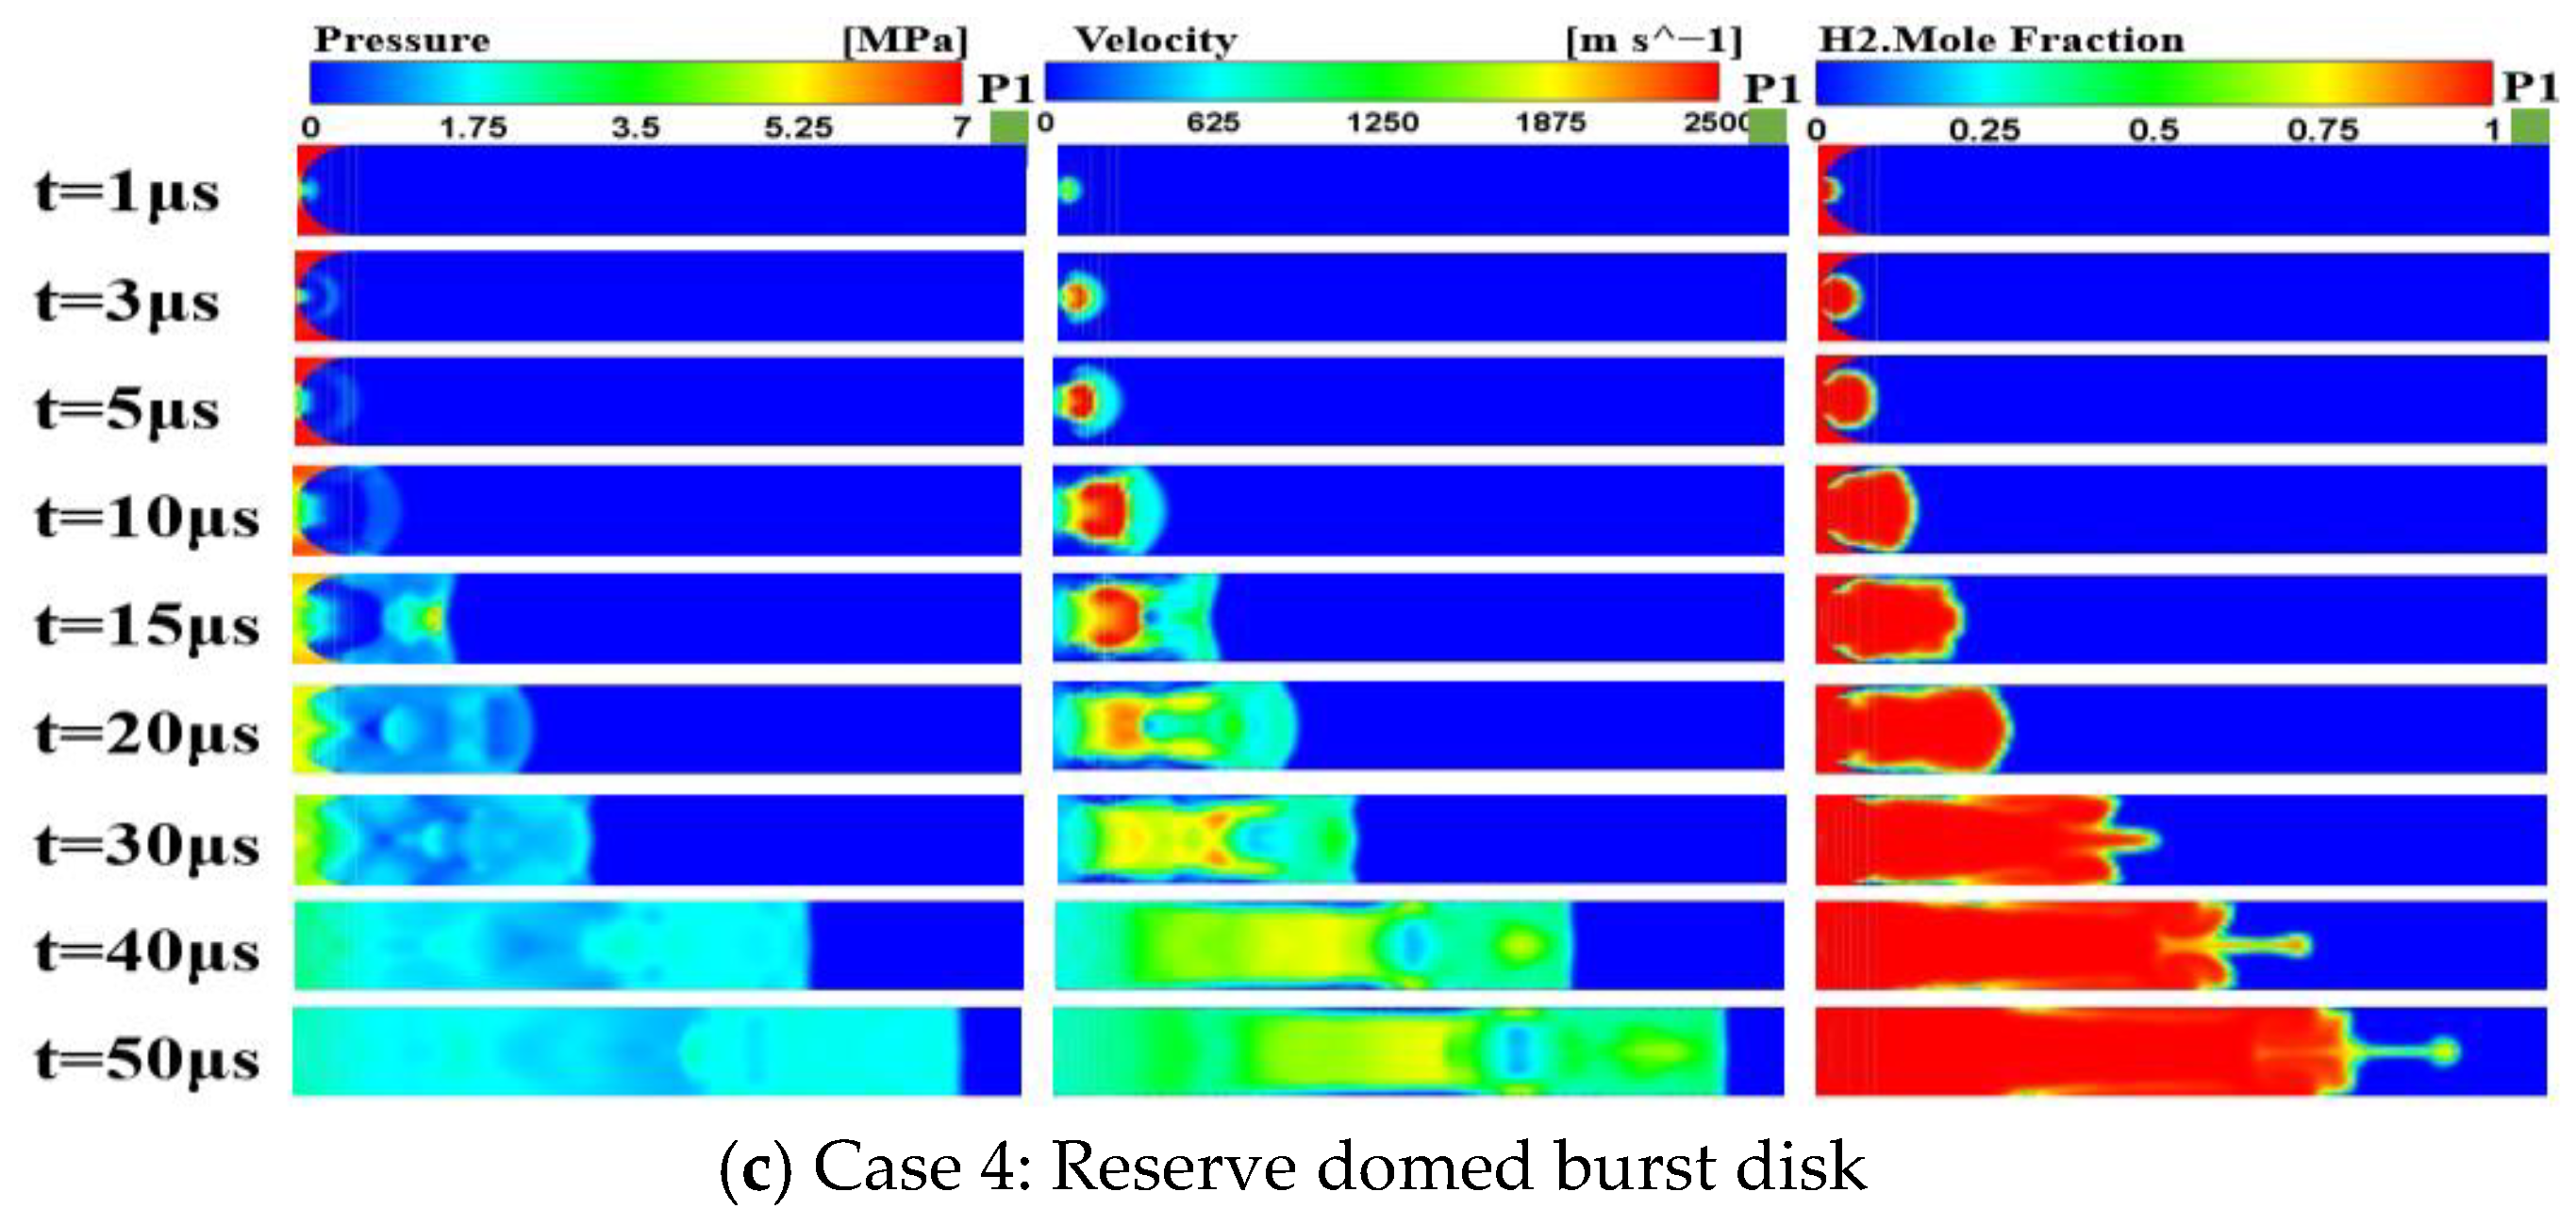
3.2. Effects of Varying Burst Disk Shapes on Shock Wave Propagation and Spontaneous Ignition

Figure 9 illustrates the flow field within 65 mm downstream of the burst disk, depicting the behavior of high-pressure hydrogen jets following rupture through three distinct burst disk shapes under the same release pressures. The sudden rupture of the burst disk produces an expanded pressure boundary, inducing the high-pressure hydrogen to undergo Prandtl–Meyer expansion. This results in a rapid outward flow and the formation of a hemispherical shock wave at the jet front. At t = 10 μs, this hemispherical shock wave impinges on the tube wall, generating a reflected shock wave that locally increases the pressure. By t = 20 μs, a Mach disk forms, suggesting that the emergence of this structure is largely independent of the burst disk shape. As hydrogen passes through the Mach disk, there is a sharp increase in pressure accompanied by a decrease in velocity. Downstream, the hemispherical shock wave evolves progressively into a planar (positive) shock wave.
Although the shock wave structures captured under the three burst disk shapes are similar, there are several significant differences. First, in Case 4, the hemispherical shock wave reflects off an unruptured portion of the burst disk during its radial propagation. This reflection produces an inclined shock wave that converges more closely toward the axis, intersecting with the initial hemispherical shock. This interaction generates a larger overpressure at the shock front at t = 15 μs. Second, the arched burst disk introduces a slight deviation in the shock wave propagation direction compared with that of a flat disk. This effect is particularly noticeable in the high-velocity area formed behind the leading shock wave, where successive wall reflections of the inclined and hemispherical shock waves coalesce into a planar shock, altering the jet front’s morphology. Finally, variations in burst disk curvature lead to significant differences in the diameter of the resulting Mach disk and in the extent of the low-velocity area downstream of it, thereby affecting the propagation speed of the shock wave during its formation.
In shock tube flow theory, the gas is treated as an ideal gas, and the effects of viscosity are neglected. Under this assumption, the theoretical values of the shock wave Mach number (Msw) and the post-shock pressure (p2) in the tube can be calculated using the following one-dimensional gas dynamics equations [37]:
p 3 p 1 = 1 + 2 γ 1 γ 1 + 1 M s w 2 1 1 γ 3 1 γ 1 + 1 a 1 a 3 M s w 1 M s w 2 γ 3 γ 3 1
p 2 p 1 = 2 γ 1 M s w 2 γ 1 1 γ 1 + 1
where p3/p1 is the initial hydrogen to atmospheric air pressure ratio when the burst disk is ruptured, γ1 and γ3 are the specific heat ratios of air and hydrogen, respectively, and a1/a3 is the ratio of air to hydrogen speed of sound.
Figure 10 presents the shock overpressure in the tube for the three burst disk shapes. In all three cases, the simulated positive shock overpressure in the tube closely matches the theoretical value of 1.94 MPa; however, it exceeds the theoretical prediction during the continuous rising phase. This is because the theoretical model based on one-dimensional gas dynamics assumes an instantaneous disappearance of the pressure boundary. Actually, the high-pressure hydrogen leaks through a gradually rupturing boundary. This staged rupture process leads to the formation of multi-dimensional shock structures, which intensify due to repeated reflection and coalescence.
Regarding the arrival time of the positive shock wave at the first monitoring point, both Cases 3 and 4 exhibit earlier arrival than Case 2. This can be attributed to the arched structures promoting increased reflection and merging during the shock formation stage, thereby accelerating the formation of the positive shock wave. The primary distinction between Cases 3 and 4 lies in the initial position of the high-pressure hydrogen: in Case 4, it lags slightly behind that in Case 3 due to the opposite curvature of the arch affecting the compression direction. Once a stable positive shock wave is formed, it propagates downstream with little variation in speed across different cases, arriving at each subsequent monitoring point at approximately t = 41–42 μs. The overpressure values recorded at corresponding monitoring points are comparable across burst disk shapes. When the positive shock wave passes a monitoring point, the pressure rises to nearly 2 MPa, with peak overpressures reaching approximately 3 MPa. Thus, it can be inferred that while the shape of the burst disk has minimal influence on the strength and velocity of the stabilized shock wave, it significantly affects the hydrogen jet behavior and the vortical structure development.
Figure 11 shows the development of hydrogen spontaneous ignition under different burst disk shapes. It can be seen that the burst disk shape has minimal influence on the temperature in the shock wave-affected region. This is mainly because high-pressure hydrogen leaks through various pressure boundaries, resulting in little difference in the overall intensity of the formed shock waves. As the shock wave propagates downstream, a localized high-temperature region first appears at the boundary layer. This indicates that spontaneous ignition of hydrogen occurs near the tube wall, likely due to the combined effects of shock wave-induced heating and frictional heating at the boundary. In addition to the boundary layer ignition point, vortical structures also form near the center of the tube. In Case 2, the presence of a high-velocity region near the boundary layer causes the hydrogen jet front to adopt a concave shape. As time progresses, this concavity becomes more pronounced. The flame anchors along the interface between the hydrogen jet and ambient air, where the extended jet edges mix intensively with air, leading to more vigorous combustion. In Cases 3 and 4, the hydrogen jet front exhibits a convex or forward-bulging shape. The flame similarly attaches to the jet–air interface and merges with the ignition region near the boundary layer, forming a continuous flame front that spans the tube cross-section. The comparison of hydrogen jet morphology reveals that flat and conventional domed burst disks tend to generate more vortices, resulting in greater turbulence within the hydrogen jet. In contrast, the reverse-domed burst disk produces less turbulent flow, leading to comparatively lower flame intensity.
The high temperature in the shock-affected region can preheat the air ahead of the hydrogen jet and induce spontaneous ignition of the hydrogen–air mixture. Figure 12 shows the distance between the leading shock wave and the hydrogen jet front under various burst disk shapes. Because the shock wave propagates faster than the hydrogen jet, this distance continuously increases over time. By comparison, it is found that the reverse domed burst disk results in the smallest gap between the leading shock wave and the hydrogen front. Consequently, the hydrogen jet experiences less preheating from the shock wave, reducing the likelihood of spontaneous ignition.

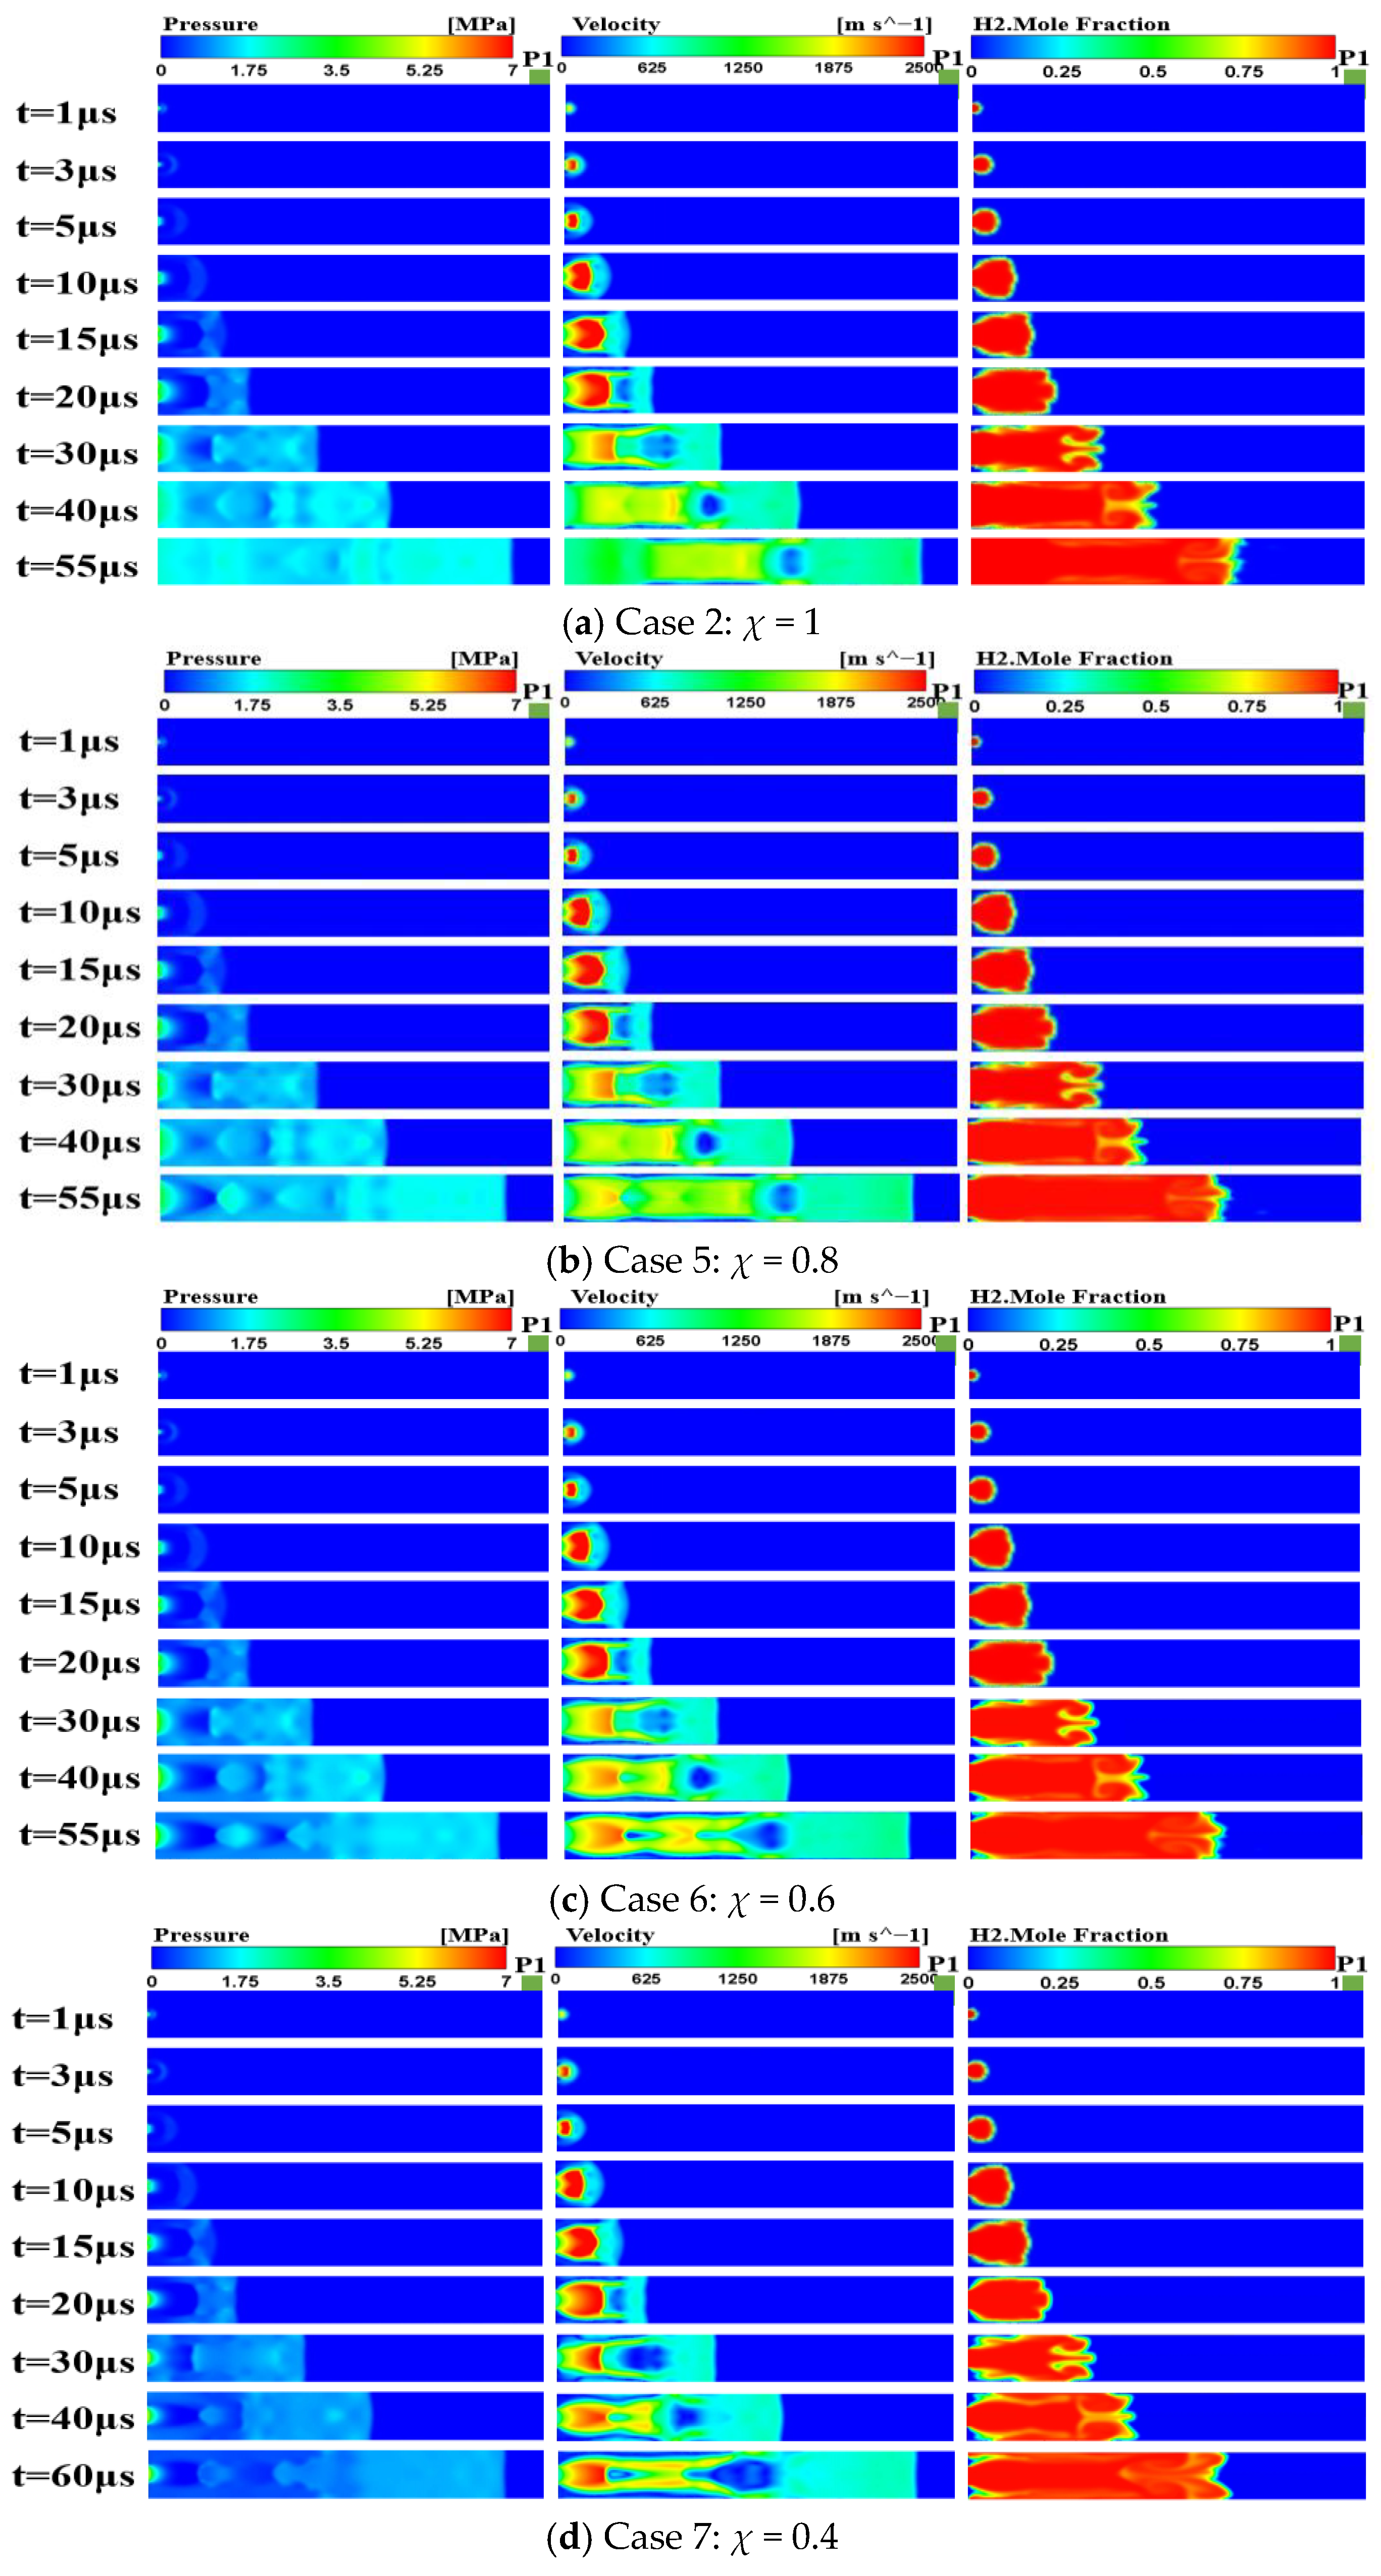
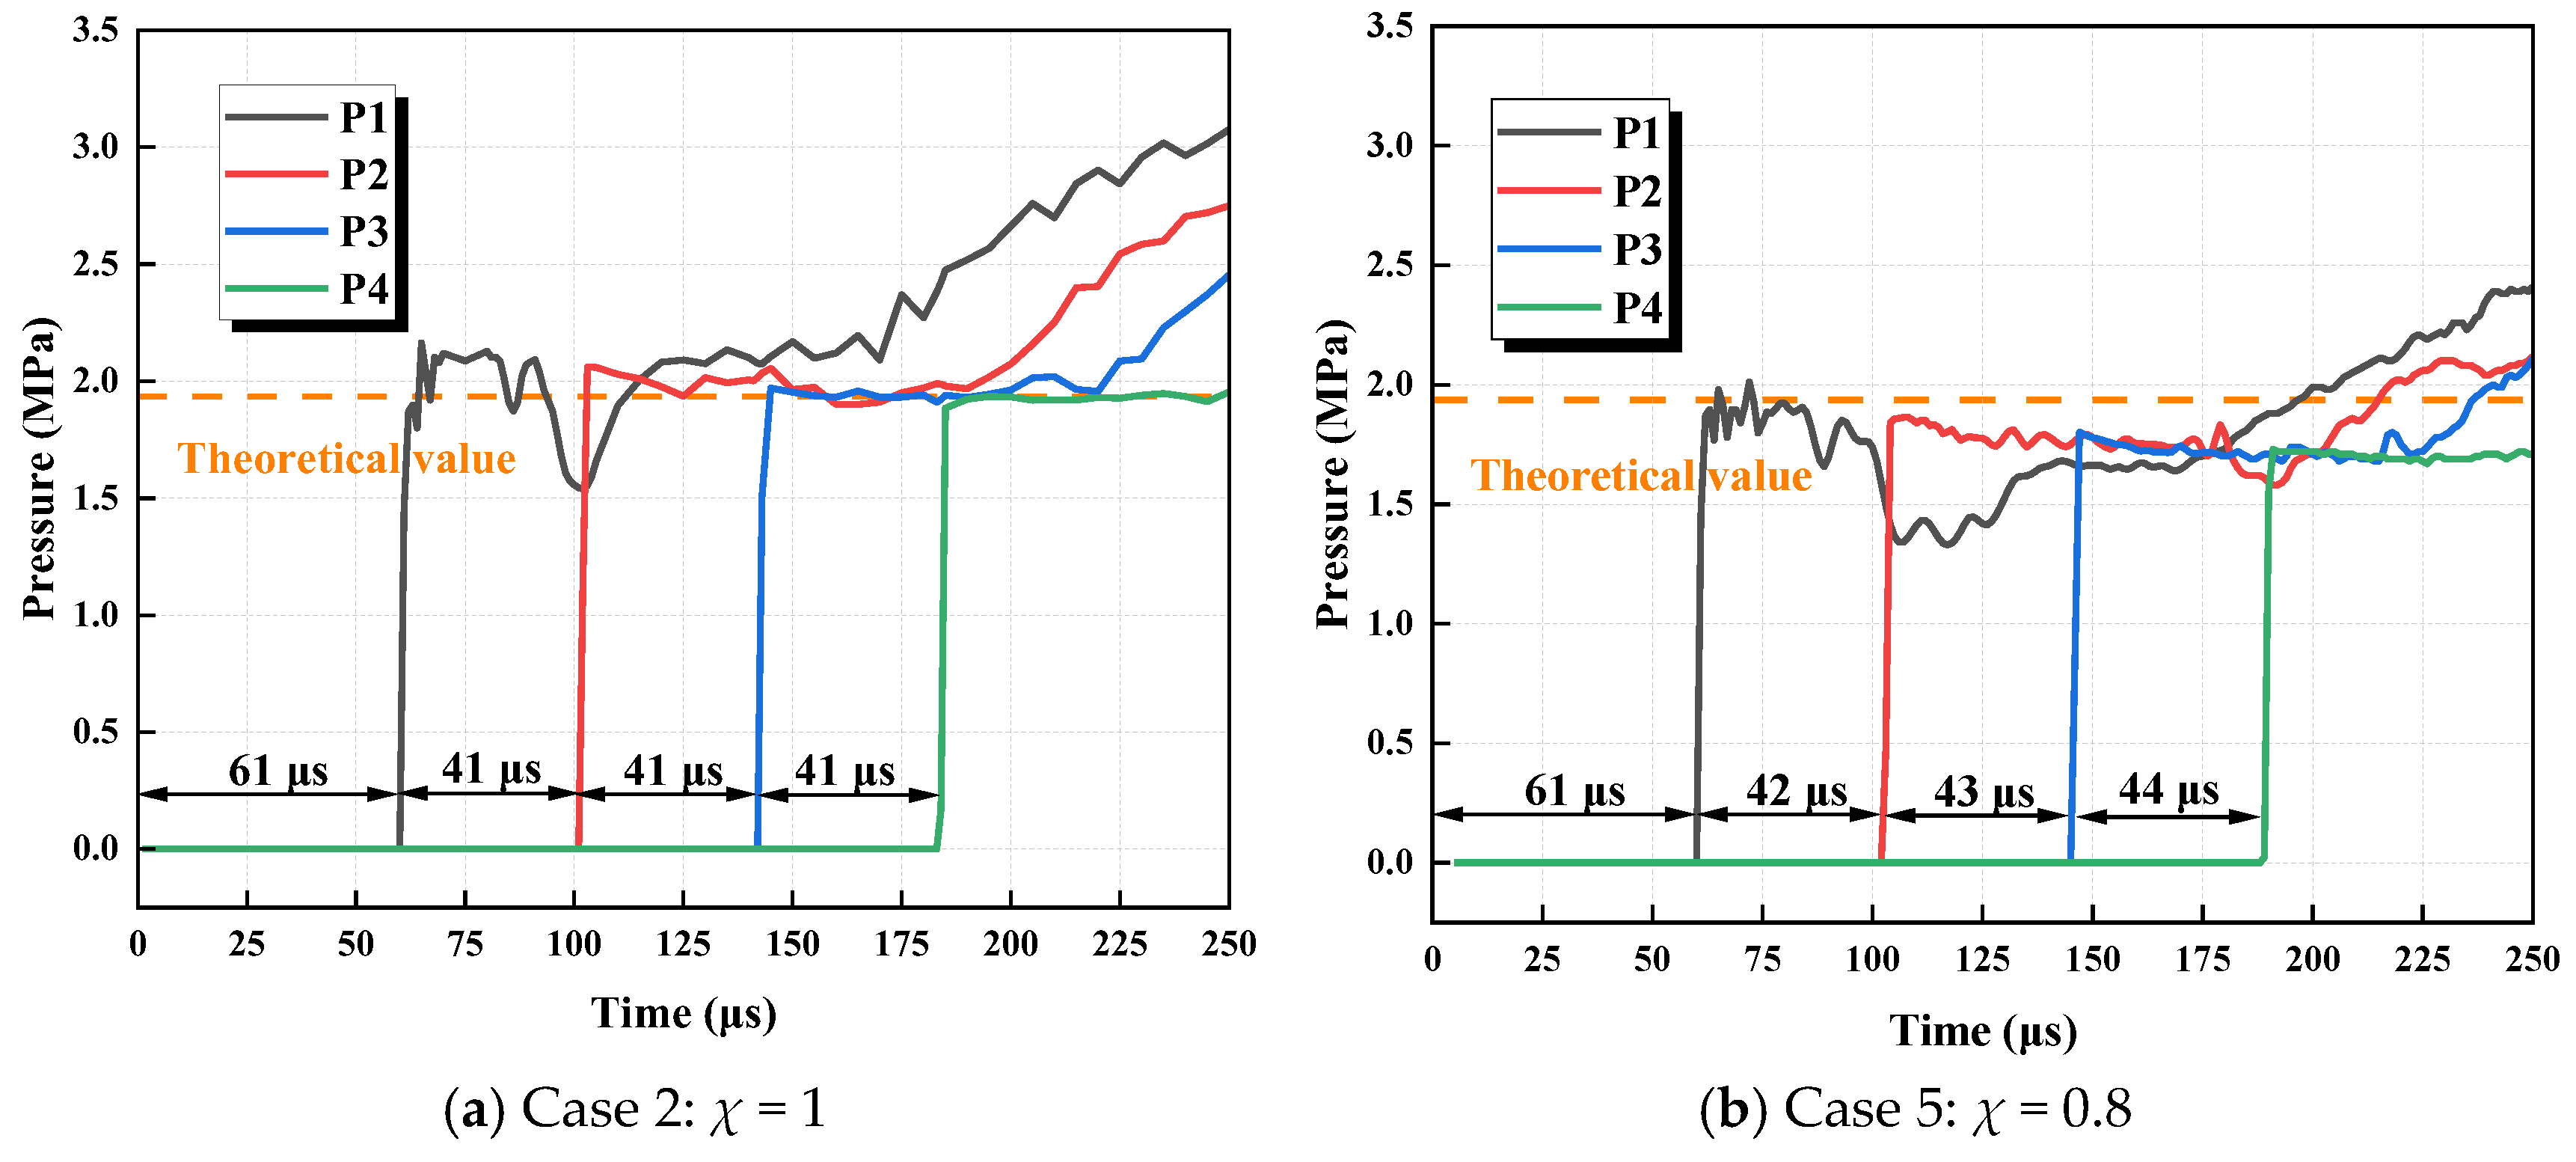
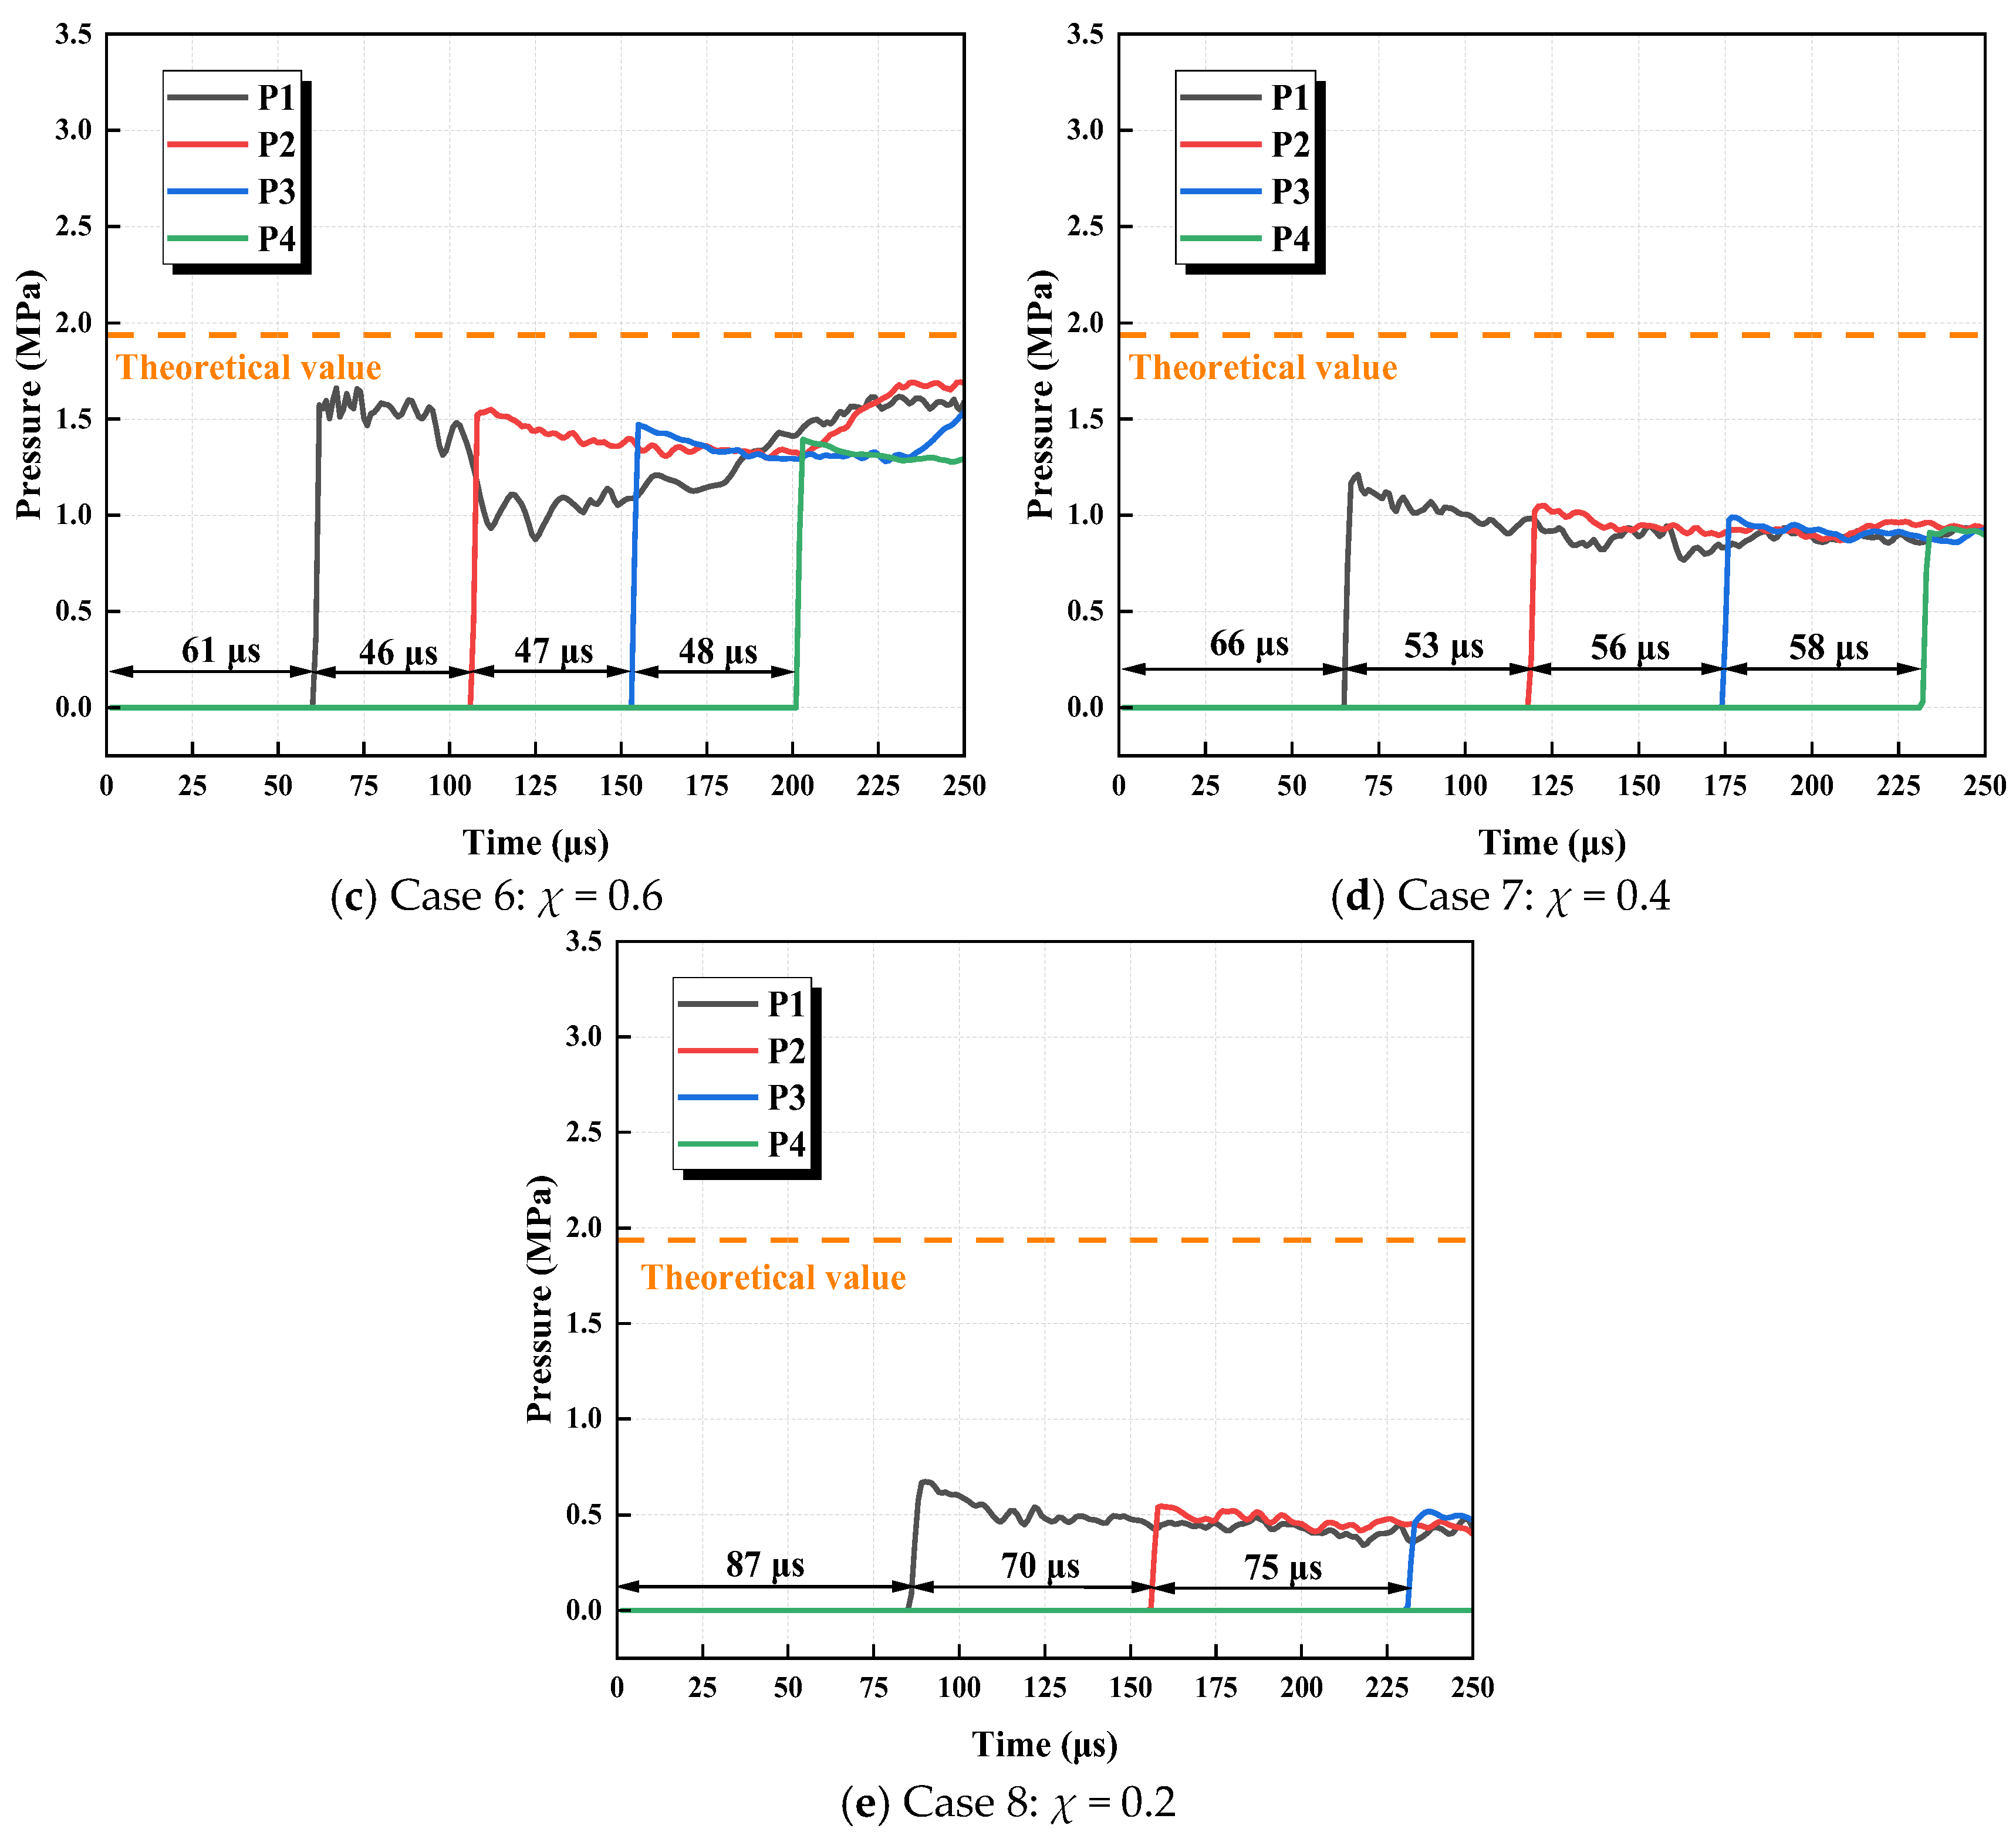
3.3. Effects of Varying Opening Ratios on Shock Wave Propagation and Spontaneous Ignition

Figure 13 presents the shock wave formation process at different burst disk opening ratios. Upon the initial rupture of the pressure boundary, the flow field structure in all working conditions resembles that of Case 2. The burst disk rupture causes the release of compressed hydrogen into the relatively open space of the tube. Due to rapid expansion, a pressure gradient forms at the leakage point, generating a hemispherical shock wave that propagates both axially and radially. As the shock wave front reaches the tube wall, it reflects, and a Mach disk structure emerges by t = 20 μs. The upstream and downstream regions of the Mach disk exhibit significant differences in pressure and velocity, and its size increases with the opening ratio. At t = 30 μs, the symmetrical high-velocity area in Case 2 progressively extends toward the central axis, eventually merging at t = 40 μs to form a second Mach disk. The velocity at this point increases sharply. The high-velocity areas propagating downstream on both sides no longer merge, and the initial Mach disk at the tube mouth gradually dissipates as the burst disk fully ruptures. These observations align with the findings of Gong et al. [35]. However, if the burst disk does not rupture completely, the initial Mach disk at the pressure boundary stabilizes and persists over time. The merge of high-velocity areas and repeated formation of Mach disks can occur cyclically. It is also found that both the intensity and propagation speed of the shock waves increase with a larger opening ratio during the shock formation. The examination of the hydrogen molar fraction distribution shows that upon burst disk rupture, high-pressure hydrogen rapidly expands radially and adheres to the tube wall. The air near the burst disk, constrained along the wall, forms an “air pocket”. Hydrogen and air within this region gradually mix and connect with the downstream mixing zone, creating an enlarged boundary mixing region. Within it, the presence of a sufficiently concentrated hydrogen–air mixture—when exposed to shock-induced heating—can easily lead to spontaneous ignition. It can be found that the volume of this boundary mixing region is inversely proportional to the opening ratio.
Figure 14 compares the shock overpressure in the tube under different opening ratios with the theoretical shock wave intensity, assuming the same initial conditions. As expected, when the opening ratio χ = 1 (Case 2), the shock overpressure behavior is consistent with the earlier analysis and closely matches the theoretical value at the initial stage, with a subsequent increase due to staged rupture effects. In the case of χ = 0.8 (Case 5), the initial positive shock overpressure is slightly below the theoretical value, yet the shock intensity still exceeds this estimate during the continuous rise. As the opening ratio decreases further, the shock overpressure in the tube becomes significantly lower than the theoretical value. Obviously, a reduction in the pressure boundary opening ratio leads to a marked decrease in shock wave intensity within the tube, thereby mitigating the heating of the hydrogen–air mixture and reducing the likelihood of spontaneous ignition.
Furthermore, in terms of the arrival times of shock waves at different monitoring points, it is found that the time interval for the first monitoring point is longer than for subsequent ones. On the one hand, the distance between the first monitoring point and the pressure boundary is slightly greater than the spacing between subsequent monitoring points. On the other hand, during the rupture of the pressure boundary, the shock wave is initially weak as it forms a stable positive shock. Thus, the initial propagation velocity is relatively low. Once the positive shock wave stabilizes, both its intensity and velocity tend to remain constant during downstream propagation. For Case 2, the shock wave arrives at the four monitoring points at 61 μs, 102 μs, 143 μs, and 184 μs, respectively. However, as the opening ratio decreases, the time intervals at each monitoring point increase. Within 250 μs, the shock wave does not reach monitoring point P4, indicating that the shock wave propagation velocity decreases as the opening ratio decreases. By calculating the ratio of the distance between monitoring points to the corresponding propagation time, the mean shock wave velocity for each opening ratio is determined, as shown in Figure 15. Overall, the shock wave propagation velocity exhibits a consistent developmental trend across different opening ratios. When the opening ratio is χ ≥ 0.6, the mean velocity during the shock wave formation stage remains similar across cases. In this range, the shock wave forms stably and propagates downstream with a gradual decrease in velocity. It becomes more pronounced at lower opening ratios, primarily due to the combined effects of fluid viscosity and boundary layer interactions, which attenuate the shock wave intensity and slightly reduce its propagation velocity.
Figure 16 shows the mean overpressure of the shock wave within 250 μs and the mean propagation velocity after stabilization (P2–P4) as functions of the opening ratio. As it increases, both the mean shock wave intensity and propagation velocity exhibit a gradual increase. However, no clear linear relationship is observed between these parameters and the opening ratio, and the rate of increase progressively diminishes.
During the shock formation phase, the mixing-related properties remain largely stable. As the flow propagates downstream, the jet structure slightly changes. Figure 17 shows the development of hydrogen spontaneous ignition under various opening ratios. A reduced opening ratio significantly influences shock wave intensity and weakens its heating effect on the surrounding air. In Cases 6 and 7, there is a temperature rise outside the barrel’s shock wave at t = 75 μs, but this temperature rise vanishes by t = 100 μs. This phenomenon occurs as the air within the “air pocket” mixes with the hydrogen jet, leading to brief ignition. Yet, due to limited air availability, combustion is not sustained and is subsequently extinguished. In Case 8, the mixture within the “air pocket” connects with the downstream mixing region, forming a larger boundary mixing zone. Within the jet, numerous vortex structures develop, generating localized regions with sufficient mixed gas concentrations, which are easy to induce spontaneous ignition when heated by shock waves. As the opening ratio increases, the vortex structures become smaller, reducing mixing efficiency and resulting in more unreacted mixtures appearing at the front of the hydrogen jet. Combined with the effects of shock wave intensity and vortex-induced hydrogen–air mixing, Case 2 shows more intense combustion, with temperatures at the tube wall and jet contact surface exceeding 2800 K. Cases 5 and 6 both exhibit long and narrow boundary layer combustion zones, with central tube temperatures around 2500 K. Notably, the high-temperature region in Case 6 is even thinner. In Case 7, only localized high-temperature points appear within the boundary layer. Although Case 8 produces more vortices, the relatively weak shock wave results in a high-temperature region forming only at the jet front—insufficient to initiate ignition.
Figure 18 shows the distance difference between the leading shock wave and the hydrogen front under various opening ratios. It is found that the opening ratios have a limited effect on the overall range of shock wave influence. After the shock wave stabilizes, the length of the region heated by it generally exhibits linear development. However, due to differences in shock wave intensity, the mixture heated by the shock wave still displays varying ignition behaviors.

4. Conclusions

This paper presents a numerical investigation of the effect of burst conditions on the spontaneous ignition of high-pressure hydrogen in a straight tube. Major findings are as follows:
(1)
When the burst disk opens instantaneously, a flat positive shock wave is generated with relatively uniform intensity and propagation velocity. The hydrogen jet exhibits fingertip-like oscillations along the boundary layer and ignites at both the tube wall and the central axis. Under the 10-step opening hypothesis, a multi-dimensional shock structure evolves into a stable leading shock wave. In the early stages, compression waves induce multi-step overpressure increases at monitoring points. The jet displays enhanced turbulence, a more pronounced heating region, and intensified combustion, resulting in a flame that spans the tube cross-section.
(2)
The arch structure creates a distinct high-velocity area behind the leading shock wave, altering the jet front shape. Compared with the reverse-domed burst disk, both flat and conventional domed burst disks produce more vortices, enlarge the shock wave heating area, intensify combustion, and consequently increase the fire risk.
(3)
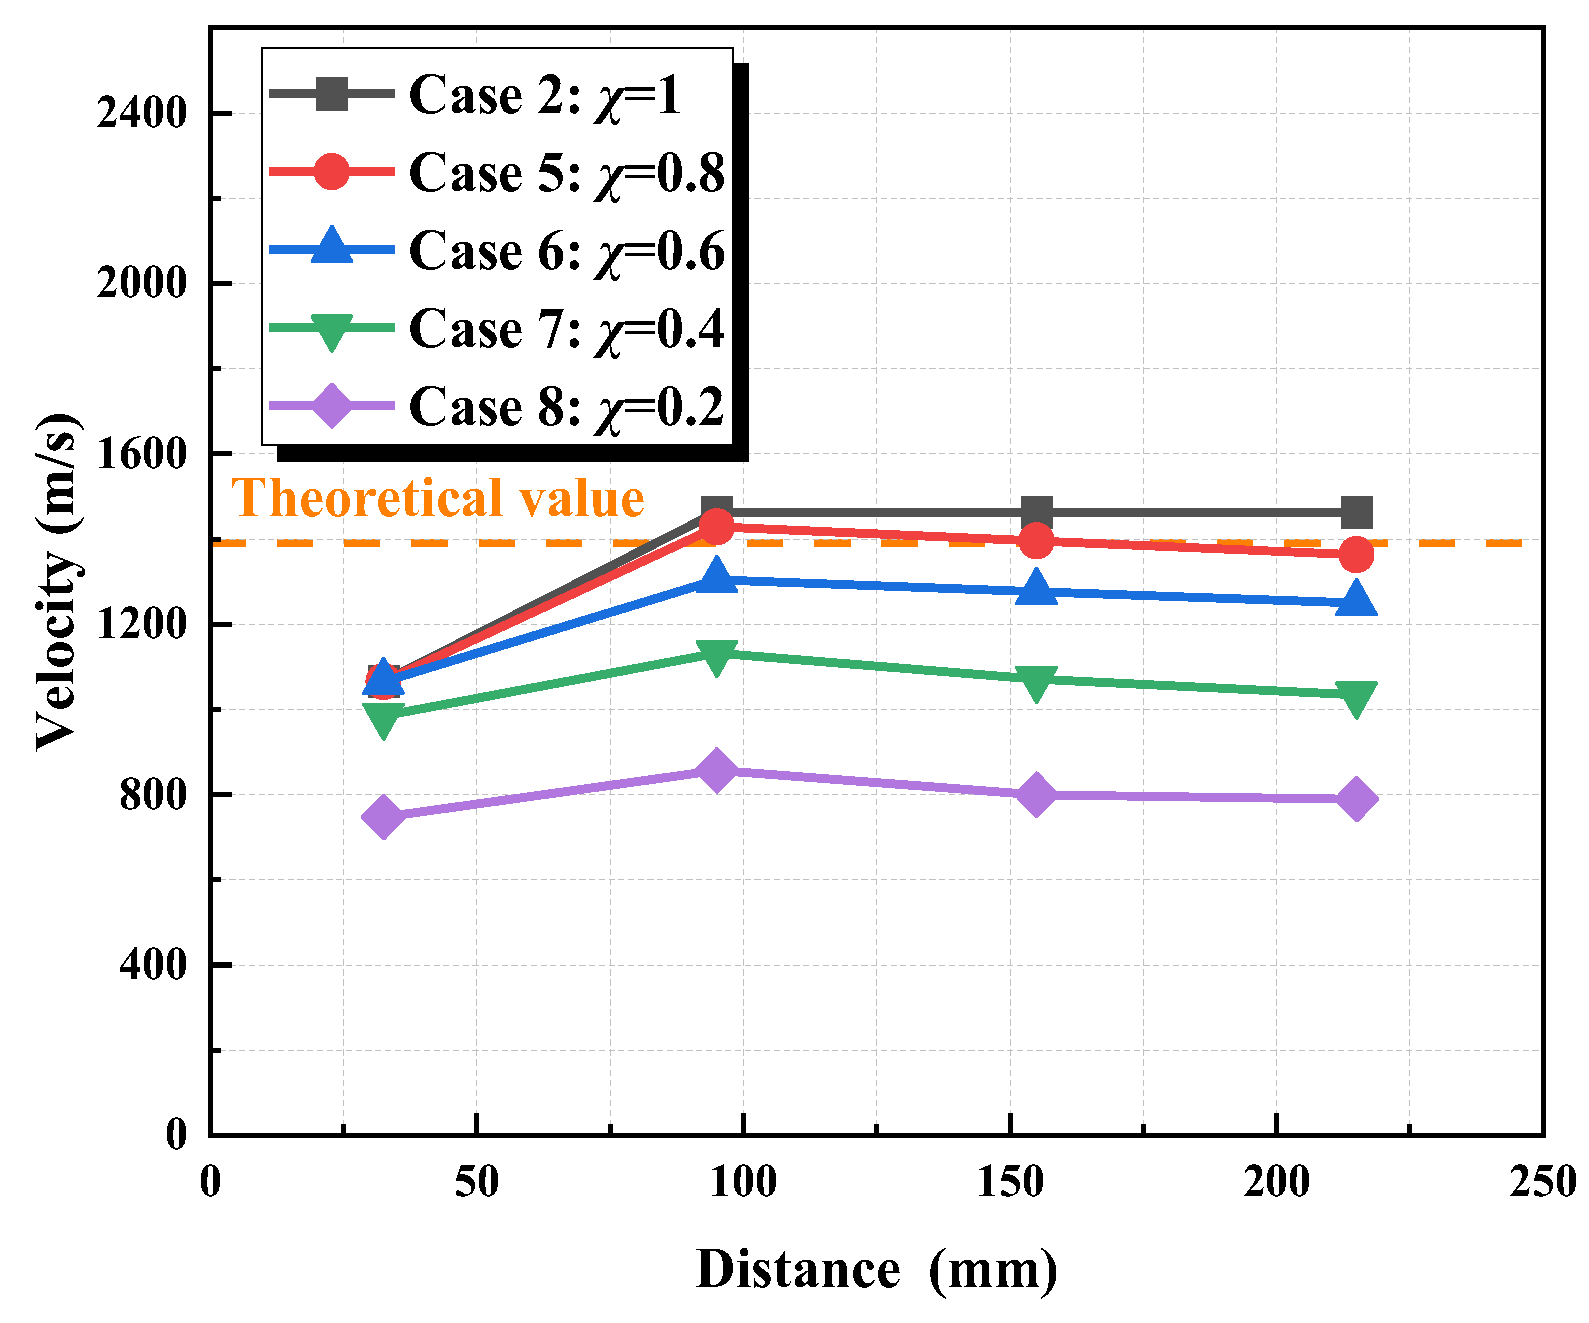
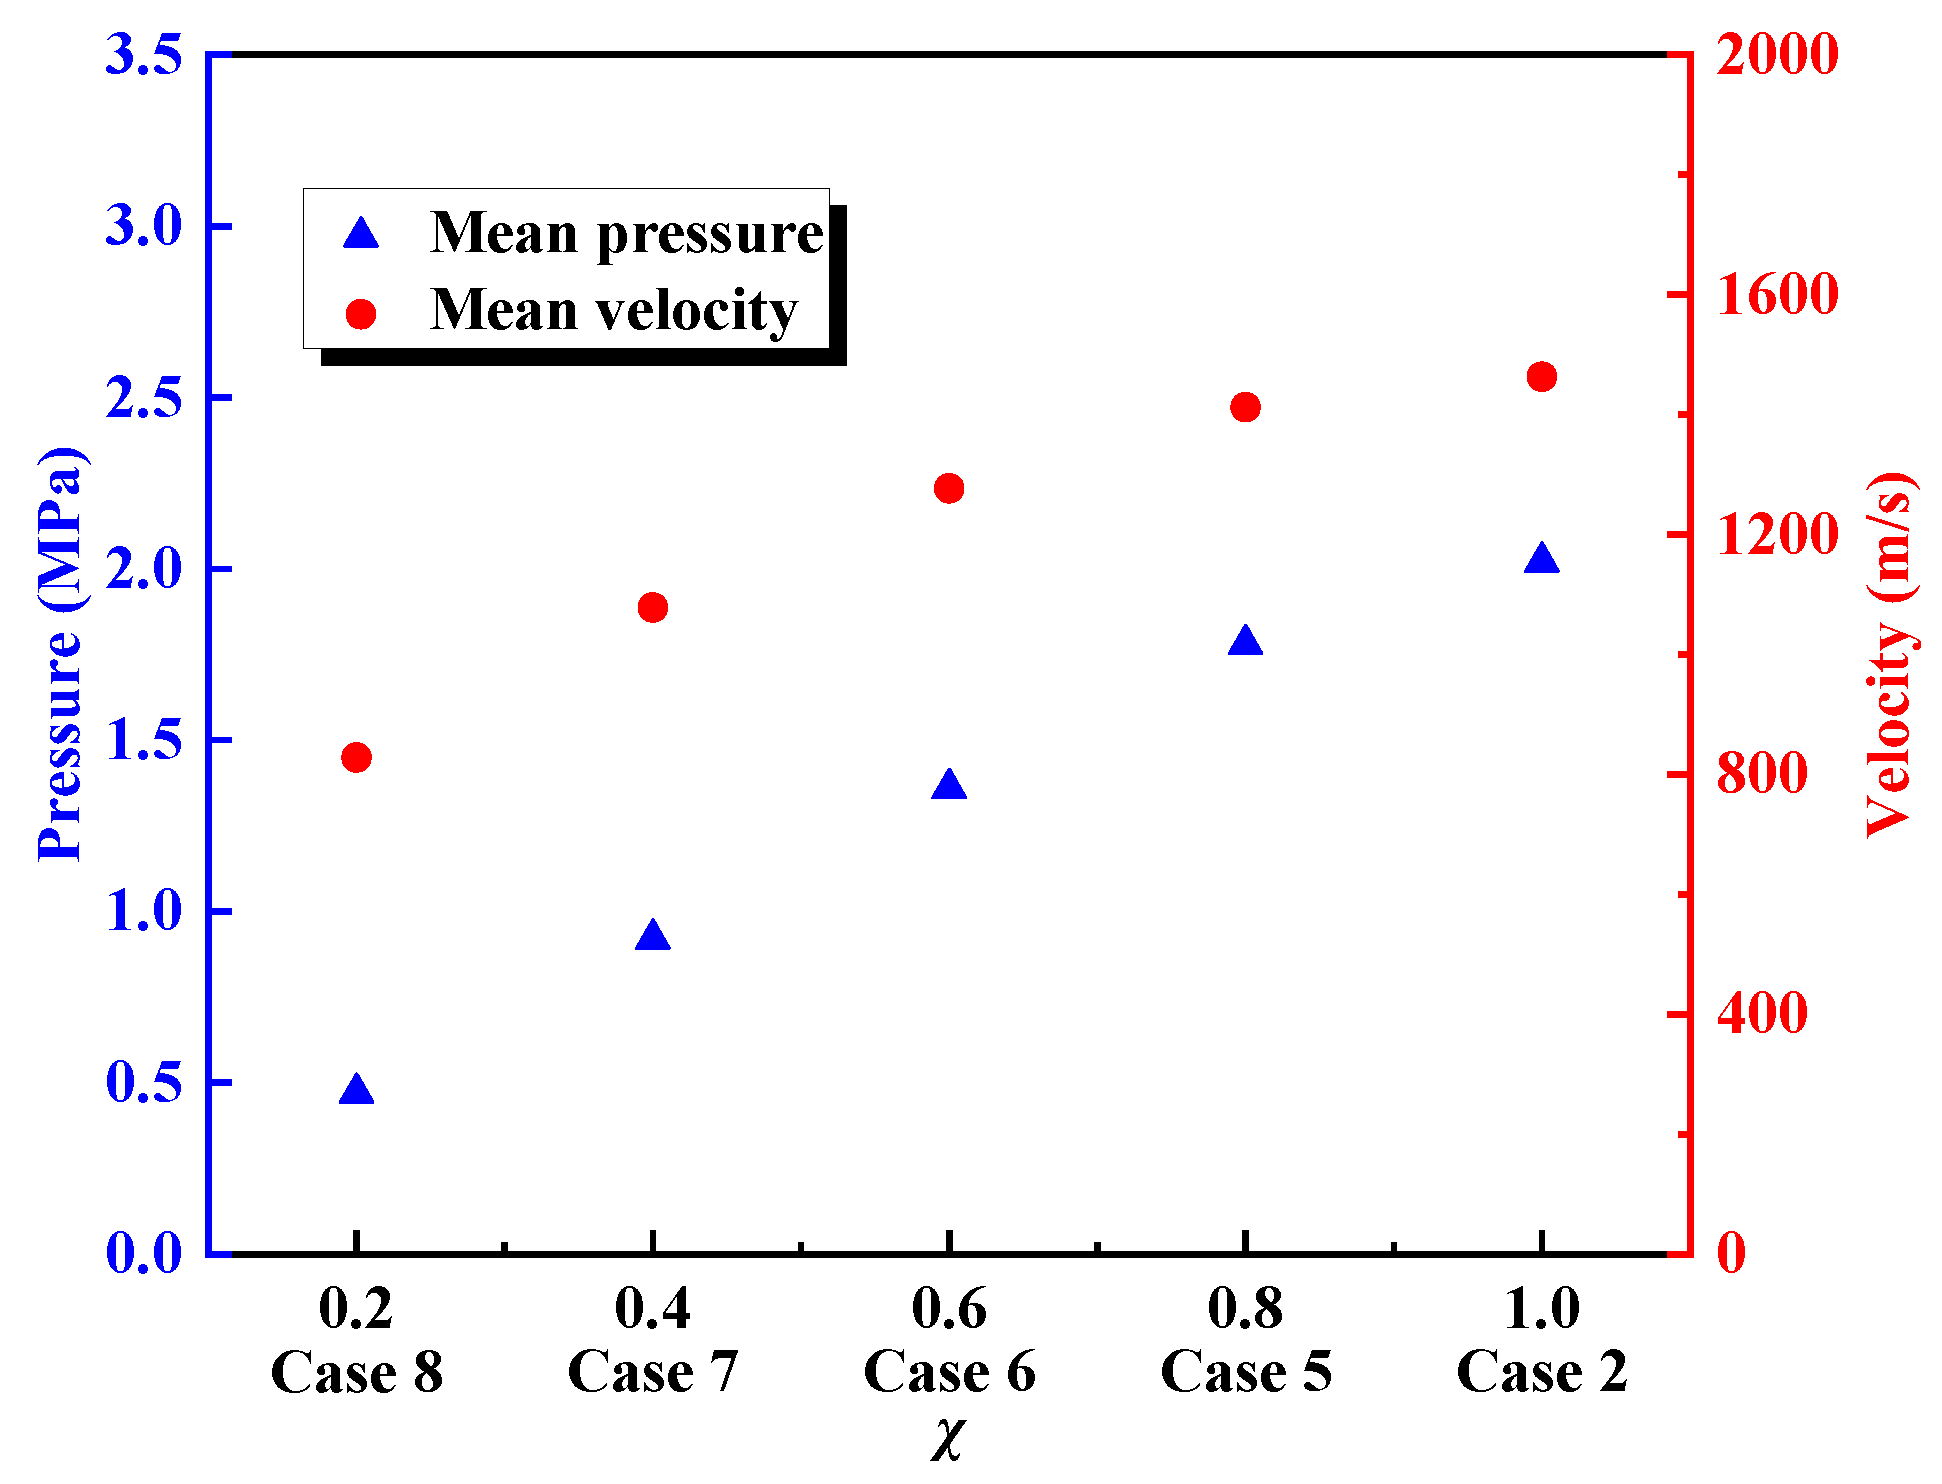
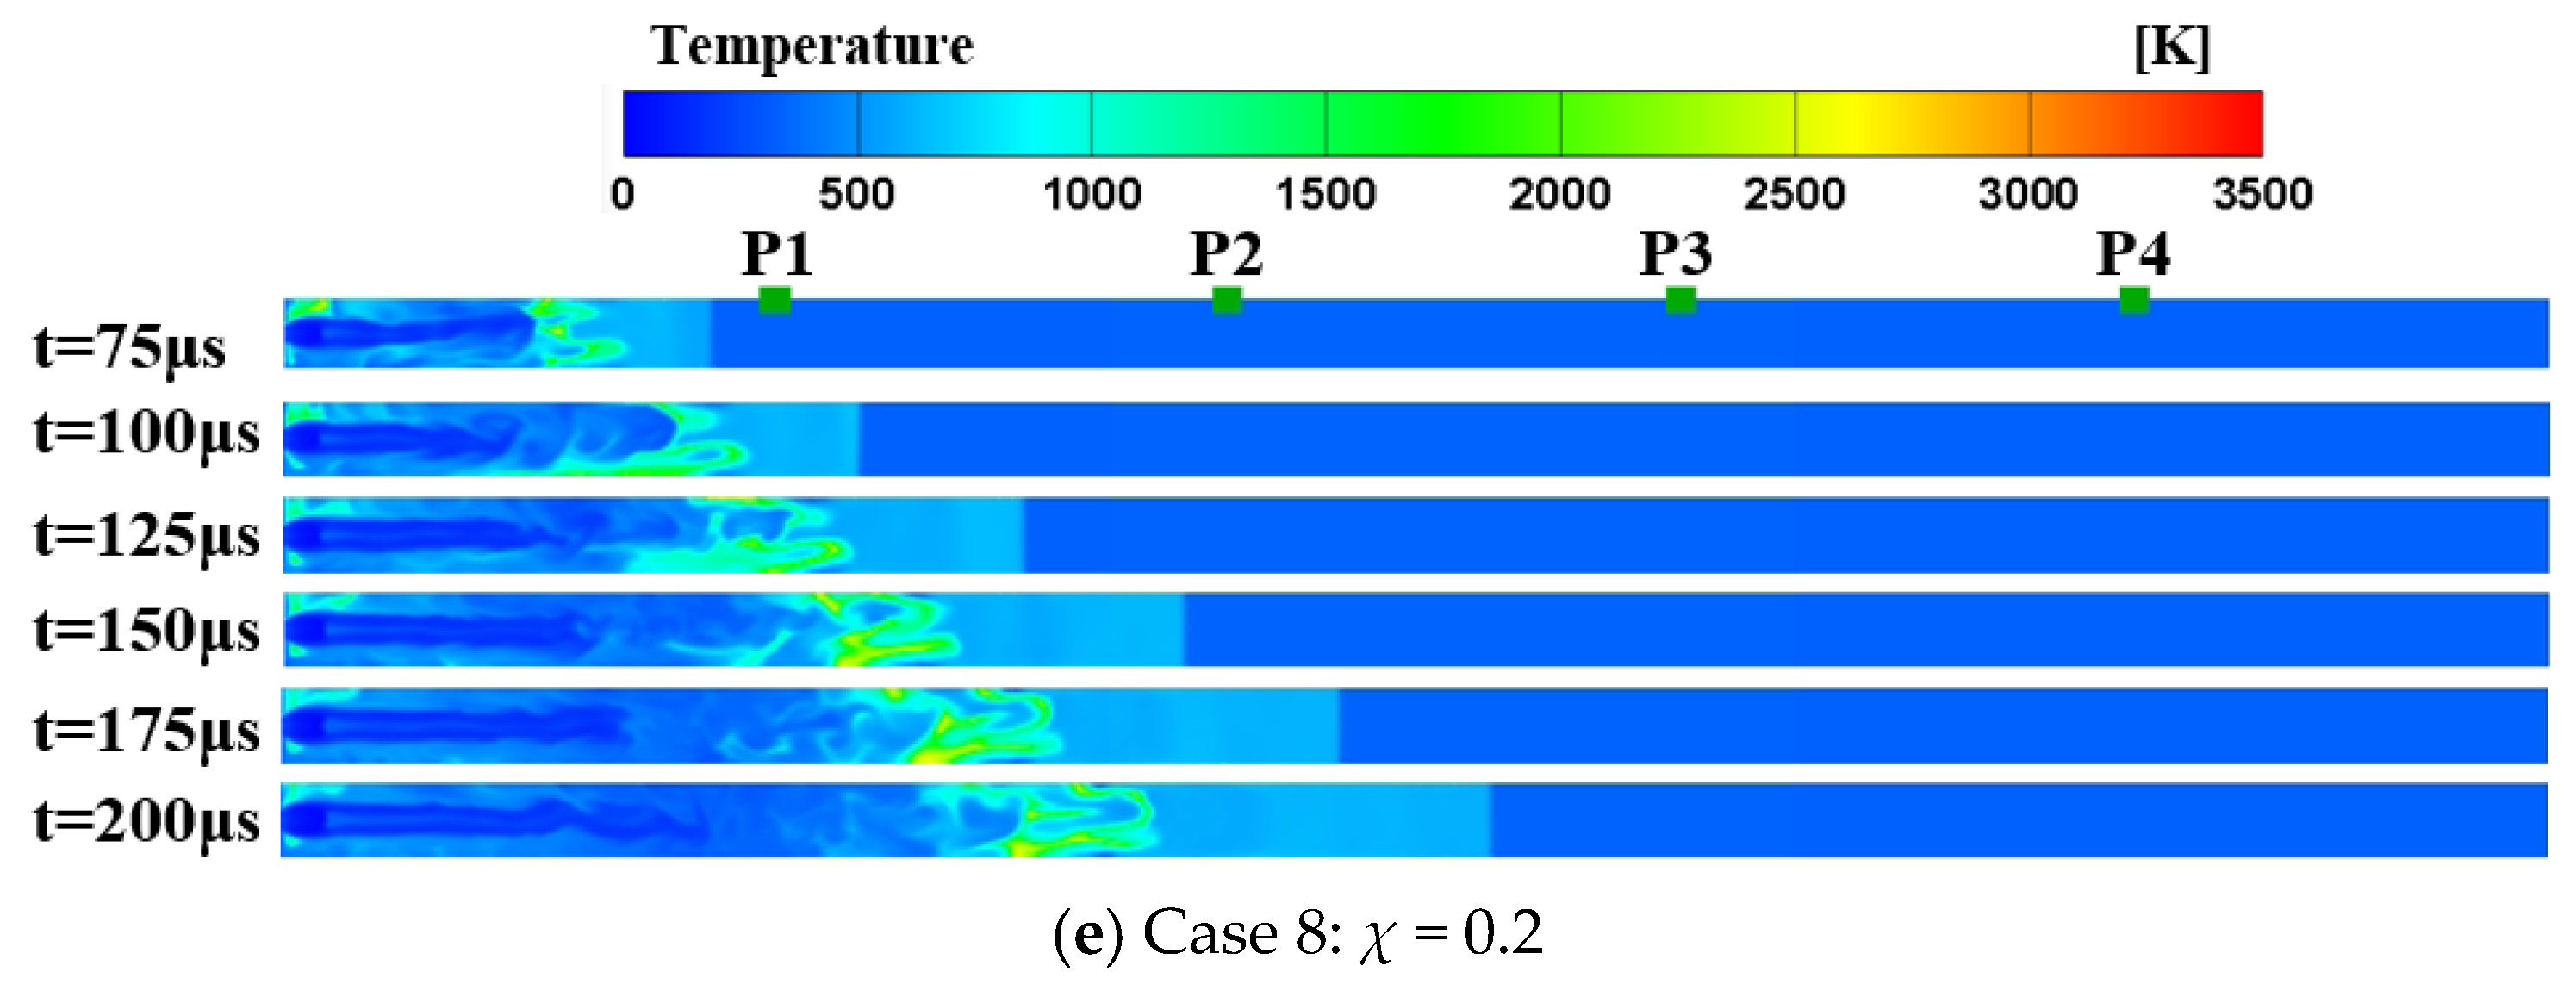
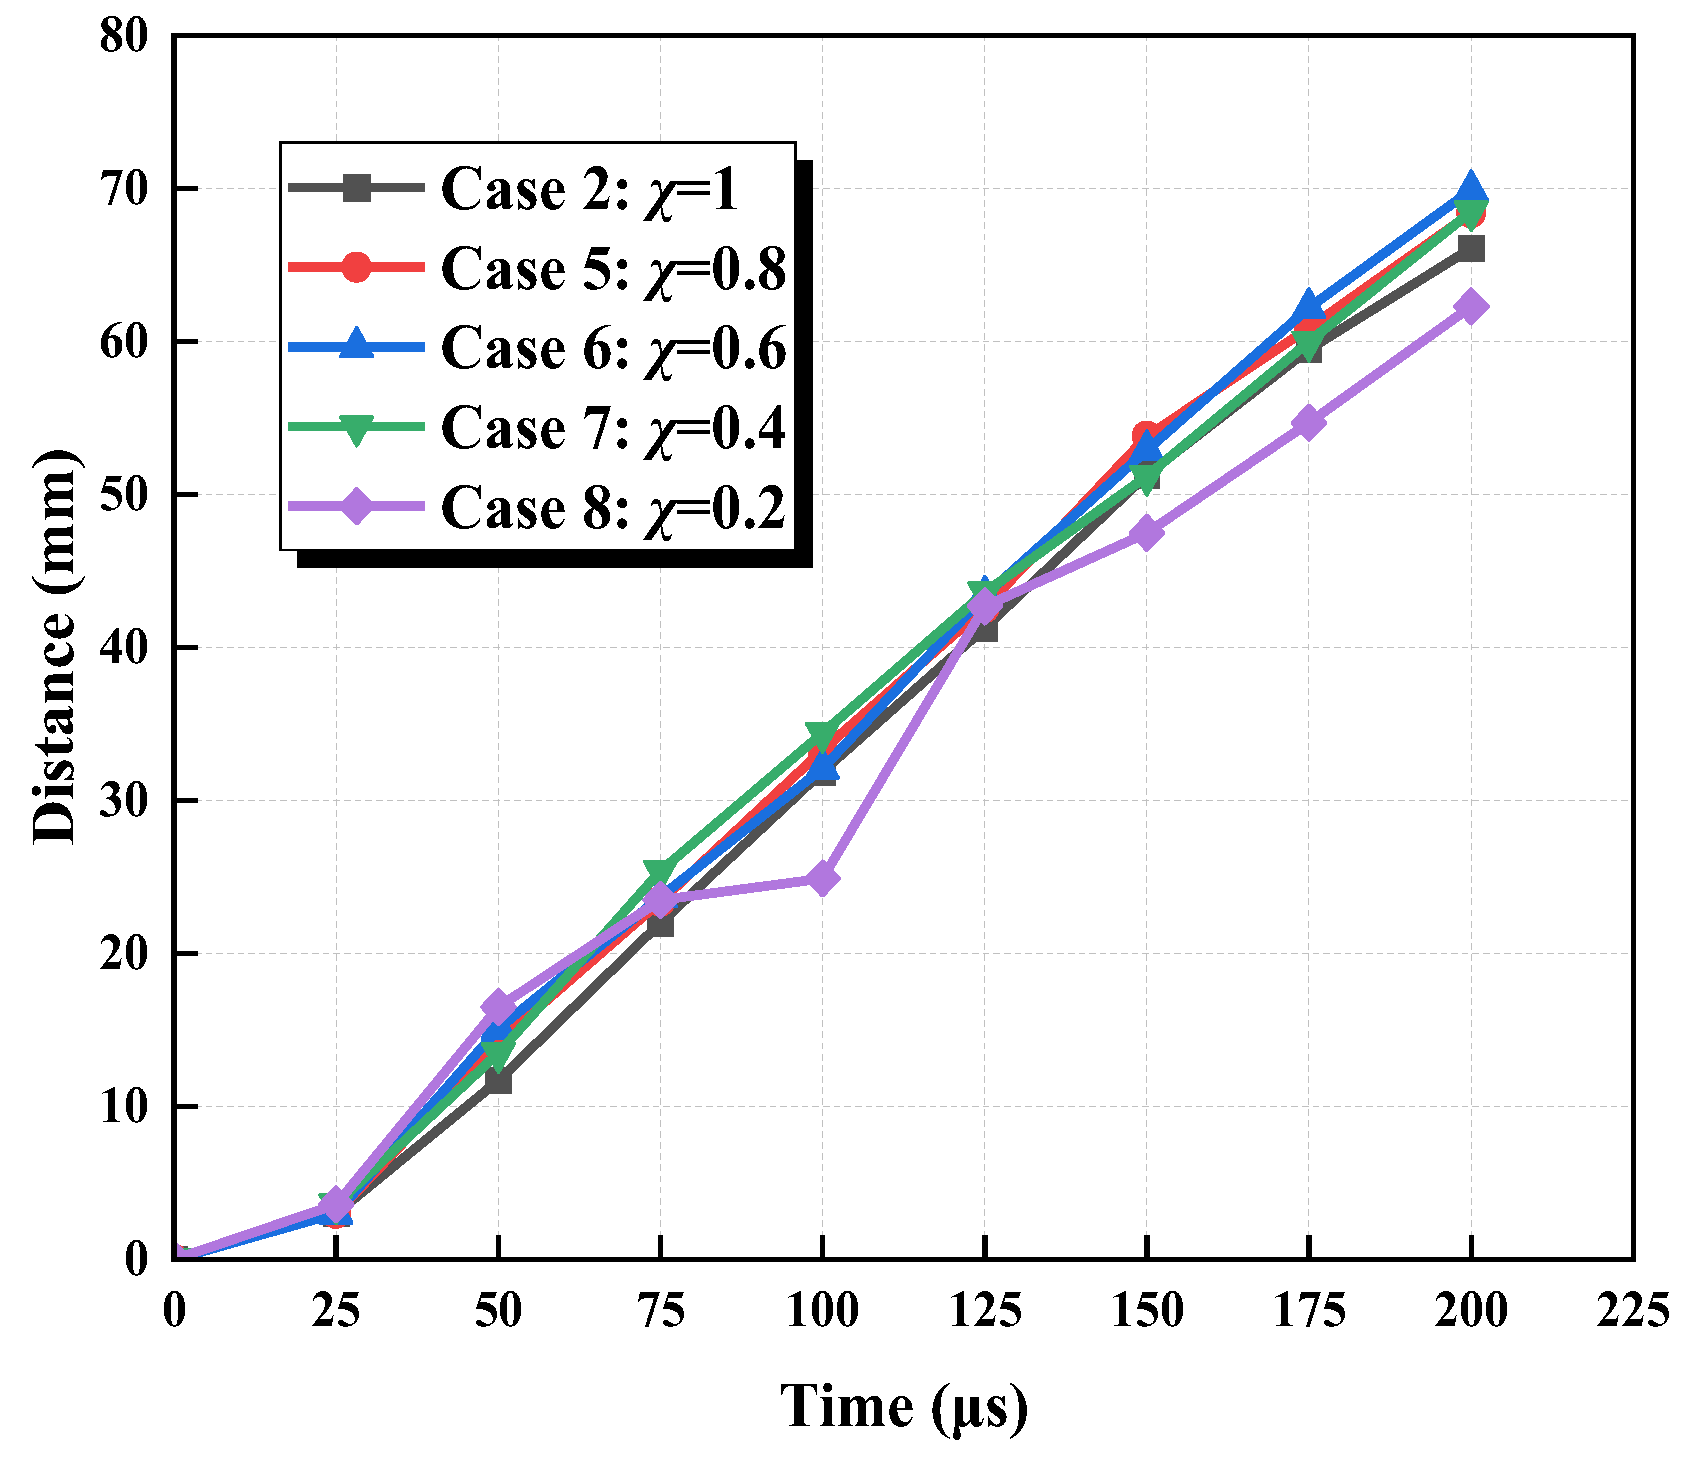
Under a fixed burst disk opening ratio, the initial Mach disk formed at the disk’s opening remains stable and does not dissipate. The downstream symmetric high-velocity area repeatedly extends toward the tube center, forming Mach disks multiple times. Reducing the opening ratio weakens shock wave intensity and speed, helping to prevent spontaneous ignition. However, changes in the opening ratio have little effect on the length of the shock wave action zone.

Author Contributions

Conceptualization, Z.W.; Methodology, Z.W.; Software, G.W.; Investigation, Z.W., L.N., R.Z., and M.Z.; Data curation, G.W., J.W., and L.M.; Writing–original draft, W.L. and G.W.; Writing–review and editing, Z.W. and G.W.; Supervision, Z.W. and J.J. All authors have read and agreed to the published version of the manuscript.

Funding

This work was financially supported by the National Key R&D Program of China (No. 2024YFC3016201), Jiangsu Provincial Key R&D Programme-Social Development (No. BE2023809), Natural Science Foundation of Jiangsu Province (No. BK20230318), Natural Science Foundation of the Jiangsu Higher Education Institutions of China (No. 22KJB620005), and Sichuan Provincial Key Laboratory of Public Fire Prevention and Control Technology (No. SC_KLPFPCT2024Y07). W.L. acknowledges the support from the Postgraduate Research & Practice Innovation Program of Jiangsu Province (No. KYCX24_1547).

Institutional Review Board Statement

Not applicable.

Informed Consent Statement

Not applicable.

Data Availability Statement

The raw data supporting the conclusions of this article will be made available by the authors upon request.

Conflicts of Interest

Author G.W. was employed by Sinopec Sales Co., Ltd. The remaining authors declare that the research was conducted in the absence of any commercial or financial relationships that could be construed as a potential conflict of interest.

References

  1. Mazloomi, K.; Gomes, C. Hydrogen as an energy carrier: Prospects and challenges. Renew. Sustain. Energy Rev. 2012, 16, 3024–3033. [Google Scholar] [CrossRef]
  2. Le, T.T.; Sharma, P.; Bora, B.J.; Tran, V.D.; Truong, T.H.; Le, H.C.; Nguyen, P.Q.P. Fueling the future: A comprehensive review of hydrogen energy systems and their challenges. Int. J. Hydrogen Energy 2024, 54, 791–816. [Google Scholar] [CrossRef]
  3. Qiu, H.; Zhou, R.; Li, X.; Xie, Y.; Fan, M.; Li, J.; Huang, H. A review on spontaneous ignition mechanism of pressurized hydrogen released through tubes. Int. J. Hydrogen Energy 2024, 86, 613–637. [Google Scholar] [CrossRef]
  4. Wolanski, P.; Wojcicki, S. Investigation into the mechanism of the diffusion ignition of a combustible gas flowing into an oxidizing atmosphere. Proc. Combust. Inst. 1972, 14, 1217–1223. [Google Scholar]
  5. Dryer, F.L.; Chaos, M.; Zhao, Z.; Stein, J.N.; Alpert, J.Y.; Homer, C.J. Spontaneous ignition of pressurized releases of hydrogen and natural gas into air. Combust. Sci. Technol. 2007, 179, 663–694. [Google Scholar] [CrossRef]
  6. Mogi, T.; Kim, D.; Shiina, H.; Horiguchi, S. Self-ignition and explosion during discharge of high-pressure hydrogen. J. Loss Prev. Process Ind. 2008, 21, 199–204. [Google Scholar] [CrossRef]
  7. Kitabayashi, N.; Wada, Y.; Mogi, T.; Saburi, T.; Hayashi, A.K. Experimental study on high pressure hydrogen jets coming out of tubes of 0.1–4.2 m in length. Int. J. Hydrogen Energy 2013, 38, 8100–8107. [Google Scholar] [CrossRef]
  8. Duan, Q.; Xiao, H.; Gao, W.; Wang, Q.; Shen, X.; Jiang, L.; Sun, J. An experimental study on shock waves and spontaneous ignition produced by pressurized hydrogen release through a tube into atmosphere. Int. J. Hydrogen Energy 2015, 40, 8281–8289. [Google Scholar] [CrossRef]
  9. Duan, Q.; Zeng, Q.; Jin, K.; Wang, Q.; Sun, J. Mechanism of self-ignition and flame propagation during high-pressure hydrogen release through a rectangular tube. Process Saf. Environ. Prot. 2022, 164, 283–290. [Google Scholar] [CrossRef]
  10. Pan, X.; Wang, Q.; Yan, W.; Jiang, Y.; Wang, Z.; Xu, X.; Hua, M.; Jiang, J. Experimental study on pressure dynamics and self-ignition of pressurized hydrogen flowing into the L-shaped tubes. Int. J. Hydrogen Energy 2020, 45, 5028–5038. [Google Scholar] [CrossRef]
  11. Gong, L.; Duan, Q.; Jiang, L.; Jin, K.; Sun, J. Experimental study on flow characteristics and spontaneous ignition produced by pressurized hydrogen release through an Omega-shaped tube into atmosphere. Fuel 2016, 184, 770–779. [Google Scholar] [CrossRef]
  12. Li, P.; Duan, Q.; Gong, L.; Jin, K.; Chen, J.; Sun, J. Effects of obstacles inside the tube on the shock wave propagation and spontaneous ignition of high-pressure hydrogen. Fuel 2019, 236, 1586–1594. [Google Scholar] [CrossRef]
  13. Morii, Y.; Terashima, H.; Koshi, M.; Shimizu, T. Numerical study of the effect of obstacles on the spontaneous ignition of high-pressure hydrogen. J. Loss Prev. Process Ind. 2015, 34, 92–99. [Google Scholar] [CrossRef]
  14. Golovastov, S.V.; Bocharnikov, V.M.; Samoilova, A.A. Experimental investigation of influence of methane additions on spontaneous self-ignition of pulsed jet of hydrogen. Int. J. Hydrogen Energy 2016, 41, 13322–13328. [Google Scholar] [CrossRef]
  15. Rudy, W.; Teodorczyk, A.; Wen, J. Self-ignition of hydrogen-nitrogen mixtures during high-pressure release into air. Int. J. Hydrogen Energy 2017, 42, 7340–7352. [Google Scholar] [CrossRef]
  16. Grüne, J.; Kuznetsov, M.; Lelyakin, A.; Jordan, T. Spontaneous ignition processes due to high-pressure hydrogen release in air. Combust. Flame 2011, 158, 1883–1892. [Google Scholar]
  17. Golovastov, S.; Bocharnikov, V. The influence of diaphragm rupture rate on spontaneous self-ignition of pressurized hydrogen: Experimental investigation. Int. J. Hydrogen Energy 2012, 37, 10956–10962. [Google Scholar] [CrossRef]
  18. Kaneko, W.; Ishii, K. Effects of diaphragm rupturing conditions on self-ignition of high-pressure hydrogen. Int. J. Hydrogen Energy 2016, 41, 10969–10975. [Google Scholar] [CrossRef]
  19. Jiang, G.; Duan, Q.; Wu, Y.; Zhang, S.; Sun, J. Effect of slit parameters on diaphragm rupture and self-ignition during pressurized hydrogen release. Int. J. Hydrogen Energy 2024, 58, 698–706. [Google Scholar] [CrossRef]
  20. Wen, J.X.; Xu, B.P.; Tam, V.H.Y. Numerical study on spontaneous ignition of pressurized hydrogen release through a length of tube. Combust. Flame 2009, 156, 2173–2189. [Google Scholar] [CrossRef]
  21. Xu, B.P.; Wen, J.X.; Dembele, S.; Tam, V.H.Y.; Hawksworth, S.J. The effect of pressure boundary rupture rate on spontaneous ignition of pressurized hydrogen release. J. Loss Prev. Process Ind. 2009, 22, 279–287. [Google Scholar] [CrossRef]
  22. Lee, B.J.; Jeung, I.S. Numerical study of spontaneous ignition of pressurized hydrogen released by the failure of a rupture disk into a tube. Int. J. Hydrogen Energy 2009, 34, 8763–8769. [Google Scholar] [CrossRef]
  23. Asahara, M.; Yokoyama, A.; Hayashi, A.K.; Yamada, E.; Tsuboi, N. Numerical simulation of auto-ignition induced by high-pressure hydrogen release with detailed reaction model: Fluid dynamic effect by diaphragm shape and boundary layer. Int. J. Hydrogen Energy 2014, 39, 20378–20387. [Google Scholar] [CrossRef]
  24. Bragin, M.V.; Makarov, D.V.; Molkov, V.V. Pressure limit of hydrogen spontaneous ignition in a T-shaped channel. Int. J. Hydrogen Energy 2013, 38, 8039–8052. [Google Scholar] [CrossRef]
  25. Terashima, H.; Koshi, M.; Miwada, C.; Mogi, T.; Dobashi, R. Effects of initial diaphragm shape on spontaneous ignition of high-pressure hydrogen in a two-dimensional duct. Int. J. Hydrogen Energy 2014, 39, 6013–6023. [Google Scholar] [CrossRef]
  26. Gong, L.; Jin, K.; Mo, T.; Zheng, X.; Yao, Y.; Zhang, Y. Numerical investigation on the shock wave propagation, hydrogen/air mixing and spontaneous ignition induced by high-pressure hydrogen release inside the tubes with different shaped cross-sections. Combust. Flame 2023, 252, 112770. [Google Scholar] [CrossRef]
  27. Sun, S.; Chen, P.; Zhai, X.; Liu, Y. Numerical study on the influence mechanism of different types of burst disc on high pressure hydrogen spontaneous combustion in tube. J. Energy Storage 2023, 67, 107626. [Google Scholar] [CrossRef]
  28. Li, H.; Cao, X.; Cao, H.; Xu, Z.; Teng, L.; Bian, J. Impact of rupture disk morphology on self-ignition during pressurized hydrogen release: A numerical simulation study. Int. J. Hydrogen Energy 2024, 84, 863–880. [Google Scholar] [CrossRef]
  29. Zhang, T.; Jiang, Y.; Wang, S.; Pan, X.; Hua, M.; Wang, Z.; Wang, Q.; Li, Y.; Jiang, J. Numerical study on the flow characteristics of pressurized hydrogen leaking into the confined space through different shaped orifices. Int. J. Hydrogen Energy 2022, 47, 35527–35539. [Google Scholar] [CrossRef]
  30. Kiverin, A.; Yarkov, A.; Yakovenko, I. On the Features of Numerical Simulation of Hydrogen Self-Ignition under High-Pressure Release. Computation 2024, 12, 103. [Google Scholar] [CrossRef]
  31. Gong, L.; Jin, K.; Yang, S.; Yang, Z.; Li, Z.; Gao, Y.; Zhang, Y. Numerical study on the mechanism of spontaneous ignition of high-pressure hydrogen in the L-shaped tube. Int. J. Hydrogen Energy 2020, 45, 32730–32742. [Google Scholar] [CrossRef]
  32. Jin, K.; Yang, S.; Gong, L.; Mo, T.; Gao, Y.; Zhang, Y. Mechanism of spontaneous ignition of high-pressure hydrogen during its release through a tube with local contraction: A numerical study. Int. J. Hydrogen Energy 2022, 47, 6421–6436. [Google Scholar] [CrossRef]
  33. Pan, X.; Yan, W.; Jiang, Y.; Wang, Z.; Hua, M.; Wang, Q.; Jiang, J. Experimental investigation of the self-ignition and jet flame of hydrogen jets released under different conditions. ACS Omega 2019, 4, 12004–12011. [Google Scholar] [CrossRef] [PubMed]
  34. Spence, D.A.; Woods, B.A. A Review of Theoretical Treatments of Shock-Tube Attenuation. J. Fluid Mech. 1964, 19, 161–174. [Google Scholar] [CrossRef]
  35. Gong, L.; Li, Z.; Jin, K.; Gao, Y.; Duan, Q.; Zhang, Y.; Sun, J. Numerical study on the mechanism of spontaneous ignition of high-pressure hydrogen during its sudden release into a tube. Saf. Sci. 2020, 129, 104807. [Google Scholar] [CrossRef]
  36. Jin, K.; Yang, S.; Gong, L.; Han, Y.; Yang, X.; Gao, Y.; Zhang, Y. Numerical study on the spontaneous ignition of pressurized hydrogen during its sudden release into the tube with varying lengths and diameters. J. Loss Prev. Process Ind. 2021, 72, 104592. [Google Scholar] [CrossRef]
  37. Zhu, M.; Jin, K.; Duan, Q.; Zeng, Q.; Sun, J. Numerical simulation on the spontaneous ignition of high-pressure hydrogen release through a tube at different burst pressures. Int. J. Hydrogen Energy 2022, 47, 10431–10440. [Google Scholar] [CrossRef]
Figure 1. Physical model and initial conditions.
Fire 08 00246 g001
Figure 2. The specific opening processes and the corresponding opening times for each section.
Fire 08 00246 g002
Figure 3. The locations of the monitoring points within the tube.
Fire 08 00246 g003
Figure 4. Grid independence analysis and model validation.
Fire 08 00246 g004
Figure 5. Shock formation process in the tube under different opening processes.
Fire 08 00246 g005aFire 08 00246 g005b
Figure 6. Shock overpressure in the tube under different opening processes.
Fire 08 00246 g006
Figure 7. Development of hydrogen spontaneous ignition under different opening processes.
Fire 08 00246 g007aFire 08 00246 g007b
Figure 8. Distance between shock wave and hydrogen front under different opening processes.
Fire 08 00246 g008
Figure 9. Shock formation process in the tube under different burst disk shapes.
Fire 08 00246 g009aFire 08 00246 g009b
Figure 10. Shock overpressure in the tube under different burst disk shapes.
Fire 08 00246 g010
Figure 11. Development of hydrogen spontaneous ignition under different burst disk shapes.
Fire 08 00246 g011
Figure 12. Distance between shock wave and hydrogen front under different burst disk shapes.
Fire 08 00246 g012
Figure 13. Shock formation process in the tube under different opening ratios.
Fire 08 00246 g013aFire 08 00246 g013b
Figure 14. Shock overpressure in the tube under different opening ratios.
Fire 08 00246 g014aFire 08 00246 g014b
Figure 15. Shock wave propagation velocity versus distance.
Fire 08 00246 g015
Figure 16. Mean pressure and propagation velocity of shock wave versus opening ratio.
Fire 08 00246 g016
Figure 17. Development of hydrogen spontaneous ignition under different opening ratios.
Fire 08 00246 g017aFire 08 00246 g017b
Figure 18. Distance between shock wave and hydrogen front under different opening ratios.
Fire 08 00246 g018
Table 1. Key information of simulation cases.
Case No.Opening ProcessShapeOpening Ratio
1InstantaneousFlat1
210-step-likeFlat1
310-step-like Conventional domed1
410-step-like Reverse domed1
510-step-like Flat0.8
610-step-like Flat0.6
710-step-like Flat0.4
810-step-like Flat0.2
Disclaimer/Publisher’s Note: The statements, opinions and data contained in all publications are solely those of the individual author(s) and contributor(s) and not of MDPI and/or the editor(s). MDPI and/or the editor(s) disclaim responsibility for any injury to people or property resulting from any ideas, methods, instructions or products referred to in the content.

