
Influence of Deposition Time and Location on the Pyrolysis Performance of Grease in Kitchen Flues

Abstract
1. Introduction
2. Experimental
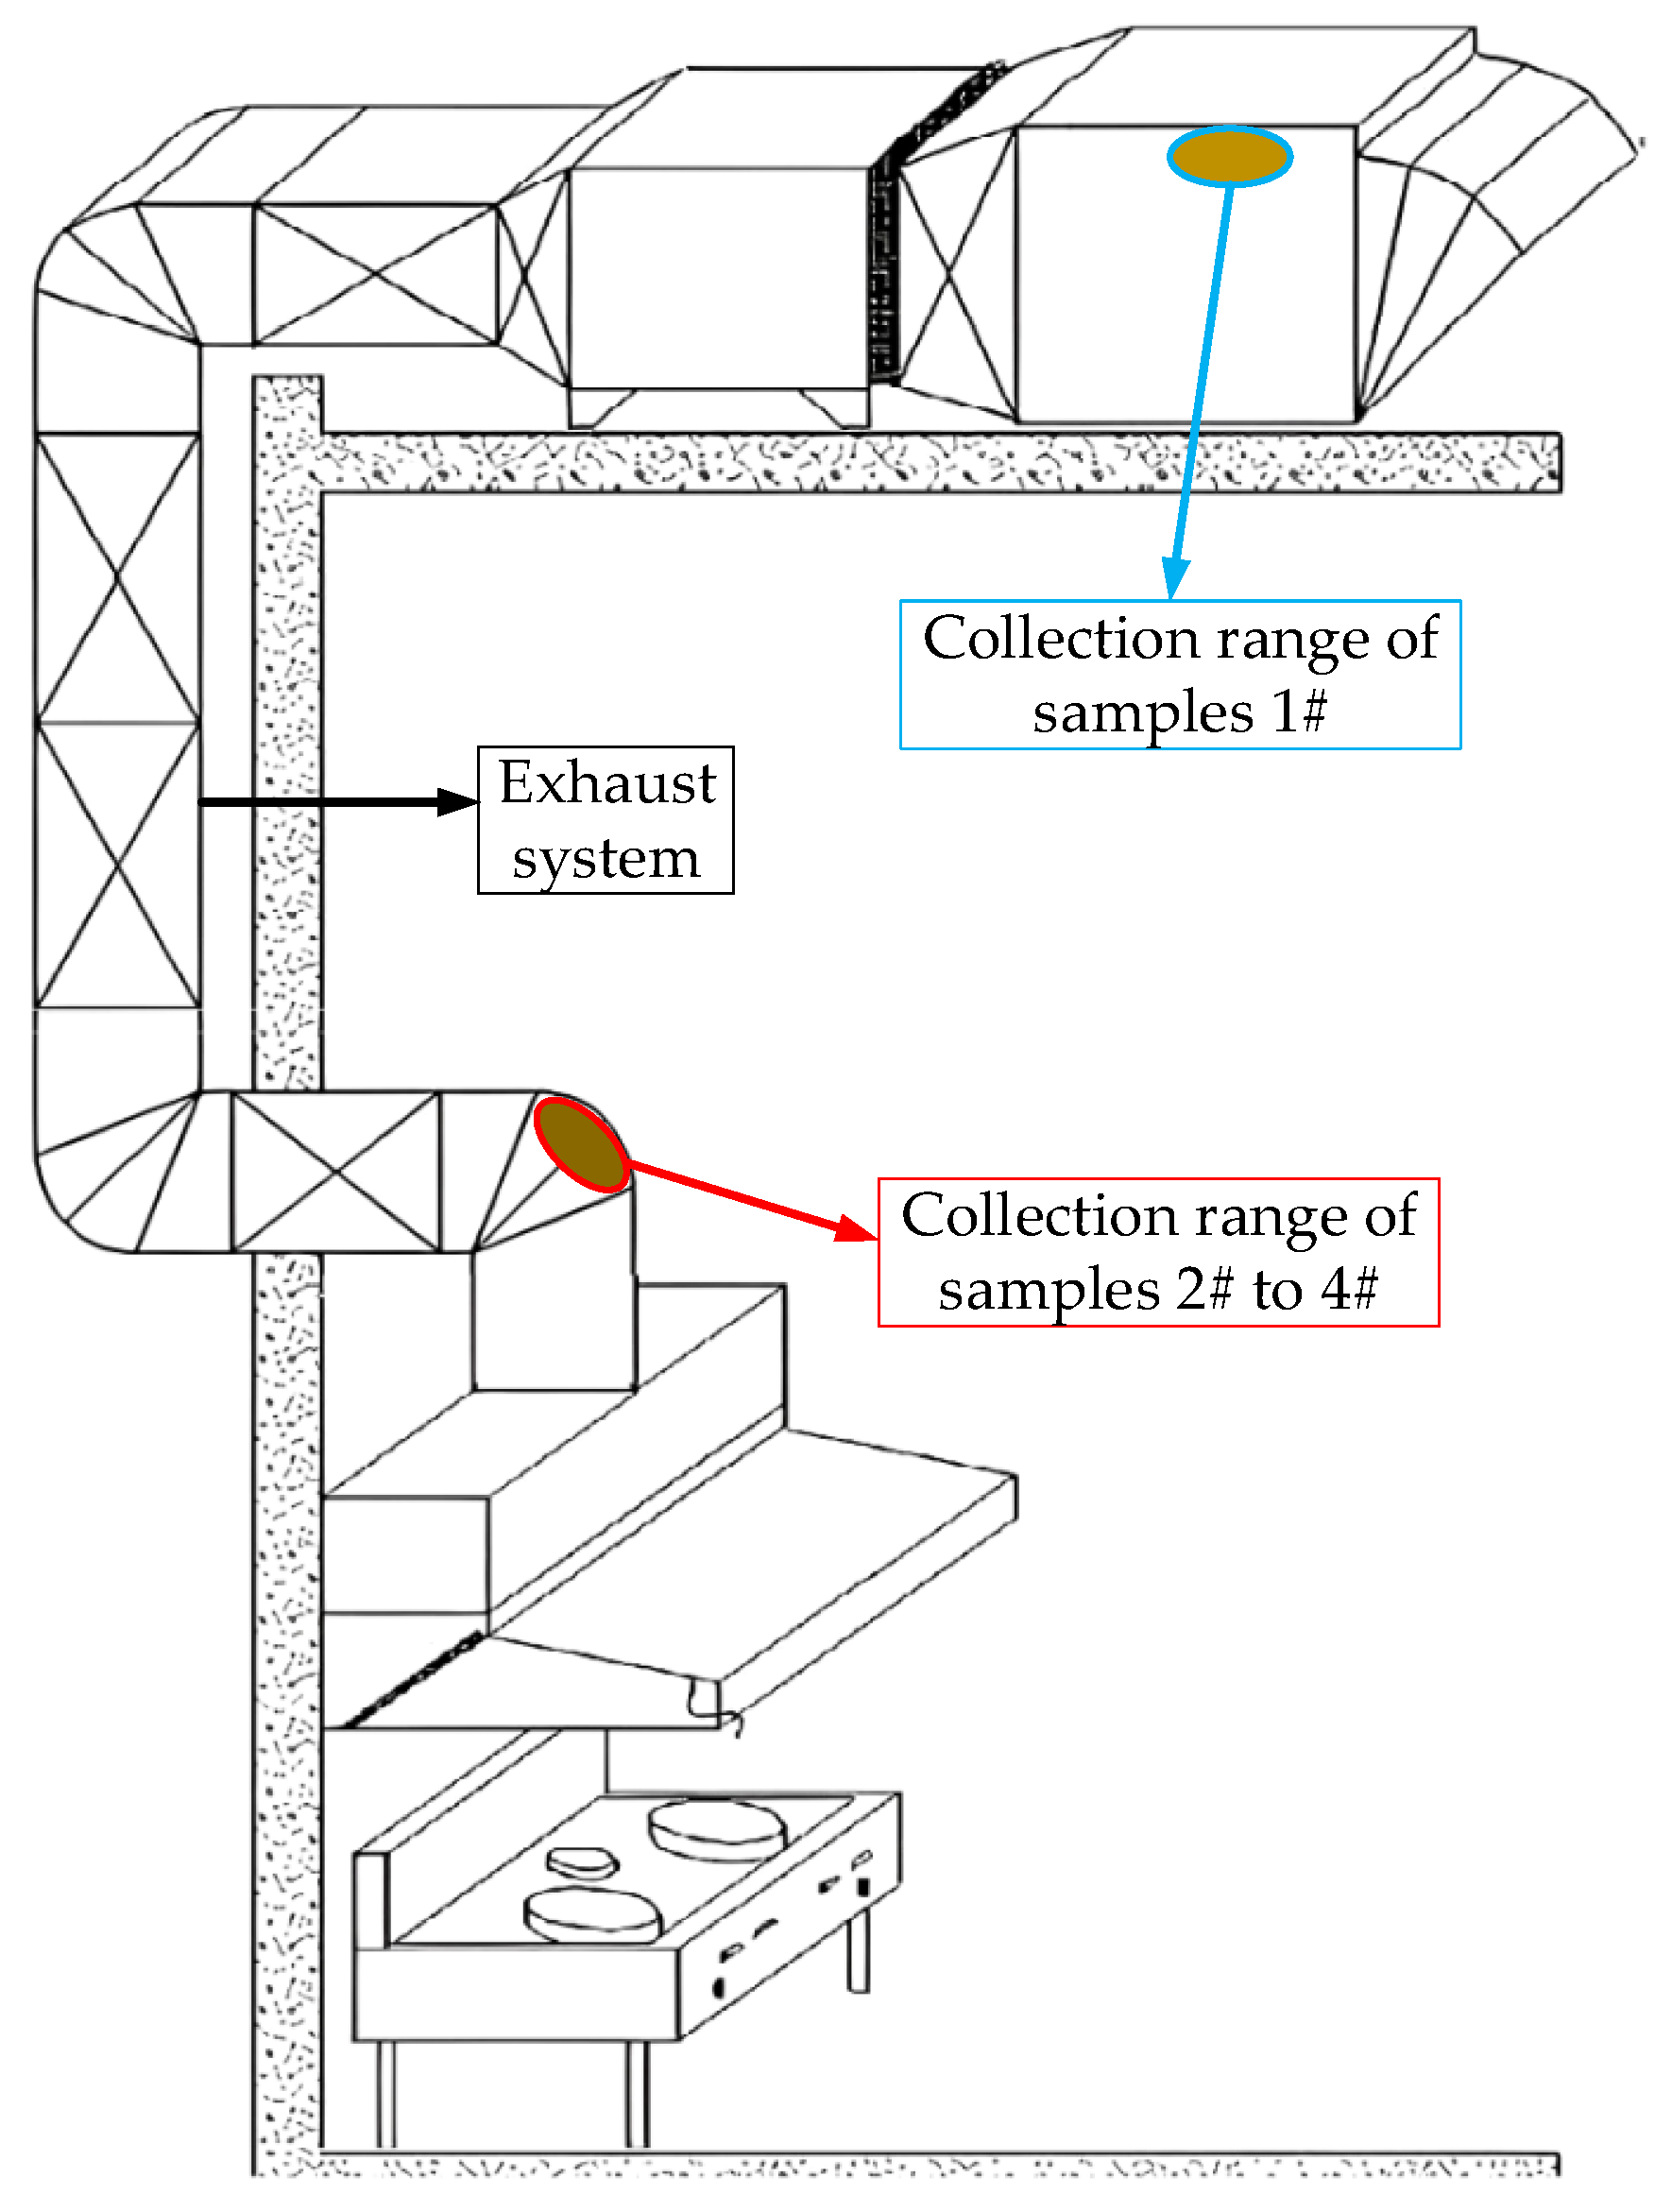
2.1. Materials
2.2. Methods
3. Results and Discussion
3.1. Effects of the Deposition Site on Pyrolysis Performance Grease
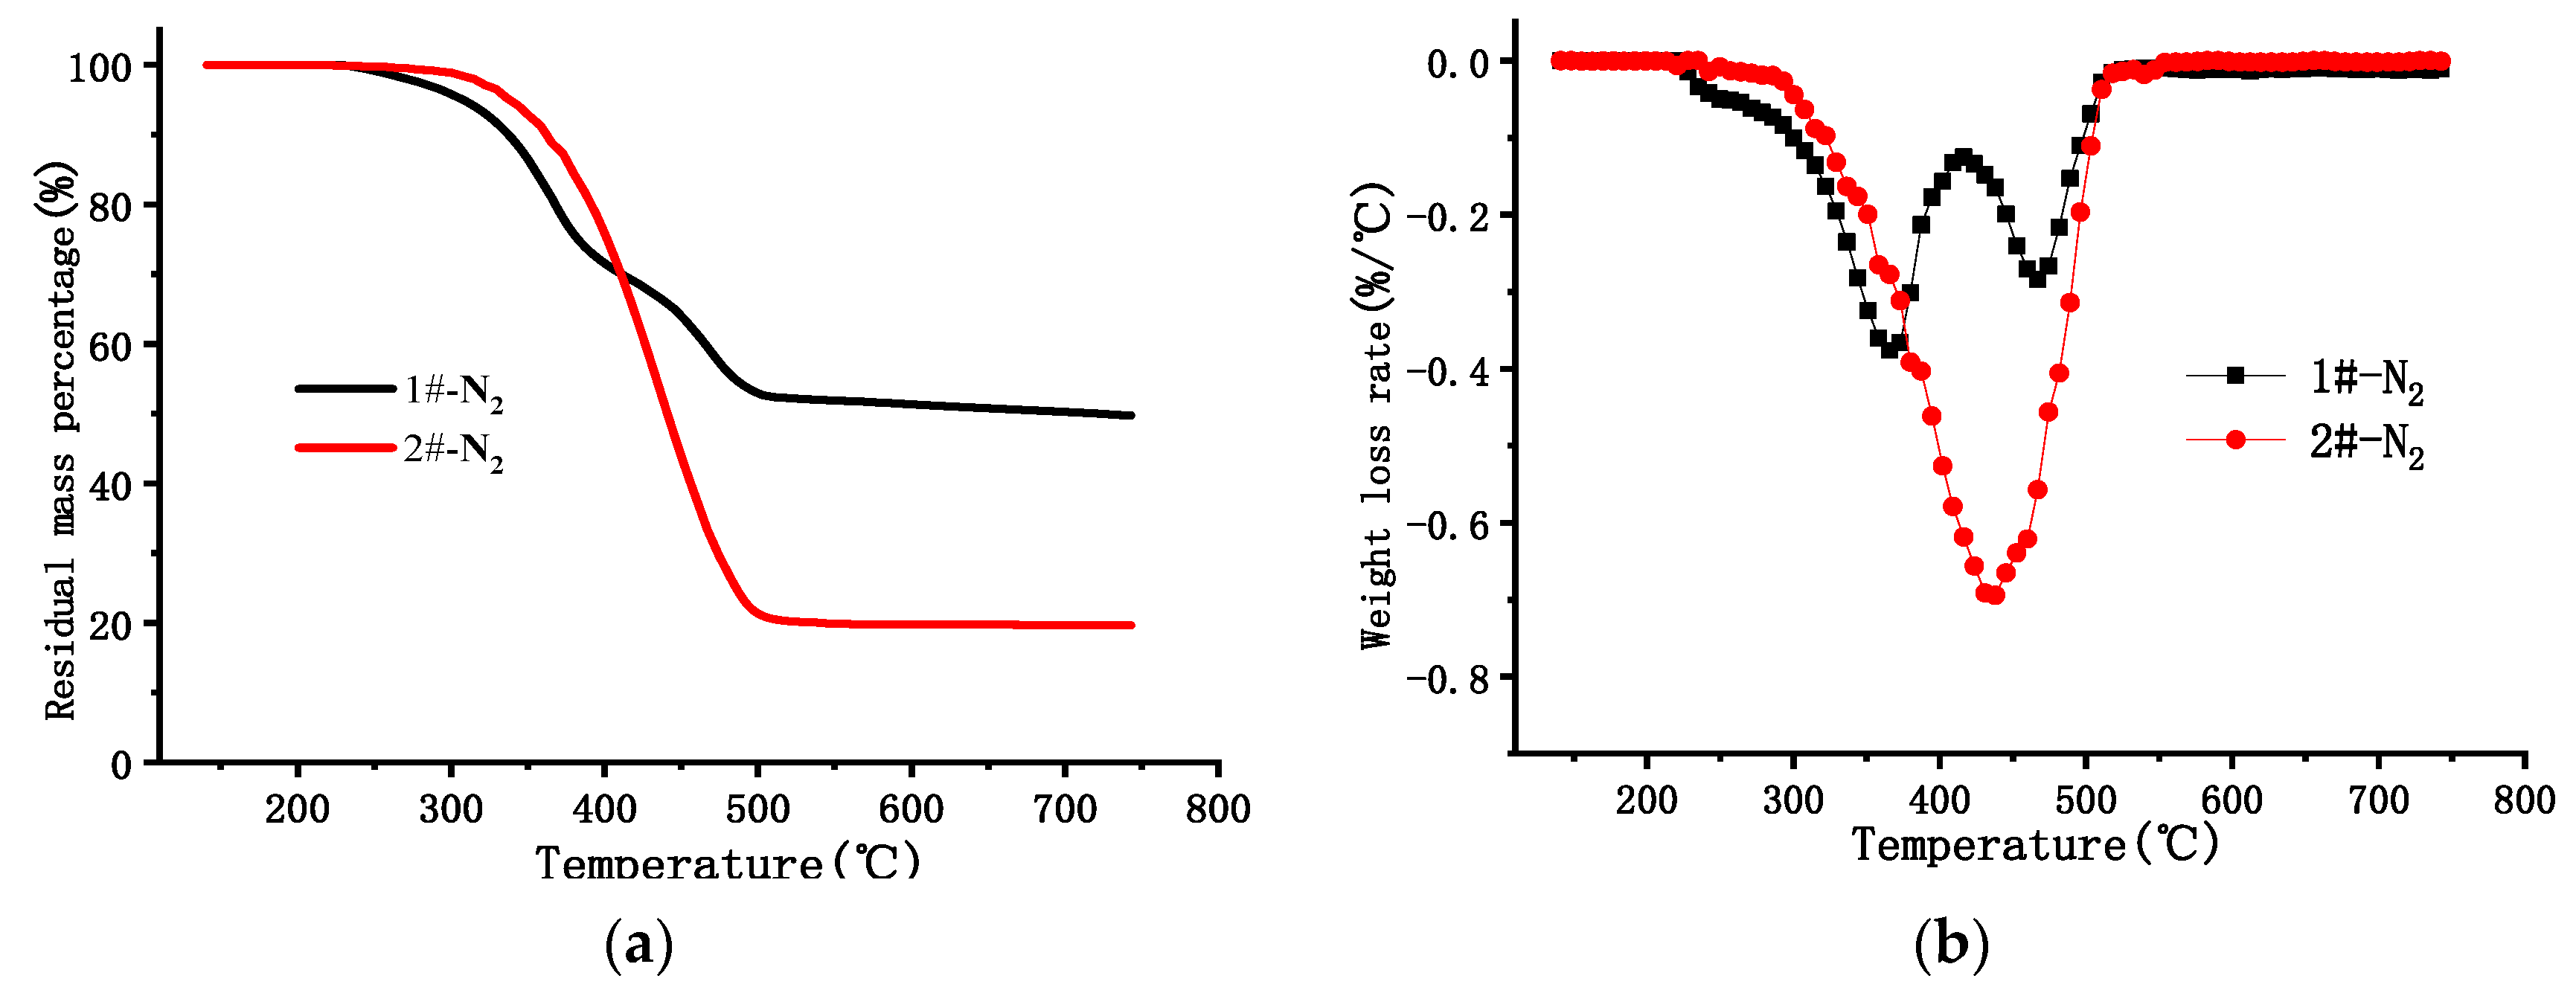
3.1.1. TGA Results
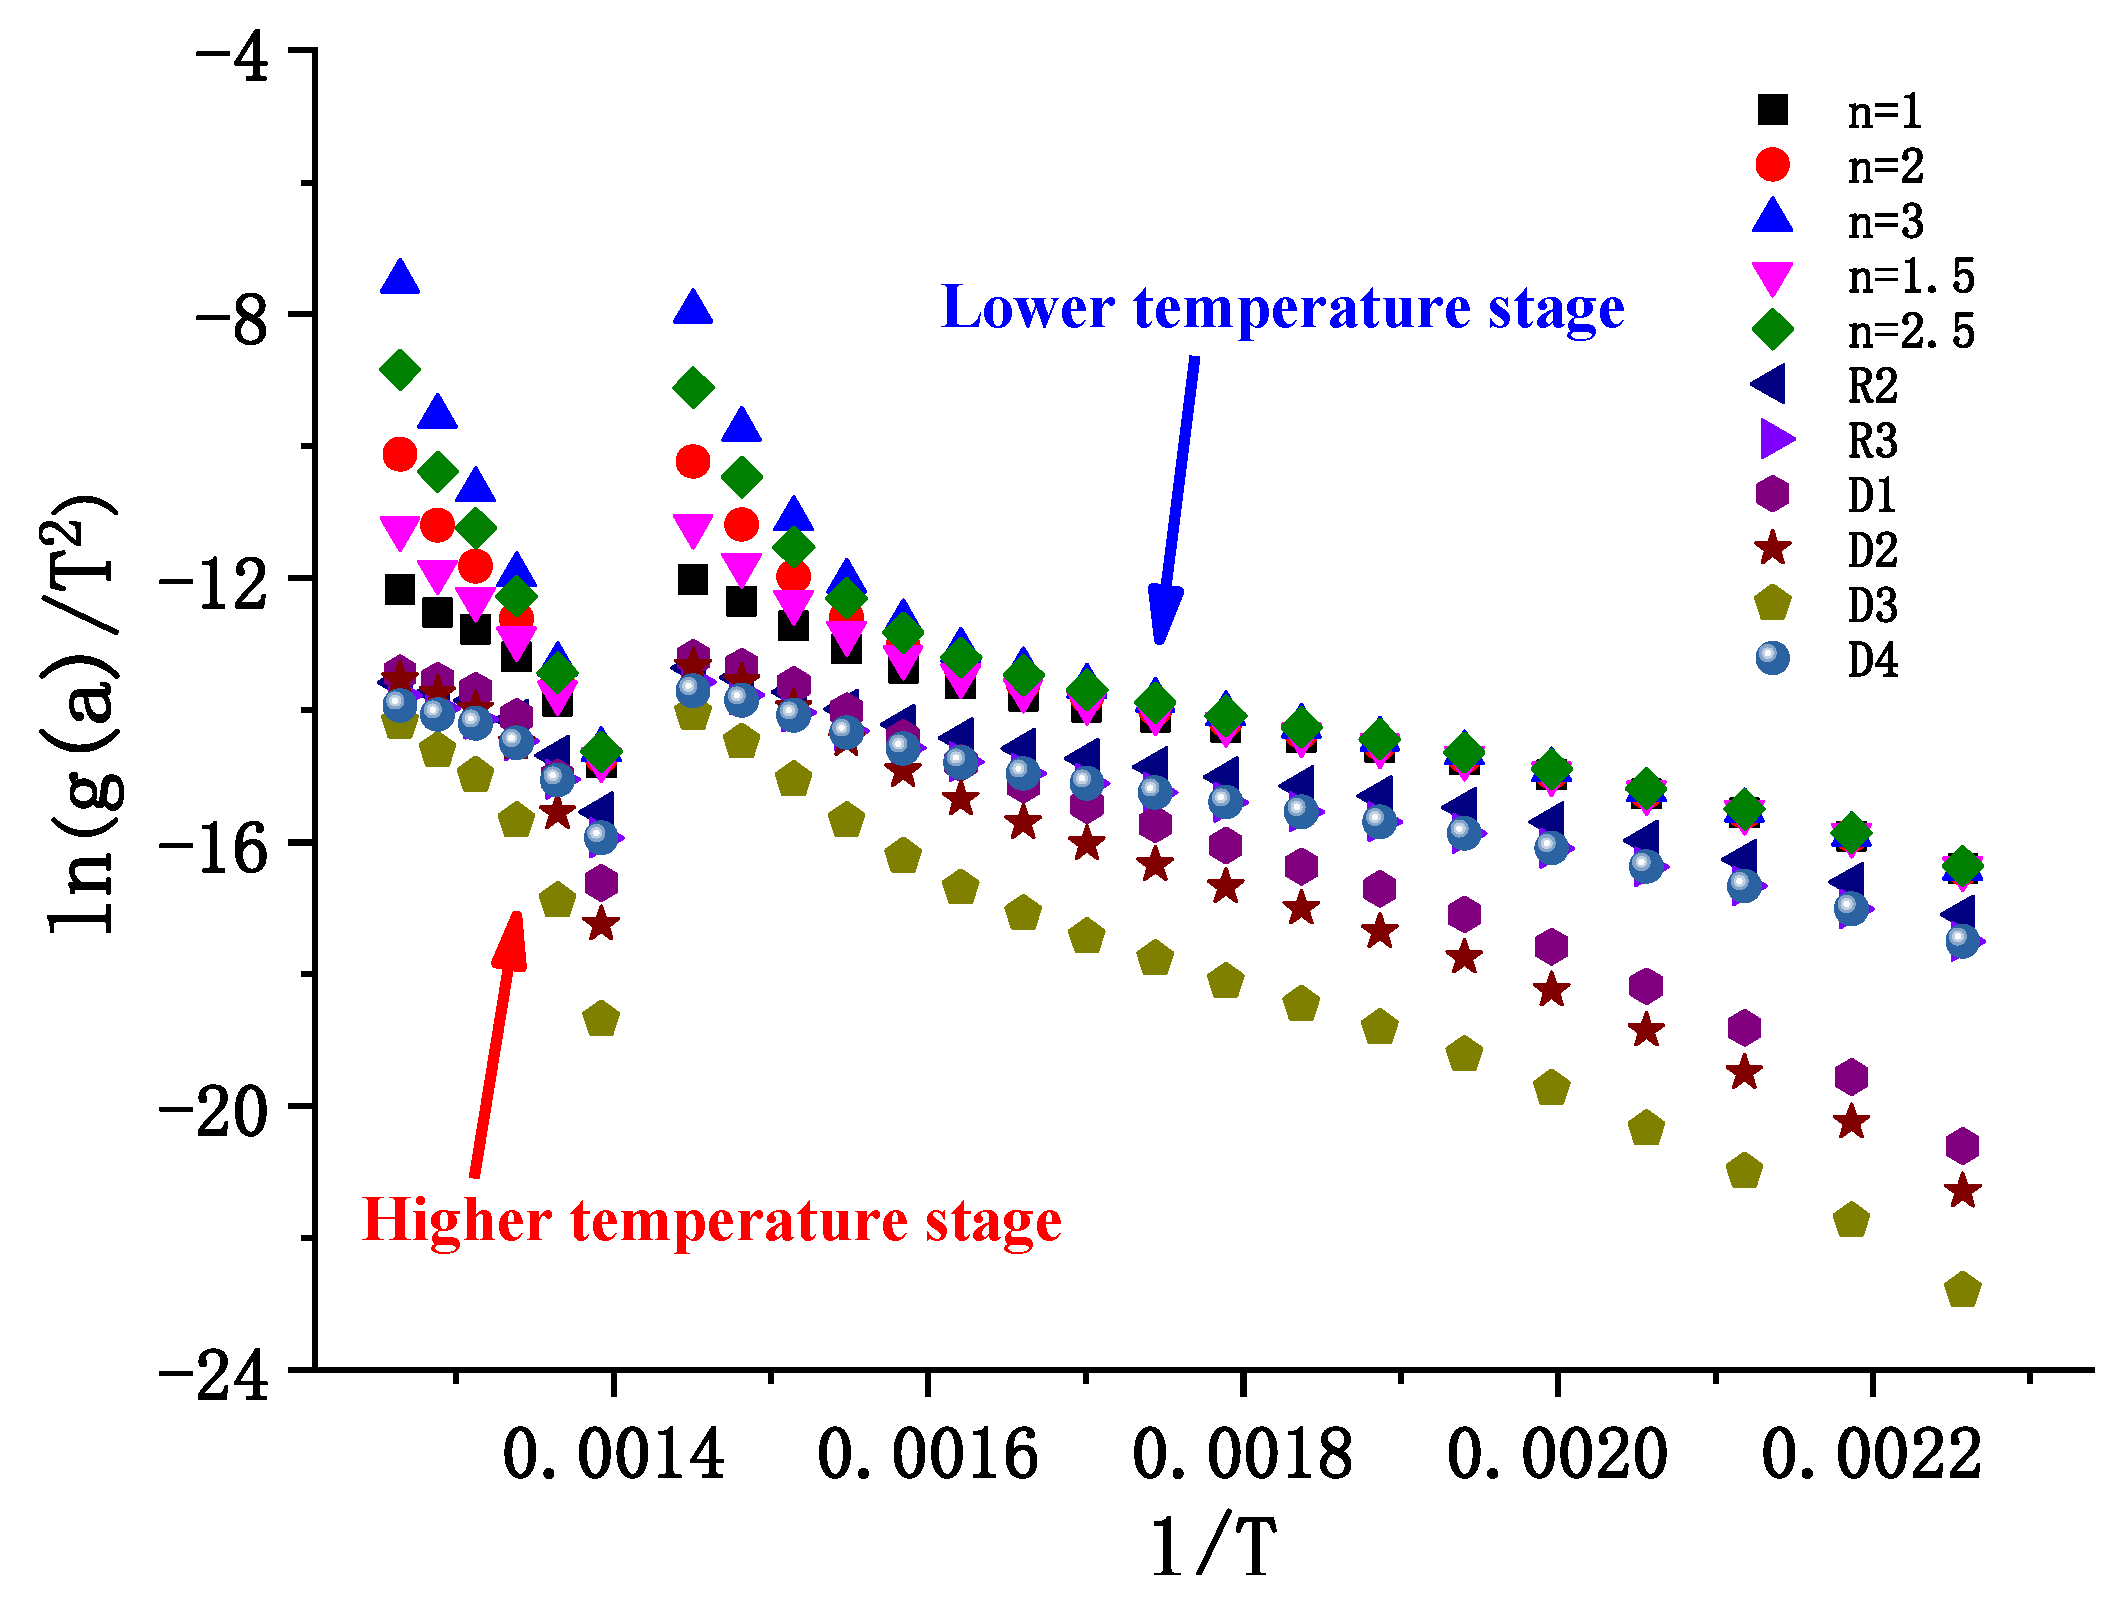
3.1.2. Pyrolysis Kinetic Analysis
3.2. The Influence of Deposition Time on Grease Pyrolysis Performance
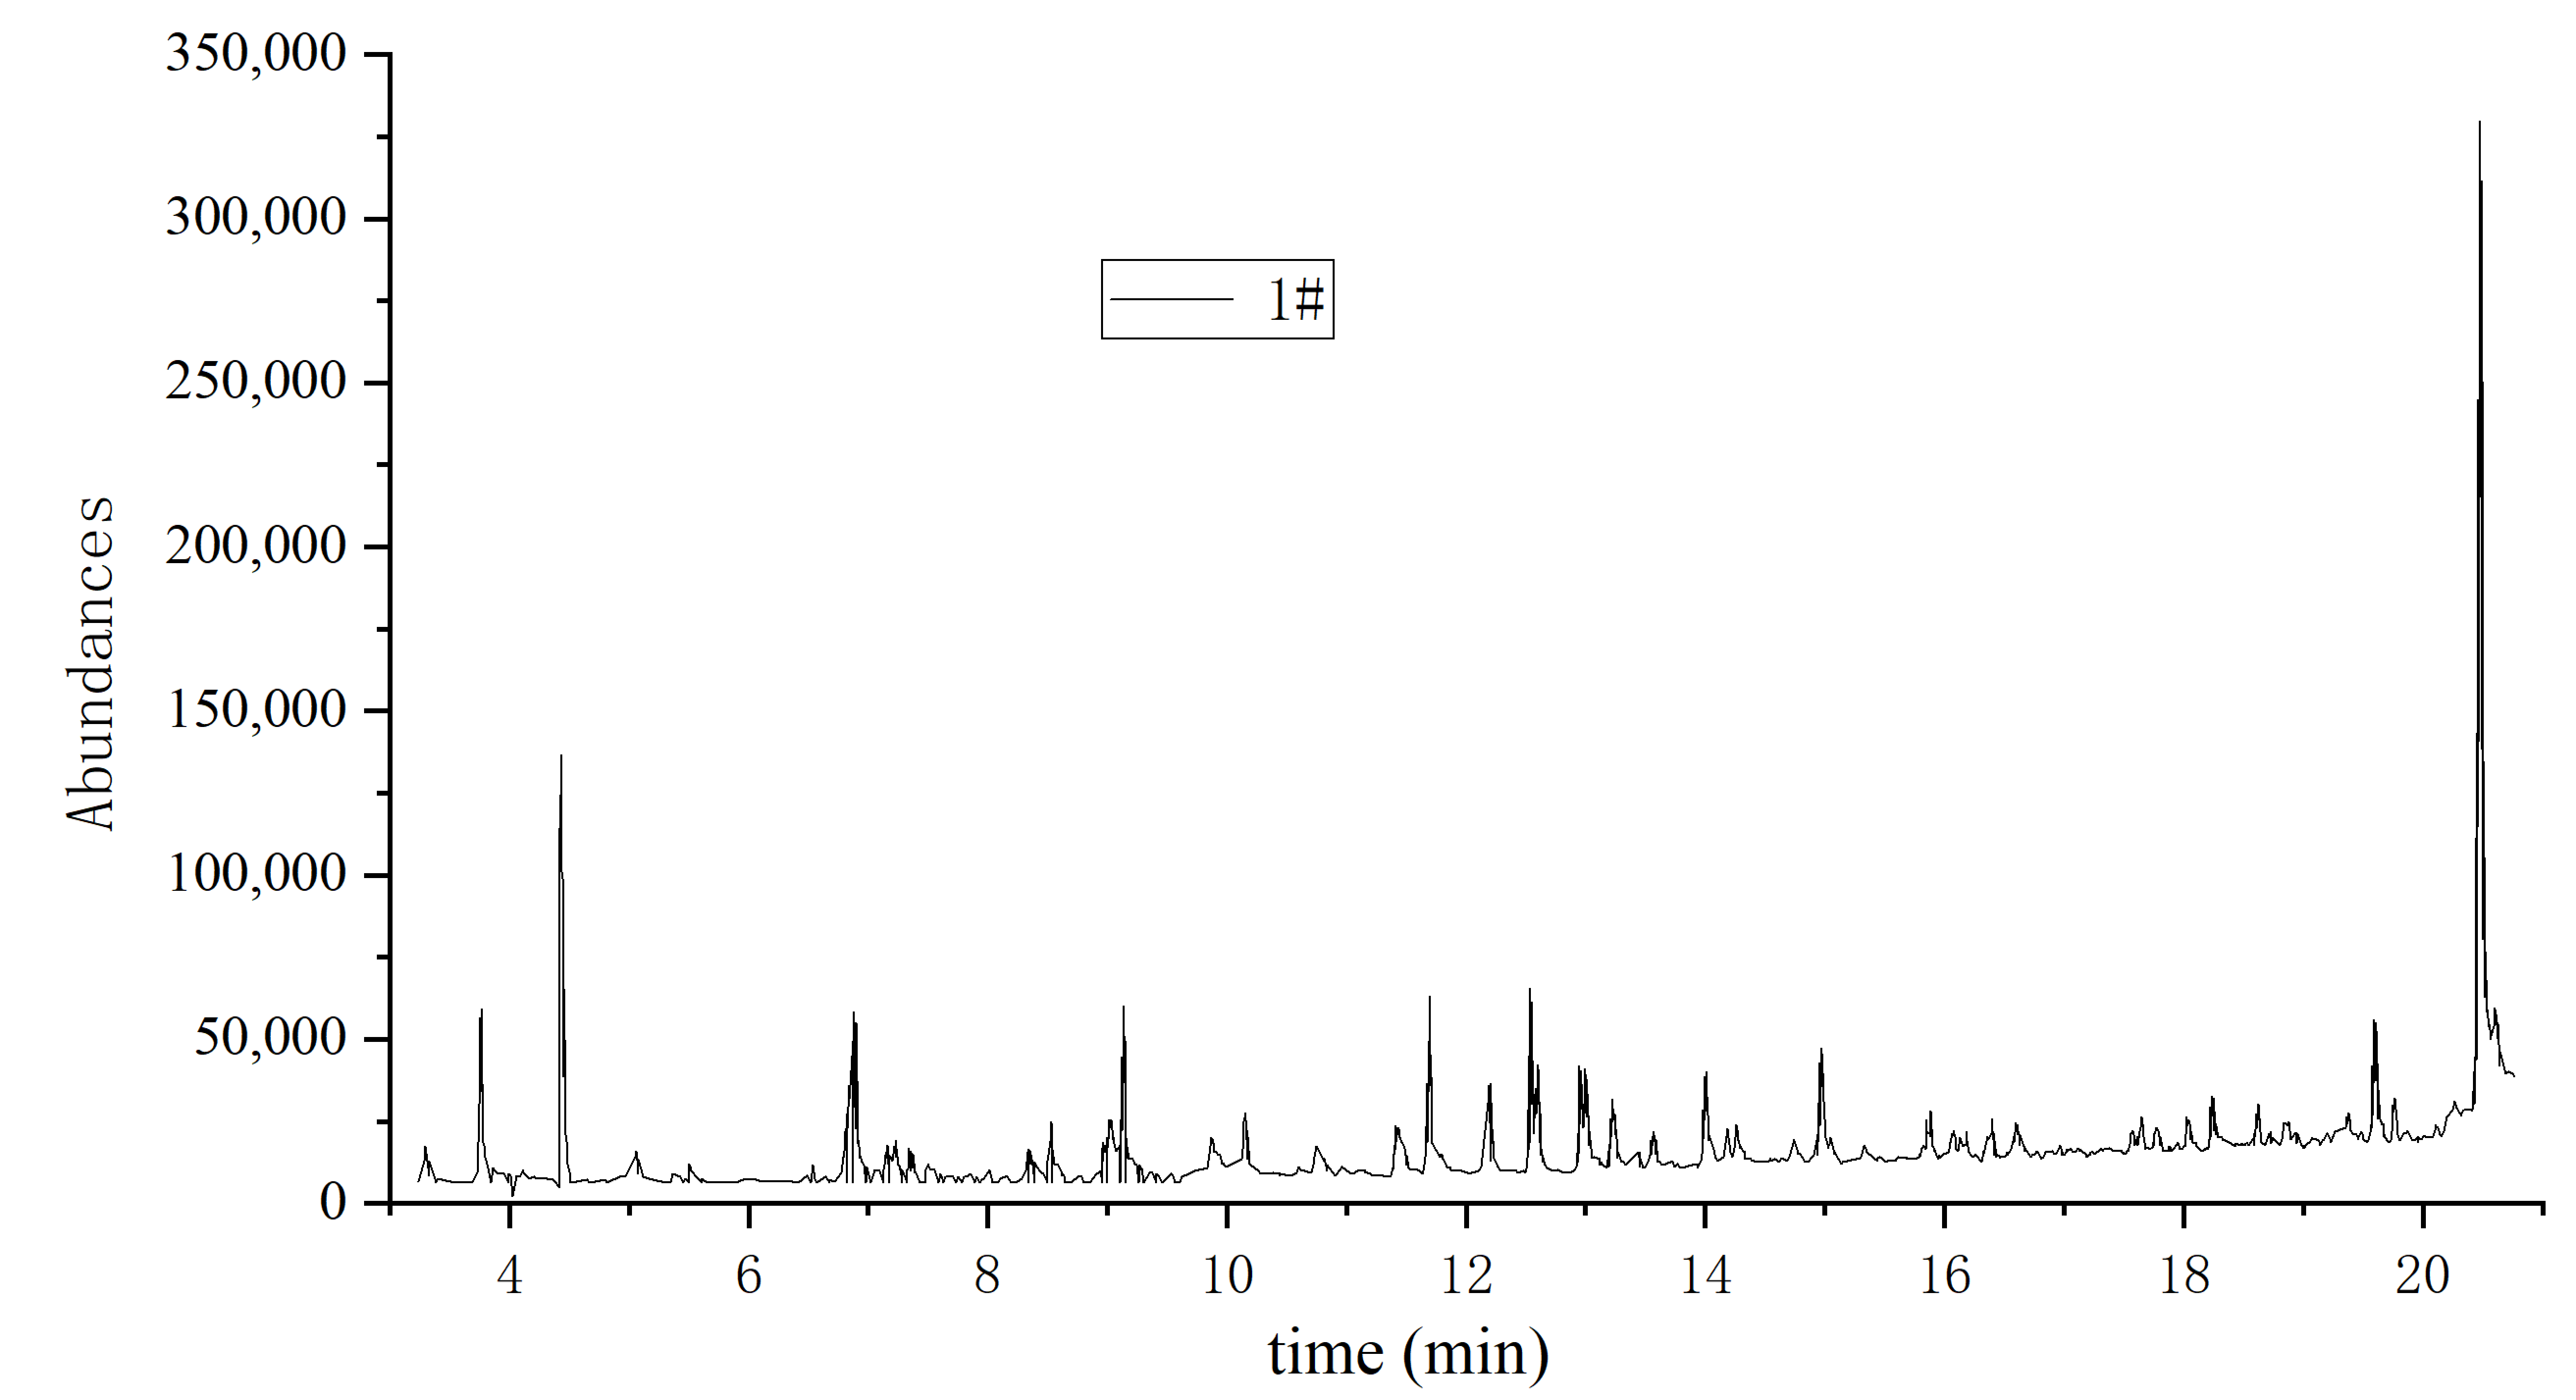
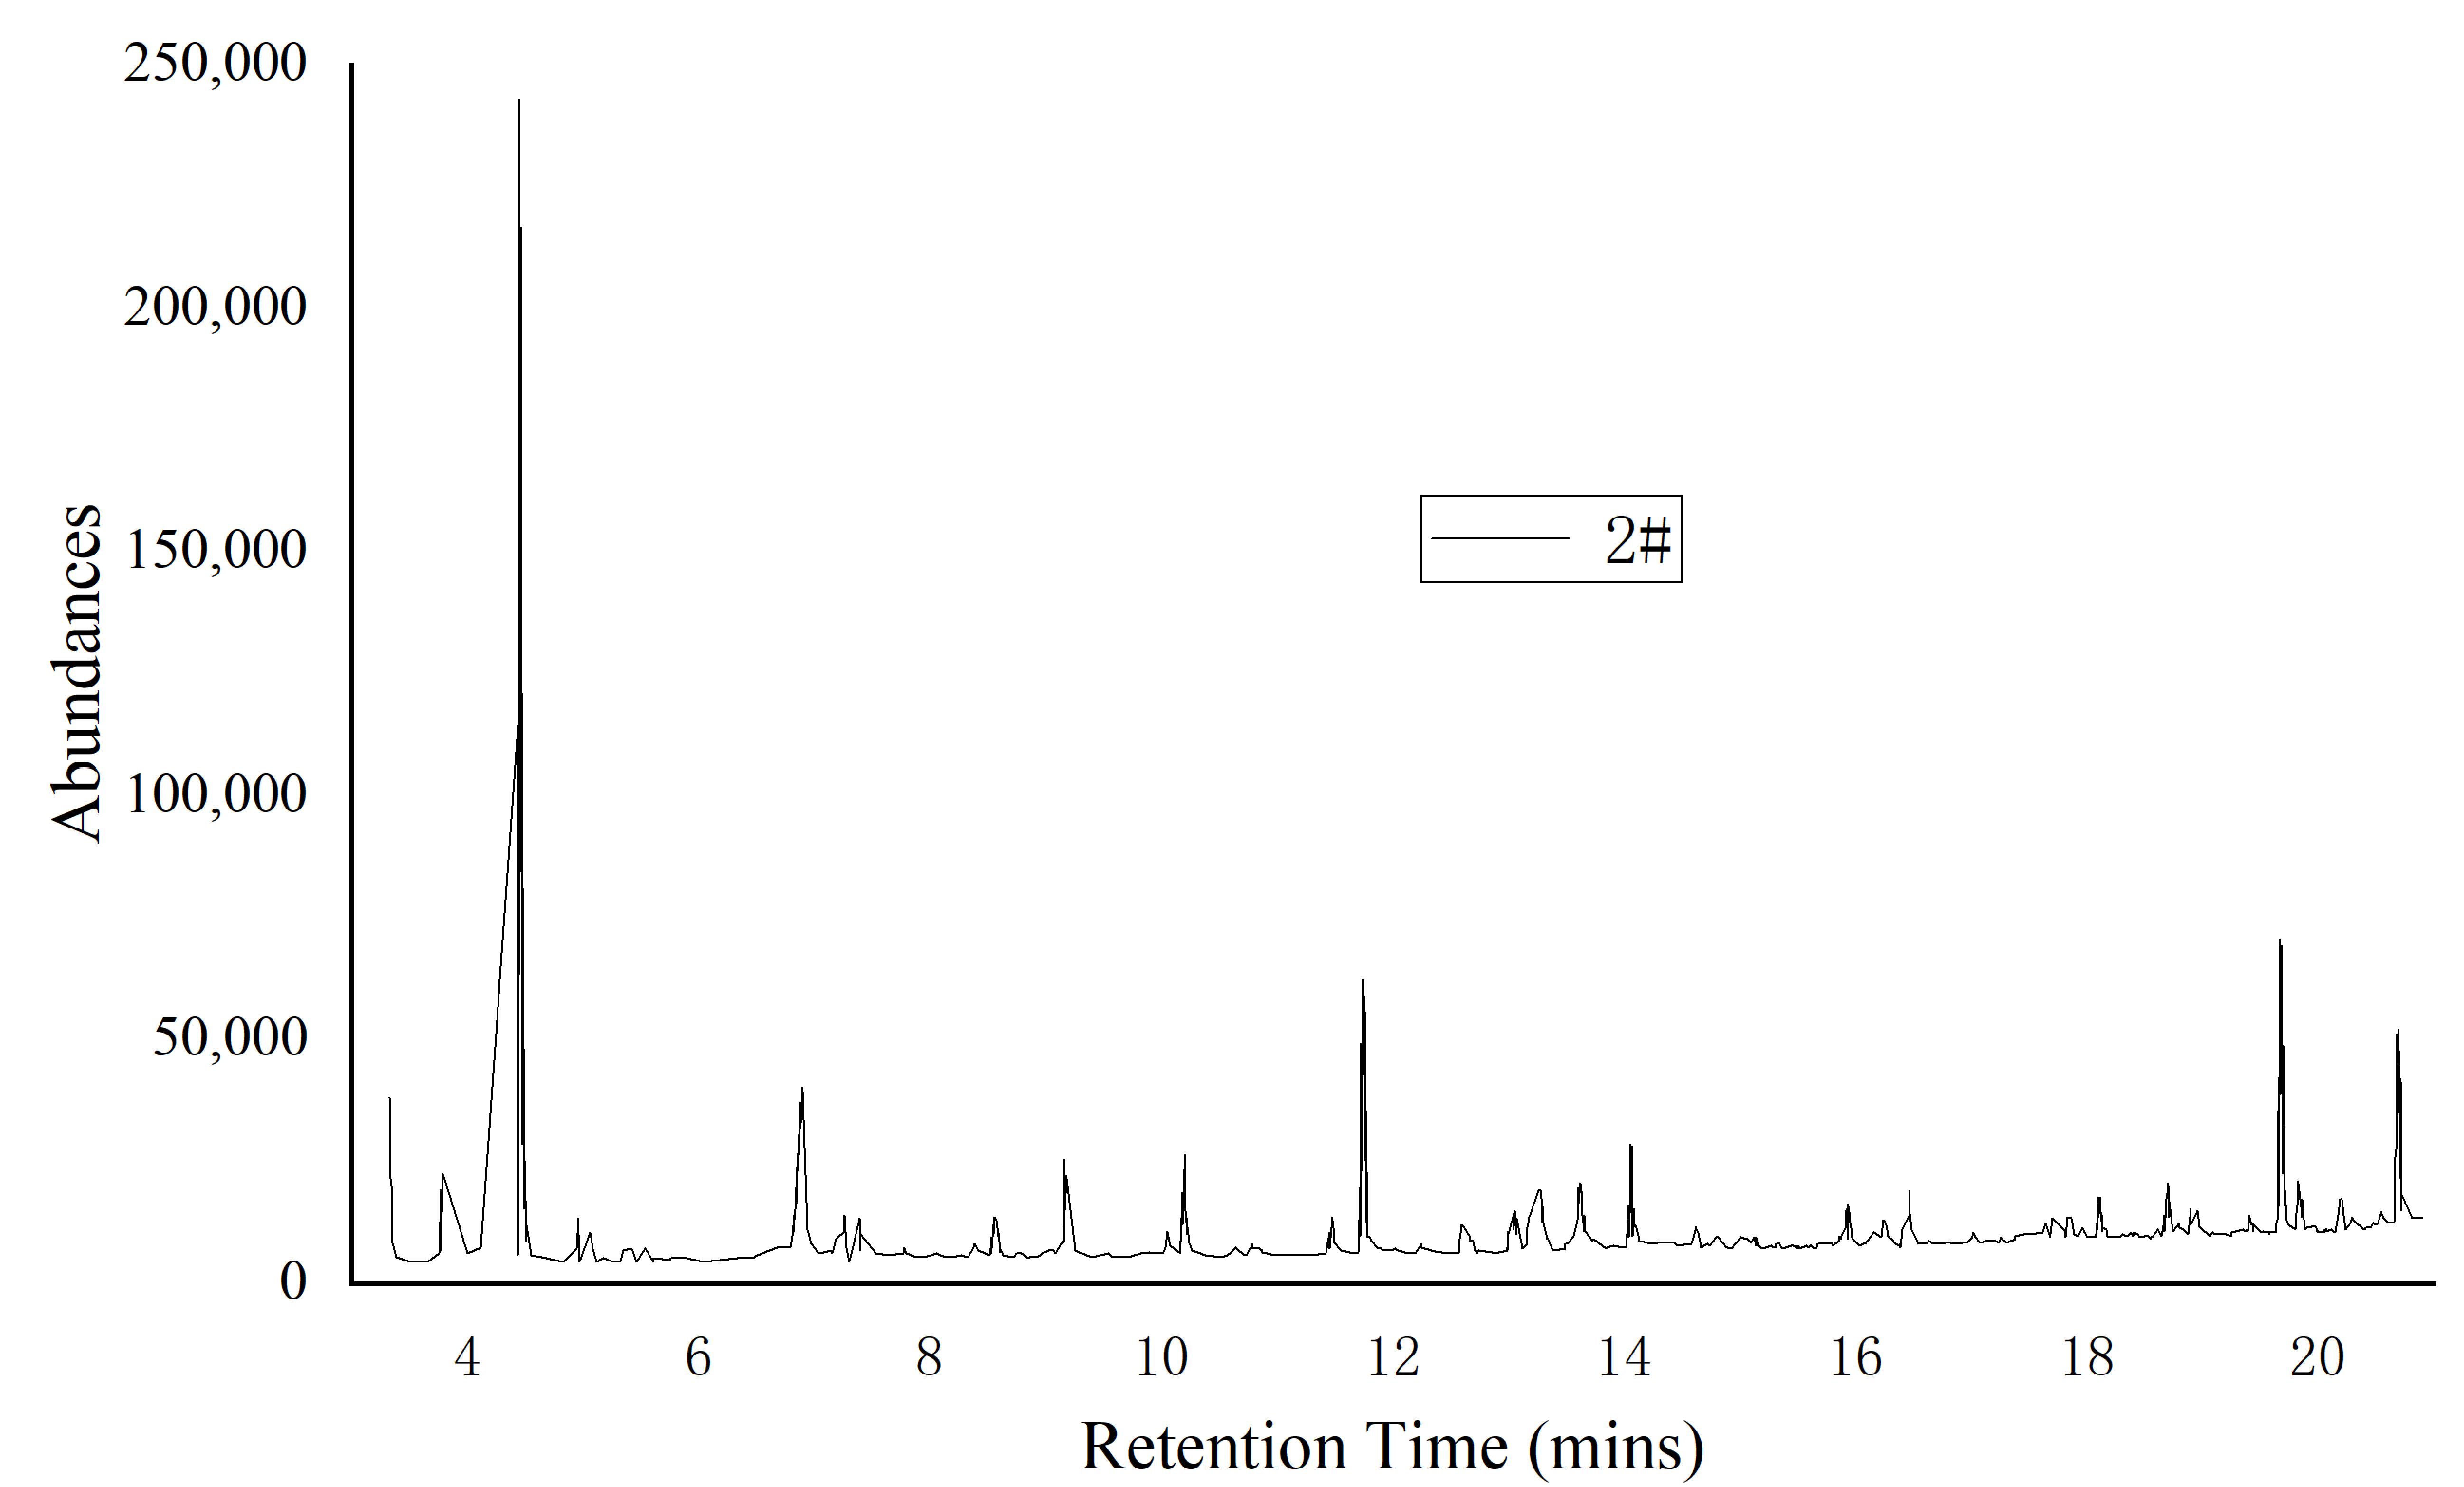
3.2.1. Pyrolysis Process Analysis of Samples
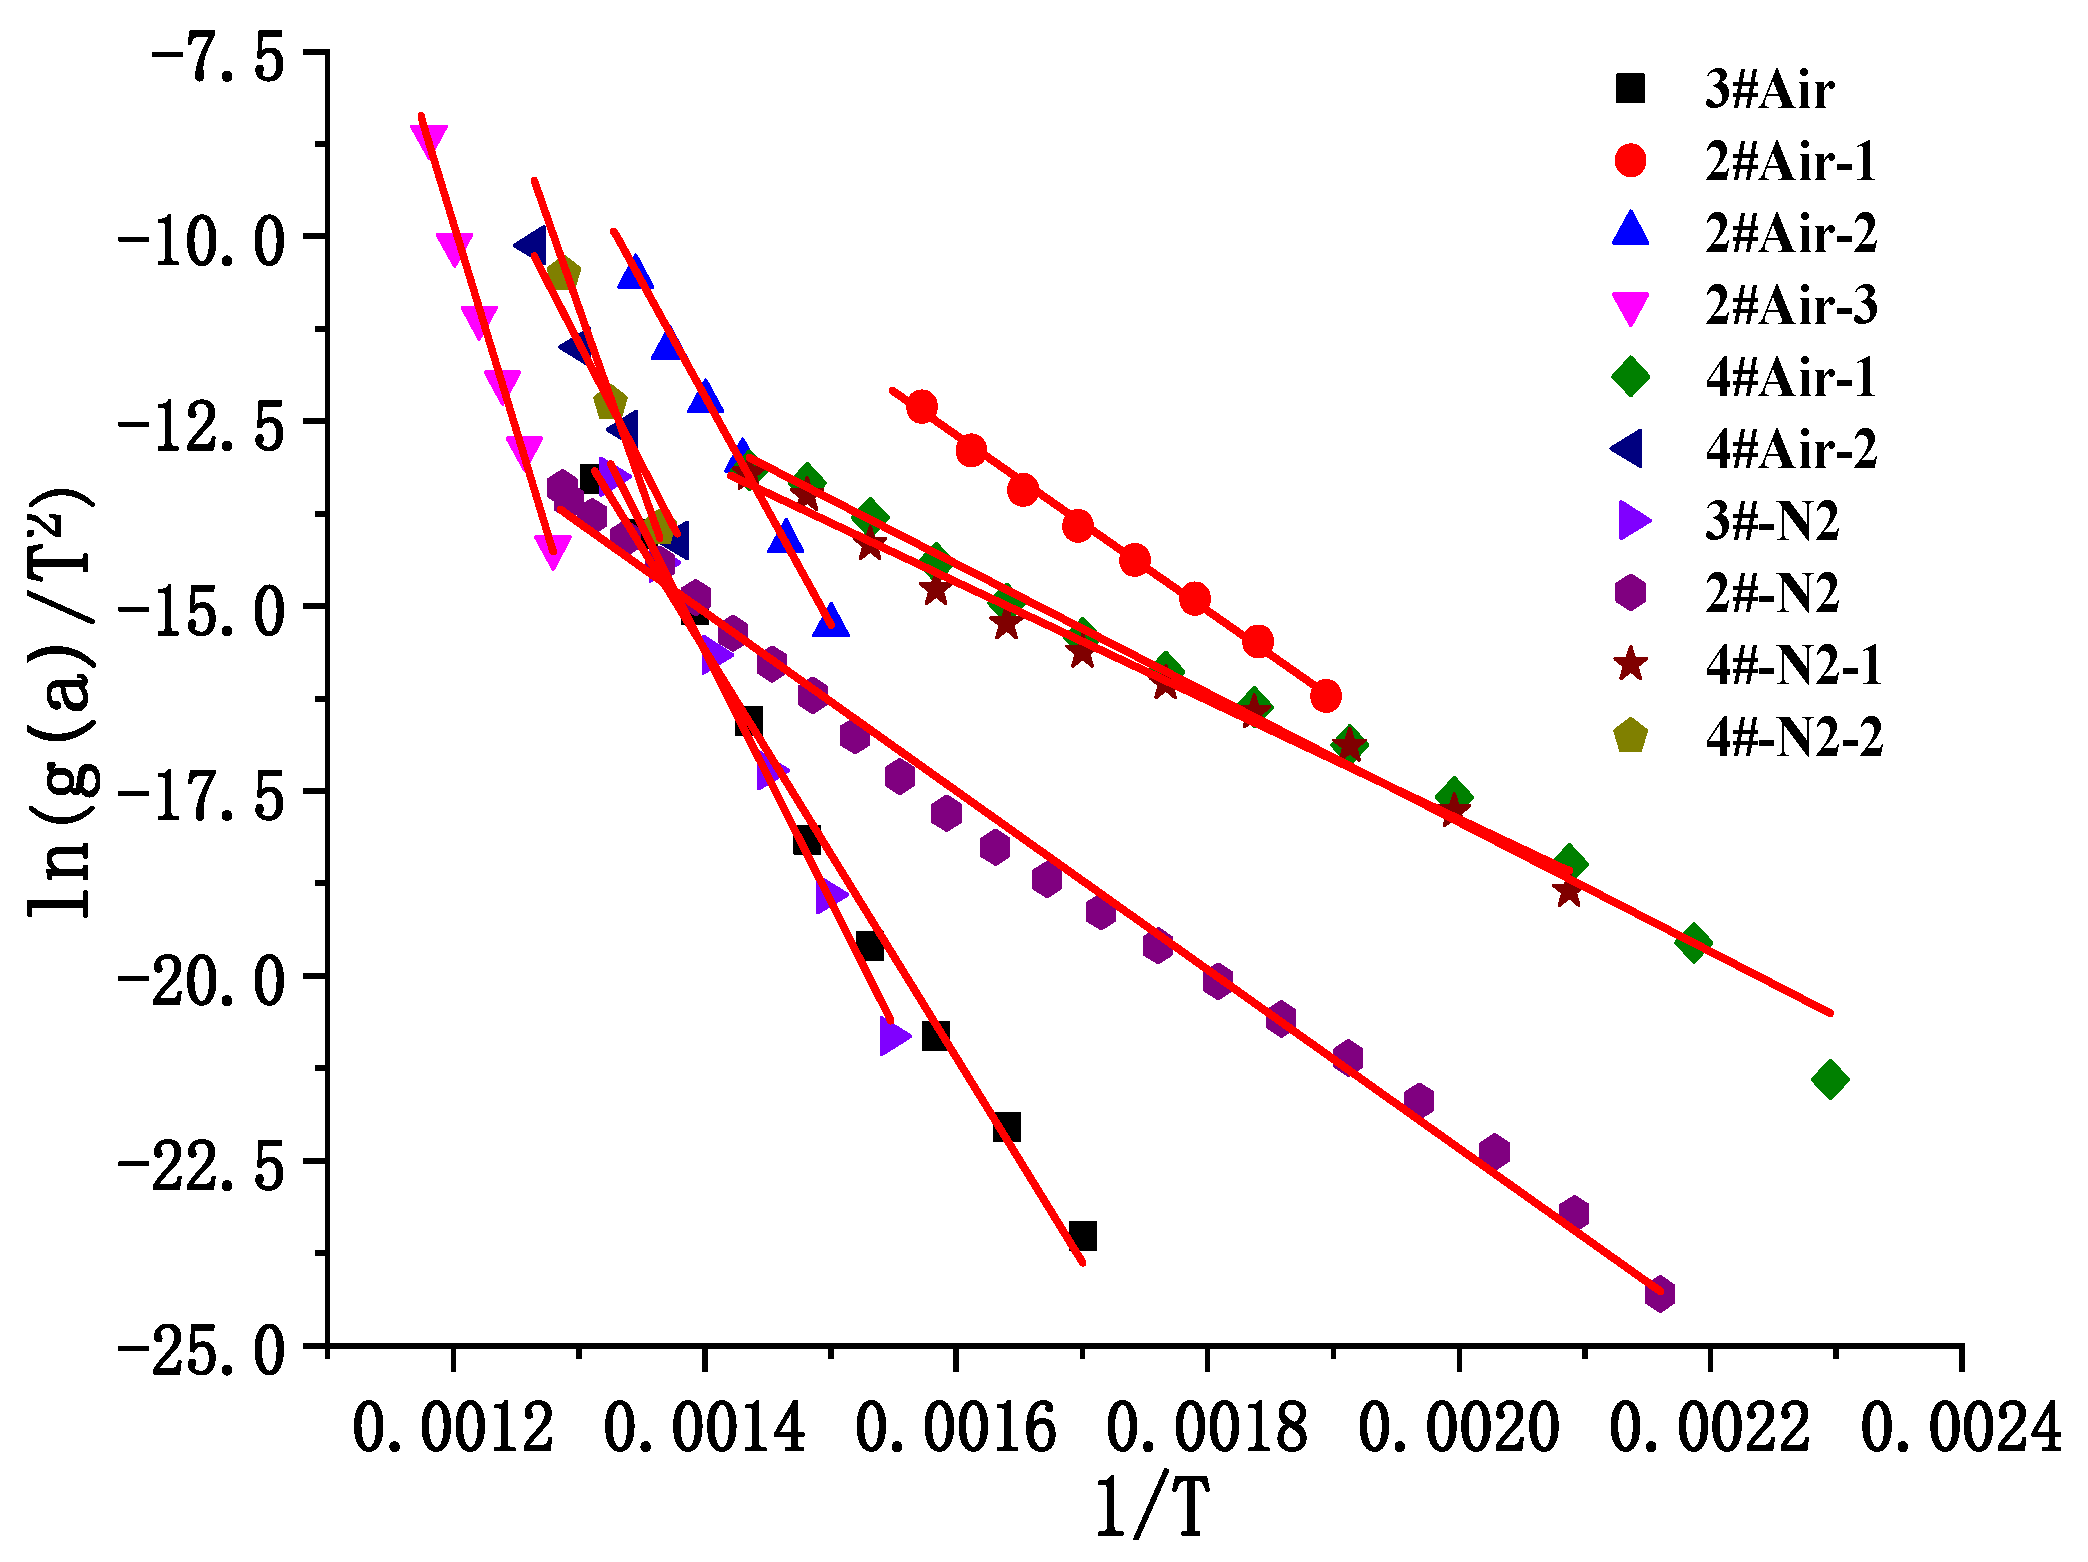
3.2.2. Analysis of Pyrolysis and Combustion Dynamics
4. Conclusions
Author Contributions
Funding
Data Availability Statement
Conflicts of Interest
References
- US Fire Administration (USFA). Restaurant Fires, October 2004; US Fire Administration (USFA): Emmitsburg, MD, USA, 2004; p. 1. Available online: https://apps.usfa.fema.gov/downloads/pdf/statistics/v4i3.pdf (accessed on 25 March 2025).
- Campbell, R.B. Structure Fires in Eating and Drinking Establishments; National Fire Protection Association, Fire Analysis and Research Division: Quincy, MA, USA, 2017. [Google Scholar]
- Horton, D. Lessons learned from commercial kitchen fire investigations. ASHRAE J. 2015, 57, 18. [Google Scholar]
- Ruoso, A.C.; Corrêa Bitencourt, L.; Urach Sudati, L.; Klunk, M.A.; Caetano, N.R. New parameters for the forest biomass waste ecofirewood manufacturing process optimization. Periódico Tchê Química 2019, 16, 32. [Google Scholar] [CrossRef]
- Ağbulut, Ü.; Yeşilyurt, M.K.; Sarıdemir, S. Wastes to energy: Improving the poor properties of waste tire pyrolysis oil with waste cooking oil methyl ester and waste fusel alcohol–A detailed assessment on the combustion, emission, and performance characteristics of a CI engine. Energy 2021, 222, 119942. [Google Scholar] [CrossRef]
- Zhang, A.; Deng, N.; Shen, C.; Hao, R.; Liu, J.; Wang, Y.; Long, Z. Survey study on Chinese commercial kitchen exhaust fume systems in Tianjin. Build. Environ. 2020, 171, 106629. [Google Scholar] [CrossRef]
- Tao, C.; He, L.; Zhou, X.; Li, H.; Ren, Q.; Han, H.; Hu, S.; Su, S.; Wang, Y.; Xiang, J. Review of emission characteristics and purification methods of volatile organic compounds (VOCs) in cooking oil fume. Processes 2023, 11, 705. [Google Scholar] [CrossRef]
- Omidghane, M.; Bartoli, M.; Asomaning, J.; Xia, L.; Chae, M.; Bressler, D.C. Pyrolysis of fatty acids derived from hydrolysis of brown grease with biosolids. Environ. Sci. Pollut. Res. 2020, 27, 26395–26405. [Google Scholar] [CrossRef] [PubMed]
- Pratt, L.M.; Kim, J.; Lo, H.Y.; Xiao, D. Brown grease pyrolysis under pressure: Extending the range of reaction conditions and hydrocarbon product distributions. Fuel 2021, 289, 119782. [Google Scholar] [CrossRef]
- Guo, Z. Numerical simulation study of the factors affecting commercial kitchen flue fires. Fire Sci. Technol. 2015, 34, 1147–1151. [Google Scholar]
- National Fire and Rescue Bureau. Fire Safety Management of Assembly Occupancies: GB/T 40248-2021[S]. China Standards Press. 2021. Available online: https://openstd.samr.gov.cn/bzgk/gb/newGbInfo?hcno=B0E984B840A01A60224BBC4FB41FF6E8 (accessed on 25 March 2025).
- Beijing Municipality’s Regulations on Work Safety for Catering Business Units [EB/OL]. Available online: https://www.beijing.gov.cn/gongkai/zfxxgk/zc/gz/202112/t20211217_2563759.html (accessed on 21 February 2022).
- Yunnan Provincial People’s Government. Regulations on Fire Safety Management of Units in Yunnan Province. Available online: https://www.yn.gov.cn/zwgk/zcwj/zxwj/201412/t20141209_142716.html (accessed on 25 March 2025).
- Zhang, W.; Zhang, Q.; Pan, R.; Chao, J.; Yu, H.; Ding, Y. Study on fire risk of typical thermal insulation materials based on pyrolysis, combustion and flame spread experiments. Polym. Bull. 2025, 1–25. [Google Scholar] [CrossRef]
- Dunnigan, L.; Ashman, P.J.; Zhang, X.; Kwong, C.W. Production of biochar from rice husk: Particulate emissions from the combustion of raw pyrolysis volatiles. J. Clean. Prod. 2018, 172, 1639–1645. [Google Scholar] [CrossRef]
- Li, L.; Xiuli, Y.; Chuangzhi, W. Study on the Pyrolysis and Combustion Characteristics of Bio-oil. Acta Sol. Energy 2008, 29, 733–736. [Google Scholar]
- Sankaranarayanan, S.; Won, W. Catalytic pyrolysis of biomass to produce bio-oil using layered double hydroxides (LDH)-derived materials. GCB Bioenergy 2024, 16, 13124. [Google Scholar] [CrossRef]
- Magdziarz, A.; Wilk, M. Thermogravimetric study of biomass, sewage sludge and coal combustion. Energy Convers. Manag. 2013, 75, 425–430. [Google Scholar] [CrossRef]
- An, W.; Tang, Y.; Liang, K.; Wang, T.; Zhou, Y.; Wen, Z. Experimental study on flammability and flame spread characteristics of polyvinyl chloride (PVC) cable. Polymers 2020, 12, 2789. [Google Scholar] [CrossRef] [PubMed]
- Halikia, I.; Neou-Syngouna, P.; Kolitsa, D. Isothermal kinetic analysis of the thermal decomposition of magnesium hydroxide using thermogravimetric data. Thermochim. Acta 1998, 320, 75–88. [Google Scholar] [CrossRef]
- Trittschack, R.; Grobéty Bernard Brodard, P. Kinetics of the chrysotile and brucite dehydroxylation reaction: A combined non-isothermal/isothermal thermogravimetric analysis and high-temperature X-ray powder diffraction study. Phys. Chem. Miner. 2014, 41, 197–214. [Google Scholar] [CrossRef]
- Vyazovkin, S.; Burnham, A.K.; Criado, J.M.; Pérez-Maqueda, L.A.; Popescu, C.; Sbirrazzuoli, N. ICTAC Kinetics Committee recommendations for performing kinetic computations on thermal analysis data. Thermochim. Acta 2011, 520, 1–19. [Google Scholar] [CrossRef]
- Caetano, N.R.; Lorenzini, G.; Rocha Lhamby, A.; Monteiro Guillet, V.M.; Antônio Klunk, M.; Oliveira Rocha, L.A. Experimental Assessment of Thermal Radiation Behavior Emitted by Solid Porous Material. Int. J. Heat Technol. 2020, 38, 1–8. [Google Scholar] [CrossRef]


| Sample | Attachment Position | Sedimentary Thickness/mm | Deposition Time/Day | Traits |
|---|---|---|---|---|
| 1# | Flue outlet to the outside | 2.1 | 60 | Gray and black, low viscosity, low gloss |
| 2# | Exhaust system inlet | 1.5 | Light brown, gummy solid, Poor light transmittance | |
| 3# | 0.6 | 14 | Yellow, viscous liquid, good light transmission | |
| 4# | 3.5 | >365 | Black, gummy solid, opaque |
| Atmosphere | Sample | Ts/°C | Weight Loss Peak Temperature and the Corresponding Peak Traits | Decomposition Temperature and the Proportion of Total Weightlessness | Th/°C | X∞/% | ||
|---|---|---|---|---|---|---|---|---|
| Temperature/°C | Peak/%·min−1 | Temperature Segment/°C | Weightlessness Ratio/% | |||||
| Air | 1# | 184 | 373 | 7.25 | 184–416 | 54.93 | 684 | 36.32 |
| 467 | 5.72 | 416–518 | 29.17 | |||||
| 612 | 1.81 | 518–684 | 15.91 | |||||
| 2# | 192 | 402 | 12.01 | 192–416 | 52.31 | 619 | 8.27 | |
| 438 | 16.17 | 416–518 | 41.51 | |||||
| 568 | 1.20 | 518–619 | 6.18 | |||||
| Nitrogen | 1# | 220 | 366 | 7.28 | 220–416 | 58.76 | 528 | 47.81 |
| 467 | 5.43 | 416–525 | 33.07 | |||||
| 2# | 235 | 438 | 13.3 | 235–530 | 80.65 | 518 | 19.65 | |
| Sample | Residence Time/min | Compound Name | Molecular Formula | Molecular Weight | Percentage P% | |
|---|---|---|---|---|---|---|
| 1# | 2# | |||||
| 1 | 3.73 | Caproaldehyde | C6H12O | 100.16 | 1.56 | 6.41 |
| 2 | 4.49 | Diacetone alcohol | C6H12O2 | 116.2 | 87.42 | 15.24 |
| 3 | 6.86 | Caproic acid | C6H12O2 | 116.16 | 3.69 | 4.12 |
| 4 | 9.11 | Nonanal | C9H18O | 142.24 | 2.07 | 2.98 |
| 5 | 12.52 | Trans-2,4-decadinenal | C10H16O | 152.23 | 0.29 | 4.09 |
| 6 | 20.47 | hexadecanoic acid (Palmitic acid) | C16H32O2 | 256.42 | 4.97 | 67.16 |
| Reaction Models | |||
|---|---|---|---|
| N order simple model | Number | ||
| F1 | |||
| Contracting cylinder | R2 | ||
| Contracting sphere | R3 | ||
| One-dimensional diffusion | D1 | ||
| Two-dimensional diffusion | D2 | ||
| Three-dimensional diffusion (Jander) | D3 | ||
| Three-dimensional diffusion (Ginstling-Brounshein) | D4 | ||
| Atmosphere | Sample | Temperature/°C | Activation Energy E/kJ·mol−1 | Frequency Factor A/mol−1 | Goodness of Fit r | |
|---|---|---|---|---|---|---|
| air | 1# | 184–416 | 77.06 | 3.18 × 1002 | 0.993 | |
| 416–518 | 239.98 | 1.00 × 10¹⁴ | 0.997 | |||
| 518–684 | 150.81 | 3.94 × 10⁵ | 0.992 | |||
| 2# | 192–416 | 139.29 | 1.98 × 10⁷ | 0.991 | ||
| 416–518 | 125.88 | 6.29 × 10⁵ | 0.992 | |||
| 518–619 | 227.11 | 6.80 × 10¹⁰ | 0.995 | |||
| N2 | 1# | 235–416 | 156.09 | 1.90 × 10⁷ | 0.990 | |
| 416–532 | 201.23 | 2.37 × 10¹⁴ | 0.994 | |||
| 2# | 220–416 | 125.54 | 3.51 × 10⁸ | 0.997 | ||
| 416–525 | 267.57 | 1.04 × 10¹⁶ | 0.995 |
| Environment | Sample | Ts/°C | The Weight-Loss Peak | The Weight-Loss Proportion of Each Temp Stage | Th/°C | X∞/% | ||
|---|---|---|---|---|---|---|---|---|
| Temp/°C | Peak Value/%·min−1 | The Range of Temp/°C | The Percentage of Total Weight Loss/% | |||||
| Air | 2# | 232 | 402 | 12.01 | 192–416 | 52.31 | 593 | 2.18 |
| 438 | 16.17 | 416–518 | 41.51 | |||||
| 568 | 1.20 | 518–619 | 6.18 | |||||
| 3# | 286 | 438 | 30.1 | 286–496 | 98.11 | 496 | 1.07 | |
| 4# | 128 | 395 | 12.61 | 128–438 | 58.77 | 561 | 9.64 | |
| 467 | 5.81 | 438–561 | 20.90 | |||||
| 2# | 268 | 414 | 15.37 | 268–515 | 90.19 | 515 | 13.32 | |
| Nitrogen | 3# | 336 | 438 | 29.28 | 339–496 | 99.80 | 467 | 2.15 |
| 4# | 148 | 396 | 12.42 | 148–438 | 75.04 | 532 | 22.85 | |
| 467 | 5.72 | 438–525 | 20.49 | |||||
| Environment | Sample | Sample | Activation Energy E (kJ/mol) | Frequency Factor A (1/mol) | Fitting Degree r | |
|---|---|---|---|---|---|---|
| Air | 1# | 286–496 | 237.84 | 1.70 × 10¹³ | 0.99323 | |
| 2# | 228–377 | 99.81 | 1.92 × 10⁵ | 0.99167 | ||
| 382–485 | 245.96 | 3.92 × 10¹⁵ | 0.99527 | |||
| 492–583 | 446.10 | 7.63 × 1026 | 0.98685 | |||
| 3# | 148–438 | 72.87 | 9.93 × 10⁵ | 0.99259 | ||
| 445–532 | 360.99 | 6.67 × 10²² | 0.98989 | |||
| Nitrogen | 1# | 344–481 | 311.20 | 7.83 × 10¹⁸ | 0.98389 | |
| 2# | 268–515 | 139.89 | 1.56 × 10⁶ | 0.99532 | ||
| 3# | 150–438 | 77.51 | 1.55 × 10⁶ | 0.98054 | ||
| 440–525 | 364.68 | 3.85 × 1024 | 0.99478 |
Disclaimer/Publisher’s Note: The statements, opinions and data contained in all publications are solely those of the individual author(s) and contributor(s) and not of MDPI and/or the editor(s). MDPI and/or the editor(s) disclaim responsibility for any injury to people or property resulting from any ideas, methods, instructions or products referred to in the content. |
© 2025 by the authors. Licensee MDPI, Basel, Switzerland. This article is an open access article distributed under the terms and conditions of the Creative Commons Attribution (CC BY) license (https://creativecommons.org/licenses/by/4.0/).
Share and Cite
Guo, Z.; Yue, H.; Zhang, T. Influence of Deposition Time and Location on the Pyrolysis Performance of Grease in Kitchen Flues. Fire 2025, 8, 173. https://doi.org/10.3390/fire8050173
Guo Z, Yue H, Zhang T. Influence of Deposition Time and Location on the Pyrolysis Performance of Grease in Kitchen Flues. Fire. 2025; 8(5):173. https://doi.org/10.3390/fire8050173
Chicago/Turabian StyleGuo, Zidong, Hailing Yue, and Tianwei Zhang. 2025. "Influence of Deposition Time and Location on the Pyrolysis Performance of Grease in Kitchen Flues" Fire 8, no. 5: 173. https://doi.org/10.3390/fire8050173
APA StyleGuo, Z., Yue, H., & Zhang, T. (2025). Influence of Deposition Time and Location on the Pyrolysis Performance of Grease in Kitchen Flues. Fire, 8(5), 173. https://doi.org/10.3390/fire8050173