Article

Assessment of Forest Fire Impact and Vegetation Recovery in the Ghalahmah Mountains, Saudi Arabia

1
Department of Biology, College of Science, King Khalid University, Abha 61413, Saudi Arabia
2
Prince Sultan Bin Abdelaziz for Environmental Research and Natural Resources Sustainability Center, King Khalid University, Abha 61421, Saudi Arabia
*
Author to whom correspondence should be addressed.
Fire 2025, 8(5), 172; https://doi.org/10.3390/fire8050172
Submission received: 11 March 2025 / Revised: 14 April 2025 / Accepted: 28 April 2025 / Published: 30 April 2025

Abstract

:
Forest fires are a critical ecological disturbance that significantly impact vegetation dynamics, biodiversity, and ecosystem services. This study investigates the impacts of forest fires in the Ghalahmah Mountains, Saudi Arabia, using remote sensing data and fire impact models to assess fire severity, environmental drivers, and post-fire vegetation recovery. The research integrates Landsat 8, Sentinel-2, and DEM data to analyze the spatial extent and severity of a 2020 fire event using the Relativized Burn Ratio (RBR). Results reveal that high-severity burns covered 49.9% of the affected area, with pre-fire vegetation density (NDVI) and moisture (NDWI) identified as key drivers of fire severity through correlation analysis and Random Forest regression. Post-fire vegetation recovery, assessed using NDVI trends from 2021 to 2024, demonstrated varying recovery rates across vegetation types. Medium NDVI areas (0.2–0.3) recovered fastest, with 134.46 hectares exceeding pre-fire conditions by 2024, while high NDVI areas (>0.3) exhibited slower recovery, with 26.55 hectares still recovering. These findings underscore the resilience of grasslands and shrubs compared to dense woody vegetation, which remains vulnerable to high-severity fires. The study advances fire ecology research by combining multi-source remote sensing data and machine learning techniques to provide a comprehensive understanding of fire impacts and recovery processes in semi-arid mountainous regions. The results suggest valuable insights for sustainable land management and conservation, emphasizing the need for targeted fuel management and protection of ecologically sensitive areas. This research contributes to the broader understanding of fire ecology and supports efforts to post-fire management.

1. Introduction

Forests represent the most extensive terrestrial ecosystem, providing significant economic, ecological, and social benefits [1]. However, recurrent forest fires pose a major threat, disrupting ecosystem structure and impairing essential forest functions. Global tree cover loss from fires alone reached 138 million hectares (Mha) during 2001 to 2023, while 350 Mha was lost due to other factors. The year 2023 recorded the highest fire-induced tree cover loss, with 11.9 Mha burned, accounting for 42% of total tree cover loss that year [2]. In arid and semi-arid regions like Saudi Arabia [3], where ecosystems are already under stress due to harsh climatic conditions, forest fires pose a significant threat to biodiversity, soil stability, and water resources [4]. The Aseer Mountains, a unique ecological zone in Saudi Arabia, are particularly vulnerable to such disturbances due to their rich vegetation cover and complex topography [5]. Recent fire events in the region have underscored the need for a comprehensive understanding of their ecological impacts [6].
Globally, extensive research has focused on post-fire recovery using various approaches, including spectral index trend analysis, modeling, and field-based monitoring. Studies published in Global Change Biology, Ecology Letters, and other leading journals have highlighted how vegetation recovery varies based on fire severity, vegetation type, and climatic conditions [7,8]. However, these methods also face limitations in arid landscapes where vegetation is sparse, and recovery is nonlinear and heterogeneous [9].
This research addresses this gap by integrating remote sensing data and fire impact models to estimate the spatial extent and severity of fires in the Ghalahmah Mountains and assess vegetation recovery dynamics over time. The study specifically evaluates the relationship between fire severity and pre-fire environmental factors, including NDVI, NDWI, land surface temperature (LST), and topographical attributes such as elevation, slope, and aspect [10]. Post-fire recovery is assessed through NDVI time-series analysis across multiple years. Specifically, the study aims to estimate the spatial extent and severity of fires using satellite-derived indices such as the Relativized Burn Ratio (RBR) [11].
The urgency of this research stems from the increasing frequency and intensity of forest fires in the Aseer region, between 27 July 2020 and 17 February 2025. Aseer experienced a total of 1371 VIIRS Alerts fire alerts [12], driven by climate change and human activities [13]. These fires not only disrupt ecosystems [14] but also threaten the livelihoods of local communities dependent on forest resources [15]. Despite their ecological significance, the Aseer Mountains remain understudied in terms of fire impacts and recovery dynamics. Understanding these processes is crucial for developing effective conservation strategies and mitigating future fire risks [16].
This research aims to advance the field of fire ecology by integrating remote sensing data and fire impact models to assess the ecological consequences of forest fires in a unique and understudied region. The objectives of this research are threefold. First, the study aims to estimate the spatial extent and severity of forest fires in the Ghalahmah Mountains using satellite-derived indices, providing a comprehensive assessment of the impact of these fires on the region. Second, it seeks to evaluate the relationship between forest fire severity, measured by the Relative Burn Ratio (RBR), and pre-fire environmental factors, including vegetation indices such as the Normalized Difference Vegetation Index (NDVI) and Normalized Difference Water Index (NDWI), land surface temperature (LST), and topographical attributes like elevation, slope, and aspect. This analysis will help identify key factors influencing fire severity. Finally, the research aims to determine the plant regeneration period by analyzing temporal trends in vegetation indices following fire events, offering insights into the recovery dynamics of the ecosystem post-fire. Together, these objectives aim to enhance understanding of forest fire impacts and recovery processes in the Ghalahmah Mountains.
By integrating remote sensing data and fire impact assessment models, this research aims to provide critical insights into the ecological consequences of forest fires and the natural regeneration processes in the Ghalahmah Mountains, supporting sustainable land management and conservation efforts.

2. Materials and Methods
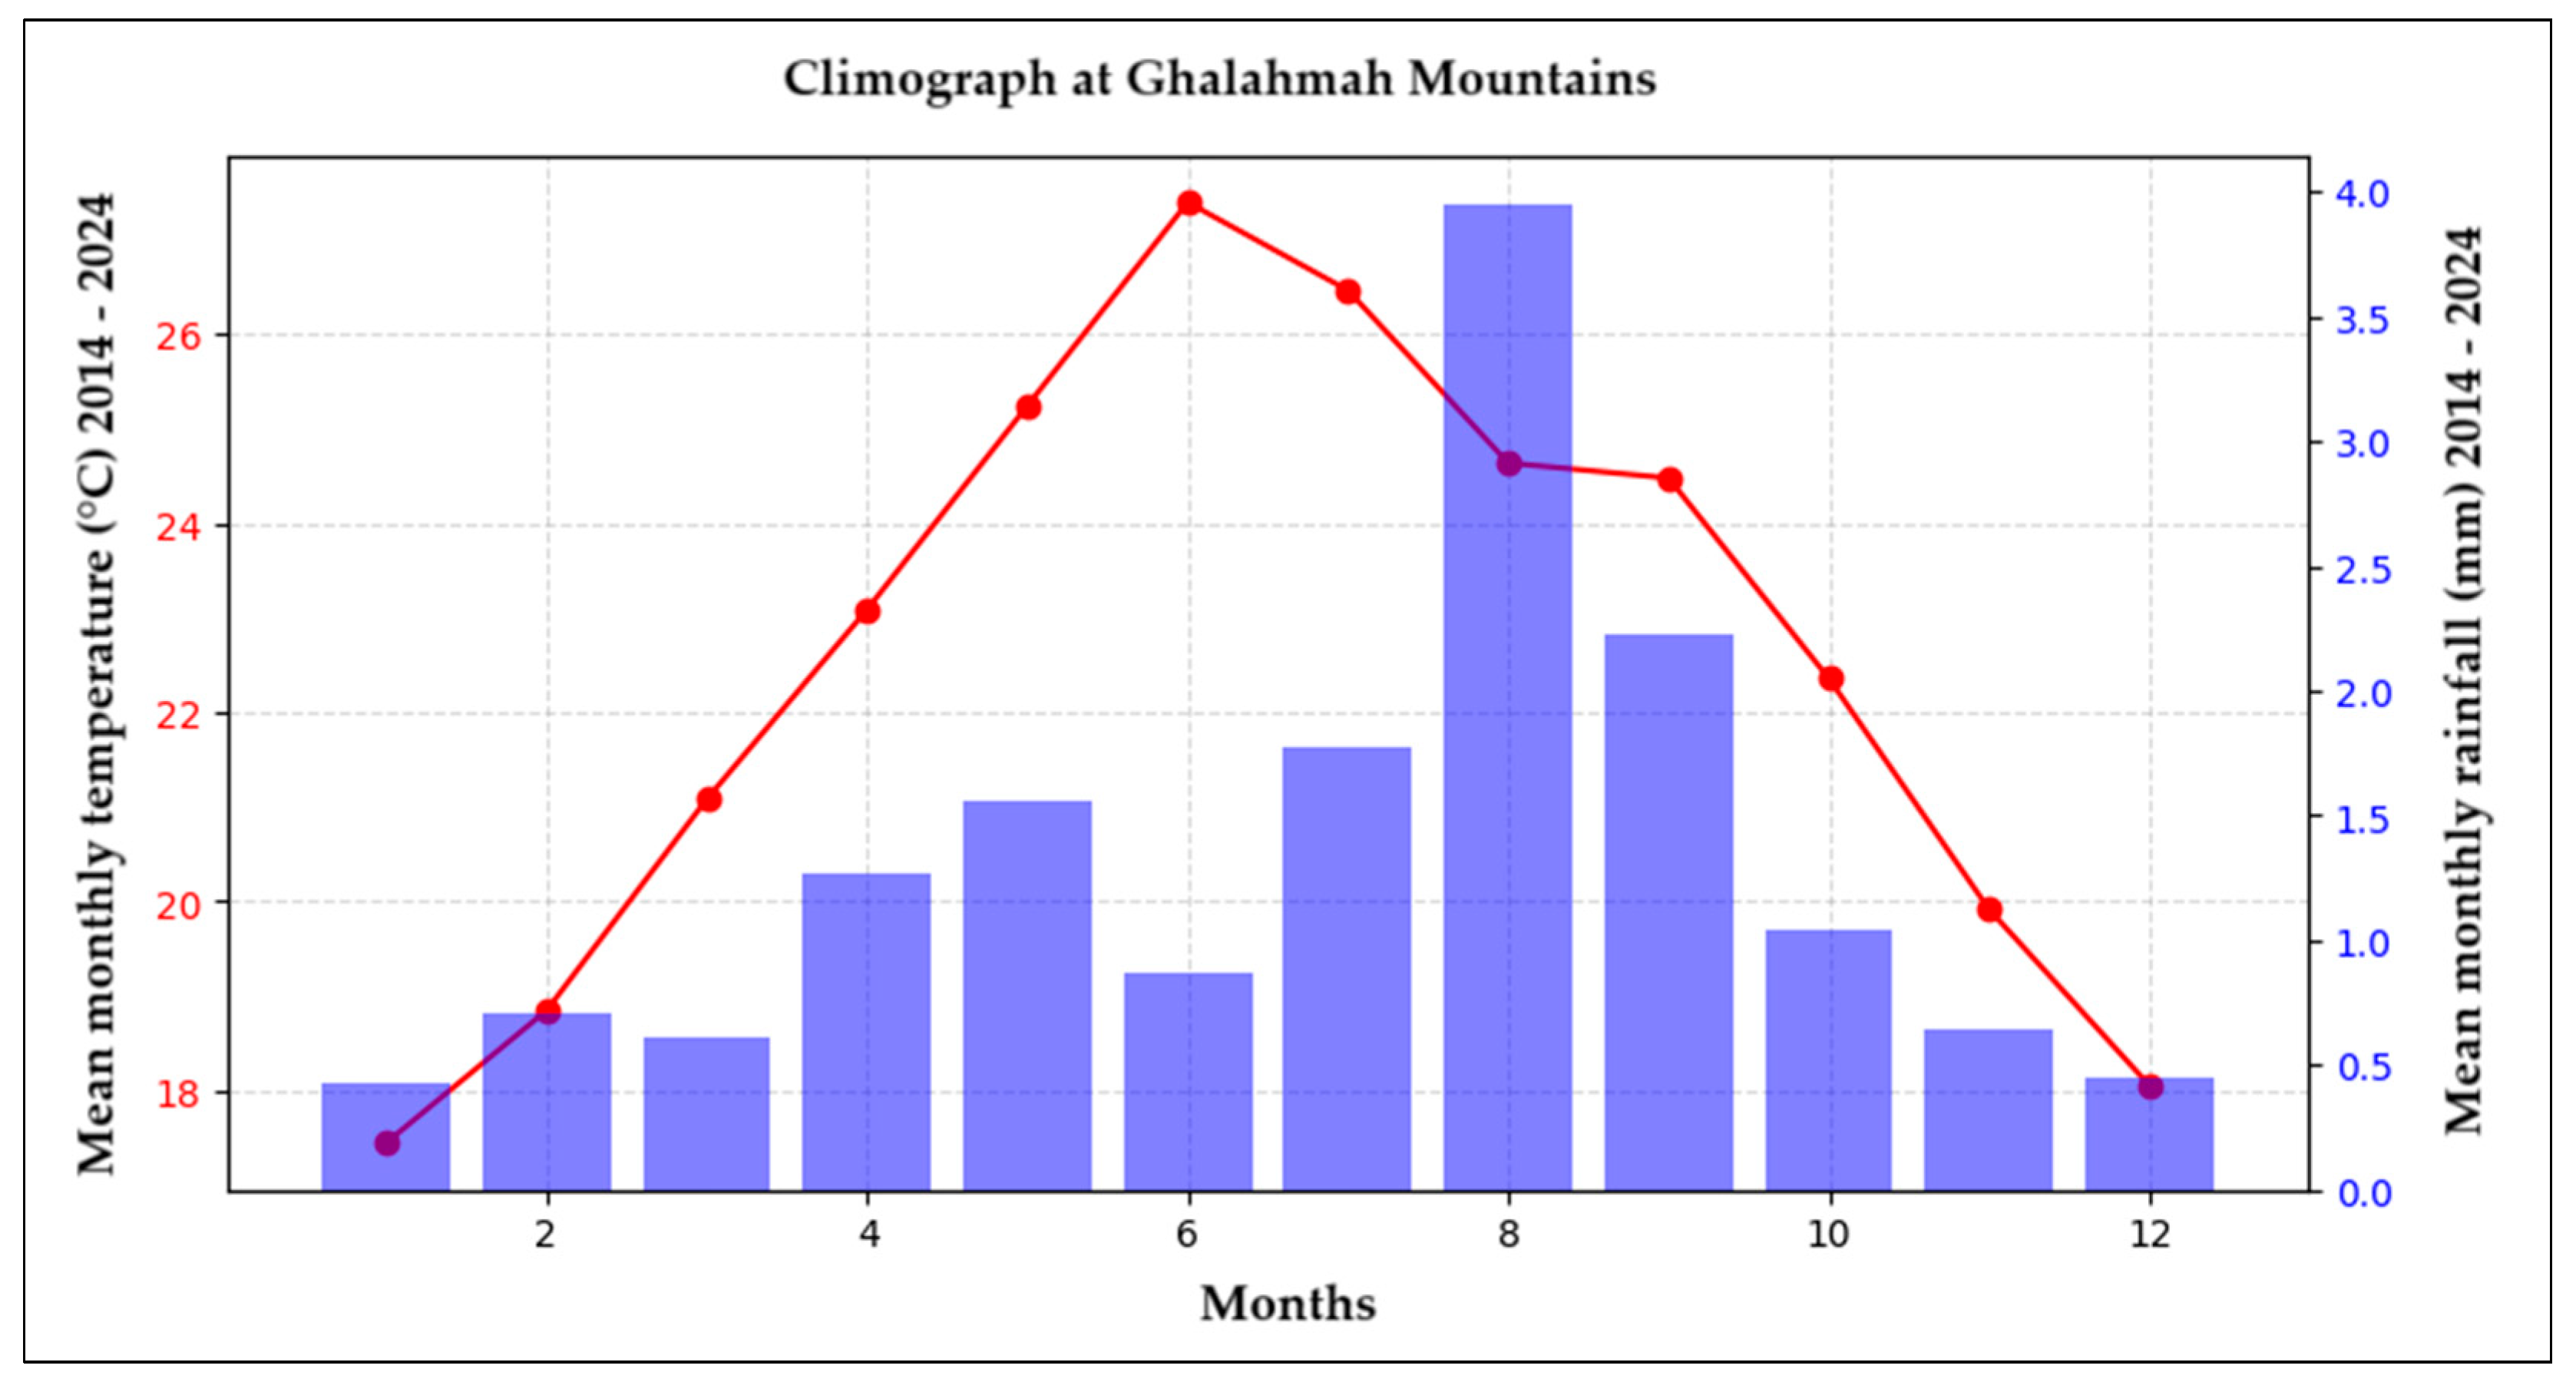
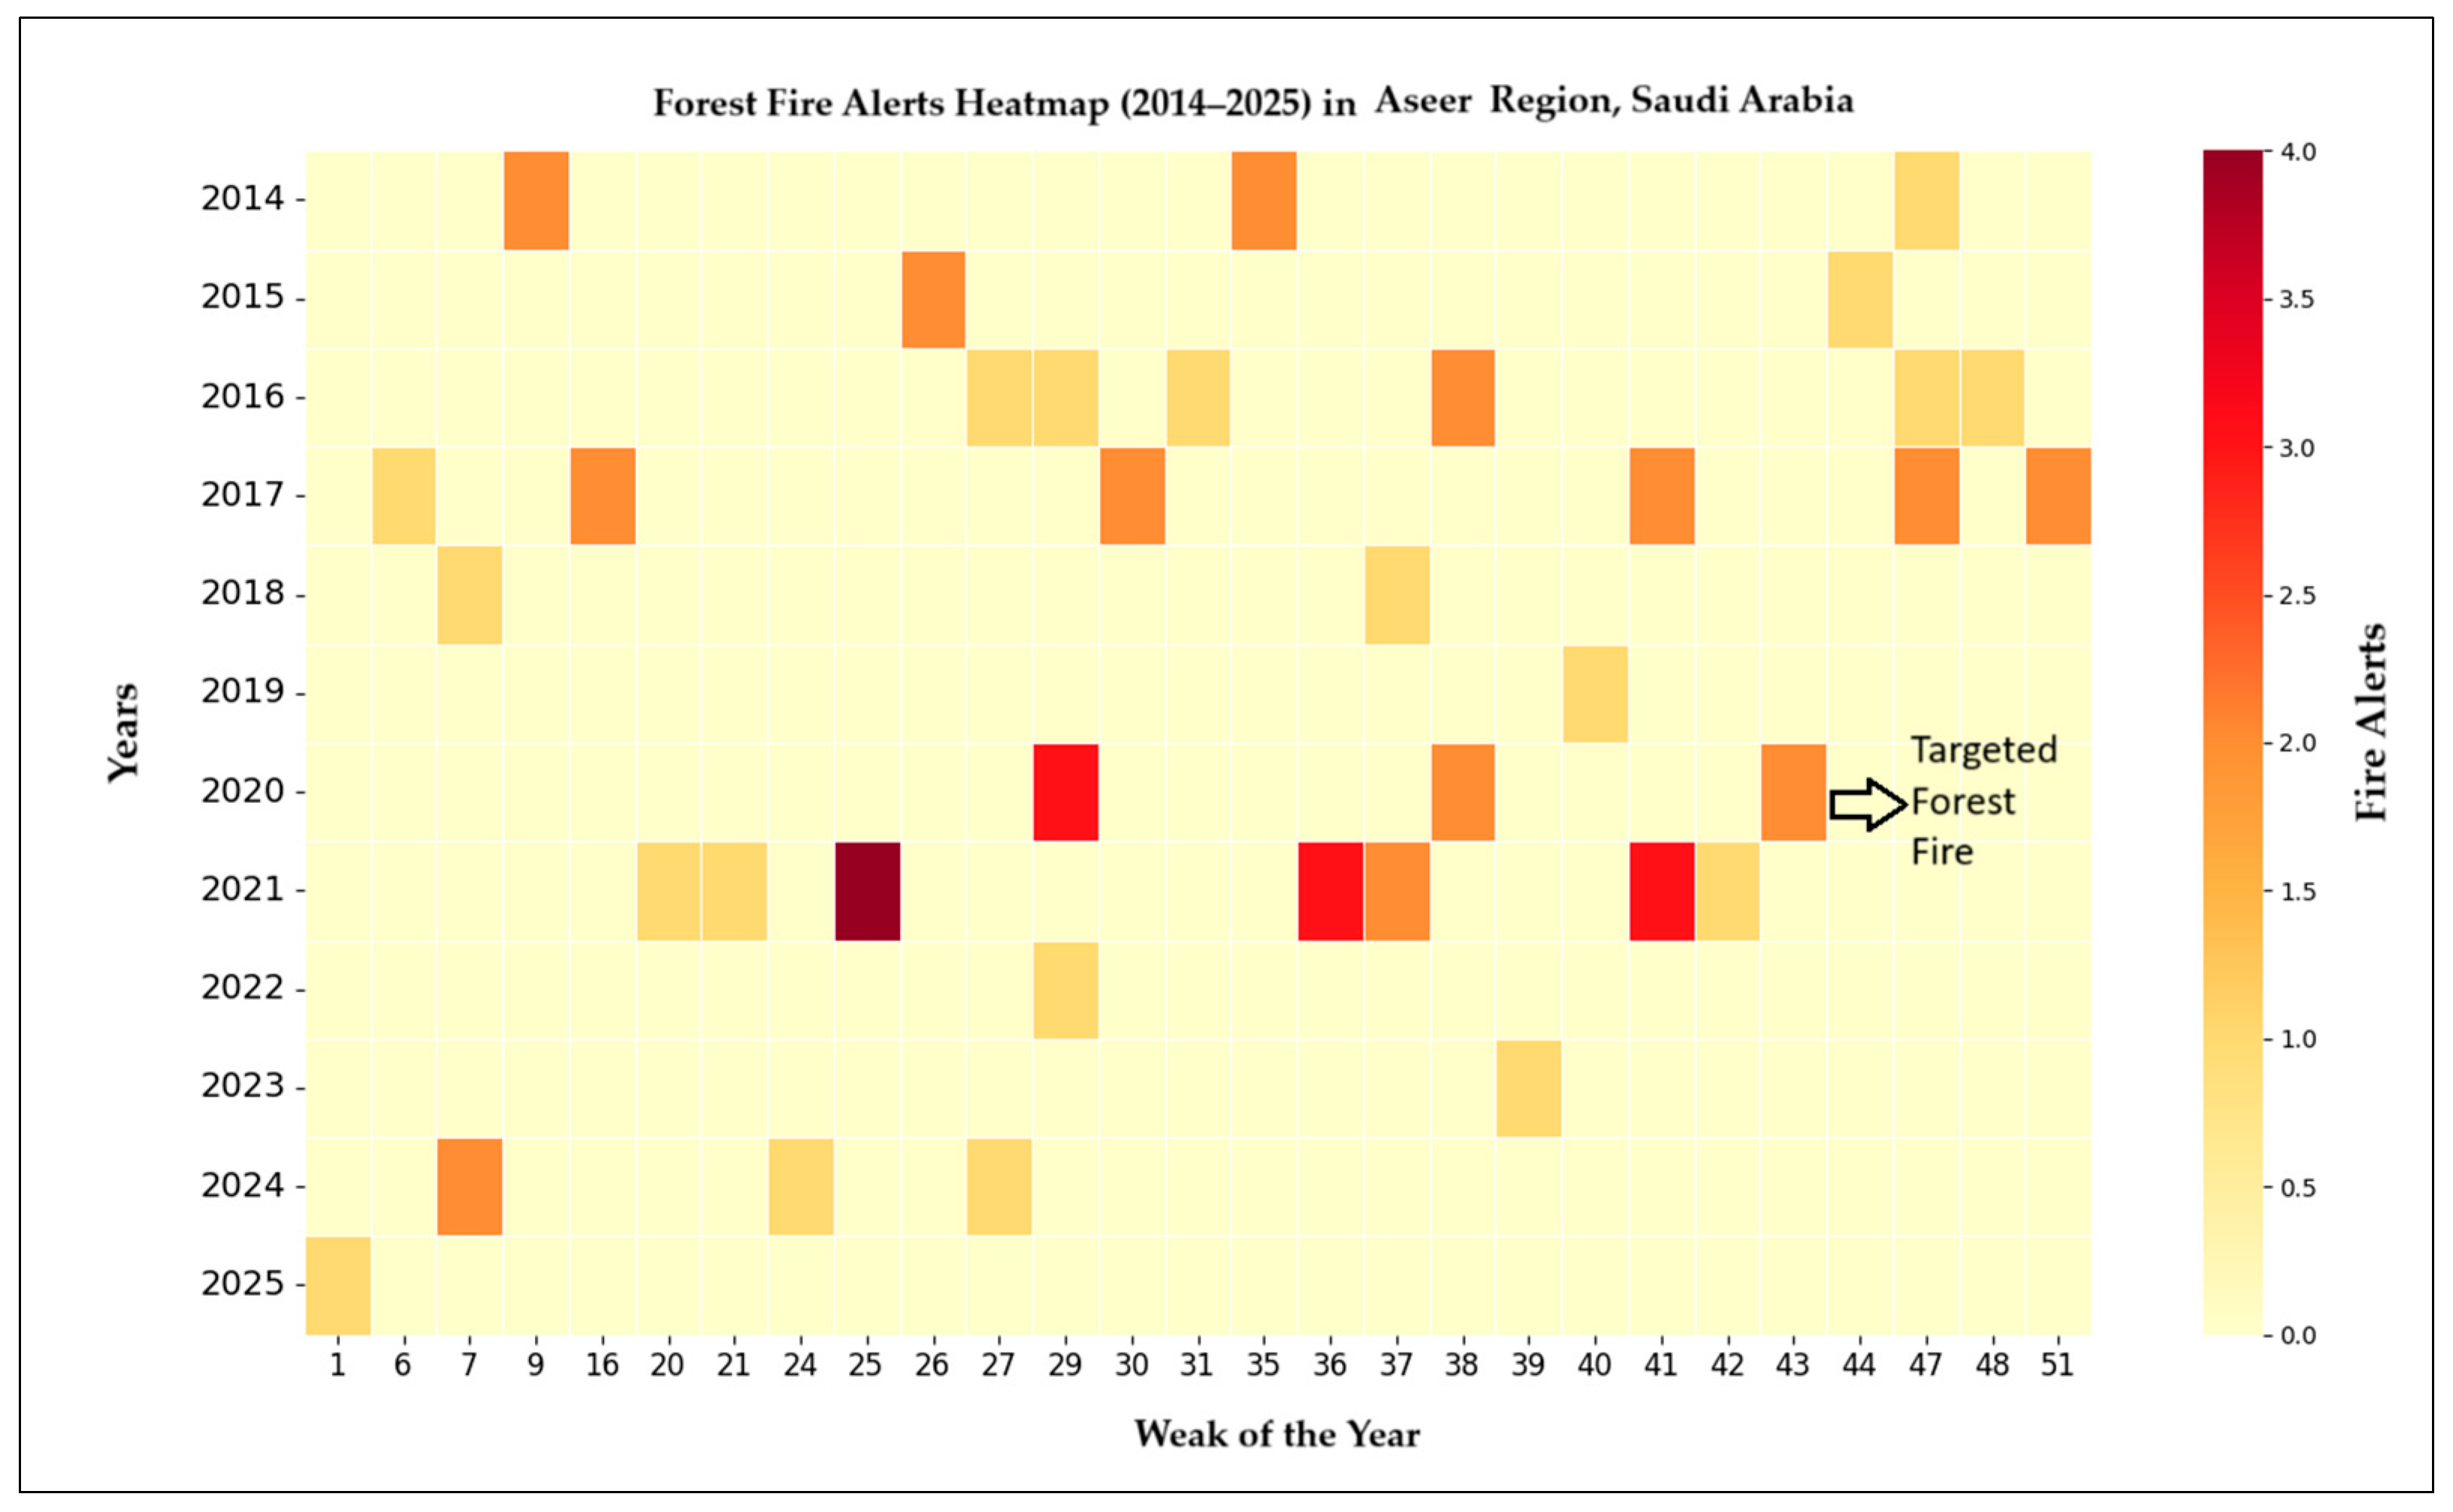
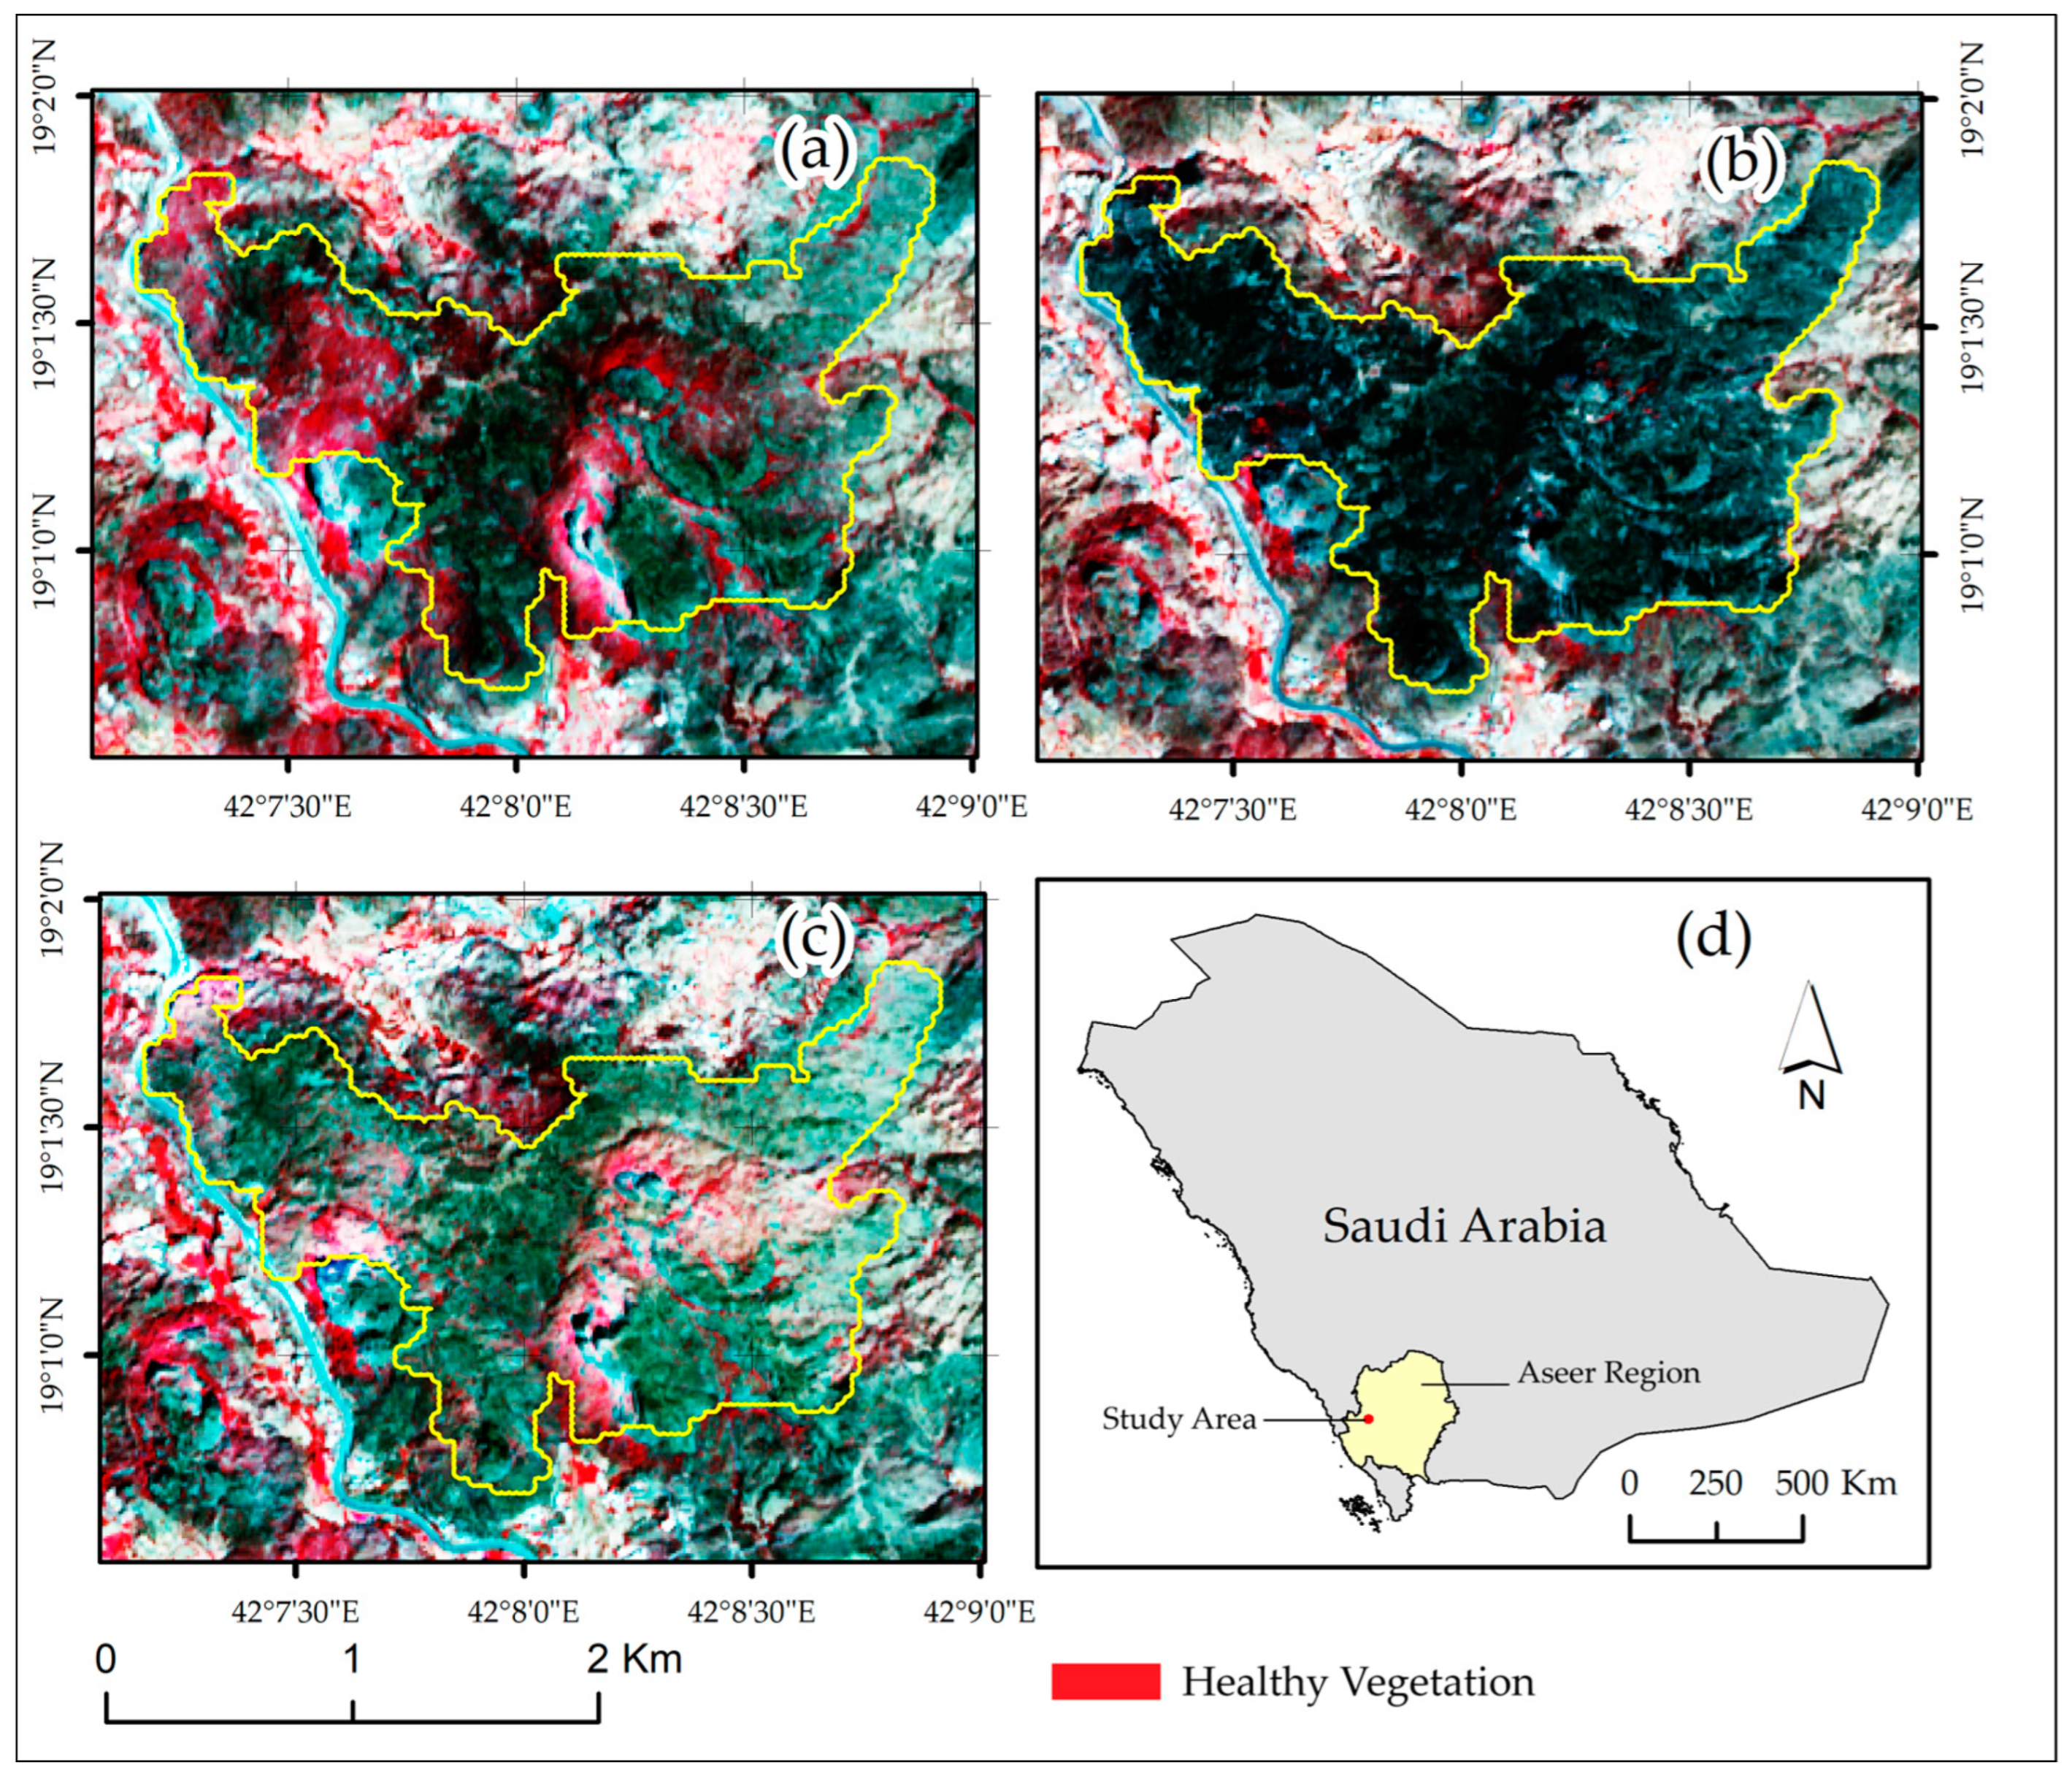
2.1. Study Area

The study area for this research is the Ghalahmah Mountains, located in the Aseer region of southwestern Saudi Arabia [17]. The geographical coordinates of the area are 42°7′ E longitude and 19°1′ N latitude, with an elevation of 2440 m above mean sea level (AMSL). The region is characterized by rugged mountains, deep valleys, and varying altitudes, creating a diverse ecological environment. The fire event occurred on 20–21 October 2020 in the Ghalahmah Mountains, Aseer region, Saudi Arabia.
The climate of the Aseer region is influenced by the monsoon system, leading to distinct seasonal variations (Figure 1). Unlike most parts of Saudi Arabia, this area experiences cooler temperatures and higher rainfall, particularly during the summer monsoon season [18]. These climatic conditions support the growth of natural forests, shrubs, and grasslands, making the region ecologically significant. The forest types in the study area are predominantly dry tropical montane forests characterized by sparse vegetation and semi-arid woodlands. Dominant vegetation includes Acacia species (e.g., Acacia tortilis), Juniperus procera, and Commiphora species, which are well adapted to the region’s arid to semi-arid climate and rugged topography.
The study area experiences four distinct seasons. Winter (December–February) has temperatures with cool to cold conditions (9–19 °C) and light mean monthly rain of less than 1 mm, leading to reduced vegetation(Figure 2). Spring (March–May) sees mild to warm temperatures (15–25 °C) and mean monthly rainfall of less than 1.5 mm, promoting vegetation regeneration and flowering. Summer (June–September) is warm (20–30 °C) with mean monthly monsoon rains of less than 4 mm supporting vegetation but increasing fire risks during dry spells. Autumn (October–November) is mild to cool (15–25 °C) with reduced rainfall of less than 1 mm and occasional fog, marking vegetation transitions and elevated fire risks.
Figure 3 illustrates that the fire alerts in Aseer exhibit fluctuating annual fire activity, with notable spikes in 2020 and 2021 [12]. The data reveal strong seasonality, with peaks occurring primarily during weeks 25–47 (June to November). This aligns with the region’s dry and hot climate, where higher temperatures and reduced precipitation increase fire susceptibility. Figure 4 shows the location of the study area where the fire event occurred on 20–21 October 2020 in the Ghalahmah Mountains, Aseer region, Saudi Arabia.

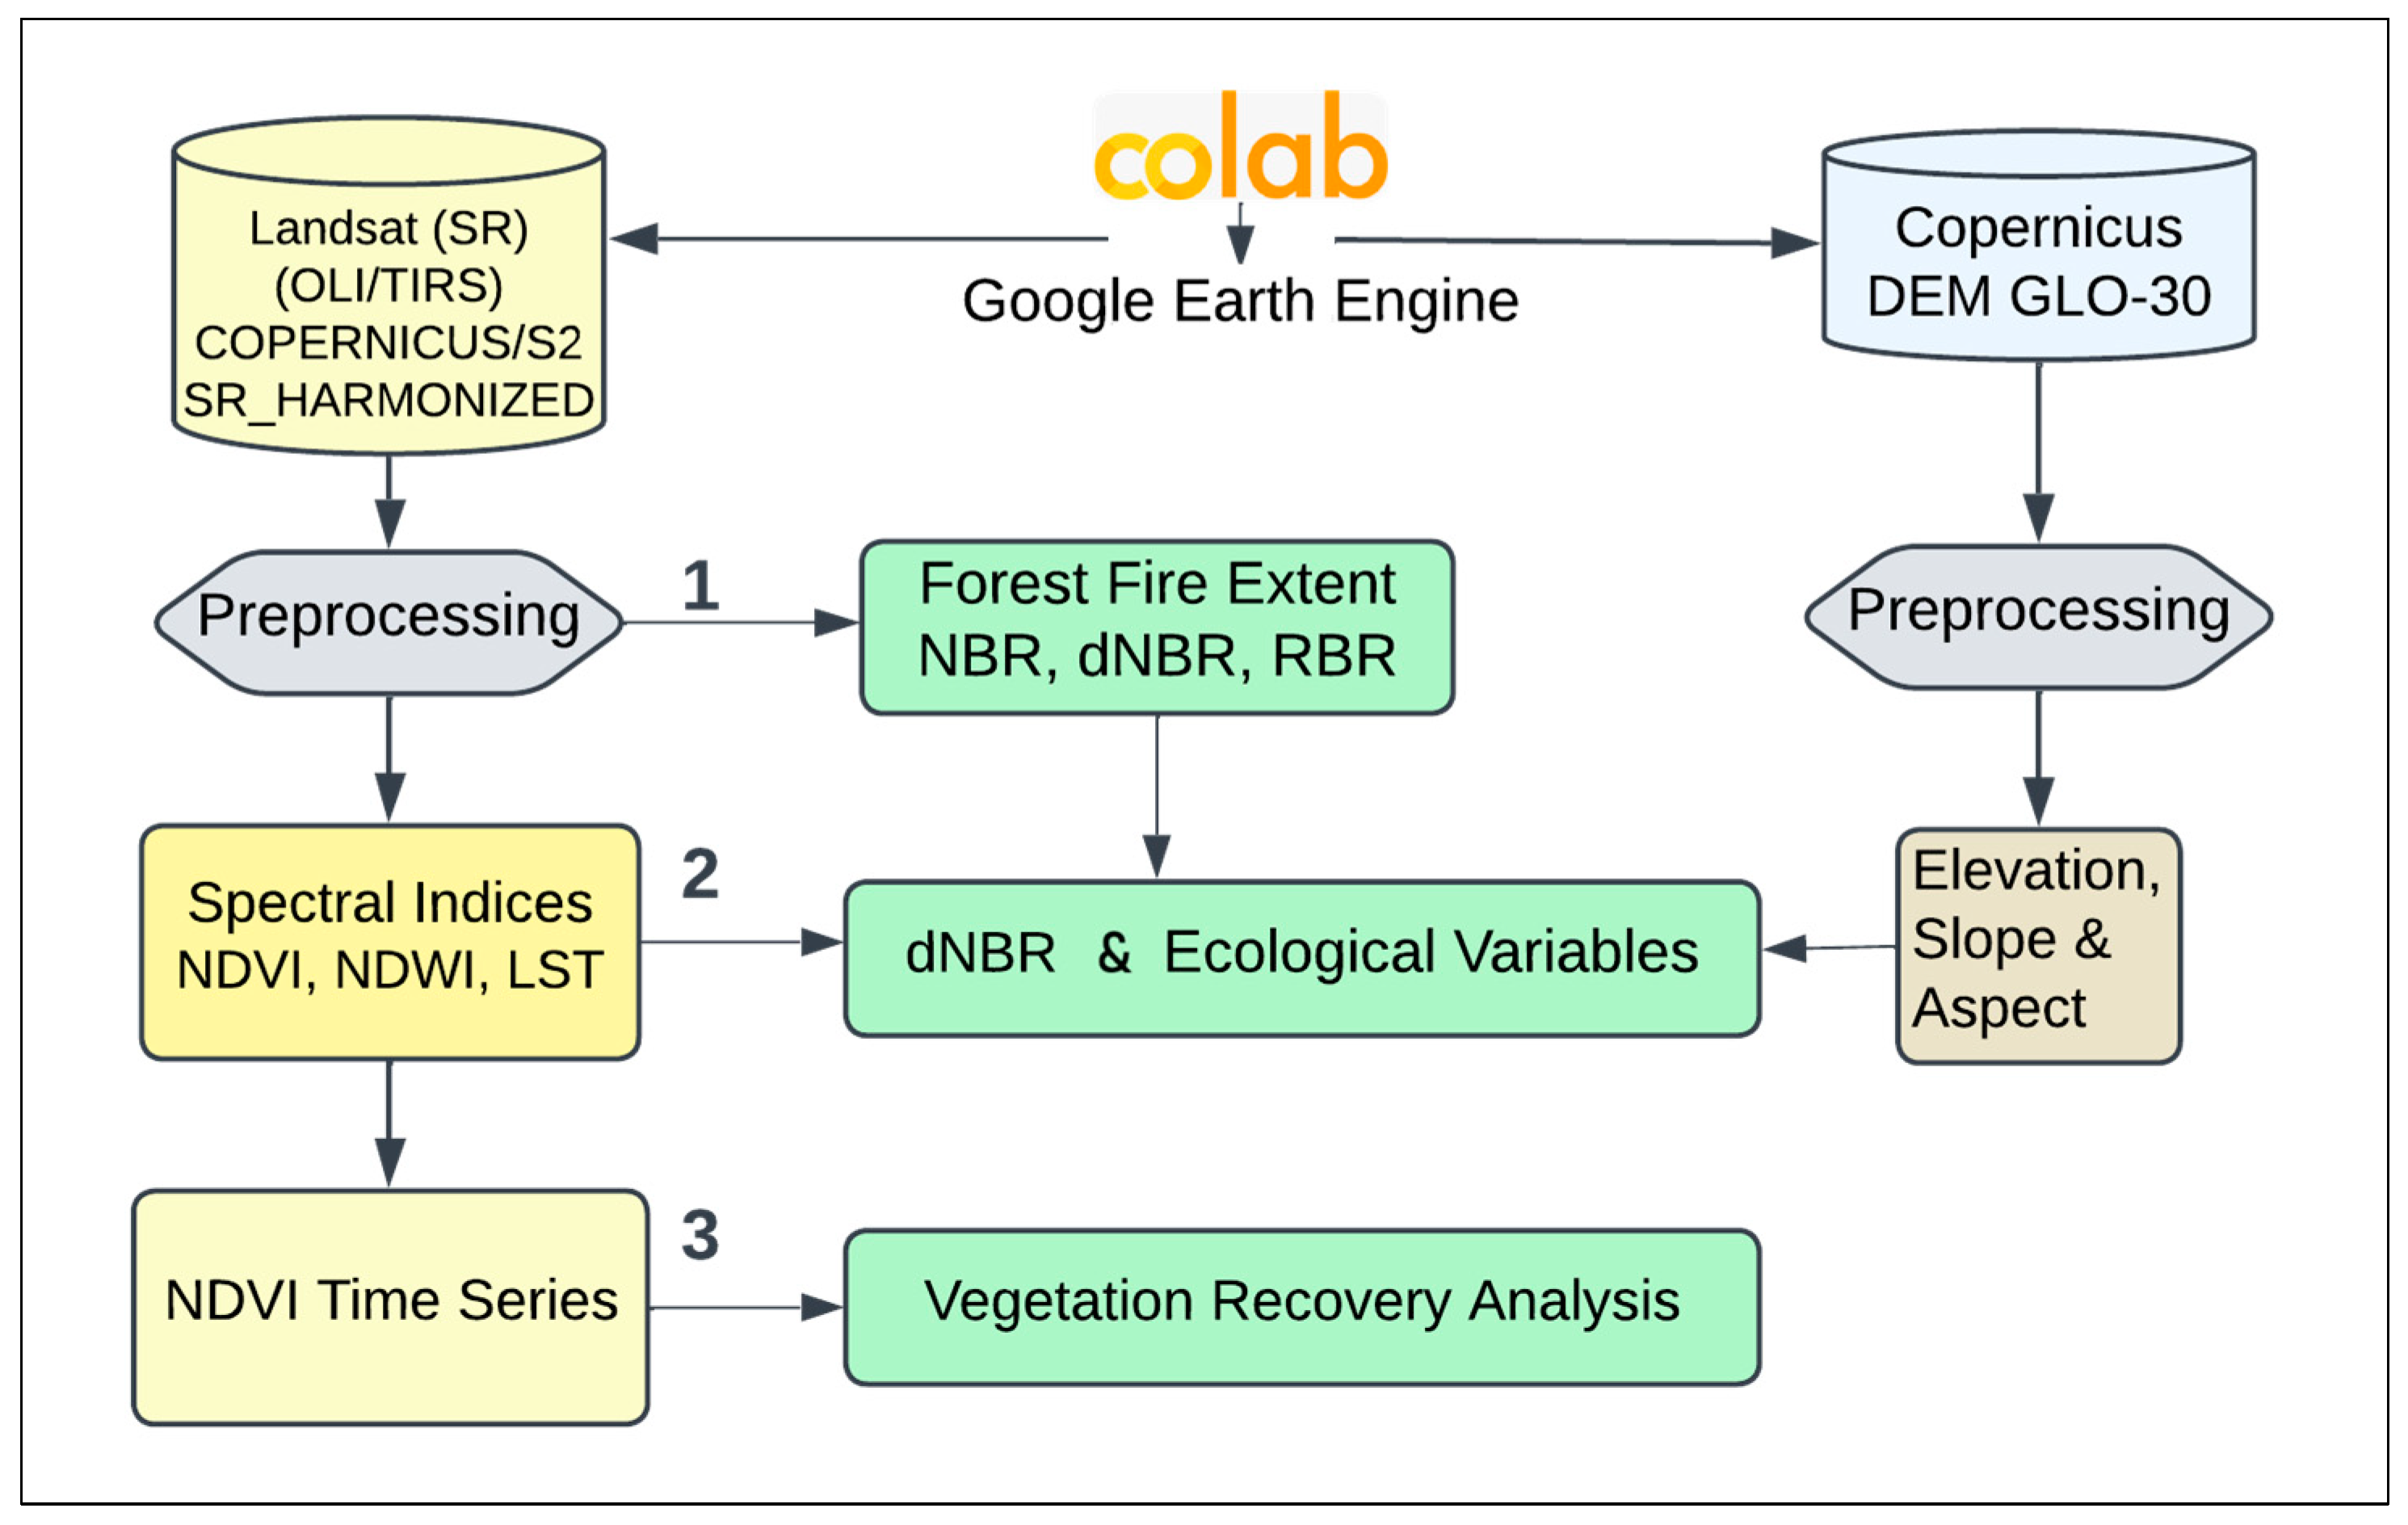
2.2. Overall Methodology

The workflow for this study integrates multi-source remote sensing data, including Landsat 8 SR, Copernicus Sentinel-2, and DEM (Digital Elevation Model), to analyze forest fire impacts in the Ghalahmah Mountains (Figure 5). The analysis begins with preprocessing satellite imagery to calculate fire indices (NBR, dNBR, RBR) and spectral indices (NDVI, NDWI, LST). dNBR values are then combined with ecological variables like elevation, slope, and aspect. Finally, NDVI time-series are evaluated to assess post-fire vegetation recovery. This workflow, implemented using Google Colab and Earth Engine, enables efficient and scalable forest fire impact analysis in mountainous semi-arid regions.

2.3. Data Used

To analyze forest fires and vegetation recovery, we utilized data from multiple Earth observation satellites. Landsat 8 OLI/TIRS Collection 2 (WRS-2 Path 167, Row 47) [19] provided atmospherically corrected surface reflectance and land surface temperature (LST). This dataset, derived from OLI and TIRS sensors, was processed to correct atmospheric effects and underwent data cleaning to ensure reliability. Sentinel-2 Harmonized (COPERNICUS/S2_SR_HARMONIZED) data [20], featuring 10–20 m resolution bands, provided atmospherically corrected surface reflectance optimized for vegetation analysis, particularly the Normalized Difference Vegetation Index (NDVI). Both datasets were crucial for temporal monitoring of vegetation and post-fire landscape changes (Table 1).

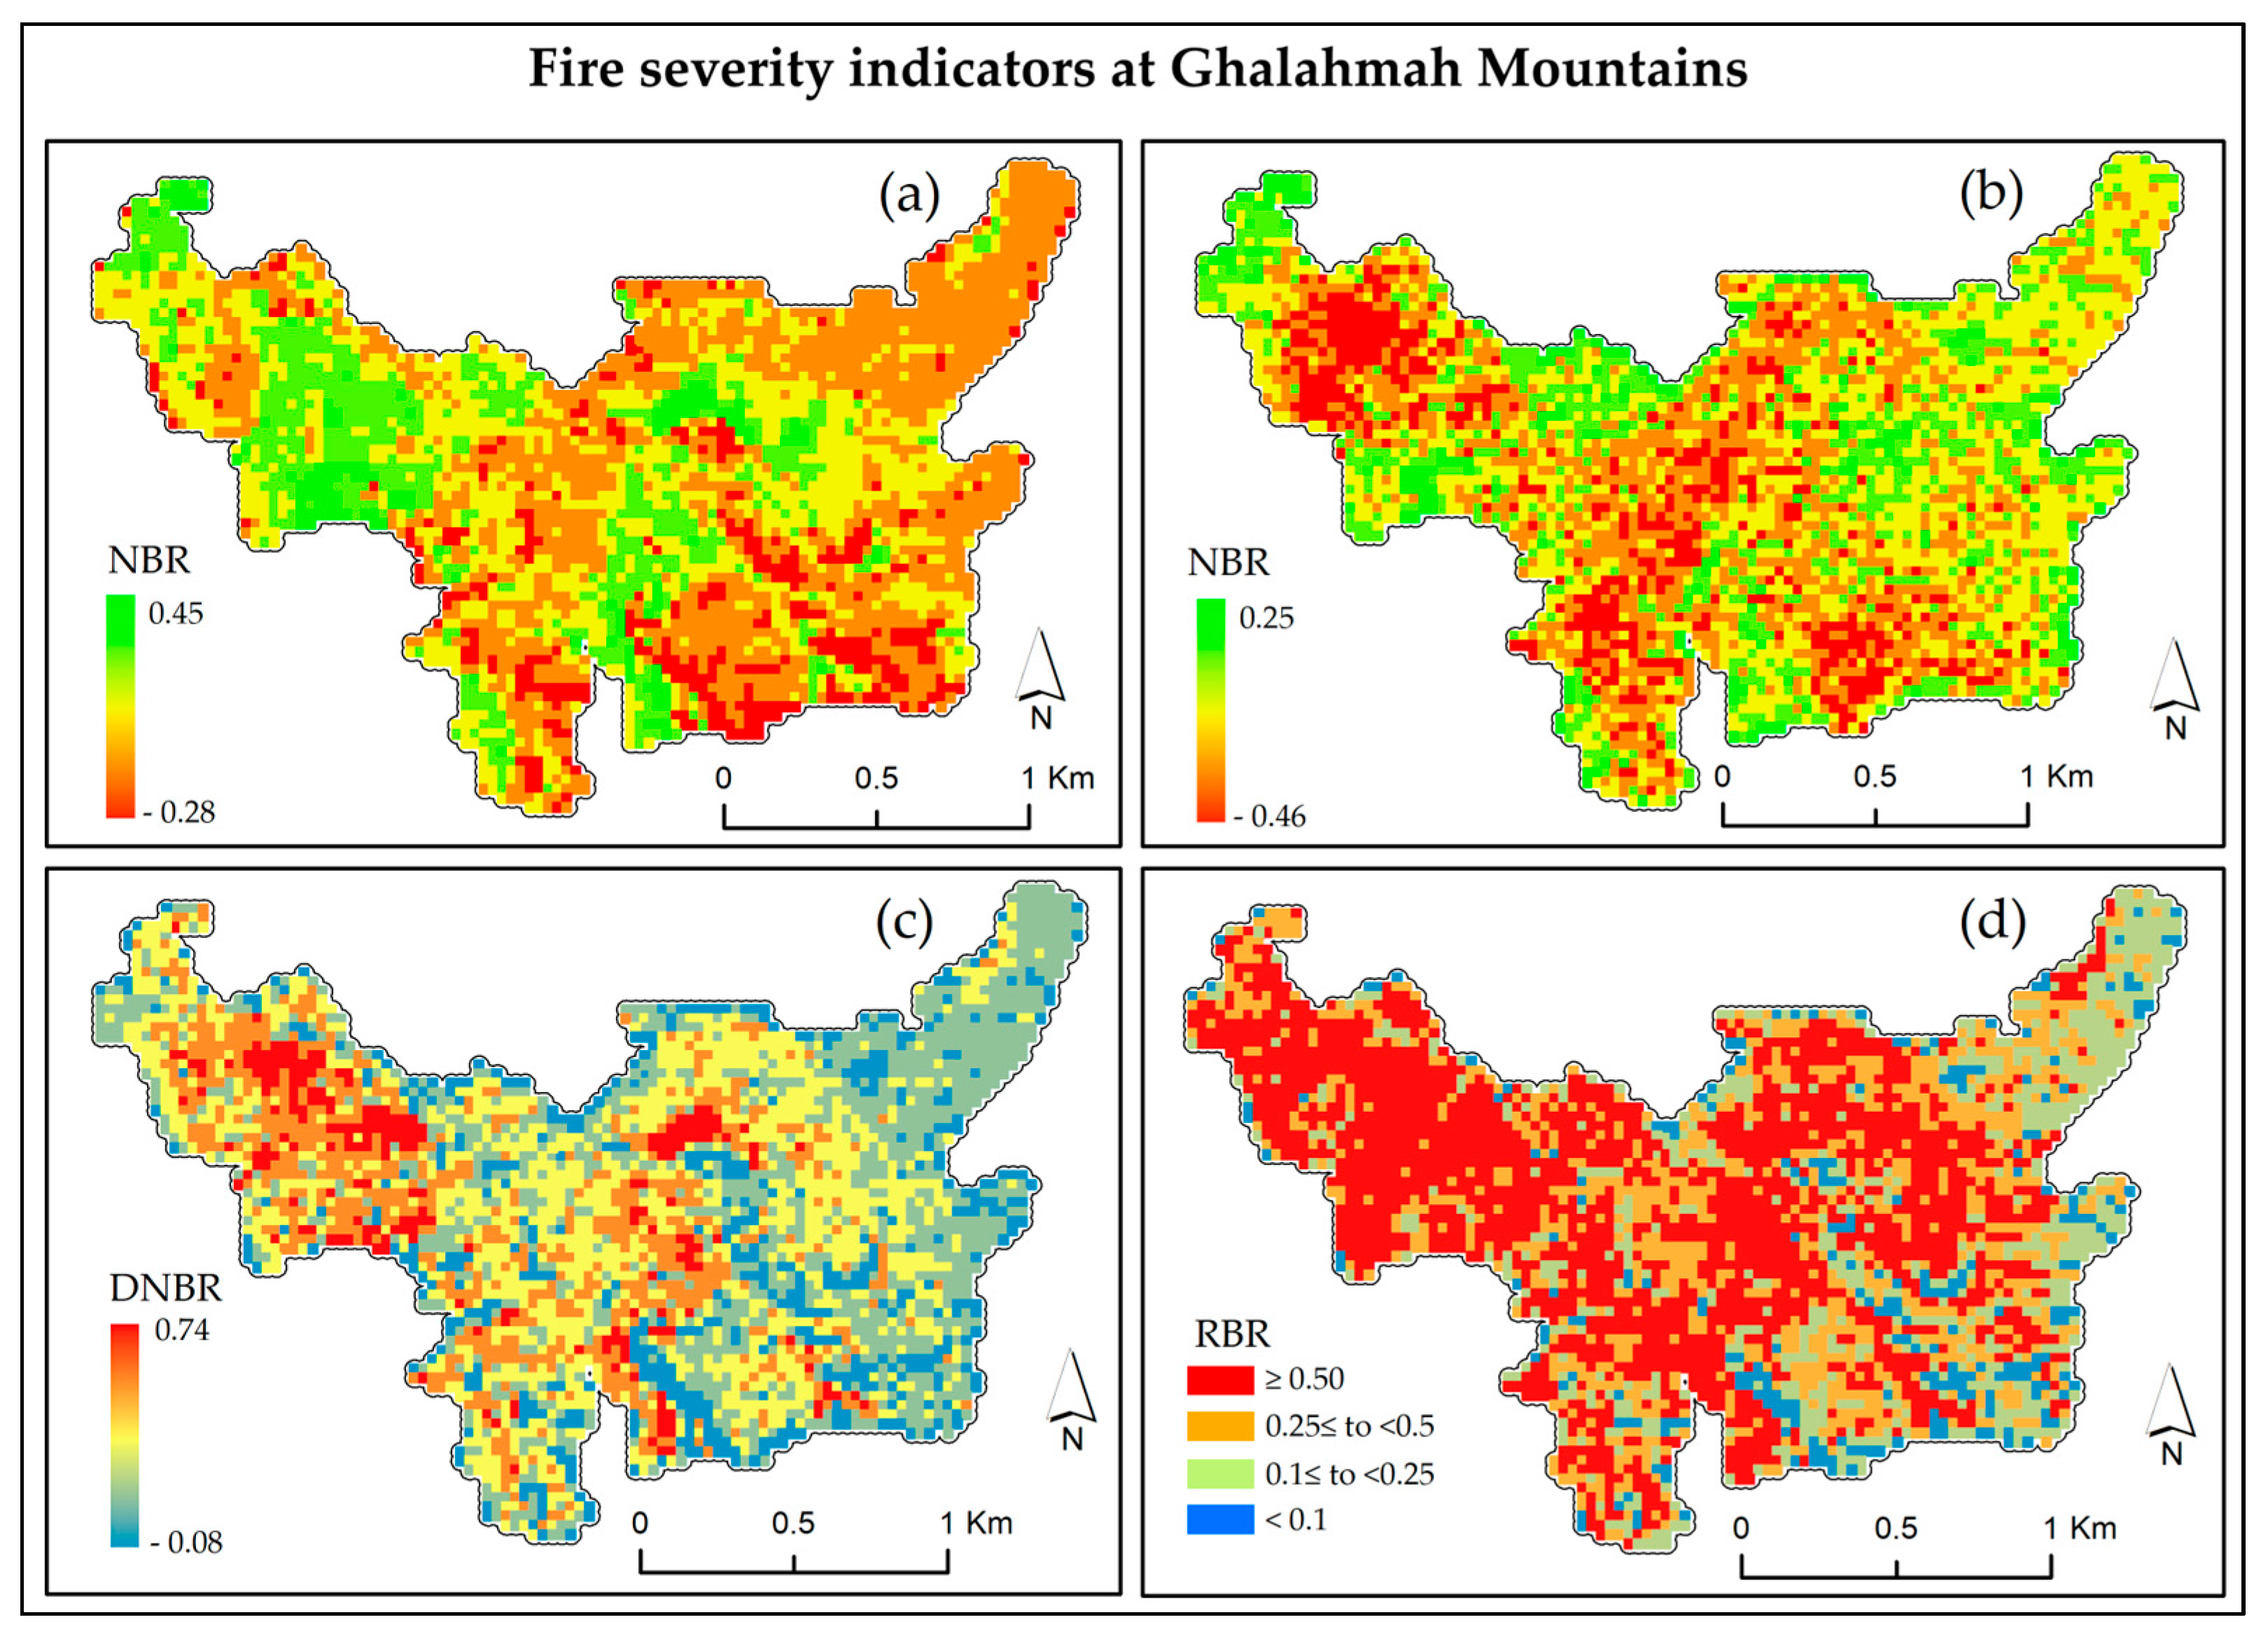
2.4. Relativized Burn Ratio

The Relativized Burn Ratio (RBR) is an effective method for assessing fire severity by comparing pre-fire and post-fire spectral reflectance using the Normalized Burn Ratio (NBR). NBR is derived from the Near-Infrared (NIR) and Shortwave Infrared (SWIR) bands of satellite imagery [21], which are sensitive to vegetation health and burn effects, respectively. The RBR improves upon the Differenced Normalized Burn Ratio (dNBR) by accounting for variability in pre-fire vegetation conditions.

2.4.1. Normalized Burn Ratio (NBR)

The fire event occurred on 20 and 21 October 2020. To assess NBR, pre-fire conditions were analyzed using satellite data from 1 to 19 October 2020, while post-fire conditions were analyzed using data from 20 to 30 October 2020. The NBR is calculated for both pre-fire and post-fire images using Equation (1):
N B R = N I R S W I R N I R + S W I R
where NIR represents the Near-Infrared band, and SWIR denotes the Shortwave Infrared band.
These spectral bands are crucial for calculating vegetation and fire indices, as they capture distinct reflectance properties of vegetation and burned areas.

2.4.2. Differenced Normalized Burn Ratio (dNBR)

The Differenced Normalized Burn Ratio (dNBR) [27], which is a key indicator of fire severity, was calculated using Equation (2).
d N B R = N B R p r e f i r e N B R p o s t f i r e
where N B R p r e f i r e represents the NBR calculated from pre-fire satellite imagery and N D R p o s t f i r e   represents the NBR from post-fire imagery.

2.4.3. Relativized Burn Ratio (RBR)

The Relativized Burn Ratio (RBR) is derived from the dNBR to normalize burn severity across varying vegetation densities [28]. It is calculated using Equation (3):
R B R = d N B R N B R p r e f i r e
This formula helps standardize burn severity by accounting for differences in pre-fire vegetation reflectance. Thresholds are then applied to classify fire severity levels into categories such as unburned, low, moderate, and high severity [11].
Table 2 shows the classification of burn severity thresholds based on the Relative Burn Ratio (RBR) values, indicating the degree of vegetation and soil damage in the study area.

2.5. Relationship Between Differenced Normalized Burn Ratio (dNBR) and Pre-Fire Environmental Factors

The input data consist of spatial attributes extracted from satellite imagery and digital elevation models. A shapefile containing relevant environmental variables was read into R for analysis. The geometric data were separated to focus on the attribute table containing the dependent variable: dNBR and independent variables, including NDVI, NDWI, LST, elevation, slope, and aspect. The dNBR was selected as the primary fire severity metric because it provides a direct measure of the reflectance change caused by the fire, avoiding the need for additional normalization required by RBR. This makes it more suitable for areas with less variation in pre-fire vegetation density, leading to clearer and more interpretable relationships with environmental factors.

2.5.1. Correlation Analysis

A correlation matrix was calculated to explore the relationships between RBR and the independent variables using the Pearson correlation coefficient [29], as shown in Equation (4).
r x y = C o v ( X , Y ) σ x σ y
where Cov (X,Y) is the covariance between two variables, and σX and σY are the standard deviations of the variables.
The correlation matrix and scatterplot visualizations helped to identify potential linear relationships.

2.5.2. Random Forest Regression Model

To capture non-linear relationships and rank variable importance, a Random Forest regression model [30] was employed. The Random Forest model is an ensemble of decision trees, where each tree contributes to the final prediction. The model evaluates feature importance using:
%IncMSE: Increase in Mean Squared Error when a variable is randomly permuted, indicating its predictive contribution.
IncNodePurity: Reduction in node impurity (variance) when a variable is used for splitting.
The Mean Squared Error (MSE) was calculated using the Equation (5).
M S E = 1 n i = 1 n y i y ^ i 2
where y i is the observed dNBR value, y ^ i is the predicted dNBR value, and n is the number of observations.
The model outputs include coefficient estimates, standard errors, t-values, and p-values to evaluate the statistical significance of each variable.

2.6. Forest Fire Recovery Rate

2.6.1. Normalized Difference Vegetation Index (NDVI)

For forest fire recovery rate analysis, NDVI was computed for the following periods:
Baseline Period: 1 January 2019 to 30 September 2020.
Fire Event Period: 1 October to 31 October 2020.
Recovery Periods: 1 January to 31 December for each year (2021, 2022, 2023, 2024).
The NDVI for each image was calculated using Equation (6).
N D V I = N I R R E D N I R + R E D
where NIR is the near infrared band and RED is the red band.

2.6.2. Recovery Rate

The recovery rate was calculated by comparing NDVI values during each recovery period to the baseline and fire event NDVI values [31] using Equation (7):
R e c o v e r y y e a r = N D V I y e a r N D V I F i r e N D V I B a s e l i n e + N D V I F i r e
where NDVIBaseline is the NDVI before the fire event (2019–2020), NDVIFire is the NDVI during the fire event (October 2020), and NDVIYear is the NDVI for each recovery year (2021, 2022, 2023, 2024).

2.6.3. Recovery Classification

The recovery status for 2024 was classified into five categories using the following conditional expressions using Equation (8):
R e c o v e r y y e a r =     i f   r e c o v e r y = 1   ( F u l l y   R e c o v e r e d )     i f   0 < r e c o v e r y < 1   ( S t i l l   R e c o v e r i n g )     i f   r e c o v e r y > 1   ( E x c e e d i n g   P r e   F i r e   C o n d i t i o n )     i f   r e c o v e r y = 0   ( N o   R e c o v e r y )     i f   r e c o v e r y < 0   ( F u r t h e r   D e g r a d a t i o n )

3. Results

3.1. Forest Fire Severity and Extent

The forest fire impact assessment (Figure 1) reveals significant changes in vegetation cover. Pre-fire NBR (Figure 4a) highlights healthy vegetation, while post-fire NBR (Figure 4b) indicates reduced cover. The dNBR (Figure 4c) captures reflectance changes due to the fire, and RBR (Figure 4d) categorizes fire severity into severity classes: Unburned (RBR < 0.1), Low Severity (0.1 ≤ RBR < 0.25), Moderate Severity (0.25 ≤ RBR < 0.50), and High Severity (RBR ≥ 0.5). The analysis of fire severity revealed that the high severity class covers the largest area, approximately 161 hectares, representing 49.9% of the total affected area. The moderate severity class accounts for 83.8 hectares (25.6%). Areas classified as low severity cover 59.9 hectares (18.3%), while the unburned class, the smallest category, spans approximately 22.9 hectares (6.2%).

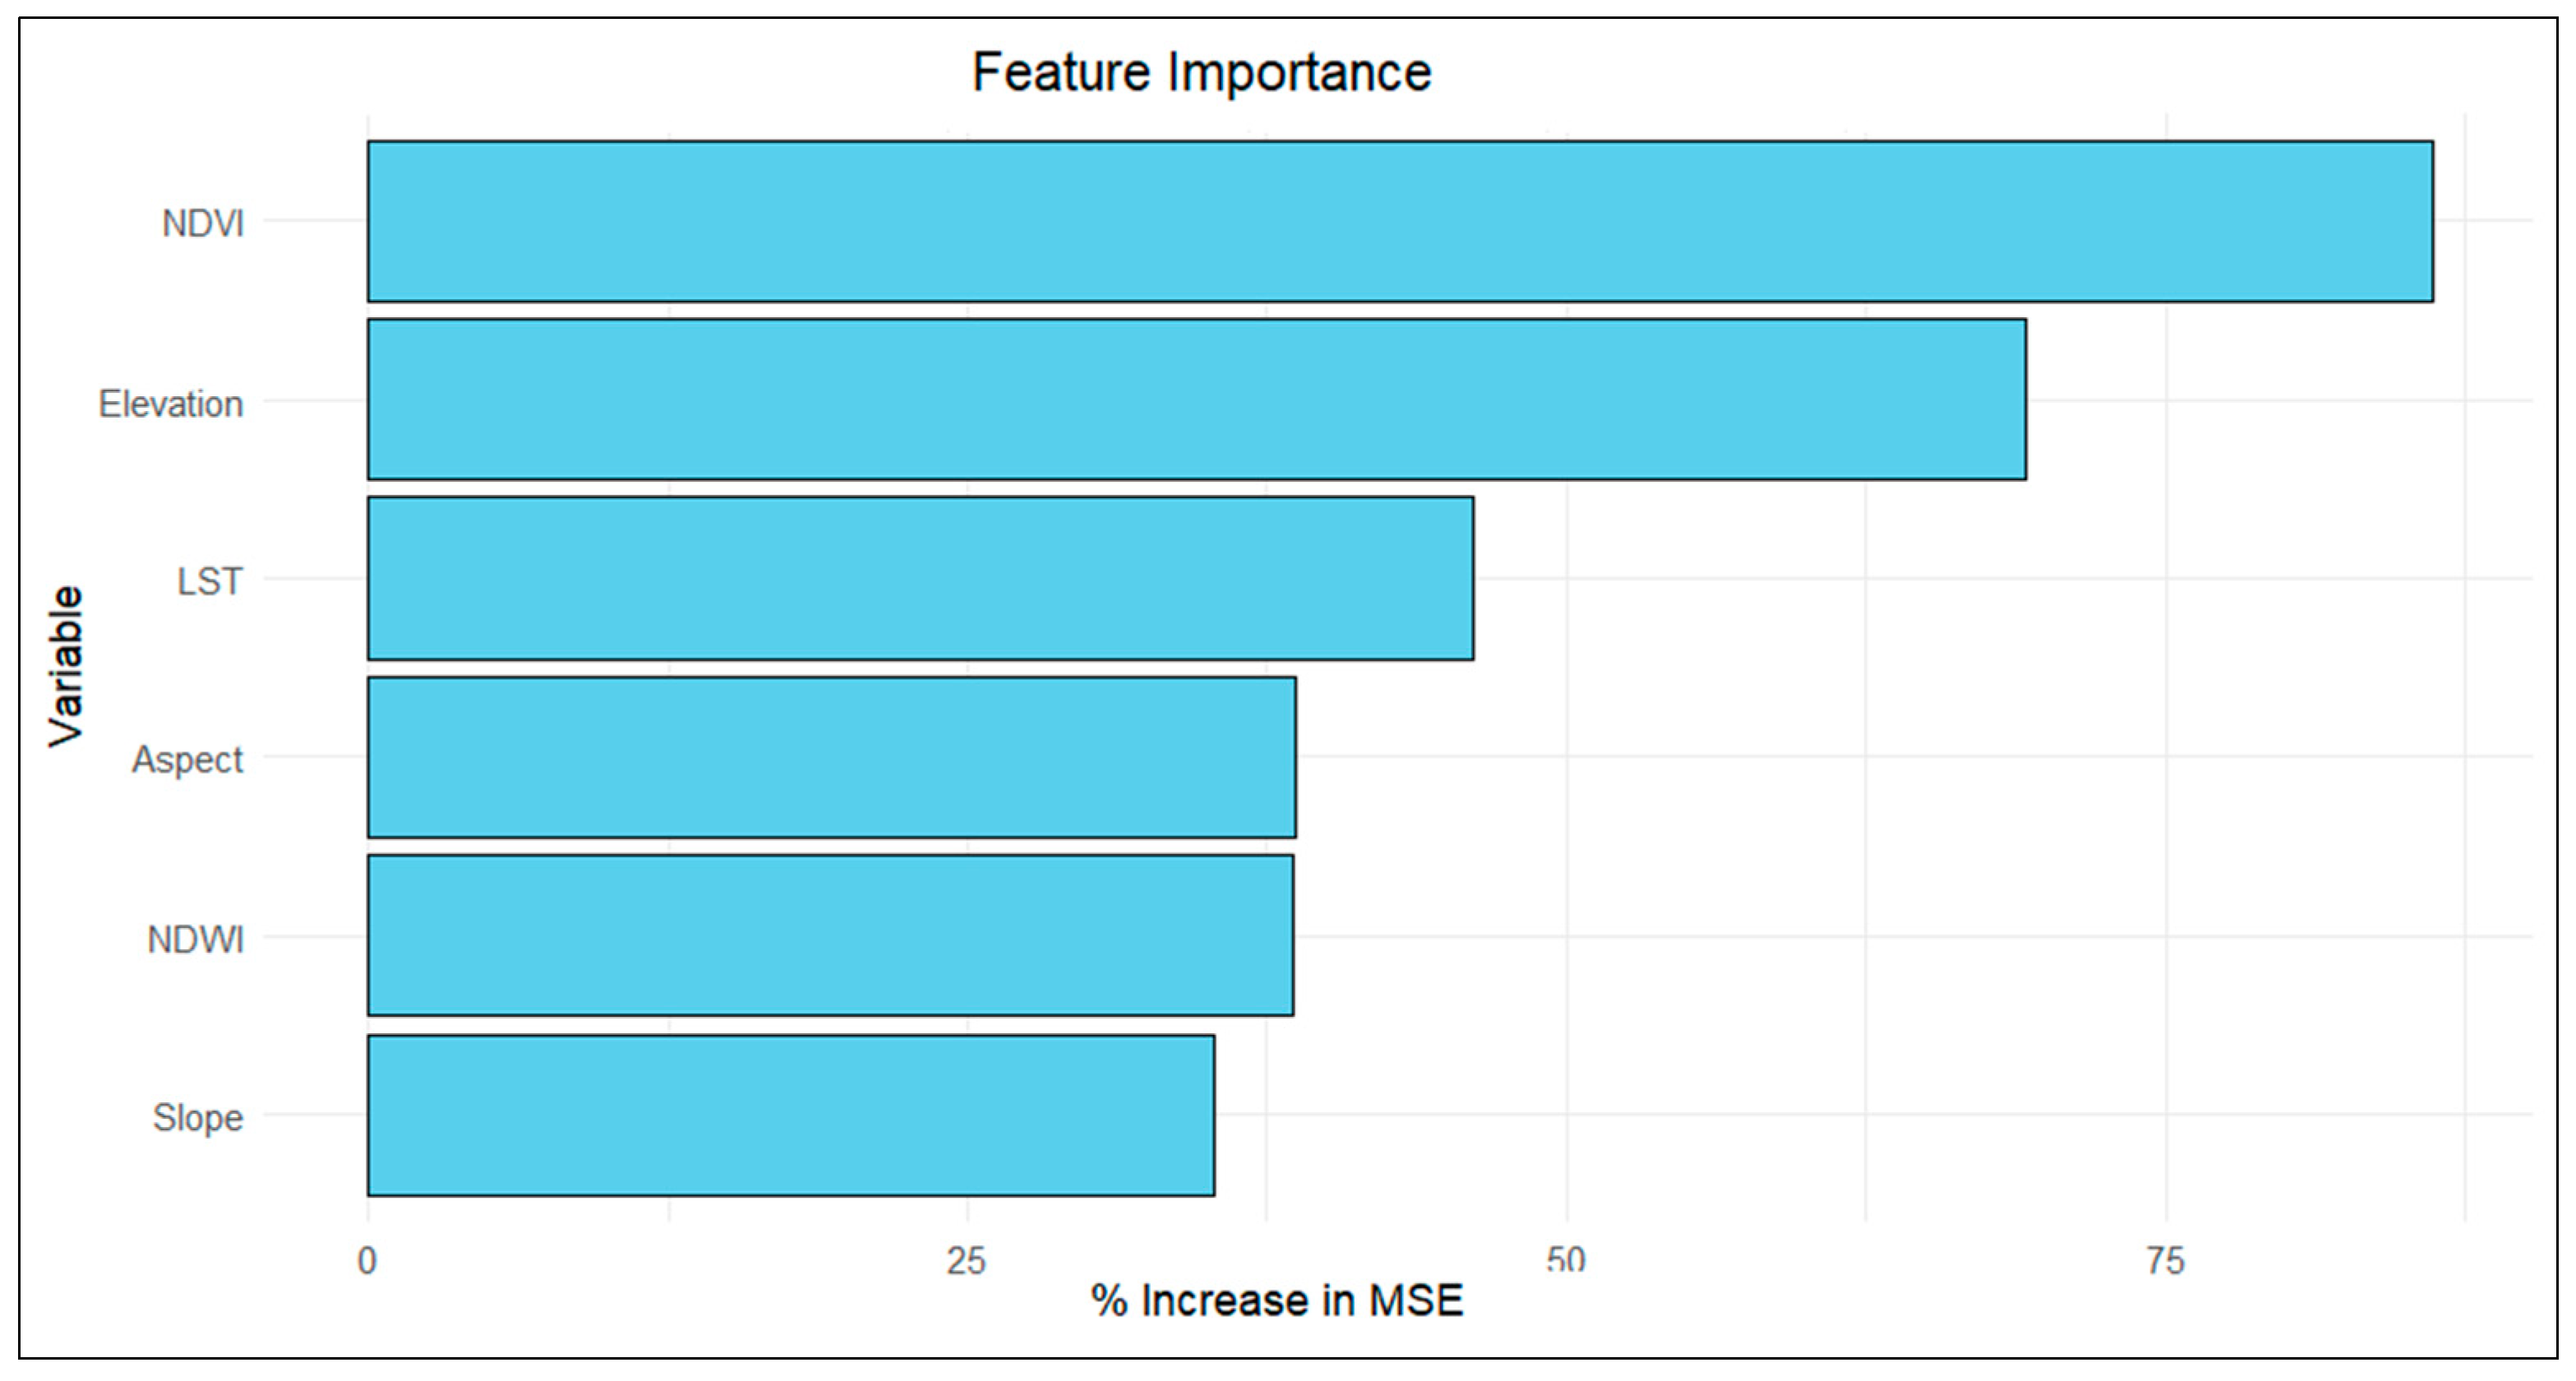
3.2. Feature Importance Analysis

The Random Forest regression model was applied to assess the importance of environmental variables in explaining fire severity, measured by DNBR. The model was trained with 500 trees and tried two variables at each split. The model achieved a 54.26% variance explained and a Mean Squared Residual of 0.0054, indicating a moderately strong relationship between the predictors and DNBR.
The feature importance analysis revealed the contribution of each predictor to model performance, measured by Percentage Increase in Mean Squared Error (%IncMSE). The results are summarized below (Table 3):
The NDVI had the highest importance, with an 86.10% increase in MSE, indicating that pre-fire vegetation density plays a crucial role in fire severity. Elevation also showed significant importance, suggesting that terrain height influences the extent of fire damage. LST and NDWI had moderate importance, indicating that land surface temperature and vegetation moisture conditions contribute to fire behavior. In contrast, Aspect and Slope showed relatively lower importance but still had some impact on fire severity patterns.
The feature importance plot is presented in Figure 6, illustrating the relative impact of each predictor. These findings provide valuable insights into the environmental factors that influence forest fire severity within the study area.

3.3. Vegetation Recovery

Table 4 presents the temporal dynamics of vegetation recovery from 2021 to 2024, categorized by vegetation types. High NDVI areas (>0.3), characterized by dense green woody plants and shrubs, showed 44.82 hectares of further degradation in 2021 but had 26.55 hectares still in recovery by 2024. Medium NDVI areas (0.2–0.3), representing scattered woody plants, shrubs, and grasslands, experienced significant recovery gains, with degraded areas declining sharply. Low NDVI areas (<0.2), dominated by shrubs, grasslands, and barren regions, exhibited an increase in areas exceeding pre-fire conditions (Figure 7).

4. Discussion

This study advances the understanding of fire ecology in the Aseer Mountains by integrating remote sensing data and fire impact models to assess the ecological consequences of forest fires. The findings align with and extend previous research on fire severity, environmental drivers, and post-fire vegetation recovery, while also providing novel insights specific to this understudied region. Below, we discuss the key findings in the context of existing literature, validate our results, and highlight the contributions of this study to the broader field of fire ecology.
The spatial extent and severity of the 2020 forest fire in the Ghalahmah Mountains were assessed using the Relativized Burn Ratio (RBR), which revealed that high-severity burns covered the largest area (49.9%), followed by moderate (25.6%) and low-severity burns (18.3%). These results are consistent with studies in other semi-arid mountainous regions, where high-severity burns often dominate due to the accumulation of dry biomass and favorable fire weather conditions [14,32]. The use of RBR, which accounts for pre-fire vegetation variability, provided a more nuanced assessment of fire severity compared to traditional dNBR approaches, as highlighted by [33]. This methodological refinement is particularly valuable in regions with heterogeneous vegetation, such as the Ghalahmah Mountains. The strong positive correlation between dNBR and pre-fire NDVI (r = 0.66) underscores the influence of pre-fire vegetation density on fire severity. This finding aligns with studies by [34], which demonstrated that areas with denser vegetation are more susceptible to high-severity burns due to greater fuel availability. Similarly, the moderate positive correlation between dNBR and NDWI (r = 0.57) suggests that vegetation moisture content also plays a role in fire severity, consistent with the findings of [35]. However, the weak correlations between dNBR and topographical factors (elevation and slope) contrast with studies in other regions (e.g., [36] ), where topography significantly influenced fire behavior. This discrepancy may be attributed to the lesser variation in the elevation range in the study area.
The Random Forest regression model identified NDVI as the most important predictor of fire severity (%IncMSE = 86.10), followed by elevation (%IncMSE = 69.19) and LST (%IncMSE = 46.14). These results are consistent with previous studies emphasizing the role of vegetation density and land surface temperature in driving fire severity [37,38]. The importance of NDVI highlights the critical role of fuel availability in determining fire behavior, while the influence of LST aligns with findings that higher temperatures exacerbate fire intensity by drying out vegetation [39].
The analysis of NDVI trends from 2021 to 2024 revealed distinct recovery patterns across different vegetation types. High NDVI areas (>0.3), dominated by dense woody plants, exhibited slower recovery, with 26.55 hectares still recovering by 2024. In contrast, medium NDVI areas (0.2–0.3), characterized by scattered woody plants and grasslands, showed significant recovery, with 134.46 hectares exceeding pre-fire conditions by 2024. These findings align with studies by [40] and [41], which found that recovery rates vary significantly with vegetation type, with grasslands and shrubs recovering faster than forests. The slower recovery of high NDVI areas highlights the vulnerability of dense woody vegetation to high-severity fires, as observed by [42]. This underscores the importance of targeted conservation efforts to protect these ecologically significant areas.
The integration of multi-source remote sensing data (Landsat 8, Sentinel-2, and DEM) and advanced analytical techniques (e.g., Random Forest regression) represents a significant methodological advancement. This approach enabled a comprehensive assessment of fire severity and recovery dynamics, providing insights that are not achievable with single-source data or traditional statistical methods. The use of cloud-based platforms like Google Earth Engine and Google Colab facilitated efficient data processing and analysis, demonstrating the potential of these tools for large-scale ecological studies.
The findings of this study have important implications for sustainable land management and conservation in the Ghalahmah Mountains. The identification of pre-fire vegetation density and moisture as key drivers of fire severity highlights the need for proactive fuel management strategies, such as controlled burns and vegetation thinning, to reduce fire risk. The slower recovery of high NDVI areas underscores the importance of protecting these ecologically valuable zones from future fires through targeted conservation efforts.

5. Conclusions

This study provides critical insights into the ecological consequences of forest fires and the natural regeneration processes in the Ghalahmah Mountains. The integration of spectral indices (NBR, dNBR, RBR), Random Forest regression, and multi-year NDVI analysis revealed critical insights into the dynamics of fire-affected ecosystems in a semi-arid mountainous region. The severity analysis showed that nearly half (49.9%) of the affected area experienced high fire severity, emphasizing the scale of ecological disturbance. The feature importance analysis identified NDVI, elevation, LST, and NDWI as the most influential variables, suggesting that both vegetation density and topographic-climatic factors significantly influence fire behavior and intensity. Post-fire recovery assessment between 2021 and 2024 illustrated a complex but encouraging trend. While areas with dense woody vegetation (NDVI > 0.3) showed slower recovery, medium and low NDVI zones displayed rapid regeneration, with many surpassing pre-fire NDVI levels by 2024. This indicates varying resilience capacities across vegetation types and highlights the importance of monitoring temporal dynamics of recovery for targeted restoration. These findings have substantial implications for ecosystem management and conservation. They can guide land managers in prioritizing areas for intervention, especially high-severity zones with slow recovery. Incorporating topographic and vegetation health indicators into fire management planning can enhance early warning systems and post-fire rehabilitation strategies. Future research should focus on assessing the long-term effects of repeated fires on biodiversity and ecosystem services, evaluating the role of climate change in shaping fire regimes, and testing adaptive land management practices to improve ecosystem resilience in fire-prone semi-arid landscapes.
Overall, this research contributes valuable evidence for informed decision-making in fire ecology and sustainable land management in arid mountain ecosystems.

Author Contributions

Methodology, R.A.-Q.; Validation, R.A.-Q.; Formal analysis, R.A.-Q.; Investigation, R.A.; Resources, R.A.; Data curation, R.A.-Q.; Writing—original draft, R.A.-Q.; Writing—review & editing, R.A. All authors have read and agreed to the published version of the manuscript.

Funding

The authors extend their appreciation to King Khalid University and the Ministry of Education in the Kingdom of Saudi Arabia for funding this research work through project number RGP2/439/45.

Institutional Review Board Statement

Not applicable.

Informed Consent Statement

Not applicable.

Data Availability Statement

The satellite data used in this study are open to access as follows: Landsat: https://developers.google.com/earth-engine/datasets/catalog/LANDSAT_LC08_C02_T1_L2, accessed on 29 April 2025. Sentinel: https://developers.google.com/earth-engine/datasets/catalog/COPERNICUS_S2_SR_HARMONIZED, accessed on 29 April 2025. DEM: https://developers.google.com/earth-engine/datasets/catalog/COPERNICUS_DEM_GLO30, accessed on 29 April 2025.

Acknowledgments

The authors sincerely thank King Khalid University for their support. The authors also acknowledge the technical support provided by the research center and all individuals who contributed to the successful completion of this study.

Conflicts of Interest

The authors declare that they have no conflicts of interest.

Abbreviation

AMSLAbove Mean Sea Level
DEMDigital Elevation Model
dNBRDifferenced Normalized Burn Ratio
FCCFalse Color Composite
LSTLand Surface Temperature
NDVINormalized Difference Vegetation Index
NDWINormalized Difference Water Index
NBRNormalized Burn Ratio
NIRNear-Infrared
RBRRelativized Burn Ratio
SWIRShortwave Infrared
VIIRSVisible Infrared Imaging Radiometer Suite
WRS-2Worldwide Reference System-2
MSEMean Squared Error
%IncMSEPercentage Increase in Mean Squared Error
Landsat 8 OLI/TIRSLandsat 8 Operational Land Imager/Thermal Infrared Sensor
Sentinel-2 SRSentinel-2 Surface Reflectance
NDVINormalized Difference Vegetation Index
NDWINormalized Difference Water Index
LSTLand Surface Temperature

References

  1. Wu, Z.; Li, M.; Wang, B.; Tian, Y.; Quan, Y.; Liu, J. Analysis of Factors Related to Forest Fires in Different Forest Ecosystems in China. Forests 2022, 13, 1021. [Google Scholar] [CrossRef]
  2. GFW Global Deforestation Rates & Statistics by Country|GFW. Available online: https://www.globalforestwatch.org/dashboards/global/?category=fires (accessed on 17 February 2025).
  3. El-Rawy, M.; Batelaan, O.; Al-Arifi, N.; Alotaibi, A.; Abdalla, F.; Gabr, M.E. Climate Change Impacts on Water Resources in Arid and Semi-Arid Regions: A Case Study in Saudi Arabia. Water 2023, 15, 606. [Google Scholar] [CrossRef]
  4. Bayoumi, S.; Alghamdi, K.; Alqusair, D.; Alfutamani, A. Visualization of Fire Accidents in Saudi Arabia. In Proceedings of the 2018 21st Saudi Computer Society National Computer Conference (NCC), Riyadh, Saudi Arabia, 25–26 April 2018; Volume 90, pp. 1–6. [Google Scholar] [CrossRef]
  5. Brooks, W.H.; Mandil, K.S.D. Vegetation Dynamics in the Aseer Woodlands of South-Western Saudi Arabia. J. Arid. Environ. 1983, 6, 357–362. [Google Scholar] [CrossRef]
  6. Al-Qthanin, R.; Al-Rumman, W.; Radwan, A. Impact of Forest Fires on Wood Anatomy, Soil Composition, and Soil Microorganisms of Acacia Origena Asfaw (Leguminosae) in al Souda Mountain, Southwestern Saudi Arabia. Egypt. J. Agron. 2024, 46, 29–37. [Google Scholar] [CrossRef]
  7. Pausas, J.G.; Keeley, J.E. Wildfires as an ecosystem service. Front. Ecol. Environ. 2019, 17, 289–295. [Google Scholar] [CrossRef]
  8. Johnstone, J.F.; Allen, C.D.; Franklin, J.F.; Frelich, L.E.; Harvey, B.J.; Higuera, P.E.; Mack, M.C.; Meentemeyer, R.K.; Metz, M.R.; Perry, G.L.W.; et al. Changing disturbance regimes, ecological memory, and forest resilience. Front. Ecol. Environ. 2016, 14, 369–378. [Google Scholar] [CrossRef]
  9. Meng, R.; Dennison, P.E.; D’Antonio, C.M.; Moritz, M.A. Remote sensing analysis of vegetation recovery following short-interval fires in southern California shrublands. PLoS ONE 2014, 9, e110637. [Google Scholar] [CrossRef] [PubMed]
  10. Key, C.H.; Benson, N.C. Landscape assessment: Remote sensing of severity, the Normalized Burn Ratio. In FIREMON: Fire Effects Monitoring and Inventory System; USDA Forest Service: Fort Collins, CO, USA, 2006. [Google Scholar] [CrossRef]
  11. Parks, S.A.; Dillon, G.K.; Miller, C. A new metric for quantifying burn severity: The Relativized Burn Ratio. Remote Sens. 2014, 6, 1827–1844. [Google Scholar] [CrossRef]
  12. GFW `Aseer, Saudi Arabia Deforestation Rates & Statistics|GFW. Available online: https://www.globalforestwatch.org/dashboards/country/SAU/1/?category=fires (accessed on 17 February 2025).
  13. Mohammad, A. Impact of Anthropogenic Activities on Natural Vegetation Cover of Aseer Region, Saudi Arabia. Egypt. J. Environ. Change Egypt. J. Environ. Change 2021, 13, 33–50. [Google Scholar] [CrossRef]
  14. Agbeshie, A.A.; Abugre, S.; Atta-Darkwa, T.; Awuah, R. A Review of the Effects of Forest Fire on Soil Properties. J. For. Res. 2022, 33, 1419–1441. [Google Scholar] [CrossRef]
  15. Villaverde Canosa, I.; Ford, J.; Paavola, J.; Burnasheva, D. Community Risk and Resilience to Wildfires: Rethinking the Complex Human–Climate–Fire Relationship in High-Latitude Regions. Sustainability 2024, 16, 957. [Google Scholar] [CrossRef]
  16. Kala, C.P. Environmental and Socioeconomic Impacts of Forest Fires: A Call for Multilateral Cooperation and Management Interventions. Nat. Hazards Res. 2023, 3, 286–294. [Google Scholar] [CrossRef]
  17. Helmi, A.M.; Farouk, M.I.; Hassan, R.; Mumtaz, M.A.; Chaouachi, L.; Elgamal, M.H. Comparing Remote Sensing and Geostatistical Techniques in Filling Gaps in Rain Gauge Records and Generating Multi-Return Period Isohyetal Maps in Arid Regions—Case Study: Kingdom of Saudi Arabia. Water 2024, 16, 925. [Google Scholar] [CrossRef]
  18. Hasanean, H.; Almazroui, M. Rainfall: Features and Variations over Saudi Arabia, A Review. Climate 2015, 3, 578–626. [Google Scholar] [CrossRef]
  19. USGS. Landsat 8 Operational Land Imager (OLI) and Thermal Infrared Sensor (TIRS). U.S. Geological Survey. Available online: https://www.usgs.gov/landsat-missions/landsat-8 (accessed on 18 December 2024).
  20. European Space Agency (ESA). Sentinel-2 User Handbook. ESA Standard Document. Available online: https://sentinels.copernicus.eu/web/sentinel/user-guides/sentinel-2-msi (accessed on 18 December 2024).
  21. Alcaras, E.; Costantino, D.; Guastaferro, F.; Parente, C.; Pepe, M. Normalized Burn Ratio Plus (NBR+): A New Index for Sentinel-2 Imagery. Remote Sens. 2022, 14, 1727. [Google Scholar] [CrossRef]
  22. Laonamsai, J.; Julphunthong, P.; Saprathet, T.; Kimmany, B.; Ganchanasuragit, T.; Chomcheawchan, P.; Tomun, N. Utilizing NDWI, MNDWI, SAVI, WRI, and AWEI for Estimating Erosion and Deposition in Ping River in Thailand. Hydrology 2023, 10, 70. [Google Scholar] [CrossRef]
  23. Ahmed, M.; Aloshan, M.A.; Mohammed, W.; Mesbah, E.; Alsaleh, N.A.; Elghonaimy, I. Characterizing Land Surface Temperature (LST) through Remote Sensing Data for Small-Scale Urban Development Projects in the Gulf Cooperation Council (GCC). Sustainability 2024, 16, 3873. [Google Scholar] [CrossRef]
  24. Netsianda, A.; Mhangara, P.; Gidey, E. Grassland Biome Fragmentation Analysis Using Sentinal-2 Images and Support Vector Machine Learning Model in South Africa. Discov. Sustain. 2024, 5, 455. [Google Scholar] [CrossRef]
  25. European Space Agency (ESA). Copernicus DEM—Global and Regional Digital Elevation Models. Available online: https://dataspace.copernicus.eu/explore-data/data-collections/copernicus-contributing-missions/collections-description/COP-DEM (accessed on 18 December 2024).
  26. Wu, Q. Geemap: A Python Package for Interactive Mapping with Google Earth Engine. J. Open Source Softw. 2020, 5, 2305. [Google Scholar] [CrossRef]
  27. Delcourt, C.J.F.; Combee, A.; Izbicki, B.; Mack, M.C.; Maximov, T.; Petrov, R.; Rogers, B.M.; Scholten, R.C.; Shestakova, T.A.; van Wees, D.; et al. Evaluating the Differenced Normalized Burn Ratio for Assessing Fire Severity Using Sentinel-2 Imagery in Northeast Siberian Larch Forests. Remote Sens. 2021, 13, 2311. [Google Scholar] [CrossRef]
  28. Szpakowski, D.M.; Jensen, J.L.R.; Chow, T.E.; Butler, D.R. Assessing the Use of Burn Ratios and Red-Edge Spectral Indices for Detecting Fire Effects in the Greater Yellowstone Ecosystem. Forests 2023, 14, 1508. [Google Scholar] [CrossRef]
  29. Pearson, K. Notes on Regression and Inheritance in the Case of Two Parents. Proc. R. Soc. Lond. 1895, 58, 240–242. [Google Scholar]
  30. Breiman, L. Random Forests. Mach. Learn. 2001, 45, 5–32. [Google Scholar] [CrossRef]
  31. Pettorelli, N.; Vik, J.O.; Mysterud, A.; Gaillard, J.M.; Tucker, C.J.; Stenseth, N.C. Using the satellite-derived NDVI to assess ecological responses to environmental change. Trends Ecol. Evol. 2005, 20, 503–510. [Google Scholar] [CrossRef] [PubMed]
  32. Bolan, S.; Sharma, S.; Mukherjee, S.; Isaza, D.F.G.; Rodgers, E.M.; Zhou, P.; Hou, D.; Scordo, F.; Chandra, S.; Siddique, K.H.M.; et al. Wildfires under Changing Climate, and Their Environmental and Health Impacts. J. Soils Sediments 2025, 8, 1–25. [Google Scholar] [CrossRef]
  33. Lee, K.; van Leeuwen, W.J.D.; Gillan, J.K.; Falk, D.A. Examining the Impacts of Pre-Fire Forest Conditions on Burn Severity Using Multiple Remote Sensing Platforms. Remote Sens. 2024, 16, 1803. [Google Scholar] [CrossRef]
  34. Morante-Carballo, F.; Bravo-Montero, L.; Carrión-Mero, P.; Velastegui-Montoya, A.; Berrezueta, E. Forest Fire Assessment Using Remote Sensing to Support the Development of an Action Plan Proposal in Ecuador. Remote Sens. 2022, 14, 1783. [Google Scholar] [CrossRef]
  35. Shan, Y.; Chen, X.; Yin, S.; Cao, L.; Tang, S.; Yu, B.; Cui, C. Study on the Limit of Moisture Content of the Sub-Surface Fires Converted to the Surface Fires in the Boreal Forests of China. Fire 2023, 6, 364. [Google Scholar] [CrossRef]
  36. Kong, J.; Ding, Z.; Cai, W.; Zu, J.; Liu, B.; Yang, J. Topography and Wildfire Jointly Mediate Postfire Ecosystem Multifunctionality in a Chinese Boreal Forest. Fire 2024, 7, 417. [Google Scholar] [CrossRef]
  37. Kalantar, B.; Ueda, N.; Idrees, M.O.; Janizadeh, S.; Ahmadi, K.; Shabani, F. Forest Fire Susceptibility Prediction Based on Machine Learning Models with Resampling Algorithms on Remote Sensing Data. Remote Sens. 2020, 12, 3682. [Google Scholar] [CrossRef]
  38. Jodhani, K.H.; Patel, H.; Soni, U.; Patel, R.; Valodara, B.; Gupta, N.; Patel, A.; Omar, P.J. Assessment of Forest Fire Severity and Land Surface Temperature Using Google Earth Engine: A Case Study of Gujarat State, India. Fire Ecol. 2024, 20, 23. [Google Scholar] [CrossRef]
  39. Pompa-García, M.; Martínez-Rivas, J.A.; Valdez-Cepeda, R.D.; Aguirre-Salado, C.A.; Rodríguez-Trejo, D.A.; Miranda-Aragón, L.; Rodríguez-Flores, F.d.J.; Vega-Nieva, D.J. NDVI Values Suggest Immediate Responses to Fire in an Uneven-Aged Mixed Forest Stand. Forests 2022, 13, 1901. [Google Scholar] [CrossRef]
  40. Maxwald, M.; Immitzer, M.; Rauch, H.P.; Preti, F. Analyzing Fire Severity and Post-Fire Vegetation Recovery in the Temperate Andes Using Earth Observation Data. Fire 2022, 5, 211. [Google Scholar] [CrossRef]
  41. Meneses, B.M. Vegetation Recovery Patterns in Burned Areas Assessed with Landsat 8 OLI Imagery and Environmental Biophysical Data. Fire 2021, 4, 76. [Google Scholar] [CrossRef]
  42. Hao, B.; Xu, X.; Wu, F.; Tan, L. Long-Term Effects of Fire Severity and Climatic Factors on Post-Forest-Fire Vegetation Recovery. Forests 2022, 13, 883. [Google Scholar] [CrossRef]
Figure 1. Spatial representation of fire severity indicators. Subfigure (a) shows the NBR prior to the fire (20 September 2020 to 19 October 2020), indicating healthy vegetation, while (b) presents the NBR post-fire (20 October 2020 to 20 November 2020), highlighting areas with reduced vegetation cover. Subfigure (c) displays the dNBR, capturing changes in reflectance due to fire impact. Subfigure (d) shows the RBR.
Fire 08 00172 g001
Figure 2. Climograph at the Ghalahmah Mountains, showing the monthly average temperature (°C) and precipitation (mm) from 2014 to 2024. The red line with markers represents temperature trends, while the blue bars indicate precipitation levels. The graph highlights the seasonal variations, with peak temperatures occurring in July–August and the highest precipitation recorded in August.
Fire 08 00172 g002
Figure 3. The heatmap visualizes the temporal distribution of high-confidence forest fire alerts recorded across different weeks of each year. Darker shades indicate a higher number of fire alerts, highlighting seasonal fire activity. Data source: VIIRS, Global Forest Watch.
Fire 08 00172 g003
Figure 4. Location and false color composites (FCC) (Copernicus/S2_SR_Harmonized) of the fire event in the Ghalahmah Mountains, Aseer region, Saudi Arabia. (a) FCC showing pre-fire conditions in September 2020; (b) FCC illustrating post-fire conditions from 20 October to 20 November 2020; (c) FCC showing vegetation recovery post-fire from 20 October to 20 November 2024; (d) Map of Saudi Arabia highlighting the study area in the Aseer region, where the fire event occurred.
Fire 08 00172 g004
Figure 5. Workflow diagram illustrating the methodology for forest fire analysis in the Ghalahmah Mountains. (1) Estimation of the spatial extent and severity of forest fires. (2) Evaluation of the relationship between forest fire severity (RBR) and pre-fire environmental factors, including vegetation indices (NDVI, NDWI), land surface temperature (LST), and topographical attributes (elevation, slope, and aspect). (3) Assessment of plant regeneration periods through the analysis of temporal trends in vegetation indices, particularly NDVI, following fire events.
Fire 08 00172 g005
Figure 6. Feature importance plot from the Random Forest regression model for fire severity, showing the contribution of each predictor variable based on Percentage Increase in Mean Squared Error.
Fire 08 00172 g006
Figure 7. Subfigures (ad) show the spatial distribution of vegetation recovery status for each year. A progressive increase in green areas suggests significant recovery over time, with most regions fully recovering by 2024, except for the areas with woody plants.
Fire 08 00172 g007
Table 1. Overview of datasets employed.
Dataset(s)Time PeriodPurpose
Landsat 8 OLI/TIRS2020–2024NBR [21], NDWI [22], LST [23]
Copernicus/S2_SR_Harmonized2020–2024NDVI [24]
Copernicus/DEM/GLO3020153D Analysis [25]
Data collection, preprocessing, and analysis were conducted via R and the Google Colab—geemap geopandas—because of its ability to perform complex computations efficiently on cloud infrastructure [26].
Table 2. Threshold categories for burn severity based on Relativized Burn Ratio (RBR) values, indicating the level of vegetation and soil damage in the study area.
Severity LevelRBR RangeDescription
UnburnedRBR < 0.1Minimal to no fire impact
Low Severity0.1 ≤ RBR < 0.250Some vegetation damage but minimal soil impact
Moderate Severity0.25 ≤ RBR < 0.50Significant vegetation damage and moderate impact on soil
High SeverityRBR ≥ 0.5Severe vegetation and soil damage, complete canopy burn
Table 3. Feature importance summary from the Random Forest regression model for fire severity (DNBR), showing the contribution of each predictor variable based on Percentage Increase in MSE and Increase in Node Purity.
Variable%IncMSEIncNodePurity
NDVI86.1014.95
Elevation69.194.93
LST46.144.99
NDWI38.569.51
Aspect38.672.57
Slope35.294.17
Table 4. Vegetation recovery in hectares during 2021 to 2024.
Vegetation TypeRecovery Type2021202220232024
High
(NDVI > 0.3)
Still Recovering6.9329.8832.7626.55
Exceeded Pre-fire Condition3.514.5017.7325.29
Further Degradation44.8220.884.773.42
Medium
(NDVI 0.2 to 0.3)
Still Recovering88.92125.9143.227.18
Exceeded Pre-fire Condition2.709.18118.08134.46
Further Degradation73.0829.613.423.06
Low to Nil
(NDVI < 0.2)
Still Recovering91.5389.375.402.43
Exceeded Pre-fire Condition5.049.54101.16103.59
Further Degradation11.258.911.261.80
Disclaimer/Publisher’s Note: The statements, opinions and data contained in all publications are solely those of the individual author(s) and contributor(s) and not of MDPI and/or the editor(s). MDPI and/or the editor(s) disclaim responsibility for any injury to people or property resulting from any ideas, methods, instructions or products referred to in the content.

